Embed Size (px)
Citation preview
15th International Multidimensional Engine Modeling User’s Group Meeting, Detroit, MI, April 2005
A Fully Integrated CFD and Multi-zone Model with Detailed Chemical Kinetics for the Simulation of PCCI Engines
A. Babajimopoulos1*, D. N. Assanis1, D. L. Flowers2, S. M. Aceves2 and R. P. Hessel3 1 Department of Mechanical Engineering, University of Michigan, Ann Arbor, MI 48105 2 Lawrence Livermore National Laboratory, Livermore, CA 94551 3 Engine Research Center, University of Wisconsin, Madison, WI 53706
Abstract
KIVA-3V has been fully integrated with a multi-zone model with detailed chemical kinetics for the simulation of Premixed Charge Compression Ignition (PCCI) engines. The multi-zone model communicates with KIVA-3V at each computational timestep. The composition of the cells is mapped back and forth between KIVA-3V and the multi-zone model, introducing significant computational time savings. The methodology uses a novel remapping technique that can account for both temperature and composition non-uniformities in the cylinder. Validation cases were developed by solving the detailed chemistry in every cell of a KIVA-3V grid. The new methodology shows very good agreement with the detailed solutions in terms of ignition timing, burn duration, and emissions.
*Corresponding author
Introduction Homogeneous Charge Compression Ignition
(HCCI) has emerged in the last couple of decades as a promising alternative to the well established technolo-gies of Diesel and Spark-Ignited (SI) engines. HCCI has the potential to deliver Diesel-like combustion effi-ciency, accompanied by low NOx and soot emissions, particularly at part-load, where its counterparts suffer significantly [1-2]. However, several technical issues must be resolved before the concept finds an applica-tion in production engines.
The main obstacle to date though is the lack of any direct means of controlling the ignition timing, such as a spark or a late injection event. The control issue has prompted the investigation of various control strategies, including Direct Injection (DI) [3] and Variable Valve Actuation (VVA), the latter as means of retaining large levels of residual gases in the cylinder [4-5]. Both of these strategies can have as a result a mixture with sig-nificant composition and temperature stratification [6]. This partially stratified HCCI can be better described with the generic term Premixed Charge Combustion Ignition (PCCI), which will be the focus of the pre-sented work.
It is widely accepted that HCCI and PCCI are es-sentially controlled by chemical kinetics, with little effect of turbulence [7-8]. During the main heat re-lease, the chemical kinetic processes occur on such short time-scales that turbulence is too slow to influ-ence the process. In theory, accurate analysis of PCCI combustion could be achieved by fully integrating a Computational Fluid Mechanics (CFD) code with a detailed chemical kinetics code, which would solve for
the chemistry in each computational cell. However, a model like that would be computationally very expen-sive and impractical for today’s computers.
The objective of this work is to build on existing work [9-13] and develop a new methodology for the modeling of PCCI combustion in the framework of KIVA-3V [14], which fully takes into account mixing throughout the cycle. The goal is to reduce the compu-tational time required by the solution of detailed chem-istry in each computational cell, while maintaining an acceptable degree of confidence in the predictions of combustion parameters, such as pressure, temperature, and emissions.
Numerical Simulations for Validation
Since the proposed model is presented as a compu-tationally efficient alternative to the solution of detailed chemistry in each computational cell, the authors deemed appropriate to validate the model results against analytical results obtained from a fully inte-grated fluid mechanics-chemical kinetics code, keeping all other CFD submodels exactly the same. While it is ultimately necessary to conduct validation against ex-perimental data, the comparison against the fully inte-grated results provides a good estimate of the accuracy of the multi-zone methodology. Future work will focus on validating the model against experimental data.
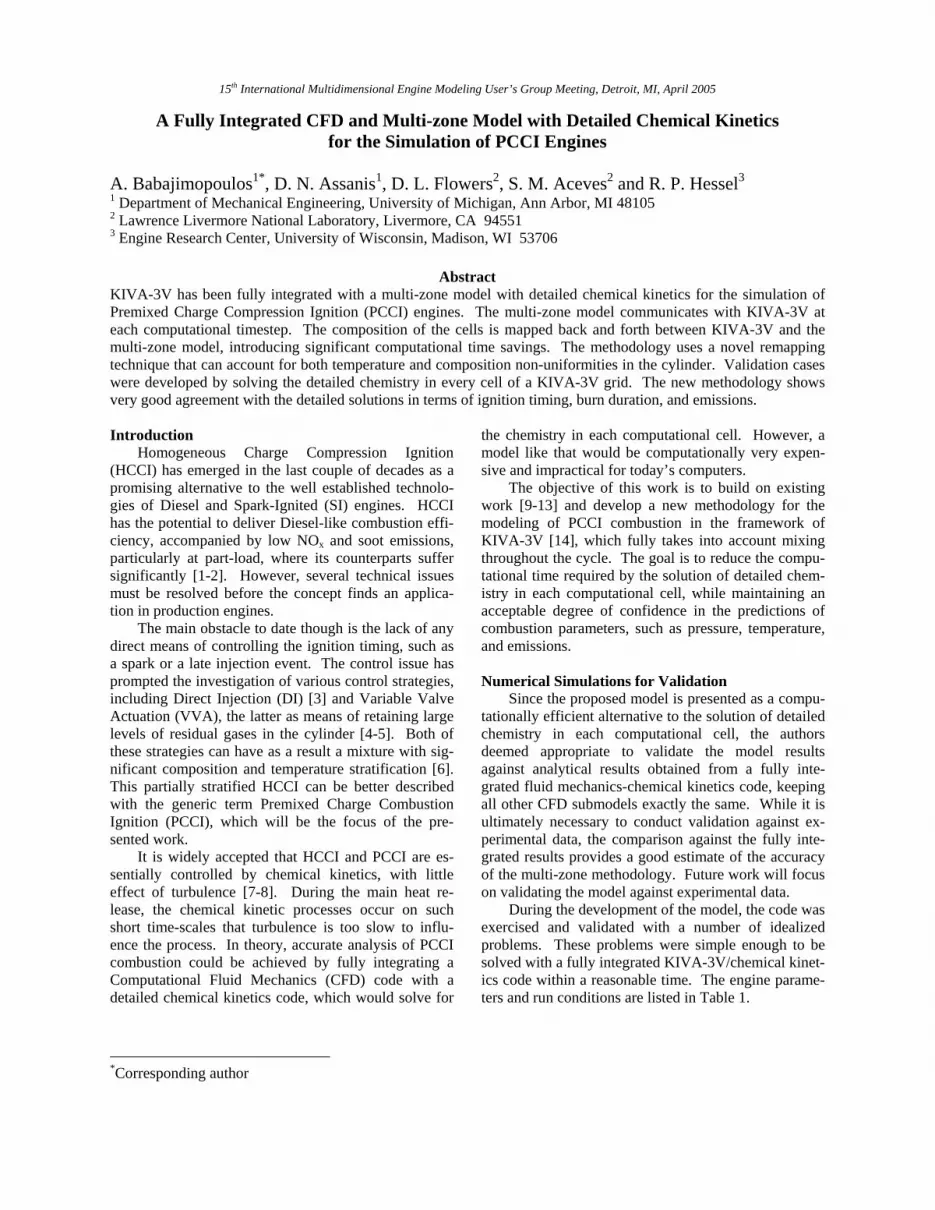
During the development of the model, the code was exercised and validated with a number of idealized problems. These problems were simple enough to be solved with a fully integrated KIVA-3V/chemical kinet-ics code within a reasonable time. The engine parame-ters and run conditions are listed in Table 1.
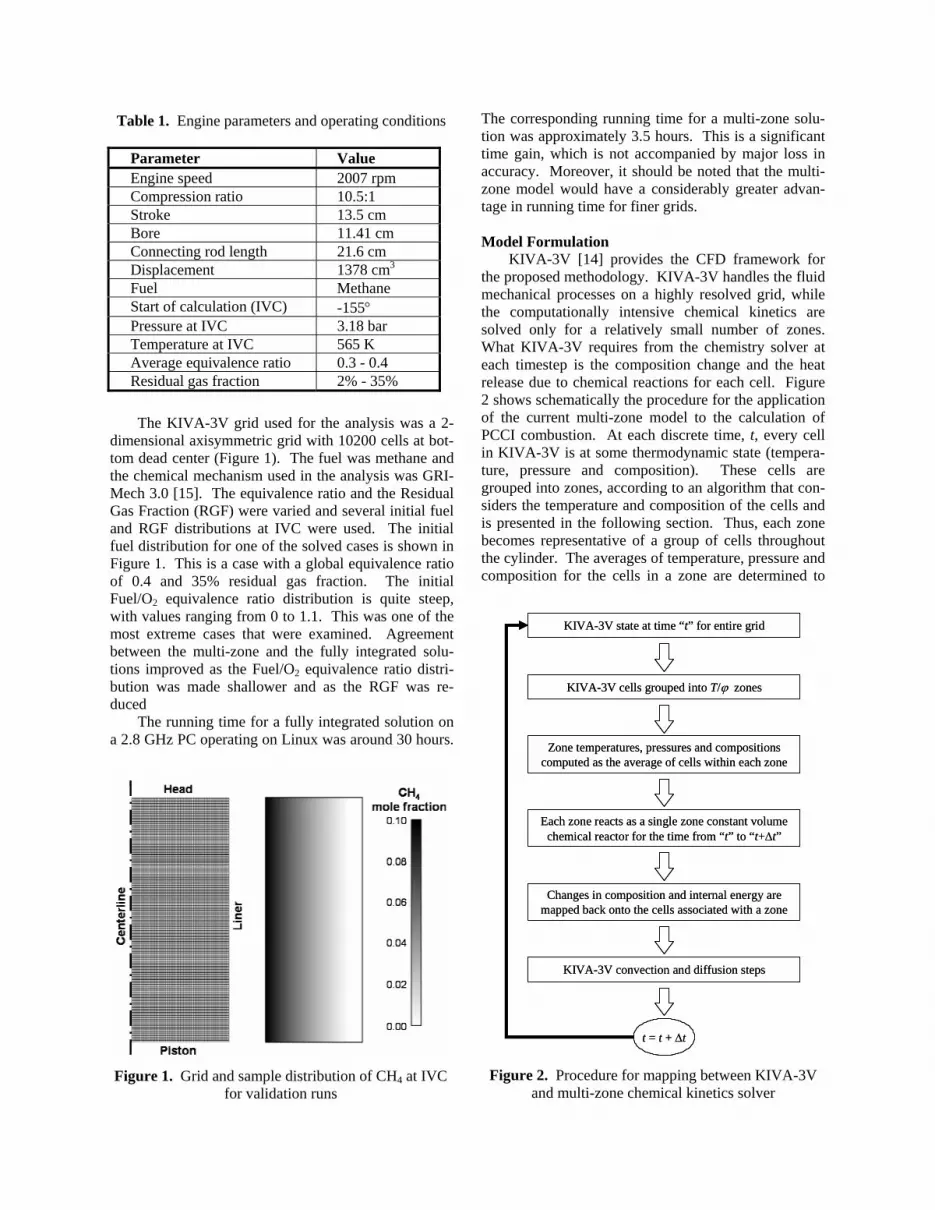
The KIVA-3V grid used for the analysis was a 2-dimensional axisymmetric grid with 10200 cells at bot-tom dead center (Figure 1). The fuel was methane and the chemical mechanism used in the analysis was GRI-Mech 3.0 [15]. The equivalence ratio and the Residual Gas Fraction (RGF) were varied and several initial fuel and RGF distributions at IVC were used. The initial fuel distribution for one of the solved cases is shown in Figure 1. This is a case with a global equivalence ratio of 0.4 and 35% residual gas fraction. The initial Fuel/O2 equivalence ratio distribution is quite steep, with values ranging from 0 to 1.1. This was one of the most extreme cases that were examined. Agreement between the multi-zone and the fully integrated solu-tions improved as the Fuel/O2 equivalence ratio distri-bution was made shallower and as the RGF was re-duced
The running time for a fully integrated solution on a 2.8 GHz PC operating on Linux was around 30 hours.
The corresponding running time for a multi-zone solu-tion was approximately 3.5 hours. This is a significant time gain, which is not accompanied by major loss in accuracy. Moreover, it should be noted that the multi-zone model would have a considerably greater advan-tage in running time for finer grids.
Model Formulation
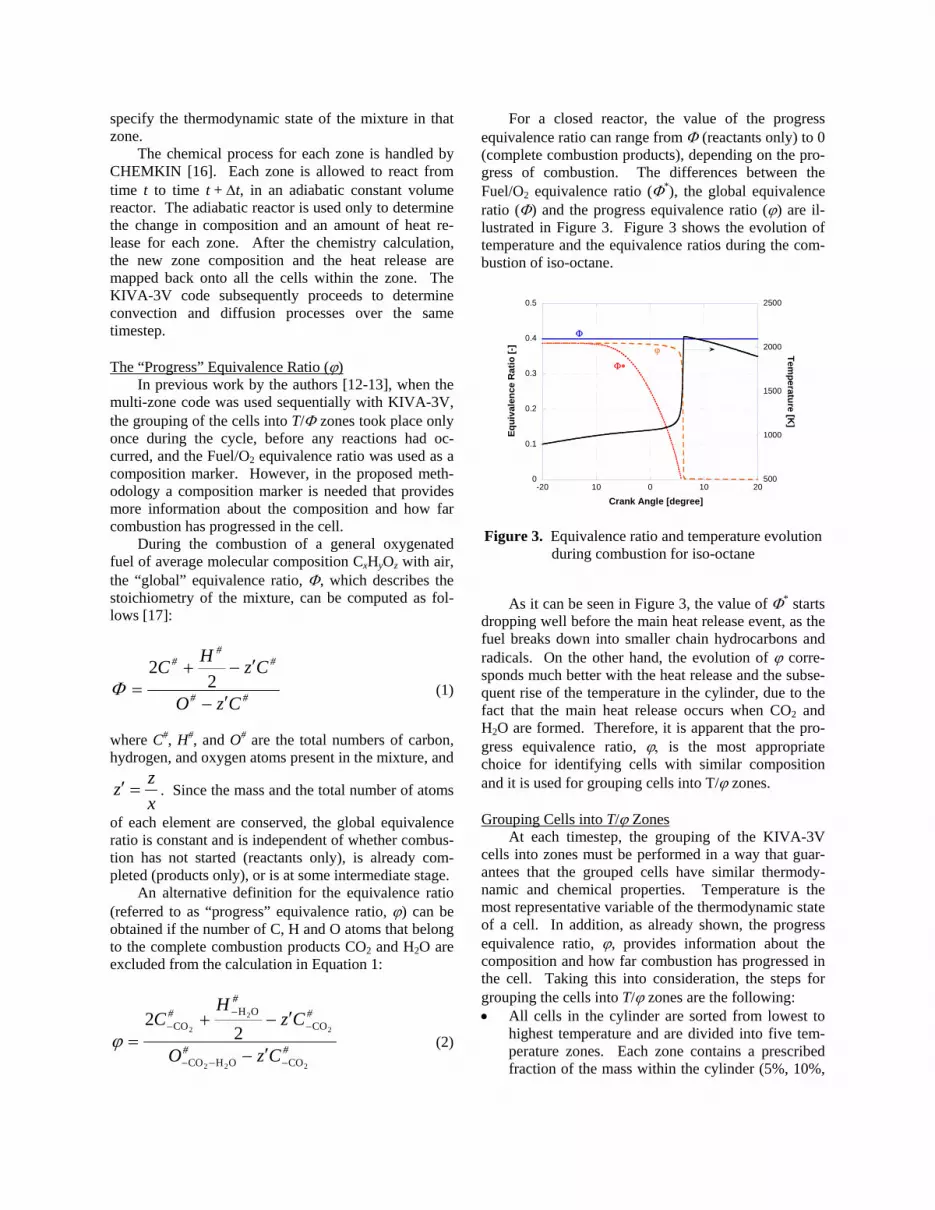
KIVA-3V [14] provides the CFD framework for the proposed methodology. KIVA-3V handles the fluid mechanical processes on a highly resolved grid, while the computationally intensive chemical kinetics are solved only for a relatively small number of zones. What KIVA-3V requires from the chemistry solver at each timestep is the composition change and the heat release due to chemical reactions for each cell. Figure 2 shows schematically the procedure for the application of the current multi-zone model to the calculation of PCCI combustion. At each discrete time, t, every cell in KIVA-3V is at some thermodynamic state (tempera-ture, pressure and composition). These cells are grouped into zones, according to an algorithm that con-siders the temperature and composition of the cells and is presented in the following section. Thus, each zone becomes representative of a group of cells throughout the cylinder. The averages of temperature, pressure and composition for the cells in a zone are determined to
Table 1. Engine parameters and operating conditions
Parameter Value Engine speed 2007 rpm Compression ratio 10.5:1 Stroke 13.5 cm Bore 11.41 cm Connecting rod length 21.6 cm Displacement 1378 cm3 Fuel Methane Start of calculation (IVC) -155° Pressure at IVC 3.18 bar Temperature at IVC 565 K Average equivalence ratio 0.3 - 0.4 Residual gas fraction 2% - 35%
KIVA-3V state at time “t” for entire grid
KIVA-3V cells grouped into T/ϕ zones
Zone temperatures, pressures and compositions computed as the average of cells within each zone
Each zone reacts as a single zone constant volume chemical reactor for the time from “t” to “t+∆t”
Changes in composition and internal energy are mapped back onto the cells associated with a zone
KIVA-3V convection and diffusion steps
t = t + ∆t
Figure 2. Procedure for mapping between KIVA-3V and multi-zone chemical kinetics solver
Figure 1. Grid and sample distribution of CH4 at IVC
for validation runs
specify the thermodynamic state of the mixture in that zone.
The chemical process for each zone is handled by CHEMKIN [16]. Each zone is allowed to react from time t to time t + ∆t, in an adiabatic constant volume reactor. The adiabatic reactor is used only to determine the change in composition and an amount of heat re-lease for each zone. After the chemistry calculation, the new zone composition and the heat release are mapped back onto all the cells within the zone. The KIVA-3V code subsequently proceeds to determine convection and diffusion processes over the same timestep.
The “Progress” Equivalence Ratio (ϕ)
In previous work by the authors [12-13], when the multi-zone code was used sequentially with KIVA-3V, the grouping of the cells into T/Φ zones took place only once during the cycle, before any reactions had oc-curred, and the Fuel/O2 equivalence ratio was used as a composition marker. However, in the proposed meth-odology a composition marker is needed that provides more information about the composition and how far combustion has progressed in the cell.
During the combustion of a general oxygenated fuel of average molecular composition CxHyOz with air, the “global” equivalence ratio, Φ, which describes the stoichiometry of the mixture, can be computed as fol-lows [17]:
##
##
#
CzO
CzHC
′−
′−+= 2
2Φ (1)
where C#, H#, and O# are the total numbers of carbon, hydrogen, and oxygen atoms present in the mixture, and
xzz =′ . Since the mass and the total number of atoms
of each element are conserved, the global equivalence ratio is constant and is independent of whether combus-tion has not started (reactants only), is already com-pleted (products only), or is at some intermediate stage.
An alternative definition for the equivalence ratio (referred to as “progress” equivalence ratio, ϕ) can be obtained if the number of C, H and O atoms that belong to the complete combustion products CO2 and H2O are excluded from the calculation in Equation 1:
##
##
#
CzO
CzH
C
222
2
2
2
COOHCO
COOH
CO 22
−−−
−−
−
′−
′−+=ϕ (2)
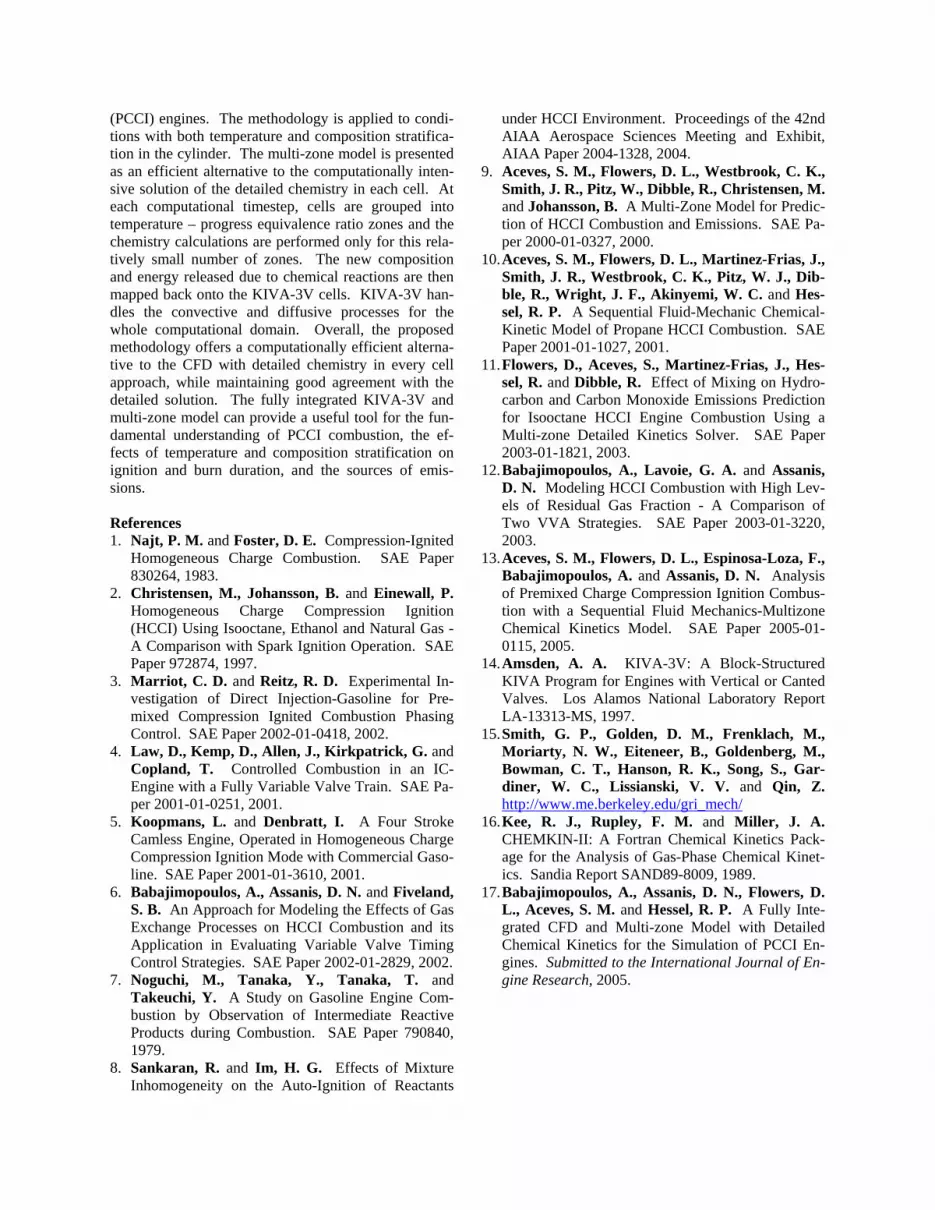
For a closed reactor, the value of the progress equivalence ratio can range from Φ (reactants only) to 0 (complete combustion products), depending on the pro-gress of combustion. The differences between the Fuel/O2 equivalence ratio (Φ*), the global equivalence ratio (Φ) and the progress equivalence ratio (ϕ) are il-lustrated in Figure 3. Figure 3 shows the evolution of temperature and the equivalence ratios during the com-bustion of iso-octane.
As it can be seen in Figure 3, the value of Φ* starts dropping well before the main heat release event, as the fuel breaks down into smaller chain hydrocarbons and radicals. On the other hand, the evolution of ϕ corre-sponds much better with the heat release and the subse-quent rise of the temperature in the cylinder, due to the fact that the main heat release occurs when CO2 and H2O are formed. Therefore, it is apparent that the pro-gress equivalence ratio, ϕ, is the most appropriate choice for identifying cells with similar composition and it is used for grouping cells into T/ϕ zones.
Grouping Cells into T/ϕ Zones
At each timestep, the grouping of the KIVA-3V cells into zones must be performed in a way that guar-antees that the grouped cells have similar thermody-namic and chemical properties. Temperature is the most representative variable of the thermodynamic state of a cell. In addition, as already shown, the progress equivalence ratio, ϕ, provides information about the composition and how far combustion has progressed in the cell. Taking this into consideration, the steps for grouping the cells into T/ϕ zones are the following: • All cells in the cylinder are sorted from lowest to
highest temperature and are divided into five tem-perature zones. Each zone contains a prescribed fraction of the mass within the cylinder (5%, 10%,
0
0.1
0.2
0.3
0.4
0.5
500
1000
1500
2000
2500
-20 10 0 10 20
Equi
vale
nce
Rat
io [-
]
Temperature [K
]
Crank Angle [degree]
Φ
Φ∗
ϕ
Figure 3. Equivalence ratio and temperature evolution
during combustion for iso-octane

20%, 30% and 35%, going from the coldest to the hottest zone).
• The cells in each temperature zone are sorted from lowest to highest ϕ. Starting from the cell with the lowest ϕ, the cells of the temperature zone are di-vided into as many zones as needed, so that the maximum ϕ range in each zone is ∆ϕmax = 0.02. Figure 4 shows an illustrative example of T/ϕ zone generation for the sample case presented in Figure 1. The left side of Figure 4 shows the temperature and the progress equivalence ratio distributions in the cylinder at 20o BTDC, as obtained from KIVA-3V. The right side of Figure 4 shows the cells that belong in the third temperature zone, divided into ϕ zones.
• The last steps are to take any T/ϕ zones which con-tain more than 1% of the cylinder mass, sort the cells in these zones by temperature, and divide them into smaller temperature zones, so that, in the end, the mass fraction in each zone does not exceed 1%. This zone generation process yields a total number
of zones just over 100 (the mass fraction in some zones can actually be less than 1%).
Remapping of the Multi-zone Solution on the KIVA-3V Grid
Once cells are grouped into a zone, and the zone is permitted to react using the average temperature and composition of the cells, it is impossible to know ex-actly what fraction of each species should be mapped back onto each cell. This knowledge can be obtained only by solving the chemistry in each single cell (de-tailed solution). However, it is possible to distribute the species back to the cells, so that the thermodynamic properties of the cell do not change significantly. In order to do that, certain requirements must be met: • The mass of each cell in the zone must be con-
served.
• The mass of each individual species in the zone must be conserved.
• The number of C, H, O and N atoms in each cell must be conserved. The last requirement is the most difficult to
achieve, so instead it is attempted to keep the number of C, H, O and N atoms in each cell as close to the original value (before the chemistry calculation) as possible. The steps of the remapping algorithm are as follows:
A new quantity, ch, is defined based on the number of C and H atoms included in all the species except CO2 and H2O:
22 OH
CO2
2
## H
Cch −− += (3)
This new quantity is similar to the numerator of the
progress equivalence ratio (Equation 2) and is calcu-lated for the zone (chzone) and each individual cell (chcell) before the chemistry calculation. Obviously, the sum of chcell of all individual cells in a particular zone is equal to the zone’s chzone.
After the chemistry calculation, all the species, ex-cept CO2, H2O, O2, and N2, are distributed to the zone’s cells based on ch. The mass of species k in each cell will be:
zone,kzone
cellcell,k m
chchm = (4)
Equation 4 guarantees that the mass of each indi-
vidual species in the zone is conserved. This interpola-tion may actually increase slightly the number of C or H atoms in some cells. If this happens, then the total number of C or H atoms that the remaining cells in the zone are allowed to have is adjusted accordingly, so that the total number of C and H atoms in the zone re-mains constant. However, for the most part there is still a shortage of C and H atoms in each cell. The only remaining species containing C is CO2, which is dis-tributed to the zone’s cells, filling up the missing C atoms (Mk is the molecular mass of species k):
#cell
cell,k
k k
cell,k CM
mc
Mm
=+∑2
2
CO
CO (5)
Similarly to CO2, H2O can be distributed to the
zone cells to maintain the number of H atoms in each cell. Having done this the only species that have not been distributed are O2 and N2. O2 is distributed to maintain the total number of O atoms in each cell. Fi-nally, N2 is used as a “filler”, to bring each cell to its
ϕHigh
Low
TempHigh
Low
Temperature zonedivided into ϕ zones
Shaded part:3rd Temperature zone (15-35%)
Temperature and ϕ distributionat 20o BTDC
Head
PistonHead
Piston
ϕHigh
Low
TempHigh
Low
Temperature zonedivided into ϕ zones
Shaded part:3rd Temperature zone (15-35%)
Temperature and ϕ distributionat 20o BTDC
ϕHigh
Low
ϕHigh
Low
TempHigh
Low
TempHigh
Low
Temperature zonedivided into ϕ zones
Shaded part:3rd Temperature zone (15-35%)
Temperature and ϕ distributionat 20o BTDC
Head
PistonHead
Piston
Figure 4. Schematic of T/ϕ zone generation. The tem-perature and progress equivalence ratio fields are used to divide the cells first into T zones, which are then di-
vided into smaller ϕ zones.

original mass. The change in the specific internal en-ergy of each cell is then calculated accounting for the internal energy of formation of the species present in the cell before and after the chemistry calculation.
Figure 5 compares the solution obtained with the multi-zone model against the detailed solution with full chemistry in each cell for the sample case shown in Figure 1. The agreement between the two solutions for pressure, mean temperature, and maximum temperature is excellent.
Figure 6, compares the evolution of the mass frac-tions of 3 species in the cylinder (CO2, CO, and OH) for the multi-zone model against the detailed solution.
Overall, the multi-zone model does an excellent job in tracking down the evolution of all the species in the cylinder. Any large discrepancy with the detailed solu-tion is during the period of high heat release rate, when temperature and composition change rapidly in each cell. However by the end of combustion, the final pre-dictions of the multi-zone model are very close to the detailed solution.
Conclusions
A multi-zone model with detailed chemical kinet-ics has been fully integrated with KIVA-3V for the simulation of Premixed Charge Compression Ignition
60
65
70
75
80
85
90
-5 0 5 10 15 20 25
Full chemistryin each cell
~100 zonesPr
essu
re [b
ar]
Crank Angle [degree]
1000
1100
1200
1300
1400
1500
1600
1700
1800
-5 0 5 10 15 20 25
Full chemistryin each cell
~100 zones
Mea
n Te
mpe
ratu
re [K
]
Crank Angle [degree]
1000
1200
1400
1600
1800
2000
2200
-5 0 5 10 15 20 25
Full chemistryin each cell
~100 zones
Max
imum
Tem
pera
ture
[K]
Crank Angle [degree] Figure 5. Comparison of simulation results of multi-
zone solution against the detailed solution
0
0.01
0.02
0.03
0.04
0.05
0.06
0.07
-10 0 10 20 30 40 50
Full chemistryin each cell
~100 zones
Mas
s fr
actio
n [-]
Crank Angle [degree]
CO2
0
0.001
0.002
0.003
0.004
0.005
0.006
-10 0 10 20 30 40 50
Full chemistryin each cell
~100 zones
Mas
s fr
actio
n [-]
Crank Angle [degree]
CO
0
2 10-5
4 10-5
6 10-5
8 10-5
1 10-4
1.2 10-4
-10 0 10 20 30 40 50
Full chemistryin each cell
~100 zones
Mas
s fr
actio
n [-]
Crank Angle [degree]
OH
Figure 6. Comparison of the evolution of the mass
fraction of selected species using the multi-zone model against the detailed solution
(PCCI) engines. The methodology is applied to condi-tions with both temperature and composition stratifica-tion in the cylinder. The multi-zone model is presented as an efficient alternative to the computationally inten-sive solution of the detailed chemistry in each cell. At each computational timestep, cells are grouped into temperature – progress equivalence ratio zones and the chemistry calculations are performed only for this rela-tively small number of zones. The new composition and energy released due to chemical reactions are then mapped back onto the KIVA-3V cells. KIVA-3V han-dles the convective and diffusive processes for the whole computational domain. Overall, the proposed methodology offers a computationally efficient alterna-tive to the CFD with detailed chemistry in every cell approach, while maintaining good agreement with the detailed solution. The fully integrated KIVA-3V and multi-zone model can provide a useful tool for the fun-damental understanding of PCCI combustion, the ef-fects of temperature and composition stratification on ignition and burn duration, and the sources of emis-sions.
References 1. Najt, P. M. and Foster, D. E. Compression-Ignited
Homogeneous Charge Combustion. SAE Paper 830264, 1983.
2. Christensen, M., Johansson, B. and Einewall, P. Homogeneous Charge Compression Ignition (HCCI) Using Isooctane, Ethanol and Natural Gas - A Comparison with Spark Ignition Operation. SAE Paper 972874, 1997.
3. Marriot, C. D. and Reitz, R. D. Experimental In-vestigation of Direct Injection-Gasoline for Pre-mixed Compression Ignited Combustion Phasing Control. SAE Paper 2002-01-0418, 2002.
4. Law, D., Kemp, D., Allen, J., Kirkpatrick, G. and Copland, T. Controlled Combustion in an IC-Engine with a Fully Variable Valve Train. SAE Pa-per 2001-01-0251, 2001.
5. Koopmans, L. and Denbratt, I. A Four Stroke Camless Engine, Operated in Homogeneous Charge Compression Ignition Mode with Commercial Gaso-line. SAE Paper 2001-01-3610, 2001.
6. Babajimopoulos, A., Assanis, D. N. and Fiveland, S. B. An Approach for Modeling the Effects of Gas Exchange Processes on HCCI Combustion and its Application in Evaluating Variable Valve Timing Control Strategies. SAE Paper 2002-01-2829, 2002.
7. Noguchi, M., Tanaka, Y., Tanaka, T. and Takeuchi, Y. A Study on Gasoline Engine Com-bustion by Observation of Intermediate Reactive Products during Combustion. SAE Paper 790840, 1979.
8. Sankaran, R. and Im, H. G. Effects of Mixture Inhomogeneity on the Auto-Ignition of Reactants
under HCCI Environment. Proceedings of the 42nd AIAA Aerospace Sciences Meeting and Exhibit, AIAA Paper 2004-1328, 2004.
9. Aceves, S. M., Flowers, D. L., Westbrook, C. K., Smith, J. R., Pitz, W., Dibble, R., Christensen, M. and Johansson, B. A Multi-Zone Model for Predic-tion of HCCI Combustion and Emissions. SAE Pa-per 2000-01-0327, 2000.
10. Aceves, S. M., Flowers, D. L., Martinez-Frias, J., Smith, J. R., Westbrook, C. K., Pitz, W. J., Dib-ble, R., Wright, J. F., Akinyemi, W. C. and Hes-sel, R. P. A Sequential Fluid-Mechanic Chemical-Kinetic Model of Propane HCCI Combustion. SAE Paper 2001-01-1027, 2001.
11. Flowers, D., Aceves, S., Martinez-Frias, J., Hes-sel, R. and Dibble, R. Effect of Mixing on Hydro-carbon and Carbon Monoxide Emissions Prediction for Isooctane HCCI Engine Combustion Using a Multi-zone Detailed Kinetics Solver. SAE Paper 2003-01-1821, 2003.
12. Babajimopoulos, A., Lavoie, G. A. and Assanis, D. N. Modeling HCCI Combustion with High Lev-els of Residual Gas Fraction - A Comparison of Two VVA Strategies. SAE Paper 2003-01-3220, 2003.
13. Aceves, S. M., Flowers, D. L., Espinosa-Loza, F., Babajimopoulos, A. and Assanis, D. N. Analysis of Premixed Charge Compression Ignition Combus-tion with a Sequential Fluid Mechanics-Multizone Chemical Kinetics Model. SAE Paper 2005-01-0115, 2005.
14. Amsden, A. A. KIVA-3V: A Block-Structured KIVA Program for Engines with Vertical or Canted Valves. Los Alamos National Laboratory Report LA-13313-MS, 1997.
15. Smith, G. P., Golden, D. M., Frenklach, M., Moriarty, N. W., Eiteneer, B., Goldenberg, M., Bowman, C. T., Hanson, R. K., Song, S., Gar-diner, W. C., Lissianski, V. V. and Qin, Z. http://www.me.berkeley.edu/gri_mech/
16. Kee, R. J., Rupley, F. M. and Miller, J. A. CHEMKIN-II: A Fortran Chemical Kinetics Pack-age for the Analysis of Gas-Phase Chemical Kinet-ics. Sandia Report SAND89-8009, 1989.
17. Babajimopoulos, A., Assanis, D. N., Flowers, D. L., Aceves, S. M. and Hessel, R. P. A Fully Inte-grated CFD and Multi-zone Model with Detailed Chemical Kinetics for the Simulation of PCCI En-gines. Submitted to the International Journal of En-gine Research, 2005.


