Embed Size (px)
Citation preview
As
Va
b
c
a
ARRA
KEEELVs
1
ibpoiHnciidgtqa
T
0h
Energy and Buildings 74 (2014) 163–172
Contents lists available at ScienceDirect
Energy and Buildings
j ourna l ho me page: www.elsev ier .com/ locate /enbui ld
comparative study on the effect of different strategies for energyaving of air-cooled vapor compression air conditioning systems
ahid Vakiloroayaa,∗, Bijan Samalib, Kambiz Pishghadamc
Center for Built Infrastructure Research, School of Electrical, Mechanical and Mechatronic Systems, University of Technology Sydney, AustraliaCenter for Built Infrastructure Research, School of Civil and Environmental Engineering, University of Technology Sydney, AustraliaDepartment of Sustainable and Net-Zero Energy Building (NZEB) Solutions, Giacomini Inc, Vancouver, BC, Canada
r t i c l e i n f o
rticle history:eceived 17 May 2013eceived in revised form 27 January 2014ccepted 30 January 2014
eywords:nergy savingxperimental studyvaporative-cooled condenser
a b s t r a c t
This paper investigates and compares the energy saving potential of air-cooled vapor compression airconditioning systems by using liquid pressure amplification (LPA), evaporative-cooled condenser (ECC)and combined LPA and ECC strategies. The applicability, limitation and energy performance of thesestrategies are discussed. For the purpose of this study, an existing direct expansion rooftop package of acommercial building is used for experimentation and data collection. The system under investigation isextensively equipped with a number of instrumentation devices for data logging. Theoretical–empiricalmathematical models for system components were developed first, while a numerical algorithm togetherwith monitored data and a mathematical model implemented on a transient system simulation tool is
iquid pressure amplificationapor compression air conditioningystems
used to predict the performance of each strategy under transient loads. The integrated simulation tool wasvalidated by comparing predicted and measured power consumption of the rooftop package. Comparingbetween LPA and ECC methods shows that for the ambient temperatures less than 27 ◦C the LPA is moreeffective method while for ambient temperature greater than 27 ◦C the ECC system is more efficient. Ourresults also demonstrate average energy savings of 25.3%, 18.3% and 44.2%, respectively for LPA, ECC andcombined LPA and ECC methods.
. Introduction
Heating, ventilation and air conditioning (HVAC) systems typ-cally account for around 40% of total electricity consumption ofuildings [1]. In addition, energy use in the built environment isredicted to increase by 34% in the next 20 years, or an averagef 1.5% per year [2]. HVAC also dominates peak building electric-ty demand and therefore energy-efficient methods can reduceVAC peak energy demands, which currently cost power compa-ies millions of dollars a year in infrastructure investments. Theost of these investments is one of the underlying causes of increas-ng electricity prices. In recent years, hotter weather has resultedn peak energy demand growing much faster than base poweremand. This routinely overwhelms the capacity of the electricalrid. As a result, finding novel ways to reduce energy consump-ion in buildings without compromising comfort and indoor air
uality is an ongoing research challenge. This study demonstratesrange in which novel configurations of existing HVAC system
∗ Corresponding author at: PO Box 123, Broadway, Sydney, NSW 2007, Australia.el.: +61 2 9514 9043; fax: +61 2 9514 2868.
E-mail address: [email protected] (V. Vakiloroaya).
378-7788/$ – see front matter © 2014 Elsevier B.V. All rights reserved.ttp://dx.doi.org/10.1016/j.enbuild.2014.01.042
© 2014 Elsevier B.V. All rights reserved.
components are used to improve the energy consumption rates ofair conditioning systems [3–6].
Many studies report that reduced compressor dischargepressures and the corresponding reduction of compression ratiosin a refrigeration cycle are advantageous when it comes to reduc-ing HVAC energy consumption and increasing system life. Thereare however some solutions which will allow compressor dis-charge pressures to be significantly lowered whilst preventingthe occurrence of flash vapor. Comparing the influence of differ-ent methods on compressor discharge pressure shows that usingevaporative-cooled condenser (ECC) and floating system condens-ing temperature using liquid pressure amplification (LPA) pumpare the most effective methods. In the evaporative-cooled air con-denser system, the ambient air entering the condenser cools whenit passes the wet media installed at the upstream of the condensercoil. A controlled water flow is dripped across the media, loweringthe condensing temperature and thereby reducing the dischargepressure and subsequent energy consumption of the compres-sor. The application of LPA to air-cooled air conditioning systemscan assist in achieving a considerable reduction in compressor
discharge pressure. LPA is achieved by a hermetically sealed, mag-netically driven liquid refrigerant pump which is installed in theliquid line between the condenser and expansion valve [7]. TheLPA pump increases the pressure of the liquid refrigerant before
164 V. Vakiloroaya et al. / Energy and B
Nomenclature
COP coefficient of performanceCp heat capacity (kJ/kg ◦C)h enthalpy (kJ/kg)k polytropic index of the refrigerant vaporm mass flow rate (kg/s)P power consumption (kW)pdis discharge pressure (kPa)psuc suction pressure (kPa)T temperature (◦C)Qb building cooling load (kW)VD displacement volume of the compressor (m3/s)ϑsuc specific volume of the refrigerant at the compressor
inlet (m3/kg)Win electrical power consumption of the compressor
(kW)�comp total efficiency of the compressor�v volumetric efficiency of the compressor
Subscriptsa airamb ambientcomp compressorcon condensercond condensingdis dischargeeva evaporatori inletr refrigerantsat saturatedsh superheatedsuc suction
iirs
cisvwlpwcwhtc1oafahat[ma
sup supply
t enters the expansion valve. This method allows the condens-ng temperature to fluctuate with ambient temperature changes,educing the condensing pressure and lowering overall energy con-umption.
The compressor is the largest power consumer in a vaporompression system. As a result, many previous studies havenvestigated the influence of various technologies on the compres-or performance to enhance the operating and energy efficiency ofapor compression refrigeration systems [8]. However, comparedith water-cooled air conditioning system, air-cooled cycles are
ess energy efficient [9]. Wang et al. [10] studied the impact of twoerformance improvement techniques applied to a compressorith different refrigerants. The first option involved cooling the
ompressor motor via external means and the second optionas to make the compression process isothermal by transferringeat from the compressor chamber. Their results showed thathese approaches could reduce the power consumption of theompressor by up to 16% for the external cooling method and4% for the isothermal compression. In another study the effectf suction gas bypass on the scroll compressor modulating ofn air-conditioner was investigated by Wang et al. [11]. Theyound that this method can reduce the cooling capacity of their-conditioner by up to 39% in cooling mode. Some researchersave also showed that floating the condensing temperature closelybove the ambient dry-bulb temperature can maximize the COP of
he air-cooled air conditioning systems. Sarntichartsak and Thepa12] showed that the better improvement on the system perfor-ance of R410A inverter air-conditioner can be performed usingn evaporative-cooled condenser. By using this method, the COP of
uildings 74 (2014) 163–172
their tested system was increased by 18.32%. A comparative studybetween heat recovery and floating condensing temperature wascarried out by Arias and Lundqvist [13] to evaluate the potentialof their energy savings. Their simulation results indicated thatthe highest potential of energy saving can be obtained via thecombination of both approaches. Furthermore, they showed thatat 40 ◦C condensing temperature, the energy consumption of thesystem with floating condensing temperature is about 50% of aconventional refrigeration system.
The objective of this paper is to address and compare thereduction of the energy consumption of a DX air-cooled rooftoppackage by using the evaporative-cooled air condenser method,liquid pressure amplifier method and integration of both meth-ods. For this purpose, an actual air-cooled rooftop package airconditioning system of a real-world commercial building locatedin a hot and dry climate zone was used for experimentation anddata collection. Field tests were conducted to quantify and deter-mine the variables of the system. System models were obtainedby using a theoretical–empirical approach, from which the pro-posed strategies were formulated. In order to take into account thenonlinear, time varying and building-dependent dynamics of theHVAC system, a transient simulation software package, TRNSYS16 [14] was used to predict the HVAC energy usage. The coolingplant was tested continuously to obtain the operation parametersof system components under different conditions. On the basisof the TRNSYS codes and using the real test data, a simulationmodule for the cooling plant was developed and embedded inthe software. In this model, a commercial building was equippedwith the rooftop package allowing dynamic simulation of all mainequipment in the whole system to be performed simultaneously.Performance predictions were then compared with actual per-formance measurements to verify the mathematical model andcompare the performance of the three strategies. Findings detailedin this paper show energy savings of 39%, 28% and 56% are possi-ble as a result of using LPA, ECC and the LPA/ECC combined model,respectively.
2. System modeling
A single-stage vapor compression DX air-cooled air conditioningsystem consists of four major components: a compressor, an air-cooled condenser, an expansion valve and a DX evaporator. Fig. 1shows a schematic block diagram of the conventional DX air con-ditioning system while its pressure–enthalpy diagram is shown inFig. 2. In the conventional system the cycle starts with a mixtureof liquid and vapor refrigerant entering the evaporator (point (1)).The DX evaporator in the plant is of the rectangular finned tubetype of heat exchanger in which the refrigerant and air are assumedto be counter-flow. The heat from warm air is absorbed using theevaporator DX coil. During this process, the state of the refriger-ant is changed from a liquid to a gas and becomes superheated atthe evaporator exit. Superheat is required to prevent slugs of liquidrefrigerant from reaching the compressor and causing any seriousdamage. The supply air temperature can be estimated by:
Tsup = Teva,a,i − mr
meva,aCp,a(h2 − h1), (1)
where h2 is the enthalpy of the refrigerant leaving the DX evapora-tor and are determined as:
h2 = heva,r,sat + Cp,r(Teva,r,sh − Teva,r,sat), (2)
where Teva,r,sh is the temperature of superheated vapor refrigerant
leaving the evaporator which was measured during the experi-mentation, heva,r,sat and Teva,r,sat are respectively the enthalpy andtemperature of saturated refrigerant vapor at the evaporating pres-sure and can be calculated using the refrigerant thermodynamic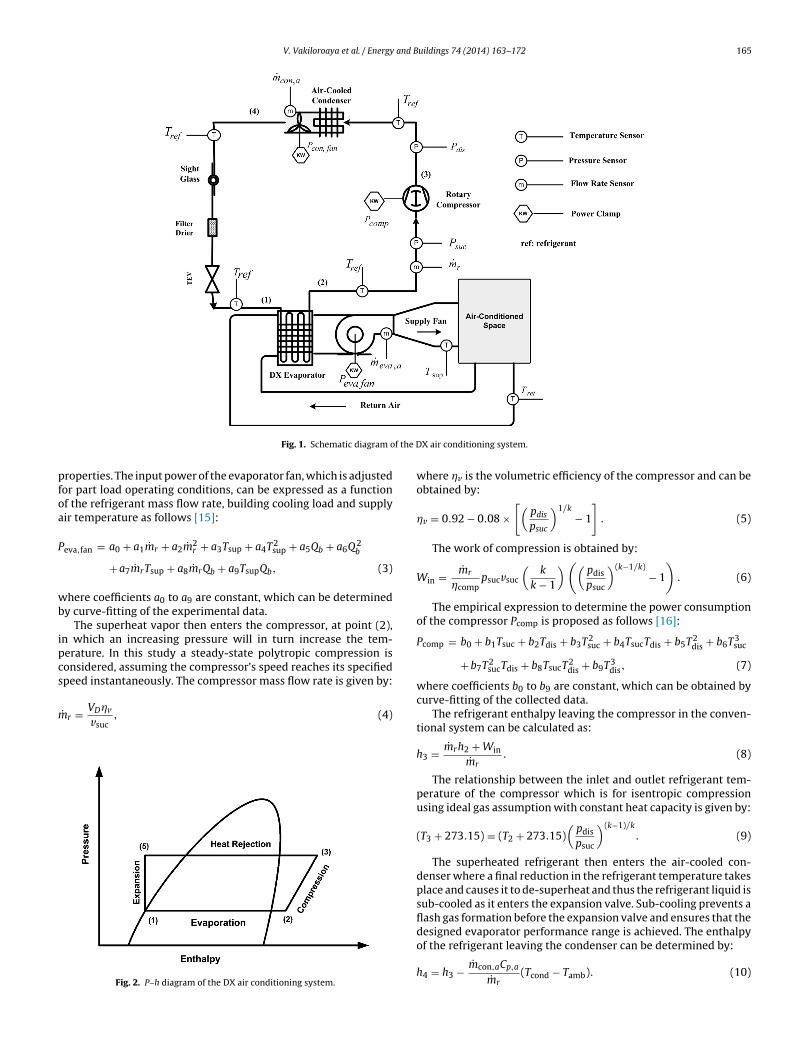
V. Vakiloroaya et al. / Energy and Buildings 74 (2014) 163–172 165
f the D
pfoa
P
wb
ipcs
m
Fig. 1. Schematic diagram o
roperties. The input power of the evaporator fan, which is adjustedor part load operating conditions, can be expressed as a functionf the refrigerant mass flow rate, building cooling load and supplyir temperature as follows [15]:
eva,fan = a0 + a1mr + a2m2r + a3Tsup + a4T2
sup + a5Qb + a6Q 2b
+ a7mrTsup + a8mrQb + a9TsupQb, (3)
here coefficients a0 to a9 are constant, which can be determinedy curve-fitting of the experimental data.
The superheat vapor then enters the compressor, at point (2),n which an increasing pressure will in turn increase the tem-erature. In this study a steady-state polytropic compression isonsidered, assuming the compressor’s speed reaches its specifiedpeed instantaneously. The compressor mass flow rate is given by:
˙ r = VD�v
vsuc, (4)
Fig. 2. P–h diagram of the DX air conditioning system.
X air conditioning system.
where �v is the volumetric efficiency of the compressor and can beobtained by:
�v = 0.92 − 0.08 ×[(
pdis
psuc
)1/k
− 1
]. (5)
The work of compression is obtained by:
Win = mr
�comppsucvsuc
(k
k − 1
)((pdis
psuc
)(k−1/k)− 1
). (6)
The empirical expression to determine the power consumptionof the compressor Pcomp is proposed as follows [16]:
Pcomp = b0 + b1Tsuc + b2Tdis + b3T2suc + b4TsucTdis + b5T2
dis + b6T3suc
+ b7T2sucTdis + b8TsucT2
dis + b9T3dis, (7)
where coefficients b0 to b9 are constant, which can be obtained bycurve-fitting of the collected data.
The refrigerant enthalpy leaving the compressor in the conven-tional system can be calculated as:
h3 = mrh2 + Win
mr. (8)
The relationship between the inlet and outlet refrigerant tem-perature of the compressor which is for isentropic compressionusing ideal gas assumption with constant heat capacity is given by:
(T3 + 273.15) = (T2 + 273.15)(
pdis
psuc
)(k−1)/k
. (9)
The superheated refrigerant then enters the air-cooled con-denser where a final reduction in the refrigerant temperature takesplace and causes it to de-superheat and thus the refrigerant liquid issub-cooled as it enters the expansion valve. Sub-cooling prevents aflash gas formation before the expansion valve and ensures that the
designed evaporator performance range is achieved. The enthalpyof the refrigerant leaving the condenser can be determined by:h4 = h3 − mcon,aCp,a
mr(Tcond − Tamb). (10)
166 V. Vakiloroaya et al. / Energy and Buildings 74 (2014) 163–172
DX ai
ft
P
wb
eTtte
e
h
C
3
pg
3
cihaeeca5pcpatd
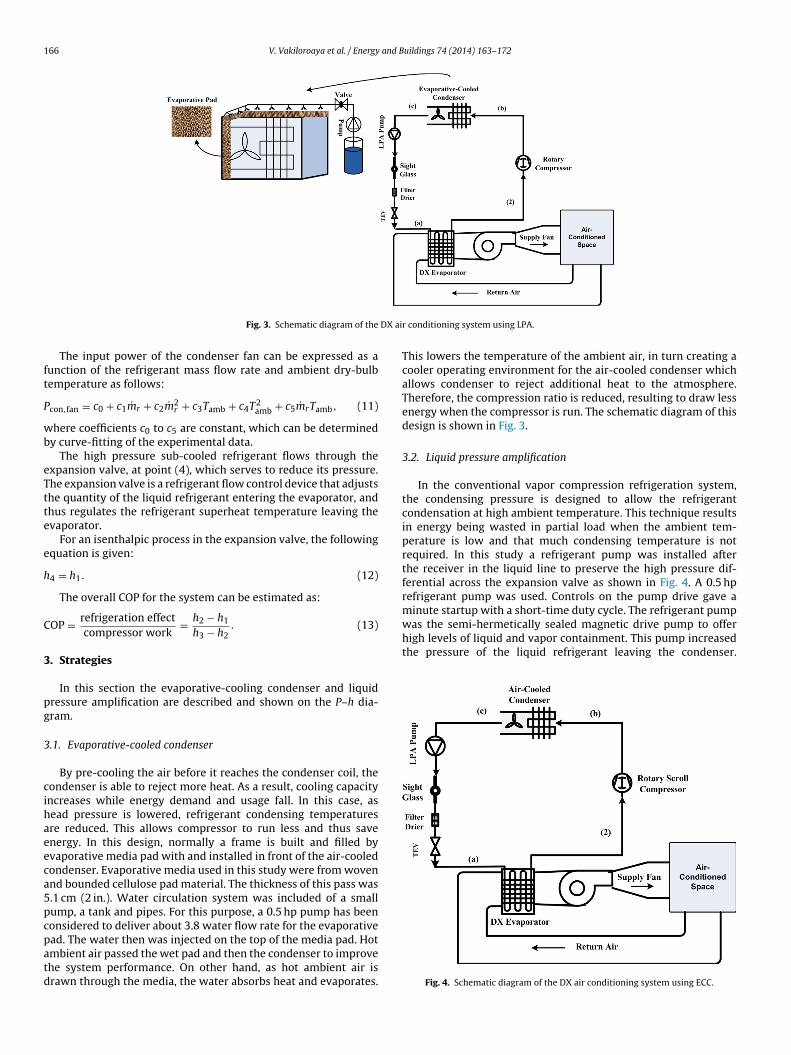
minute startup with a short-time duty cycle. The refrigerant pumpwas the semi-hermetically sealed magnetic drive pump to offerhigh levels of liquid and vapor containment. This pump increasedthe pressure of the liquid refrigerant leaving the condenser.
Fig. 3. Schematic diagram of the
The input power of the condenser fan can be expressed as aunction of the refrigerant mass flow rate and ambient dry-bulbemperature as follows:
con,fan = c0 + c1mr + c2m2r + c3Tamb + c4T2
amb + c5mrTamb, (11)
here coefficients c0 to c5 are constant, which can be determinedy curve-fitting of the experimental data.
The high pressure sub-cooled refrigerant flows through thexpansion valve, at point (4), which serves to reduce its pressure.he expansion valve is a refrigerant flow control device that adjustshe quantity of the liquid refrigerant entering the evaporator, andhus regulates the refrigerant superheat temperature leaving thevaporator.
For an isenthalpic process in the expansion valve, the followingquation is given:
4 = h1. (12)
The overall COP for the system can be estimated as:
OP = refrigeration effectcompressor work
= h2 − h1
h3 − h2. (13)
. Strategies
In this section the evaporative-cooling condenser and liquidressure amplification are described and shown on the P–h dia-ram.
.1. Evaporative-cooled condenser
By pre-cooling the air before it reaches the condenser coil, theondenser is able to reject more heat. As a result, cooling capacityncreases while energy demand and usage fall. In this case, asead pressure is lowered, refrigerant condensing temperaturesre reduced. This allows compressor to run less and thus savenergy. In this design, normally a frame is built and filled byvaporative media pad with and installed in front of the air-cooledondenser. Evaporative media used in this study were from wovennd bounded cellulose pad material. The thickness of this pass was.1 cm (2 in.). Water circulation system was included of a smallump, a tank and pipes. For this purpose, a 0.5 hp pump has beenonsidered to deliver about 3.8 water flow rate for the evaporative
ad. The water then was injected on the top of the media pad. Hotmbient air passed the wet pad and then the condenser to improvehe system performance. On other hand, as hot ambient air israwn through the media, the water absorbs heat and evaporates.r conditioning system using LPA.
This lowers the temperature of the ambient air, in turn creating acooler operating environment for the air-cooled condenser whichallows condenser to reject additional heat to the atmosphere.Therefore, the compression ratio is reduced, resulting to draw lessenergy when the compressor is run. The schematic diagram of thisdesign is shown in Fig. 3.
3.2. Liquid pressure amplification
In the conventional vapor compression refrigeration system,the condensing pressure is designed to allow the refrigerantcondensation at high ambient temperature. This technique resultsin energy being wasted in partial load when the ambient tem-perature is low and that much condensing temperature is notrequired. In this study a refrigerant pump was installed afterthe receiver in the liquid line to preserve the high pressure dif-ferential across the expansion valve as shown in Fig. 4. A 0.5 hprefrigerant pump was used. Controls on the pump drive gave a
Fig. 4. Schematic diagram of the DX air conditioning system using ECC.
V. Vakiloroaya et al. / Energy and B
Fs
Todspolft
3
Lhstcteli
4
pTaTwths03oaatgne
High precision sensors/transducers were used to measure alloperating variables. The temperature sensor for the supply andreturn air was of platinum resistance type with accuracy of ±0.1 ◦C.
Table 1The main parameters used for simulation.
DX rooftop package air conditioning system
Designed refrigerant mass flow rate 0.34 kg/sDisplacement volume of the compressor 0.014 m3/sVolumetric efficiency of the compressor 0.91Polytropic index of R22 1.1Total efficiency of the compressor 0.8Design suction pressure (kPa) 573Design discharge pressure (kPa) 1943Evaporator tube material CopperEvaporator fin material AluminumEvaporator outer diameter of tubes (mm) 16Evaporator wall thickness of tubes (mm) 0.5Evaporator number of rows 4Evaporator number of fins 445Evaporator face area (m2) 0.9Evaporator longitudinal space of tubes (cm) 3.17Evaporator transverse space of tubes (cm) 3.8Condenser tube material CopperCondenser fin material AluminumCondenser outer diameter of tubes (mm) 12.7Condenser wall thickness of tubes (mm) 0.5Condenser number of rows 3
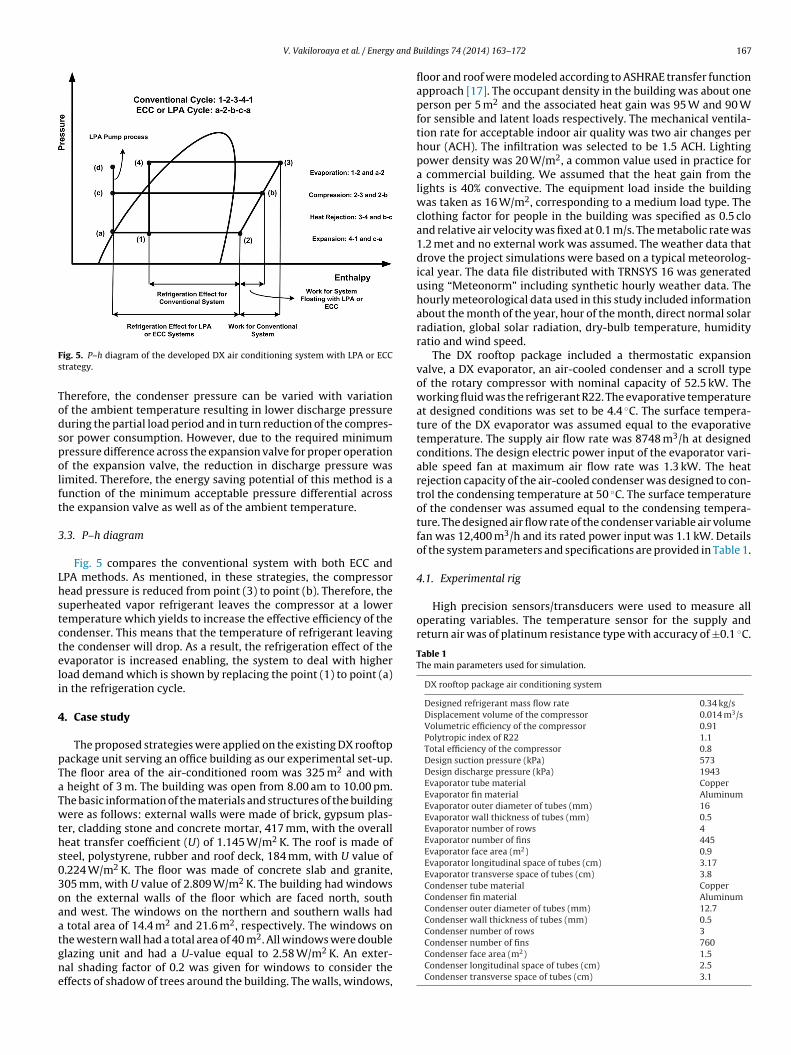
ig. 5. P–h diagram of the developed DX air conditioning system with LPA or ECCtrategy.
herefore, the condenser pressure can be varied with variationf the ambient temperature resulting in lower discharge pressureuring the partial load period and in turn reduction of the compres-or power consumption. However, due to the required minimumressure difference across the expansion valve for proper operationf the expansion valve, the reduction in discharge pressure wasimited. Therefore, the energy saving potential of this method is aunction of the minimum acceptable pressure differential acrosshe expansion valve as well as of the ambient temperature.
.3. P–h diagram
Fig. 5 compares the conventional system with both ECC andPA methods. As mentioned, in these strategies, the compressoread pressure is reduced from point (3) to point (b). Therefore, theuperheated vapor refrigerant leaves the compressor at a loweremperature which yields to increase the effective efficiency of theondenser. This means that the temperature of refrigerant leavinghe condenser will drop. As a result, the refrigeration effect of thevaporator is increased enabling, the system to deal with higheroad demand which is shown by replacing the point (1) to point (a)n the refrigeration cycle.
. Case study
The proposed strategies were applied on the existing DX rooftopackage unit serving an office building as our experimental set-up.he floor area of the air-conditioned room was 325 m2 and with
height of 3 m. The building was open from 8.00 am to 10.00 pm.he basic information of the materials and structures of the buildingere as follows: external walls were made of brick, gypsum plas-
er, cladding stone and concrete mortar, 417 mm, with the overalleat transfer coefficient (U) of 1.145 W/m2 K. The roof is made ofteel, polystyrene, rubber and roof deck, 184 mm, with U value of.224 W/m2 K. The floor was made of concrete slab and granite,05 mm, with U value of 2.809 W/m2 K. The building had windowsn the external walls of the floor which are faced north, southnd west. The windows on the northern and southern walls had
total area of 14.4 m2 and 21.6 m2, respectively. The windows on
he western wall had a total area of 40 m2. All windows were doublelazing unit and had a U-value equal to 2.58 W/m2 K. An exter-al shading factor of 0.2 was given for windows to consider theffects of shadow of trees around the building. The walls, windows,uildings 74 (2014) 163–172 167
floor and roof were modeled according to ASHRAE transfer functionapproach [17]. The occupant density in the building was about oneperson per 5 m2 and the associated heat gain was 95 W and 90 Wfor sensible and latent loads respectively. The mechanical ventila-tion rate for acceptable indoor air quality was two air changes perhour (ACH). The infiltration was selected to be 1.5 ACH. Lightingpower density was 20 W/m2, a common value used in practice fora commercial building. We assumed that the heat gain from thelights is 40% convective. The equipment load inside the buildingwas taken as 16 W/m2, corresponding to a medium load type. Theclothing factor for people in the building was specified as 0.5 cloand relative air velocity was fixed at 0.1 m/s. The metabolic rate was1.2 met and no external work was assumed. The weather data thatdrove the project simulations were based on a typical meteorolog-ical year. The data file distributed with TRNSYS 16 was generatedusing “Meteonorm” including synthetic hourly weather data. Thehourly meteorological data used in this study included informationabout the month of the year, hour of the month, direct normal solarradiation, global solar radiation, dry-bulb temperature, humidityratio and wind speed.
The DX rooftop package included a thermostatic expansionvalve, a DX evaporator, an air-cooled condenser and a scroll typeof the rotary compressor with nominal capacity of 52.5 kW. Theworking fluid was the refrigerant R22. The evaporative temperatureat designed conditions was set to be 4.4 ◦C. The surface tempera-ture of the DX evaporator was assumed equal to the evaporativetemperature. The supply air flow rate was 8748 m3/h at designedconditions. The design electric power input of the evaporator vari-able speed fan at maximum air flow rate was 1.3 kW. The heatrejection capacity of the air-cooled condenser was designed to con-trol the condensing temperature at 50 ◦C. The surface temperatureof the condenser was assumed equal to the condensing tempera-ture. The designed air flow rate of the condenser variable air volumefan was 12,400 m3/h and its rated power input was 1.1 kW. Detailsof the system parameters and specifications are provided in Table 1.
4.1. Experimental rig
Condenser number of fins 760Condenser face area (m2) 1.5Condenser longitudinal space of tubes (cm) 2.5Condenser transverse space of tubes (cm) 3.1
168 V. Vakiloroaya et al. / Energy and Buildings 74 (2014) 163–172
ork sp
TmFb+awtii
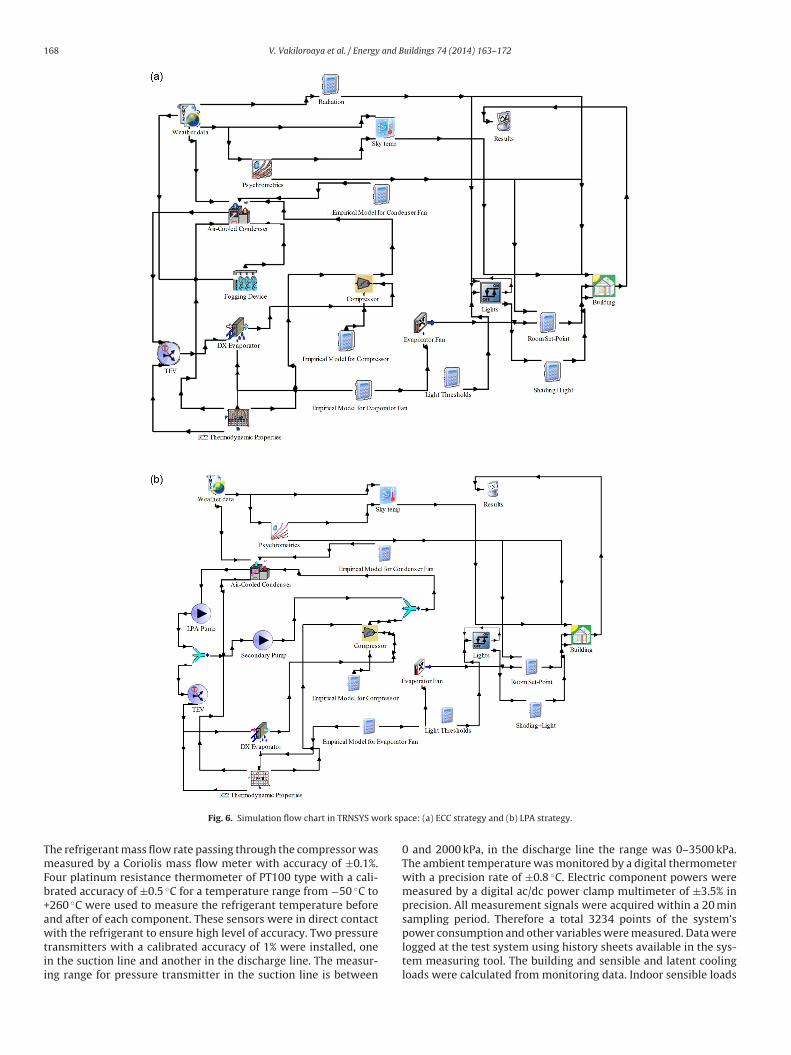
Fig. 6. Simulation flow chart in TRNSYS w
he refrigerant mass flow rate passing through the compressor waseasured by a Coriolis mass flow meter with accuracy of ±0.1%.
our platinum resistance thermometer of PT100 type with a cali-rated accuracy of ±0.5 ◦C for a temperature range from −50 ◦C to260 ◦C were used to measure the refrigerant temperature beforend after of each component. These sensors were in direct contact
ith the refrigerant to ensure high level of accuracy. Two pressureransmitters with a calibrated accuracy of 1% were installed, onen the suction line and another in the discharge line. The measur-ng range for pressure transmitter in the suction line is between
ace: (a) ECC strategy and (b) LPA strategy.
0 and 2000 kPa, in the discharge line the range was 0–3500 kPa.The ambient temperature was monitored by a digital thermometerwith a precision rate of ±0.8 ◦C. Electric component powers weremeasured by a digital ac/dc power clamp multimeter of ±3.5% inprecision. All measurement signals were acquired within a 20 minsampling period. Therefore a total 3234 points of the system’s
power consumption and other variables were measured. Data werelogged at the test system using history sheets available in the sys-tem measuring tool. The building and sensible and latent coolingloads were calculated from monitoring data. Indoor sensible loads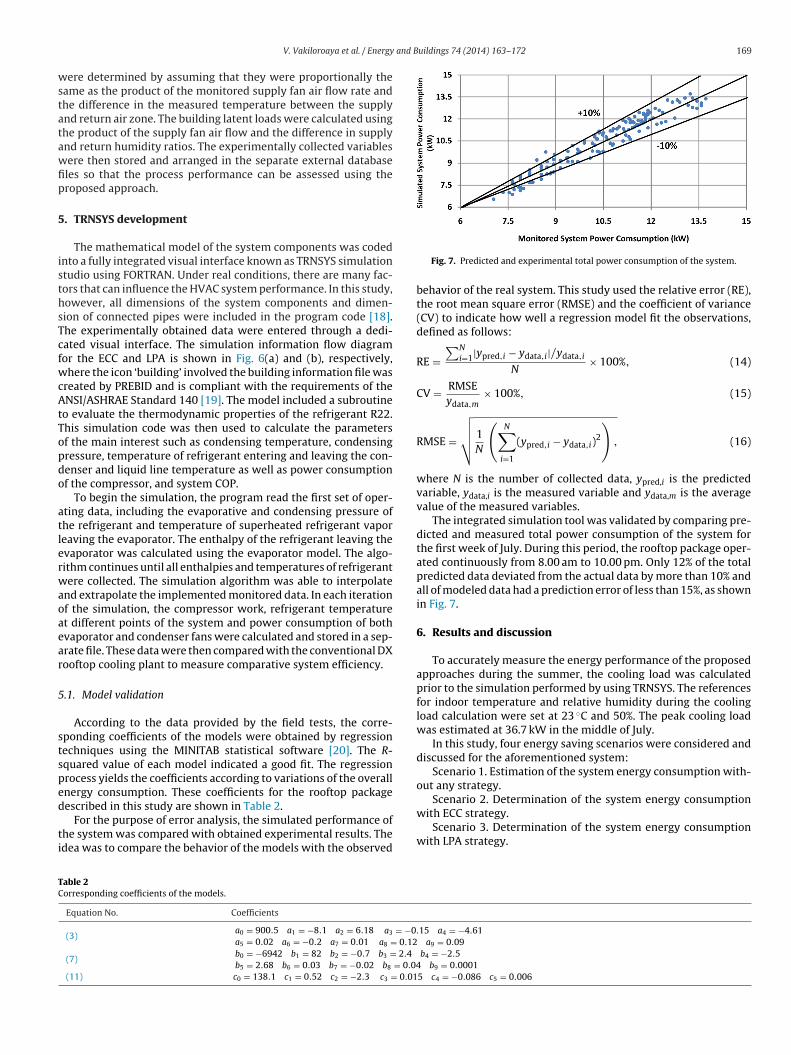
and Buildings 74 (2014) 163–172 169
wstatawfip
5
isthsTcfwcAtTopdo
atlerwaoaear
5
stsped
ti
TC
Scenario 2. Determination of the system energy consumption
V. Vakiloroaya et al. / Energy
ere determined by assuming that they were proportionally theame as the product of the monitored supply fan air flow rate andhe difference in the measured temperature between the supplynd return air zone. The building latent loads were calculated usinghe product of the supply fan air flow and the difference in supplynd return humidity ratios. The experimentally collected variablesere then stored and arranged in the separate external databaseles so that the process performance can be assessed using theroposed approach.
. TRNSYS development
The mathematical model of the system components was codednto a fully integrated visual interface known as TRNSYS simulationtudio using FORTRAN. Under real conditions, there are many fac-ors that can influence the HVAC system performance. In this study,owever, all dimensions of the system components and dimen-ion of connected pipes were included in the program code [18].he experimentally obtained data were entered through a dedi-ated visual interface. The simulation information flow diagramor the ECC and LPA is shown in Fig. 6(a) and (b), respectively,here the icon ‘building’ involved the building information file was
reated by PREBID and is compliant with the requirements of theNSI/ASHRAE Standard 140 [19]. The model included a subroutine
o evaluate the thermodynamic properties of the refrigerant R22.his simulation code was then used to calculate the parametersf the main interest such as condensing temperature, condensingressure, temperature of refrigerant entering and leaving the con-enser and liquid line temperature as well as power consumptionf the compressor, and system COP.
To begin the simulation, the program read the first set of oper-ting data, including the evaporative and condensing pressure ofhe refrigerant and temperature of superheated refrigerant vaporeaving the evaporator. The enthalpy of the refrigerant leaving thevaporator was calculated using the evaporator model. The algo-ithm continues until all enthalpies and temperatures of refrigerantere collected. The simulation algorithm was able to interpolate
nd extrapolate the implemented monitored data. In each iterationf the simulation, the compressor work, refrigerant temperaturet different points of the system and power consumption of bothvaporator and condenser fans were calculated and stored in a sep-rate file. These data were then compared with the conventional DXooftop cooling plant to measure comparative system efficiency.
.1. Model validation
According to the data provided by the field tests, the corre-ponding coefficients of the models were obtained by regressionechniques using the MINITAB statistical software [20]. The R-quared value of each model indicated a good fit. The regressionrocess yields the coefficients according to variations of the overallnergy consumption. These coefficients for the rooftop package
escribed in this study are shown in Table 2.For the purpose of error analysis, the simulated performance ofhe system was compared with obtained experimental results. Thedea was to compare the behavior of the models with the observed
able 2orresponding coefficients of the models.
Equation No. Coefficients
(3)a0 = 900.5 a1 = −8.1 a2 = 6.18 a3 = −0.a5 = 0.02 a6 = −0.2 a7 = 0.01 a8 = 0.12
(7)b0 = −6942 b1 = 82 b2 = −0.7 b3 = 2.4
b5 = 2.68 b6 = 0.03 b7 = −0.02 b8 = 0.04(11) c0 = 138.1 c1 = 0.52 c2 = −2.3 c3 = 0.01
Fig. 7. Predicted and experimental total power consumption of the system.
behavior of the real system. This study used the relative error (RE),the root mean square error (RMSE) and the coefficient of variance(CV) to indicate how well a regression model fit the observations,defined as follows:
RE =∑N
i=1|ypred,i − ydata,i|/ydata,i
N× 100%, (14)
CV = RMSEydata,m
× 100%, (15)
RMSE =
√√√√ 1N
(N∑
i=1
(ypred,i − ydata,i)2
), (16)
where N is the number of collected data, ypred,i is the predictedvariable, ydata,i is the measured variable and ydata,m is the averagevalue of the measured variables.
The integrated simulation tool was validated by comparing pre-dicted and measured total power consumption of the system forthe first week of July. During this period, the rooftop package oper-ated continuously from 8.00 am to 10.00 pm. Only 12% of the totalpredicted data deviated from the actual data by more than 10% andall of modeled data had a prediction error of less than 15%, as shownin Fig. 7.
6. Results and discussion
To accurately measure the energy performance of the proposedapproaches during the summer, the cooling load was calculatedprior to the simulation performed by using TRNSYS. The referencesfor indoor temperature and relative humidity during the coolingload calculation were set at 23 ◦C and 50%. The peak cooling loadwas estimated at 36.7 kW in the middle of July.
In this study, four energy saving scenarios were considered anddiscussed for the aforementioned system:
Scenario 1. Estimation of the system energy consumption with-out any strategy.
15 a4 = −4.61 a9 = 0.09b4 = −2.5
b9 = 0.00015 c4 = −0.086 c5 = 0.006
with ECC strategy.Scenario 3. Determination of the system energy consumption
with LPA strategy.
170 V. Vakiloroaya et al. / Energy and Buildings 74 (2014) 163–172
b
atFvvvtt1aptTcssptcttti
Lvtacaatar
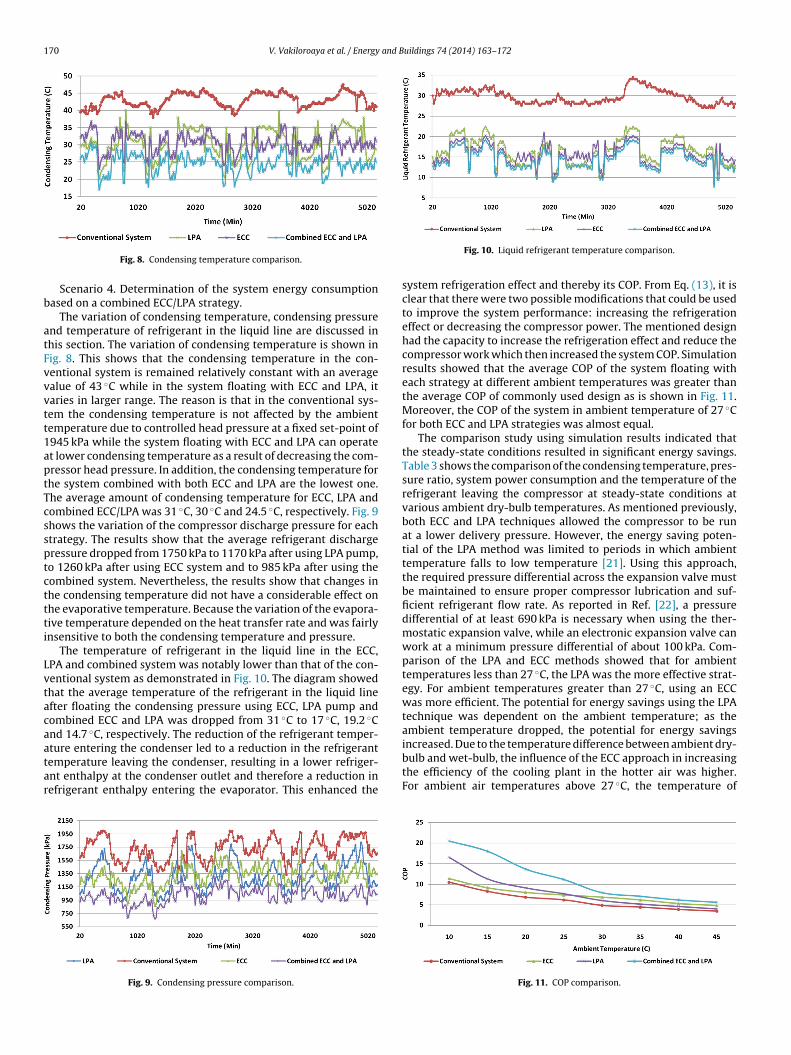
Fig. 8. Condensing temperature comparison.
Scenario 4. Determination of the system energy consumptionased on a combined ECC/LPA strategy.
The variation of condensing temperature, condensing pressurend temperature of refrigerant in the liquid line are discussed inhis section. The variation of condensing temperature is shown inig. 8. This shows that the condensing temperature in the con-entional system is remained relatively constant with an averagealue of 43 ◦C while in the system floating with ECC and LPA, itaries in larger range. The reason is that in the conventional sys-em the condensing temperature is not affected by the ambientemperature due to controlled head pressure at a fixed set-point of945 kPa while the system floating with ECC and LPA can operatet lower condensing temperature as a result of decreasing the com-ressor head pressure. In addition, the condensing temperature forhe system combined with both ECC and LPA are the lowest one.he average amount of condensing temperature for ECC, LPA andombined ECC/LPA was 31 ◦C, 30 ◦C and 24.5 ◦C, respectively. Fig. 9hows the variation of the compressor discharge pressure for eachtrategy. The results show that the average refrigerant dischargeressure dropped from 1750 kPa to 1170 kPa after using LPA pump,o 1260 kPa after using ECC system and to 985 kPa after using theombined system. Nevertheless, the results show that changes inhe condensing temperature did not have a considerable effect onhe evaporative temperature. Because the variation of the evapora-ive temperature depended on the heat transfer rate and was fairlynsensitive to both the condensing temperature and pressure.
The temperature of refrigerant in the liquid line in the ECC,PA and combined system was notably lower than that of the con-entional system as demonstrated in Fig. 10. The diagram showedhat the average temperature of the refrigerant in the liquid linefter floating the condensing pressure using ECC, LPA pump andombined ECC and LPA was dropped from 31 ◦C to 17 ◦C, 19.2 ◦Cnd 14.7 ◦C, respectively. The reduction of the refrigerant temper-
ture entering the condenser led to a reduction in the refrigerantemperature leaving the condenser, resulting in a lower refriger-nt enthalpy at the condenser outlet and therefore a reduction inefrigerant enthalpy entering the evaporator. This enhanced theFig. 9. Condensing pressure comparison.
Fig. 10. Liquid refrigerant temperature comparison.
system refrigeration effect and thereby its COP. From Eq. (13), it isclear that there were two possible modifications that could be usedto improve the system performance: increasing the refrigerationeffect or decreasing the compressor power. The mentioned designhad the capacity to increase the refrigeration effect and reduce thecompressor work which then increased the system COP. Simulationresults showed that the average COP of the system floating witheach strategy at different ambient temperatures was greater thanthe average COP of commonly used design as is shown in Fig. 11.Moreover, the COP of the system in ambient temperature of 27 ◦Cfor both ECC and LPA strategies was almost equal.
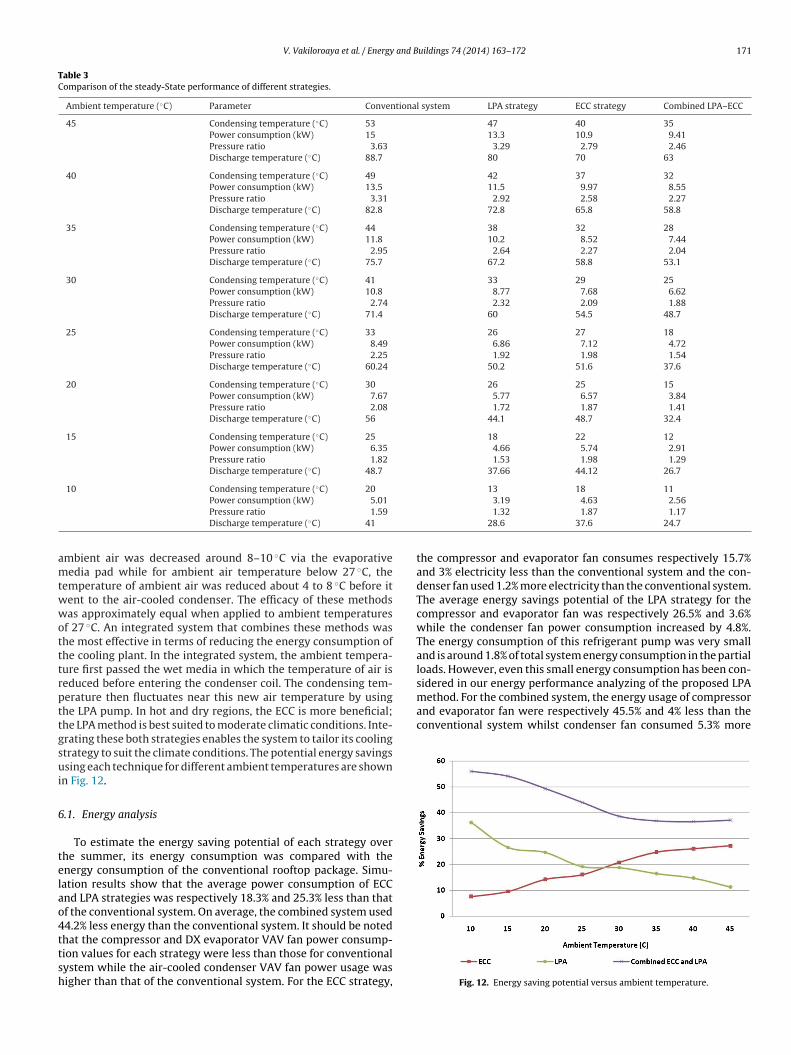
The comparison study using simulation results indicated thatthe steady-state conditions resulted in significant energy savings.Table 3 shows the comparison of the condensing temperature, pres-sure ratio, system power consumption and the temperature of therefrigerant leaving the compressor at steady-state conditions atvarious ambient dry-bulb temperatures. As mentioned previously,both ECC and LPA techniques allowed the compressor to be runat a lower delivery pressure. However, the energy saving poten-tial of the LPA method was limited to periods in which ambienttemperature falls to low temperature [21]. Using this approach,the required pressure differential across the expansion valve mustbe maintained to ensure proper compressor lubrication and suf-ficient refrigerant flow rate. As reported in Ref. [22], a pressuredifferential of at least 690 kPa is necessary when using the ther-mostatic expansion valve, while an electronic expansion valve canwork at a minimum pressure differential of about 100 kPa. Com-parison of the LPA and ECC methods showed that for ambienttemperatures less than 27 ◦C, the LPA was the more effective strat-egy. For ambient temperatures greater than 27 ◦C, using an ECCwas more efficient. The potential for energy savings using the LPAtechnique was dependent on the ambient temperature; as theambient temperature dropped, the potential for energy savingsincreased. Due to the temperature difference between ambient dry-
bulb and wet-bulb, the influence of the ECC approach in increasingthe efficiency of the cooling plant in the hotter air was higher.For ambient air temperatures above 27 ◦C, the temperature ofFig. 11. COP comparison.
V. Vakiloroaya et al. / Energy and Buildings 74 (2014) 163–172 171
Table 3Comparison of the steady-State performance of different strategies.
Ambient temperature (◦C) Parameter Conventional system LPA strategy ECC strategy Combined LPA–ECC
45 Condensing temperature (◦C) 53 47 40 35Power consumption (kW) 15 13.3 10.9 9.41Pressure ratio 3.63 3.29 2.79 2.46Discharge temperature (◦C) 88.7 80 70 63
40 Condensing temperature (◦C) 49 42 37 32Power consumption (kW) 13.5 11.5 9.97 8.55Pressure ratio 3.31 2.92 2.58 2.27Discharge temperature (◦C) 82.8 72.8 65.8 58.8
35 Condensing temperature (◦C) 44 38 32 28Power consumption (kW) 11.8 10.2 8.52 7.44Pressure ratio 2.95 2.64 2.27 2.04Discharge temperature (◦C) 75.7 67.2 58.8 53.1
30 Condensing temperature (◦C) 41 33 29 25Power consumption (kW) 10.8 8.77 7.68 6.62Pressure ratio 2.74 2.32 2.09 1.88Discharge temperature (◦C) 71.4 60 54.5 48.7
25 Condensing temperature (◦C) 33 26 27 18Power consumption (kW) 8.49 6.86 7.12 4.72Pressure ratio 2.25 1.92 1.98 1.54Discharge temperature (◦C) 60.24 50.2 51.6 37.6
20 Condensing temperature (◦C) 30 26 25 15Power consumption (kW) 7.67 5.77 6.57 3.84Pressure ratio 2.08 1.72 1.87 1.41Discharge temperature (◦C) 56 44.1 48.7 32.4
15 Condensing temperature (◦C) 25 18 22 12Power consumption (kW) 6.35 4.66 5.74 2.91Pressure ratio 1.82 1.53 1.98 1.29Discharge temperature (◦C) 48.7 37.66 44.12 26.7
10 Condensing temperature (◦C) 20 13 18 11
amtwwotttrpttgsui
6
telao4ttsh
sidered in our energy performance analyzing of the proposed LPAmethod. For the combined system, the energy usage of compressorand evaporator fan were respectively 45.5% and 4% less than theconventional system whilst condenser fan consumed 5.3% more
Power consumption (kW) 5.01
Pressure ratio 1.59
Discharge temperature (◦C) 41
mbient air was decreased around 8–10 ◦C via the evaporativeedia pad while for ambient air temperature below 27 ◦C, the
emperature of ambient air was reduced about 4 to 8 ◦C before itent to the air-cooled condenser. The efficacy of these methodsas approximately equal when applied to ambient temperatures
f 27 ◦C. An integrated system that combines these methods washe most effective in terms of reducing the energy consumption ofhe cooling plant. In the integrated system, the ambient tempera-ure first passed the wet media in which the temperature of air iseduced before entering the condenser coil. The condensing tem-erature then fluctuates near this new air temperature by usinghe LPA pump. In hot and dry regions, the ECC is more beneficial;he LPA method is best suited to moderate climatic conditions. Inte-rating these both strategies enables the system to tailor its coolingtrategy to suit the climate conditions. The potential energy savingssing each technique for different ambient temperatures are shown
n Fig. 12.
.1. Energy analysis
To estimate the energy saving potential of each strategy overhe summer, its energy consumption was compared with thenergy consumption of the conventional rooftop package. Simu-ation results show that the average power consumption of ECCnd LPA strategies was respectively 18.3% and 25.3% less than thatf the conventional system. On average, the combined system used4.2% less energy than the conventional system. It should be noted
hat the compressor and DX evaporator VAV fan power consump-ion values for each strategy were less than those for conventionalystem while the air-cooled condenser VAV fan power usage wasigher than that of the conventional system. For the ECC strategy,3.19 4.63 2.561.32 1.87 1.17
28.6 37.6 24.7
the compressor and evaporator fan consumes respectively 15.7%and 3% electricity less than the conventional system and the con-denser fan used 1.2% more electricity than the conventional system.The average energy savings potential of the LPA strategy for thecompressor and evaporator fan was respectively 26.5% and 3.6%while the condenser fan power consumption increased by 4.8%.The energy consumption of this refrigerant pump was very smalland is around 1.8% of total system energy consumption in the partialloads. However, even this small energy consumption has been con-
Fig. 12. Energy saving potential versus ambient temperature.

172 V. Vakiloroaya et al. / Energy and B
etydceitetttbftsoscm
7
iiEtpadtTTovswsEsa
[
[
[
[
[
[
[
[
[
[
[[
[
[
Fig. 13. Monthly energy consumption comparison.
lectricity compared with conventional system. This is becausehe reduction of refrigerant temperature entering the condenserielded a reduction in refrigerant temperature leaving the con-enser which means the refrigerant sub-cool temperature at theondenser outlet is increased. Therefore, the refrigerant enthalpyntering the evaporator was reduced which resulted in an increasen the system refrigeration effect and, in turn, an increase the sys-em coefficient of performance. Therefore, a higher refrigerationffect caused more heat transfer in the evaporator which decreasedhe supply air temperature [23,24]. Lower supply air temperaturehen provided the building cooling demand which slightly reducedhe supply air flow rate, resulting in less power being consumedy the supply fan. The total energy usage of the whole systemor each summer month was obtained by summation of the sys-em’s energy consumption patterns in each working hour. Fig. 13hows the simulation results for the average energy consumptionf the conventional and proposed strategies and compares it in eachummer month. It can be seen that the power consumption of theombined system is significantly less than the power usage of otherethods.
. Conclusion
This paper presented three strategies designed to save energyn an air-cooled rooftop package plant in a commercial build-ng located in a hot and dry climate. Those strategies were LPA,CC, and an ECC/LPA combination. The purpose of implementinghese strategies was to record the fluctuation of temperatures andressures within the condenser in response to ambient temper-ture changes. Theoretical–empirical mathematical models wereeveloped using monitored data, which were collected experimen-ally from the existing air conditioning system of the building.he numerical algorithm was then coded and implemented inRNSYS to determine the system performance. The performancef the proposed strategies was then predicted by using a well-alidated building transient simulation code. Simulation resultshowed that by allowing temperature and pressure to fluctuateithin the condenser, condensing pressures were reduced and the
ystem consumed less electricity. Using LPA, ECC and combinedCC/LPA strategies resulted in significant reductions in energy con-umption, averaging 25.3%, 18.3% and 44.2% and reaching 39%, 28%nd 56%, respectively. Thus, the proposed designs have exciting
[
uildings 74 (2014) 163–172
potential to save energy and improve HVAC system performancewhile fulfilling cooling demands.
References
[1] Council of Australian Governments, Guide to Best Practice Maintenance andOperation of HVAC Systems for Energy Efficiency, Department of ClimateChange and Energy Efficiency, Australia, 2012.
[2] International Energy Outlook, Energy Information Administration, U.S. Depart-ment of Energy (DOE), 2006.
[3] C. Cianfrini, M. Corcione, E. Habib, A. Quintino, Energy performance of alightweight opaque ventilation fac ade integrated with the HVAC system usingsaturated exhaust indoor air, Energy and Buildings 50 (2012) 26–34.
[4] B.M. Diaconu, Energy analysis of a solar-assisted ejector cycle air conditioningsystem with low temperature thermal energy storage, Renewable Energy 37(2012) 266–276.
[5] F. Ascione, L. Bellia, A. Capozzoli, F. Minichiello, Energy saving strategies inair-conditioning for museums, Applied Thermal Engineering 29 (2009) 676–686.
[6] K.P. Tsagarakis, K. Karyotakis, N. Zografakis, Implementation conditions forenergy saving technologies and practices in office buildings. Part 2. Doubleglazing windows, heating and air-conditioning, Renewable Energy 16 (2012)3986–3998.
[7] D.T. Reindl, H. Hong, Evaluation of liquid pressure amplifier technology, Inter-national Journal of Air-Conditioning and Refrigeration 13 (2005) 119–127.
[8] L. Keliang, J. Jie, C. Tin-tai, P. Gang, H. Hanfeng, J. Aiguo, Y. Jichun, Performancestudy of a photovoltaic solar assisted heat pump with variable-frequency com-pressor – a case study in Tibet, Renewable Energy 34 (2009) 2680–2687.
[9] V. Vakiloroaya, Q.P. Ha, B. Samali, Energy-efficient HVAC systems:simulation–empirical modelling and gradient optimization, Automationin Construction 31 (2013) 176–185.
10] X. Wang, Y. Hwang, R. Radermacher, Investigation of potential benefits of com-pressor cooling, Applied Thermal Engineering 28 (2008) 1791–1797.
11] B. Wang, L. Han, W. Shi, X. Li, Modeling method of scroll compressor based onsuction gas bypass, Applied Thermal Engineering 37 (2012) 183–189.
12] P. Sarntichartsak, S. Thepa, Modeling and experimental study on the perfor-mance of an inverter air conditioner using R410A with evaporatively cooledcondenser, Applied Thermal Engineering 51 (2013) 597–610.
13] J. Arias, P. Lundqvist, Heat recovery and floating condensing in supermarkets,Energy and Buildings 38 (2006) 73–81.
14] TRNSYS Software, A Transient System Simulation Program, Ver-sion 16, Wisconsis-Madison University, USA, 2006, Available at:http://sel.me.wisc.edu/trnsys/
15] V. Vakiloroaya, B. Samali, A. Fakhar, K. Pishghadam, Thermo-economicoptimization of rooftop unit’s evaporator coil for energy efficiency andthermal comfort, Building Simulation: An International Journal (2013),http://dx.doi.org/10.1007/s12273-013-0151-6.
16] ARI Standard 540, Performance Rating of Positive Displacement RefrigerantCompressors and Compressor Units, Air Conditioning and Refrigeration Insti-tute, Arlington, VA, USA, 2004.
17] ASHRAE Handbook Fundamentals, American Society of Heating, Refrigeratingand Air-Conditioning Engineers, Atlanta, GA, USA, 2009.
18] V. Vakiloroaya, Q.P. Ha, M. Skibniewski, Modeling and experimental validationof a solar-assisted direct expansion air conditioning system, Energy and Build-ings 66 (2013) 524–536.
19] ANSI/ASHRAE Standard 140, Standard Method of Test for the Evaluation ofBuilding Energy Analysis Computer Program, American Society of Heating,Refrigerating and Air-Conditioning, Atlanta, GA, USA, 2007.
20] Minitab User’s Guide Release 16, Minitab Inc., State College, PA, USA, 2010.21] O.M. Al-Rabghi, M.M. Akyurt, A survey of energy efficient strategies for effective
air conditioning, Energy Conversion and Management 45 (2004) 1643–1654.22] F.W. Yu, K.T. Chan, Optimum condenser fan staging for air-cooled chillers,
Applied Thermal Engineering 25 (2005) 2204–2218.23] H. Wanga, Y. Chena, C.W.H. Chanb, J. Qinb, J. Wanga, Online model-based fault
detection and diagnosis strategy for VAV air handling units, Energy and Build-ings 55 (2010) 252–263.
24] V. Vakiloroaya, B. Samali, A. Fakhar, K. Pishghadam, A review of different strate-gies for HVAC energy saving, Energy Conversion and Management 77 (2014)738–754.