Embed Size (px)
Citation preview
Journal of Experimental Botany, Vol. 60, No. 12, pp. 3443–3452, 2009doi:10.1093/jxb/erp180 Advance Access publication 10 June, 2009This paper is available online free of all access charges (see http://jxb.oxfordjournals.org/open_access.html for further details)
RESEARCH PAPER
A comparative analysis of phenylpropanoid metabolism, Nutilization, and carbon partitioning in fast- and slow-growingPopulus hybrid clones
Scott A. Harding1,2,*, Michelle M. Jarvie2, Richard L. Lindroth3 and Chung-Jui Tsai1,2,4
1 School of Forestry and Natural Resources, University of Georgia, Athens, GA 30602, USA2 School of Forest Resources and Environmental Science, Michigan Technological University, Houghton, MI 49931, USA3 Department of Entomology, University of Wisconsin, Madison, WI 53706, USA4 Department of Genetics, University of Georgia, Athens, GA 30602, USA
Received 12 December 2008; Revised 23 April 2009; Accepted 13 May 2009
Abstract
The biosynthetic costs of phenylpropanoid-derived condensed tannins (CTs) and phenolic glycosides (PGs) are
substantial. However, despite reports of negative correlations between leaf phenolic content and growth of Populus,
it remains unclear whether or how foliar biosynthesis of CT/PG interferes with tree growth. A comparison was made
of carbon partitioning and N content in developmentally staged leaves, stems, and roots of two closely related
Populus hybrid genotypes. The genotypes were selected as two of the most phytochemically divergent from a seriesof seven previously analysed clones that exhibit a range of height growth rates and foliar amino acid, CT, and PG
concentrations. The objective was to analyse the relationship between leaf phenolic content and plant growth, using
whole-plant carbon partitioning and N distribution data from the two divergent clones. Total N as a percentage of
tissue dry mass was comparatively low, and CT and PG accrual comparatively high in leaves of the slow-growing
clone. Phenylpropanoid accrual and N content were comparatively high in stems of the slow-growing clone. Carbon
partitioning within phenylpropanoid and carbohydrate networks in developing stems differed sharply between
clones. The results did not support the idea that foliar production of phenylpropanoid defence chemicals was the
primary cause of reduced plant growth in the slow-growing clone. The findings are discussed in the context ofmetabolic mechanism(s) which may contribute to reduced N delivery from roots to leaves, thereby compromising
tree growth and promoting leaf phenolic accrual in the slow-growing clone.
Key words: Cellulose, chemical defence, development, lignin, poplar, root, salicortin, vascular.
Introduction
Despite their fast growth rates, Populus species exhibit
a propensity toward the accumulation of large foliar
reserves of non-structural phenylpropanoid derivatives
(NSPs) (Lindroth and Hwang, 1996). NSPs are metaboli-cally costly to synthesize, relatively stable, and less available
for growth than more labile carbon (C) forms (Lindroth
and Hwang, 1996; Kleiner et al., 1999; Ruuhola and
Julkunen-Tiitto, 2000; Kandil et al., 2004). In the context
of overall tree fitness, putative metabolic costs (to tree
growth) of NSPs are regarded as a potential trade-off in
favour of enhanced fitness in stressful environments (Lin-
droth and Hwang, 1996; Koricheva, 2002; Glynn et al.,
2007). Whether or how foliar NSP biosynthesis comprises
a trade-off to growth in Populus or other taxa of fast-growing, early-successional tree species remains largely
unresolved (Hamilton et al., 2001; Stamp, 2003; Glynn
et al., 2007). In annual crop species where secondary
metabolite levels often do not exceed a few percent of leaf
dry weight, the cost to growth is estimated to be negligible
(Foyer et al., 2007). However, the flavonoid-derived
* To whom correspondence should be addressed. E-mail: [email protected]ª 2009 The Author(s).
This is an Open Access article distributed under the terms of the Creative Commons Attribution Non-Commercial License (http://creativecommons.org/licenses/by-nc/2.0/uk/) which permits unrestricted non-commercial use, distribution, and reproduction in any medium, provided the original work is properly cited.

condensed tannins (CTs) and the salicin-containing pheno-
lic glycosides (PGs) commonly comprise 1 to >25% of leaf
dry weight in Populus (Lindroth and Hwang, 1996; Harding
et al., 2005), and therefore may represent a significant cost
to growth.
The regulation of NSP accumulation has not been
reported for Populus, but in herbaceous taxa such as
tobacco, foliar NSP concentrations increase as a functionof photosynthetic carbon fixation and diminishing cellular
nitrate-N levels (Matt et al., 2002; Fritz et al., 2006). In
accordance with the tobacco findings, foliar NSP accrual is
promoted in Populus grown under high light, low N, or
elevated carbon dioxide levels (Bryant et al., 1983; Agrell
et al., 2000; Osier and Lindroth, 2001, 2006). Because
Populus are perennial species, they must cope with periodic
changes in a range of environmental factors that affectgrowth. As they mature, they exhibit a number of ontoge-
netic, adaptive changes in growth rate, shoot–root ratio,
and leaf chemistry (Wullschleger et al., 2005; Donaldson
et al., 2006b). Due to their lengthy and complex growth
cycle, a number of factors are expected to contribute to the
regulation of growth and chemical defence, and a number
of rationalizing hypotheses have been developed (reviewed
in Stamp, 2003).The most widely cited theories that have been used to
model NSP accumulation and growth in Populus and
related taxa (Bryant et al., 1983; Herms and Mattson, 1992;
Jones and Hartley, 1999) differ largely in their emphasis on
the importance of N and C use in controlling the partition-
ing of assimilate between NSP and growth. According to
the ‘Protein Competition Model’ (PCM) of Jones and
Hartley (1999), phenylalanine is the N currency shared byphenylpropanoid and protein biosynthesis. At the cellular
level, however, tissue nitrate concentration is now known to
be an important regulator of phenylpropanoid synthesis
(Fritz et al., 2006). In addition, the amino N of phenylala-
nine can be recovered for other uses (vanHeerden et al.,
1996; Singh et al., 1998), making it unclear whether phenyl-
propanoid synthesis would interfere with, or be suppressed
by, protein synthesis.Other reports are in support of a less prominent role for
phenylalanine, and illustrate the importance of C fixation
and use as posited in the ‘growth–differentiation balance
hypothesis’ (GBDH) of Herms and Mattson (1992).
According to the GBDH, NSP synthesis depends on the
availability of labile carbohydrates in relation to overall
growth demand (Mattson et al., 2005; Glynn et al., 2007).
Indeed, biosynthesis of NSP is metabolically costly in termsof C use, and requires substantial sucrose catabolism
following localized induction in Populus (Arnold et al.,
2004). C from acetate groups is sufficient to sustain
flavonoid biosynthesis even when the phenylalanine ammonia-
lyase (PAL) enzyme is inhibited by chemical means in
Salix (willow) (Mattson et al., 2005; Keski-Saari et al.,
2007). Similarly, in Populus, foliar CT content was found to
be correlated with flavonoid pathway gene expression, whileexpression of the upstream PAL gene remained relatively
constant (Harding et al., 2005). Overall, phenylpropanoids
appear to be more directly linked to growth via a trade-off-
based mechanism than do other C-rich secondary metabo-
lites that are not derived from N-containing precursors (e.g.
terpenoids; Honkanen et al., 1999)
The present investigation employed a comparative,
whole-plant approach for the analysis of phenylpropanoid
metabolism and its possible effects on growth of two
Populus genotypes. Genotypic differences in the control ofleaf N supply appeared to be important to foliar NSP
accrual. N concentration was lower in leaves of the slow-
growing clone, although it was similar in roots and actually
higher in stems compared with the fast-growing clone. A
hypothetical scenario is presented by which stem effects on
N delivery to expanding leaves could modulate leaf NSP
accrual and plant growth.
Materials and methods
Plant materials
The two cottonwood clones compared in this study
originate from a suite of P. fremontii 3 angustifolia hybrids
that have been reported on previously (Schweitzer et al.,
2004; Harding et al., 2005; Fischer et al., 2006; Woolbright
et al., 2008). The subject clones, one slow-growing (SG)with relatively high foliar NSP concentrations, and the
other fast-growing (FG) with lower NSP levels, have been
maintained by vegetative propagation at Michigan Techno-
logical University (Houghton, MI, USA). FG is an F1
hybrid and SG is a hybrid backcrossed with the P.
angustifolia parent (TG Whitham, personal communica-
tion). For this study, rooted cuttings, 10–15 cm in height,
were transferred into aerated nutrient solution formulatedfor temperate tree species and modified for Populus
(Harding et al., 2005). Individual plants were maintained in
perlite-filled pots (12 cm38 cm38 cm) bathed in a continu-
ous flow of nutrient solution which received a daily
augmentation of 0.36 mmol l�1 N (2.5 mmol l�1 per week)
with a molar ratio of nitrate-N to ammonium-N of 4.
Distilled water was added daily to the nutrient solution
reservoir as needed to maintain a constant volume. Nutrientsolution was replaced weekly, and a pH of 5.860.3 was
maintained by daily additions of 2 N KOH or 2 N HCl.
Plant growth monitoring and tissue processing
At the start of the growth monitoring period, 15 FG and 17
SG plants ;1 m in height were distributed into four large
(1 m2 surface area) ebb and flow hydroponics tubs. The
selection of similar sized plants was achieved by the use of
staggered plantings of the populations from which experi-
mental plants were selected. Established cuttings of SG
plants were 4–6 weeks older than FG plants at the time ofselection. Approximately 30 cm separated neighbouring
plants in each tub, and each tub contained only one
genotype. Tubs were positioned 30 cm apart and 3.2 m
below a bank of 1000 W, ventilated, metal halide lamps
providing supplemental lighting of 600 lmol m�2 s�1 at
3444 | Harding et al.
plant tops. A photoperiod of 16 h was maintained. Daytime
temperatures in the greenhouse ranged between 25 �C and
32 �C, and night-time temperature was 22 �C. Humidity
was not controlled. Plant height from the base of the stem
to leaf plastochron index (LPI)-0, of the youngest unfurled
leaf, 3 cm in length (Larson and Isebrands, 1971), was
recorded, and the petiole of LPI-0 was marked. Two of the
tubs, containing seven and eight plants of FG and SG,respectively, were harvested 4 weeks after the start of the
experiment. Those plants were used for chemical analysis
only. The remaining plants were harvested 8 weeks after the
start of the experiment for both chemical and biomass
measurements.
Harvesting took place between late morning and mid-
afternoon, and conditions were sunny on both the 4 week
and 8 week dates. Prior to processing, stem lengths aboveand below the marked petiole were measured, and the
number of leaves above the mark recorded. Stem internodes
above the mark (new growth) and in the subjacent mid-stem
region were split with a razor and vacuum-dried. Root
tissue aliquots were snap-frozen in liquid nitrogen for
storage at –80 �C. The remaining root tissue was rinsed,
blotted, and vacuum-dried. Dried roots were divided into
two fractions. The ‘elongating’ root fraction combinedsmall lateral roots, <3 cm in length, with the distal 3–4 cm
of longer lateral roots and primary roots. The ‘coarse’ root
fraction comprised the remaining root tissue, excluding the
basal 3–5 cm. As defined, elongating roots comprised ;30–
50% of total root mass. Leaves at LPI-3 (expanding) and
LPI-6 (source) were snap-frozen in liquid N and stored at
–80 �C. Powder aliquots were later freeze-dried for chemical
analysis. Leaves for biomass determinations were weighedand vacuum-dried.
Chlorophyll fluorescence monitoring
Estimates of variable fluorescence (Fv#¼Fm#–Ft, where Fm#is the maximum fluorescence in the light-adapted state and
Ft is the basal fluorescence in the light-adapted state), and
photosystem II (PSII) quantum yield (QY¼Fm#/Fv#) were
obtained using a hand-held Fluorpen� (Qubit Systems Ltd,
Canada). For each determination, four readings werecollected from each leaf and averaged. LPI-1 to LPI-5 of
three plants of each genotype were monitored every third
day over a 9 d period for the analysis.
Chemical analysis
Dried leaf and stem internode samples were ground through
a Wiley mill to pass a 20-mesh (fibre analysis) or 40-mesh
sieve. N concentrations were measured with a Thermo
Finnigan Flash 1112 elemental analyser. The PGs salicin,
salicortin, and hydroxycyclohexenone (HCH)-salicortinwere measured via high-performance thin-layer chromatog-
raphy (HPTLC) according to Lindroth (1993). PGs purified
via flash chromatography served as standards. Total PG
concentration was determined as the sum of the three
constituent PGs. CTs were assayed using a modified
butanol-HCl method (Porter et al., 1986). CTs purified
from P. angustifolia via adsorption chromatography served
as the standard. Sugar (hexose and sucrose) and starch
levels were determined via the dinitrosalicylic acid method
as modified by Lindroth (2002). Glucose served as the
reference standard. Glucose released from salicin, salicortin,
and HCH-salicortin was determined separately, and the
value subtracted from total sugar. Acid-digestible fibre(ADF; used to estimate cellulose content) and Klason lignin
were estimated gravimetrically using the Ankom 200 Fiber
Analyzer, following sequential extractions in hot acid–
detergent solution (100 �C for 1 h) and incubation in 72%
H2SO4 (3 h).
Statistical analysis
Because only small amounts of tissue from young stem
(internodes 1–6 of both clones) and LPI-3 (SG in particular)
were available per plant for the entire suite of chemicalanalyses, samples from several individual plants were
pooled for the assays that required larger amounts of tissue.
As a result of pooling, the number of replicates was small in
some cases, as specified in the figure legends.
It was clear from preliminary leaf disc screening that
clonal differences in sugar, CT, and PG were essentially the
same at both the 4 week and 8 week dates. Therefore, all 4
week and 8 week data were combined for statistical analysisand simplified presentation. Mixed-effects, nested analysis
of variance (ANOVA) was performed using PROC MIXED
(SAS 9.0), with genotype, position (organ), and (genoty-
pe3position) as fixed effects, and individual tree as a ran-
dom effect in the following model: Yijk¼l+ai+bj+cij+bk(i)+eijk. In this model, l represents the overall means;
ai represents the effect due to genotype i; bj represents the
effect due to position j; cij represents interaction betweengenotype i and position j; bk(i) represents random tree k
effect nested within genotype i; and eijk represents error
factors. Significance testing of linear correlations, and of
selected means comparisons between clones, was performed
by the two-sample t-test (data with normal distribution),
and the Mann–Whitney rank sum test (data with non-
normal distribution) using SigmaStat 3.5.
Results
Height and biomass
During the 8 week monitoring period, shoot incremental
height gain was larger in FG than SG (Table 1). Biomass of
terminal shoot organs emerging during the monitoring
period was greater in FG, primarily due to more rapid leaf
growth. In general, leaf expansion was more rapid and of
shorter duration in FG (Fig. 1A and Supplementary TableS1 available at JXB online). Photosynthetic chlorophyll
fluorescence parameters were measured several times over
a 9 d period to compare the development of photosynthetic
competence in the clones (Fig. 1B and Supplementary Table
S2). The increase in PSII quantum yield and variable
Phenylpropanoid metabolism and N use in Populus | 3445
fluorescence with leaf development was similar for both
clones (Fig. 1B). Dry mass of lower stem internodes did not
differ between clones (Table 1), although it is important to
note that this was expected since lower stems of SG were 4–
6 weeks older than those of FG. The stem biomass trends
are consistent with the interpretation that, relative to SG,
FG exhibited more rapid height growth in elongating
internodes, and more rapid or more sustained radial growthin mature internodes. Root biomass and the root-to-shoot
ratio calculated from averaged root and shoot biomass data
were higher in FG than SG (Table 1).
Phenylpropanoid and carbohydrate concentrations
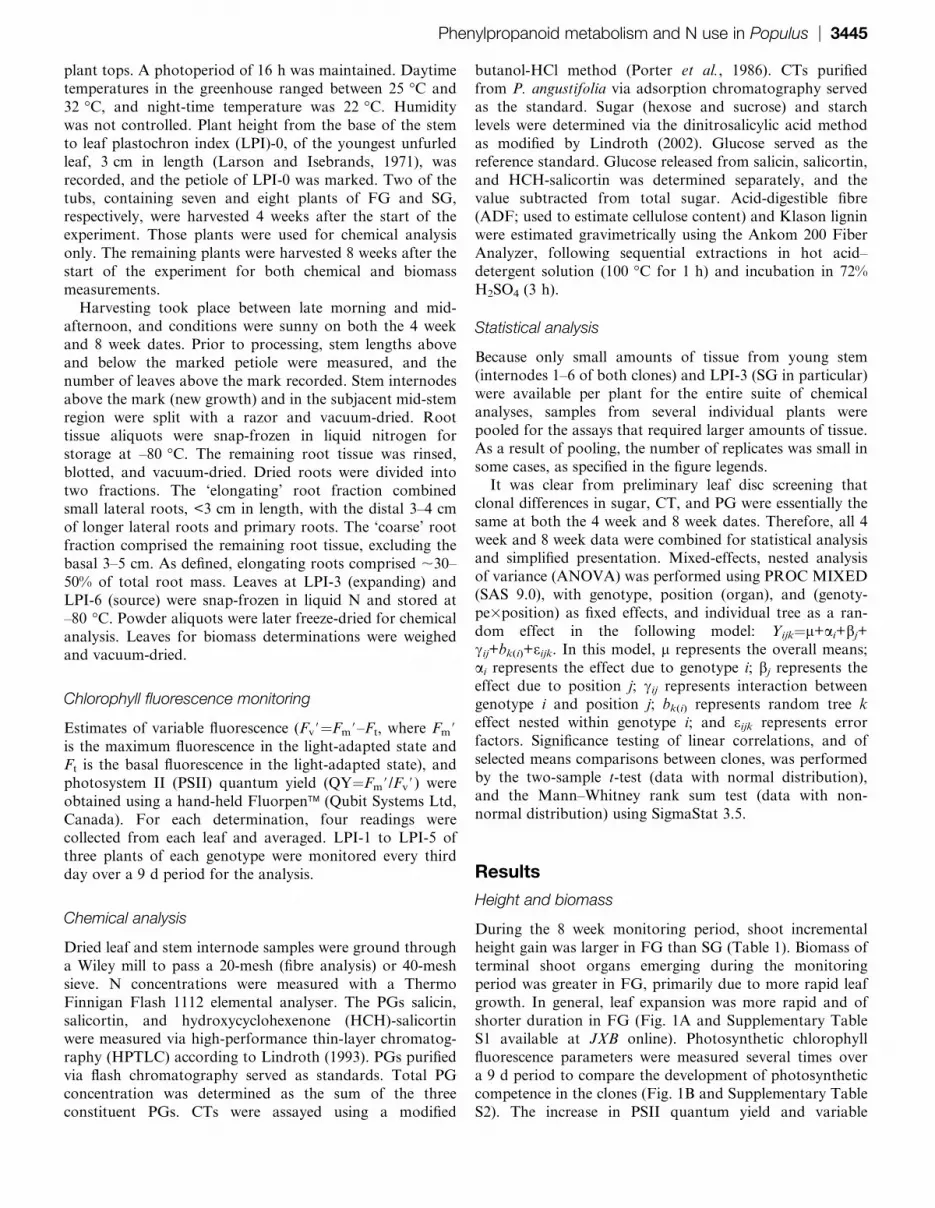
Non-structural components: In all organs analysed, NSPswere more abundant in SG than FG (Fig. 2; Supplementary
Tables S3, S4 at JXB online). In leaves, sharply higher CT
concentrations accounted for most of the NSP difference
Fig. 1. Leaf expansion and chlorophyll fluorescence. (A) Dry
masses of fully expanded leaves that occupied LPI positions +1,
–1, and –3, denoted as pre(+1), pre(–1) and pre(–3), respectively,
at the start of the 8 week experiment, and of expanding leaves
that occupied LPI positions 2, 4, 5, 8, and 10 at the time of
harvest. Data represent the means and SD of eight plants.
(B) Quantum yield of PSII and variable fluorescence of expanding
leaves. Data represent the means and SD of three plants
for each LPI position, each derived from the mean of 36
instrument readings.
A
B
0
4
8
16
20
Phen
olic
gly
cosi
des
(% d
ry w
t)
SG FG0
2
4
6
8
10
Con
dens
ed ta
nnin
s (%
dry
wt)
LPI-3 LPI-6Int 1-6Int 7-8Int 9-13elongating rootcoarse root
******
***
***
***
******
*****
**
12
Fig. 2. Tissue concentrations of NSP constituents, PG and CT, in
leaves, roots, and stem internodes of the two clones. (A) Phenolic
glycosides. (B) Condensed tannins. Shown are data (% dry weight)
from expanding leaf (LPI-3), fully expanded source leaf (LPI-6),
upper stem internodes near expanding leaves (Int 1–6), upper
stem internodes along a developmental gradient of maturing
source leaves (Int 7–8 and 9–13), and elongating root and coarse
root fractions. Internode number increases basipetally. Replicates
(n) ranged from 11 to 15 plants for each LPI, from 7 to 11 plants
for each subset of internodes, and from 15 to 16 plants for each
root fraction. Comparisons between clones were made for each
organ fraction shown. The two-sample t-test was used to
determine significance of differences between clone means,
indicated by asterisks above the SG histogram bars (*P <0.05;
**P <0.01; ***P <0.001).
Table 1. Height and biomass accrual of hydroponically grown
plants
Means and standard deviations of biometric data were determinedusing n¼8 plants of each genotype. Lower stem leaf biomassincluded twigs. Statistical significance of the difference betweenclone means was determined using the two-sample t-test forparametric data, and the Mann–Whitney rank sum test for non-parametric data (*).
SG FG t df P
Height
Initial height (IH, cm) 10668.8 118610.3 – – –
New height growth (NH, cm) 7863.6 10367.5 8.38 14 <0.001
Incremental change (NH/IH) 0.7460.06 0.8860.1 3.28 14 0.005
Upper stem (new growth) biomass
Leaf (g) 6.460.9 11.962.2 * * <0.001
Stem (g) 7.661.4 7.460.9 –0.46 14 0.656
Total (g) 14.162.1 19.262.9 4.09 14 0.001
Lower stem biomass
Leaf (g) 23.468.1 18.167.9 –1.27 14 0.224
Stem (g) 28.466.8 34.064.6 1.94 14 0.073
Root biomass
Root (g) 12.263.3 19.264.7 3.59 15 0.003
Root-to-shoot ratio 0.18 0.24 – – –
3446 | Harding et al.

between the two clones (Fig. 2B). In upper internodes,
concentrations of both CT and PG were 3- to 5-fold higher
in SG than in FG (Fig. 2). Soluble sugar concentrations
were generally similar in source leaves (LPI-6) of both
clones, but were higher in expanding leaves (LPI-3) of FG
than SG (Fig. 3A; Supplementary Tables S3, S4). In
contrast, soluble sugar contents were lower in the upper
stem internodes of FG than SG (Fig. 3A). Foliar starchconcentrations were higher in leaves and upper internodes
in SG than FG (Fig. 3B, C). NSP and non-structural
carbohydrate concentrations in elongating and coarse root
fractions, though substantial, were smaller than in
leaves, and differed little between clones (Figs 2, 3). Starch
concentrations were nearly identical in the elongating root
fraction of both clones, but were lower in the coarse root
fraction of FG than SG (Fig. 3B, C; Supplementary TablesS3, S4).
Structural components: Lignin content reached a sustained
maximum with respect to stem biomass much earlier in FG
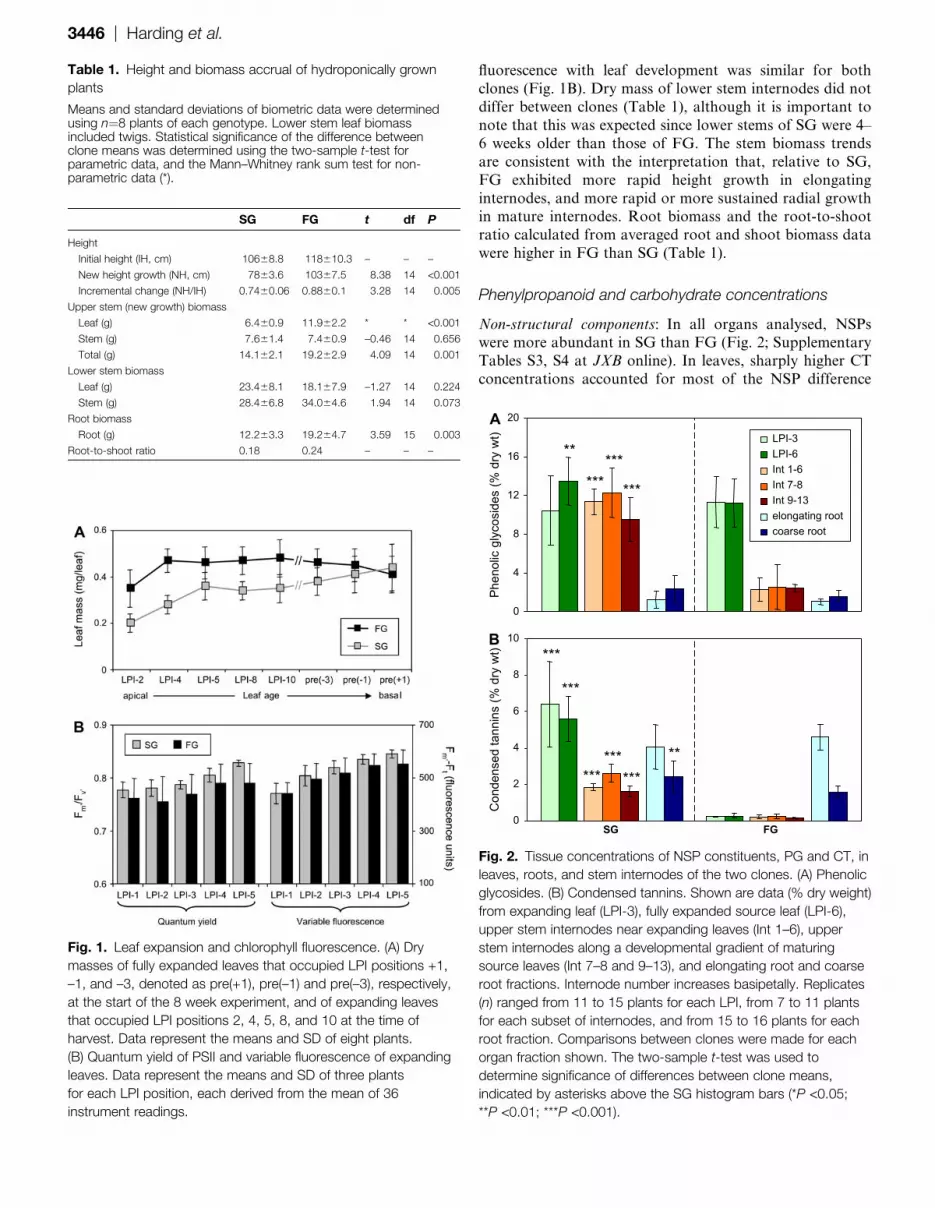
than in SG (Fig. 4A). A histological approach was used to
compare lignification and vascular development of pri-
mary–secondary transitional internodes 3–6. UV autofluor-
escence of stem cross-sections revealed that fibredevelopment and lignification were comparatively slow in
xylem, but not phloem, of SG relative to FG (Fig. 5). The
production of lignifying cells, based on the width of the
autofluorescing zone in the xylem at both stages of
internode growth, was more rapid in the FG clone (Fig. 5,
arrows). Together, the Klason lignin and histological data
were consistent with slowed xylem development relative to
diameter growth of young internodes in SG. Lignin
concentration increased between internode ;10 and mid-stem internodes 20–25 in SG, but not FG (Fig. 4A).
At all internodes analysed, cellulose was more abundant
than lignin, and exhibited a more uniform accrual trajectory
than did lignin (Fig. 4B). However, cellulose content was
substantially lower in stem internodes of SG compared with
FG. Of potential relevance to cellulose biosynthesis and
accrual was the observation that starch concentrations were
higher in stems and leaves of SG than FG (Fig. 3). Leaftissues were used to investigate the possibility of a clonal
difference in the metabolic relationship between starch and
cellulose biosynthesis (Fig. 6). Due to sample limitation (see
Materials and methods), leaf tissues, but not stem tissues,
offered sufficient replication to conduct the correlation
analysis. Strong individual plant entrainment of starch
metabolism throughout leaf expansion was observed in
***
0
4
8
12
16
20
Solu
ble
suga
rs (%
dry
wt)
LPI-3 LPI-6Int 1-6Int 7-8Int 9-13elongating rootcoarse root
A
B
0
2
4
6
8
10
Star
ch (%
dry
wt)
********
***
**
** ****
SG FG
Fig. 3. Tissue concentrations of (A) soluble sugars and (B) starch.
Shown are data (% dry weight) from expanding leaf (LPI-3), fully
expanded source leaf (LPI-6), upper stem internodes near
expanding leaves (Int 1–6), and upper stem internodes along
a developmental gradient of maturing source leaves (Int 7–8 and
9–13), and elongating root and coarse root fractions. Replicate
numbers and significance testing are as in Fig. 2.
A
B
0
5
10
15
20
25
Lign
in (%
dry
wt)
SG
FG
0
10
20
30
40
50
Int 1-6 Int 7-8 Int 9-10 Int 11-12 Int 20-25
Cel
lulo
se (%
dry
wt)
Fig. 4. Lignin and cellulose in developing stems. (A) Klason lignin
and (B) ADF cellulose (% dry weight). Each of the upper internode
data points (Int 7–8, Int 9–10) represents the mean and SD of 4–6
determinations. The mid-stem internode data points (Int 20–25)
represent the means of eight (SG) and 16 (FG) determinations. In
several cases, SD bars are present but are smaller than the data
symbol. Exceptions are the Int 1–6 and Int 11–12 data points
which represent single determinations from pooled stems with no
SD. Internode replicates (n) differ from those in Figs 2 and 3
because pooling of stem internodes necessary for lignin and
cellulose determinations differed from that for other stem internode
assays.
Phenylpropanoid metabolism and N use in Populus | 3447
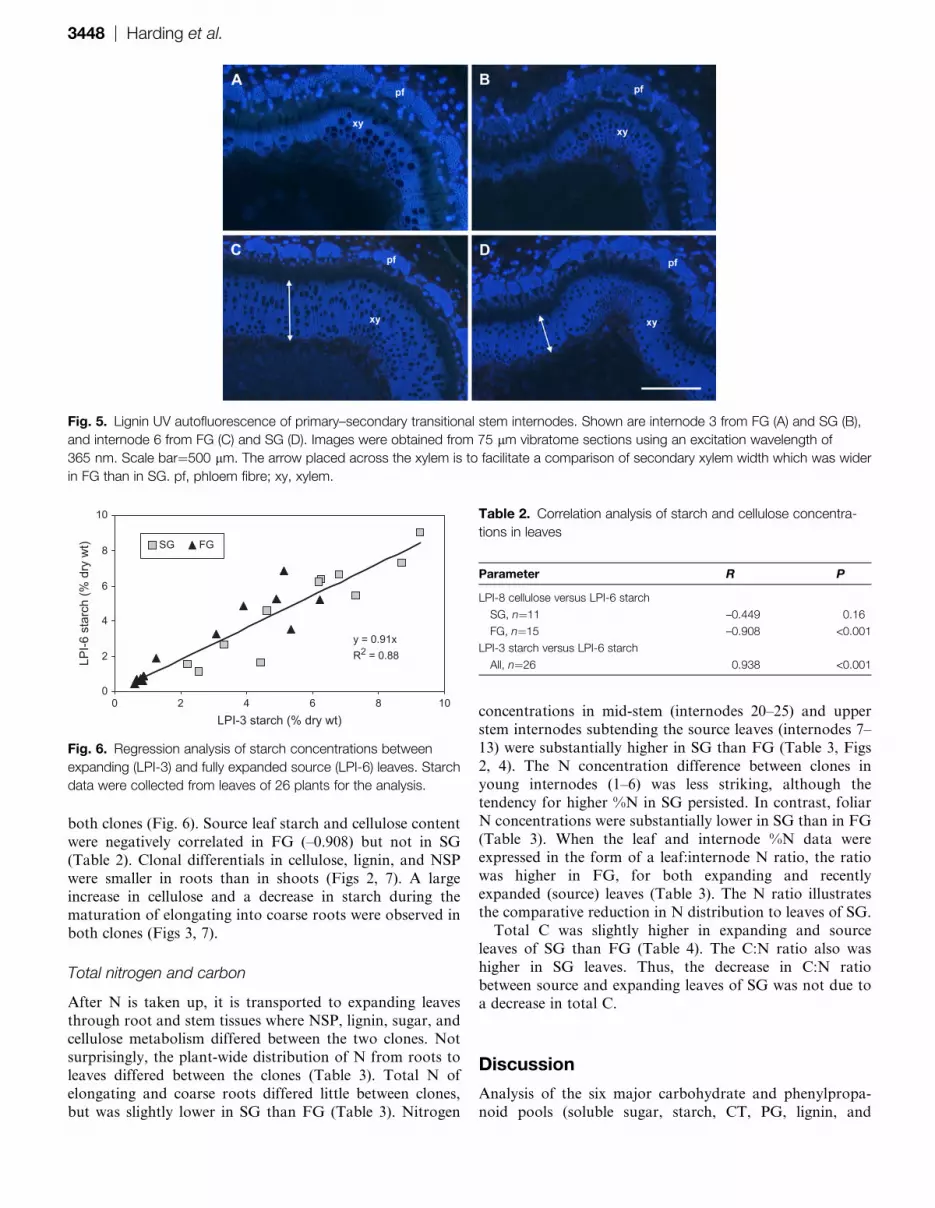
both clones (Fig. 6). Source leaf starch and cellulose content
were negatively correlated in FG (–0.908) but not in SG
(Table 2). Clonal differentials in cellulose, lignin, and NSP
were smaller in roots than in shoots (Figs 2, 7). A largeincrease in cellulose and a decrease in starch during the
maturation of elongating into coarse roots were observed in
both clones (Figs 3, 7).
Total nitrogen and carbon
After N is taken up, it is transported to expanding leaves
through root and stem tissues where NSP, lignin, sugar, andcellulose metabolism differed between the two clones. Not
surprisingly, the plant-wide distribution of N from roots to
leaves differed between the clones (Table 3). Total N of
elongating and coarse roots differed little between clones,
but was slightly lower in SG than FG (Table 3). Nitrogen
concentrations in mid-stem (internodes 20–25) and upper
stem internodes subtending the source leaves (internodes 7–
13) were substantially higher in SG than FG (Table 3, Figs
2, 4). The N concentration difference between clones in
young internodes (1–6) was less striking, although the
tendency for higher %N in SG persisted. In contrast, foliar
N concentrations were substantially lower in SG than in FG
(Table 3). When the leaf and internode %N data wereexpressed in the form of a leaf:internode N ratio, the ratio
was higher in FG, for both expanding and recently
expanded (source) leaves (Table 3). The N ratio illustrates
the comparative reduction in N distribution to leaves of SG.
Total C was slightly higher in expanding and source
leaves of SG than FG (Table 4). The C:N ratio also was
higher in SG leaves. Thus, the decrease in C:N ratio
between source and expanding leaves of SG was not due toa decrease in total C.
Discussion
Analysis of the six major carbohydrate and phenylpropa-
noid pools (soluble sugar, starch, CT, PG, lignin, and
Fig. 5. Lignin UV autofluorescence of primary–secondary transitional stem internodes. Shown are internode 3 from FG (A) and SG (B),
and internode 6 from FG (C) and SG (D). Images were obtained from 75 lm vibratome sections using an excitation wavelength of
365 nm. Scale bar¼500 lm. The arrow placed across the xylem is to facilitate a comparison of secondary xylem width which was wider
in FG than in SG. pf, phloem fibre; xy, xylem.
Table 2. Correlation analysis of starch and cellulose concentra-
tions in leaves
Parameter R P
LPI-8 cellulose versus LPI-6 starch
SG, n¼11 –0.449 0.16
FG, n¼15 –0.908 <0.001
LPI-3 starch versus LPI-6 starch
All, n¼26 0.938 <0.001
y = 0.91x R2 = 0.88
0
2
4
6
8
10
100 2 4 6 8 LPI-3 starch (% dry wt)
LPI-6
sta
rch
(% d
ry w
t) FG SG
Fig. 6. Regression analysis of starch concentrations between
expanding (LPI-3) and fully expanded source (LPI-6) leaves. Starch
data were collected from leaves of 26 plants for the analysis.
3448 | Harding et al.

cellulose) in developing leaves, stems, and roots of two
hybrid lines was undertaken as a systems approach to
determine whether foliar NSP biosynthesis causes, or di-
rectly contributes to, growth reduction in Populus. A trade-
off would be expected based on published data that growth
often correlates negatively with foliar NSP accrual in
Populus (Lindroth and Hwang, 1996). A metabolic basis
for such correlations has been offered in Salix (willow),where application of PAL-specific inhibitors reduced NSP
accrual while enhancing plant growth (Ruuhola and
Julkunen-Tiitto, 2003).
Recently it has become evident that negative effects of
high foliar NSP on Populus growth may only be significant
under conditions of limiting external N (Donaldson et al.,
2006a). This finding is in line with a central tenet of GBDH
that when growth is limited, and C is not, NSP accrual isfavoured (Herms and Mattson, 1992). The results showed
further that higher rates of foliar NSP accrual can indeed
pose a greater cost to growth when N becomes limiting
(Donaldson et al., 2006a). Based on the present findings,
GBDH can also be used to rationalize the foliar NSP
differences between genotypes, in this case SG and FG,
under N-replete conditions. Total leaf %C was slightly
higher in SG (Table 4), as were the contents of metaboli-cally active sugar and starch (Fig. 2). Together, the C and N
results are consistent with the interpretation that leaf
growth was comparatively N-limited in SG. In nearby stem
internodes, neither biomass growth nor %N was reduced in
SG, relative to FG, during the same period. Because it is
not clear how C availability limited SG leaf growth, the
results potentially provide a degree of validation for the
PCM tenet that phenylpropanoid competition for N withinexpanding SG leaves directly led to their reduced growth
rate (Jones and Hartley, 1999). However, molecular evi-
dence supports nitrate-N sensing rather than consumption
of phenylalanine-N as the basis for phenylpropanoid
stimulation in higher plants (Fritz et al., 2006).
It is worth noting the adaptive benefit that may be linked
with how foliar N supply, foliar NSP accrual, leaf growth,
and overall plant growth are integrated in SG. Foliar CTabundance is a characteristic that appears to vary with soil
N mineralization rates in the ancestral habitats of SG, FG,
and related hybrid genotypes (Schweitzer et al., 2004;
Fischer et al., 2006). This pattern may be of genetic
significance in that CT and other phenolics can affect soil
N cycling, and promote habitation of leach-prone environ-
ments by N-demanding plants (Northup et al., 1995;
Chapman et al., 2006). In such environments, slower plantgrowth may be favoured in exchange for improved soil N
sequestration. In other words, reduced provision of N to
leaves would slow plant growth, coupling growth rate with
the rate of soil N mineralization. In response to lower leaf
N, CT becomes a quantitatively important leaf C sink. In
turn, the CT-enriched detritus of such leaves continues to
promote soil N sequestration and to modulate soil N
mineralization into leach-susceptible forms (Northup et al.,1995; Chapman et al., 2006). Because nitrate reductase
activity is generally low in roots of Populus (Black et al.,
Table 3. Leaf, internode and root total N concentration and
internode-to-leaf ratios in new growth
Total N (% dry weight) data were pooled from both harvests of FGand SG plants. Means and standard deviations were obtained fromat least n¼8 SG and n¼15 FG plants. Statistical significance of thedifferences between clone means was determined using the two-sample t-test for parametric data, and the Mann–Whitney rank sumtest for non-parametric data (*).
SG FG t df P
Expanding leaf 3.560.30 4.260.46 –4.10 24 <0.001
Expanding leaf internodes (1–6) 2.360.24 1.960.49 * * 0.04
Leaf-to-internode ratio 1.5 2.1 – – –
Source leaf 2.960.19 3.960.45 –7.12 24 <0.001
Source leaf internodes (7–13) 2.160.30 1.660.44 3.89 31 <0.001
Leaf-to-internode ratio 1.4 2.4 – – –
Mid-stem internodes 1.660.2 1.260.2 4.42 21 <0.001
Elongating root 3.160.24 3.360.3 –2.29 29 0.03
Coarse root 2.260.15 2.460.2 –1.92 29 0.06
Table 4. Total leaf C content and C:N ratio
Data were pooled from both harvests of FG and SG plants. Meansand standard deviations were obtained from n¼8 (SG) or n¼15 (FG)plants. As determined by two sample t-test, differences betweengenotypes were significant (P <0.001) for all comparisons, and theC:N ratio differed significantly between expanding and source leaf inSG (P <0.001).
SG FG
Total C
Expanding leaf 46.7160.29 45.8860.67
Source leaf 46.6360.97 45.4260.51
C:N ratio
Expanding leaf 13.3161.04 11.0761.25
Source leaf 16.2561.08 11.7661.27
0
10
20
30
40 %
Dry
wei
ght
elongating root coarse root elongating root coarse root
Lignin Cellulose
******
**
SG FG
Fig. 7. Lignin and cellulose concentrations in root fractions. (A)
Klason lignin of elongating and coarse root fractions and (B) ADF
cellulose of elongating and coarse root fractions (both in % dry
weight). Histogram means and SD were determined from n¼14–15
replicates. The two-sample t-test was used to determine signif-
icance of differences between clone means, indicated by asterisks
above the SG histogram bars (**P <0.01; ***P <0.001).
Phenylpropanoid metabolism and N use in Populus | 3449

2002), nitrate-N is an important N transport form in these
species (Siebrecht and Tischner, 1999). In turn, variation in
nitrate availability due to soil/climate conditions could be
an important modulator of phenylpropanoid metabolism
and, perhaps, biomass accrual during Populus ontogeny.
The observations that soluble sugar concentrations were
not reduced and that both starch and CT were elevated in
SG source leaves argue against the idea that leaf demandfor N in that genotype was limited by low rates of C
fixation. This is supported by data showing that the C:N
ratio of SG leaves was ;20–40% higher than that of FG
leaves (Table 4). Chlorophyll fluorescence parameters used
to gauge clonal differences in the efficiency of light
utilization according to Genty et al. (1989) did not provide
any indication that photosynthetic development followed
a different trajectory in SG than in FG (Fig. 1). For bothgenotypes the increase in variable fluorescence (Fv) with leaf
maturation was significant, but there was not a significant
effect of genotype on Fv (Supplementary Table S2 at JXB
online). The quantum yield of PSII did not differ by leaf age
or genotype. From the chlorophyll fluorescence data it does
not appear that the genotype differences in leaf C partition-
ing resulted from, or fundamentally altered, light harvesting
and photosynthesis.A decrease of soluble sugars in the expanding leaf
compared with the source leaf was observed in SG but not
FG (Fig. 2). The sugar concentration gradient observed
between source and sink leaves of SG could be due to
a combination of slowed secondary xylem development in
the connecting internodes (Figs 4, 5) and/or enhanced levels
of sugar-demanding metabolic activities there. Mass trans-
port of water through the xylem is an important facilitator
of phloem sugar transport in taxa such as Salix and Populus
where phloem loading is passive (Munch, 1930; Turgeon
and Medville, 1998). Therefore, a reduced rate of secondary
xylem growth in younger internodes could affect the phloemtransport of sugars. In addition, source leaf sugars destined
for expanding leaves were routed through a region of
developing internodes that was highly NSP enriched in SG.
Primary internodes are one likely site of PG biosynthesis in
Populus and related taxa (Clausen et al., 1989) and,
therefore, the internodes could exhibit enhanced sink
strength relative to developing leaves. The predominant PG
in both clones is salicortin (Rehill et al., 2005) which is 42%glucose by weight. Therefore, the relatively high PG content
of young SG internodes (;12% dry weight versus ;3% in
FG) may reflect a substantial demand for soluble sugars, in
addition to the basal C demand for phenylpropanoid
skeletons. The high level of stem NSP biosynthesis could
thus affect growth by competing with younger, more sink-
like leaves, for soluble sugars in the transport stream. It is
also possible that demand by expanding SG leaves forimported sugars was low due to an effect of slower xylem
development on N delivery.
A unifying and interpretive scenario of the present
findings is shown in Fig. 8. A cumulative effect of some
Fig. 8. Proposed phenylpropanoid effects on N distribution and vascular development in SG and FG. Enhanced lignification in roots and
lower stems of SG is proposed to reduce N distribution, represented by the term ‘flux’, into upper internodes. A decrease in foliar %N
results, which favours starch and CT accrual at the expense of cellulose deposition in developing vascular traces. With less cellulose
scaffolding, lignification is reduced and NSPs such as the PGs become the predominant phenylpropanoids. Ultimately, both reduced
vascular development and high sugar demand for NSP biosynthesis interfere with the provision to expanding leaves in SG.
3450 | Harding et al.
metabolic process(s) in roots and stems on N distribution is
posited to reduce the provision of N to expanding leaves
while promoting pooling of N in SG stems. While starch
and CT were both elevated in leaves of SG, consistent with
a perceived N limitation, cellulose accrual was lower than in
FG. In contrast to FG, there was not a correlation between
foliar starch and cellulose contents in SG. The absence of
a correlation could reflect strong interference by competingsynthetic activities for starch-derived glucose in SG. Under
the circumstances of lower foliar N in SG, CT synthesis
could be an important alternative destination for starch
glucose. Because cellulose precedes lignin deposition during
secondary cell wall growth (Mellerowicz et al., 2001),
reduced cellulose synthesis could have interfered with
lignification of vascular traces, explaining the reduced xylem
fluorescence in elongating internodes of SG (Figs 4, 5). Aloop would thereby be constituted in which reduced
vascular growth in upper stems further impeded N delivery
to leaves. In general, the scenario illustrates how the
relatively low amino acid concentrations commonly ob-
served in leaf metabolic profiles of slower growing, high
foliar NSP clones (Harding et al., 2005) could reflect a foliar
N limitation, due to an inefficient transport system and/or
an N-sequestering process in secondary stems and roots.The use of labelled N will be necessary to determine
unequivocally the nature of N flux differences between SG
and FG referred to in Fig. 8. Besides phenylpropanoid
synthesis, important determinants of variable N flux in trees
also include N remobilization from storage reserves, and
reallocation of N between roots and shoots according to
seasonal growth demands (Millard, 1996; Grassi et al., 2003,
and references therein). The present findings that nutrientdistribution to leaves may be conditioned by metabolic
processes related to stem N use are partially analogous to
findings of others that vascular architectural heterogeneity
affects leaf provision and growth (Orians et al., 2002, and
references therein). Integration of gene networks that control
vascular architecture and chemistry remains a relatively
unexplored topic for future investigation.
Supplementary data
Results of the mixed-model, nested ANOVA for CT, PG,
soluble sugars, and starch are available in Supplementary
Tables S1–S4 at JXB online
Acknowledgements
The authors express their gratitude to Adam Gusse for
excellence in tissue chemical analysis, and to Professor
Thomas Whitham (Northern Arizona University) for pro-viding the cottonwood genotypes. This research was sup-
ported by the US Department of Energy’s Biological and
Environmental Research Program DE-FG02-05ER64112
and by the National Science Foundation Plant Genome
Program DBI-0421756.
References
Agrell J, McDonald EP, Lindroth RL. 2000. Effects of CO2 and light
on tree phytochemistry and insect performance. Oikos 88, 259–272.
Arnold T, Appel H, Patel V, Stocum E, Kavalier A, Schultz J.
2004. Carbohydrate translocation determines the phenolic content of
Populus foliage: a test of the sink–source model of plant defense. New
Phytologist 164, 157–164.
Black BL, Fuchigami LH, Coleman GD. 2002. Partitioning of nitrate
assimilation among leaves, stems and roots of poplar. Tree Physiology
22, 717–724.
Bryant JP, Chapin FS, Klein DR. 1983. Carbon nutrient balance of
boreal plants in relation to vertebrate herbivory. Oikos 40, 357–368.
Chapman SK, Langley JA, Hart SC, Koch GW. 2006. Plants
actively control nitrogen cycling: uncorking the microbial bottleneck.
New Phytologist 169, 27–34.
Clausen TP, Evans TP, Reichardt PB. 1989. A simple method for
the isolation of salicortin, tremulacin, and tremuloiden from quaking
aspen (Populus tremuloides). Journal of Natural Products 52,
207–209.
Donaldson JR, Kruger EL, Lindroth RL. 2006a. Competition- and
resource-mediated tradeoffs between growth and defensive chemistry
in trembling aspen (Populus tremuloides). New Phytologist 169,
561–570.
Donaldson JR, Stevens MT, Barnhill HR, Lindroth RL. 2006b.
Age-related shifts in leaf chemistry of clonal aspen (Populus
tremuloides). Journal of Chemical Ecology 32, 1415–1429.
Fischer DG, Hart SC, Rehill BJ, Lindroth RL, Keim P,
Whitham TG. 2006. Do high-tannin leaves require more roots?
Oecologia 149, 668–675.
Foyer CH, Noctor G, van Emden HF. 2007. An evaluation of the
costs of making specific secondary metabolites: does the yield penalty
incurred by host plant resistance to insects result from competition for
resources? International Journal of Pest Management 53, 175–182.
Fritz C, Palacios-Rojas N, Feil R, Stitt M. 2006. Regulation of
secondary metabolism by the carbon–nitrogen status in tobacco:
nitrate inhibits large sectors of phenylpropanoid metabolism. The Plant
Journal 46, 533–548.
Genty B, Briantais JM, Baker NR. 1989. The relationship between
the quantum yield of photosynthetic electron transport and quenching
of chlorophyll fluorescence. Biochimica et Biophysica Acta 990, 87–92.
Glynn C, Herms DA, Orians CM, Hansen RC, Larsson S. 2007.
Testing the growth–differentiation balance hypothesis: dynamic
responses of willows to nutrient availability. New Phytologist 176,
623–634.
Grassi G, Millard P, Gioacchini P, Tagliavini M. 2003. Recycling of
nitrogen in the xylem of Prunus avium trees starts when spring
remobilization of internal reserves declines. Tree Physiology 23,
1061–1068.
Hamilton JG, Zangerl AR, DeLucia EH, Berenbaum MR. 2001.
The carbon–nutrient balance hypothesis: its rise and fall. Ecology
Letters 4, 86–95.
Harding SA, Jiang HY, Jeong ML, Casado FL, Lin HW, Tsai CJ.
2005. Functional genomics analysis of foliar condensed tannin and
Phenylpropanoid metabolism and N use in Populus | 3451
phenolic glycoside regulation in natural cottonwood hybrids. Tree
Physiology 25, 1475–1486.
Herms DA, Mattson WJ. 1992. The dilemma of plants—to grow or
defend. Quarterly Review of Biology 67, 283–335.
Honkanen T, Haukioja E, Kitunen V. 1999. Responses of Pinus
sylvestris branches to simulated herbivory are modified by tree sink/
source dynamics and by external resources. Functional Ecology 13,
126–140.
Jones CG, Hartley SE. 1999. A protein competition model of
phenolic allocation. Oikos 86, 27–44.
Kandil FE, Grace MH, Seigler DS, Cheeseman JM. 2004.
Polyphenolics in Rhizophora mangle L. leaves and their changes
during leaf development and senescence. Trees—Structure and
Function 18, 518–528.
Keski-Saari S, Falck M, Heinonen J, Zon J, Julkunen-Tiitto R.
2007. Phenolics during early development of Betula pubescens
seedlings: inhibition of phenylalanine ammonia lyase. Trees—Structure
and Function 21, 263–272.
Kleiner KW, Raffa KF, Dickson RE. 1999. Partitioning of C-14-
labeled photosynthate to allelochemicals and primary metabolites in
source and sink leaves of aspen: evidence for secondary metabolite
turnover. Oecologia 119, 408–418.
Koricheva J. 2002. Meta-analysis of sources of variation in fitness
costs of plant antiherbivore defenses. Ecology 83, 176–190.
Larson PR, Isebrands JG. 1971. The plastochron index as applied
to developmental studies of cottonwood. Canadian Journal of Forest
Research-Revue Canadienne De Recherche Forestiere 1, 1–11.
Lindroth RL, Hwang SY. 1996. Diversity, redundancy and multiplicity
in chemical defense systems of aspen. In: Romeo JT, Saunders JA,
Barbosa P, eds. Phytochemical diversity and redundancy in ecological
interactions. New York: Plenum Press, 25–56.
Lindroth RL, Kinney KK, Platz CL. 1993. Responses of deciduous
trees to elevated atmospheric CO2—productivity, phytochemistry, and
insect performance. Ecology 74, 763–777.
Lindroth RL, Osier TL, Barnhill HRH, Wood SA. 2002. Effects of
genotype and nutrient availability on phytochemistry of trembling
aspen (Populus tremuloides Michx.) during leaf senescence. Bio-
chemical Systematics and Ecology 30, 297–307.
Matt P, Krapp A, Haake V, Mock HP, Stitt M. 2002. Decreased
Rubisco activity leads to dramatic changes of nitrate metabolism,
amino acid metabolism and the levels of phenylpropanoids and
nicotine in tobacco antisense RBCS transformants. The Plant Journal
30, 663–677.
Mattson WJ, Julkunen-Tiitto R, Herms DA. 2005. CO2 enrichment
and carbon partitioning to phenolics: do plant responses accord better
with the protein competition or the growth differentiation balance
models? Oikos 111, 337–347.
Mellerowicz EJ, Baucher M, Sundberg B, Boerjan W. 2001.
Unravelling cell wall formation in the woody dicot stem. Plant
Molecular Biology 47, 239–274.
Millard P. 1996. Ecophysiology of the internal cycling of nitrogen for tree
growth. Zeitschrift fur Pflanzenernahrung und Bodenkunde 159, 1–10.
Munch E. 1930. Die Stoffbewegungen in der Pflanze. Jena, Germany:
Gustav Fischer.
Northup RR, Yu ZS, Dahlgren RA, Vogt KA. 1995. Polyphenol
control of nitrogen release from pine litter. Nature 377, 227–229.
Orians CM, Ardon M, Mohammad BA. 2002. Vascular architecture
and patchy nutrient availability generate within-plant heterogeneity in
plant traits important to herbivores. American Journal of Botany 89,
270–278.
Osier TL, Lindroth RL. 2001. Effects of genotype, nutrient availabil-
ity, and defoliation on aspen phytochemistry and insect performance.
Journal of Chemical Ecology 27, 1289–1313.
Osier TL, Lindroth RL. 2006. Genotype and environment determine
allocation to and costs of resistance in quaking aspen. Oecologia 148,
293–303.
Porter LJ, Hrstich LN, Chan BG. 1986. The conversion of
procyanidins and prodelphinidins to cyanidin and delphinidin.
Phytochemistry 25, 223–230.
Rehill B, Clauss A, Wieczorek L, Whitham T, Lindroth R. 2005.
Foliar phenolic glycosides from Populus fremontii, Populus angustifo-
lia, and their hybrids. Biochemical Systematics and Ecology 33,
125–131.
Ruuhola T, Julkunen-Tiitto R. 2003. Trade-off between synthesis of
salicylates and growth of micropropagated Salix pentandra. Journal of
Chemical Ecology 29, 1565–1588.
Ruuhola TM, Julkunen-Tiitto MRK. 2000. Salicylates of intact Salix
myrsinifolia plantlets do not undergo rapid metabolic turnover. Plant
Physiology 122, 895–905.
Schweitzer JA, Bailey JK, Rehill BJ, Martinsen GD, Hart SC,
Lindroth RL, Keim P, Whitham TG. 2004. Genetically based trait in
a dominant tree affects ecosystem processes. Ecology Letters 7,
127–134.
Siebrecht S, Tischner R. 1999. Changes in the xylem exudate
composition of poplar (Populus tremula3P. alba)—dependent on the
nitrogen and potassium supply. Journal of Experimental Botany 50,
1797–1806.
Singh S, Lewis NG, Towers GHN. 1998. Nitrogen recycling during
phenylpropanoid metabolism in sweet potato tubers. Journal of Plant
Physiology 153, 316–323.
Stamp N. 2003. Out of the quagmire of plant defense hypotheses.
Quarterly Review of Biology 78, 23–55.
Turgeon R, Medville R. 1998. The absence of phloem loading in
willow leaves. Proceedings of the National Academy of Sciences, USA
95, 12055–12060.
vanHeerden PS, Towers GHN, Lewis NG. 1996. Nitrogen
metabolism in lignifying Pinus taeda cell cultures. Journal of Biological
Chemistry 271, 12350–12355.
Woolbright SA, DiFazio SP, Yin T, Martinsen GD, Zhang X,
Allan GJ, Whitham TG, Keim P. 2008. A dense linkage map of
hybrid cottonwood (Populus fremontii3P. angustifolia) contributes to
long-term ecological research and comparison mapping in a model
forest tree. Heredity 100, 59–70.
Wullschleger S, Yin TM, DiFazio SP, Tschaplinski TJ, Gunter LE,
Davis MF, Tuskan GA. 2005. Phenotypic variation in growth and
biomass distribution for two advanced-generation pedigrees of
hybrid poplar. Canadian Journal of Forest Research 35,
1779–1789.
3452 | Harding et al.


