Embed Size (px)
Citation preview
PHYSIOL. PLANT. 54: 393-401. Copenhagen 1982
Fixation and distribution of "̂̂C in Populus deltoides duringdormancy induction
Richard £. Dickson and Eric A. Nelson
Dickson, R. E. and Nelson, E. A. 1982. Fixation and distribution of ' t in Populusdeltoides during dormancy induction. — Physiol. Plant. 54: 393-401.
Photosynthetically fixed "C was analyzed in various chemical fractions from leavesand stems of cottonwood {Fopultis deltoides Bartr. ex. Marsh.) during dormancyinduction. Dormancy was induced by 8-h photoperiods and 20/I4°C temperatureregimes. Within 4 weeks under short days, terminal buds were set and leaf expansionand stem elongation had stopped. '"^CO, was fed to a leaf at Leaf Plastochron Index 7for 30 min. Either after this 30 min feeding period or after a 48-h trarsslocationperiod the plants were sampled, freeze-dried, extracted and analyzed for ' t .
'̂*C-fixation decreased during dormancy induction from 60% to 17% of the 3.7 MBq' •^ applied at 0 week and 8 weeks, respectively. Percentage distribution of "C inchemical fractions of source leaves reflected leaf age and translocation inhibition. Inrapidly growing plants, considerable "C was incorporated into leaf protein whilemost of the soluble '̂ ''C-sugars were either metabolized or translocated out of the leaf.After terminal bud set, the percentage of "C in the protein and residue fractionsdecreased rapidly and that ira the sugar fraction increased. Percent distribution instems closely reflected changing metabolic pathways of carbon flow as influenced bydormancy induction. For example, the ' " t in structural carbohydrates decreased in 5weeks under short days from 65 to less than 10% of the ''*C recovered in the chemicalfractions, thus indicating cambium inhibition. At the same time the percentage of ' ' ^in starch and sugar increased indicating storage. Short term (after 30 min) incorpora-tion of "C into the protein and starch fractions of leaves changed relatively littlethroughout the 8-week induction period. In contrast the turnover rates of thesefractions ("C present after 48 h) increased considerably after active growth ofthewhole plant stopped.
Additional key-words - Cottonwood, leaf development, leaf senescence, starch-protein turnover, storage products, sugar, transiocation.
R. E. Dickson (reprint requests). Forestry Sciences Lab., North Central Forest Ex-periment Station, USDA, Forest Service, Rhinelander, WI 54501, USA; E. A. Nelson,Central Forest Res. Center, Westvaco Corp., P.O. Box 458, Wickliffe, KY 42087,USA.
J . . the rapid growth phase, most photosynthate is used inn ro uc ion ^^^ production of new leaf and stem tissue, ln the fall
Cottonwood {Populus deltoides Bartr. ex. Marsh.) trees transition phase, leaf and stem growth stops and thego through four distinct phases dtiring the year; a tran- photosynthate now moves into stem and root storagesition phase from dormancy to rapid growth in early pools. During the dormant phase, little translocationspring, a rapid growth phase during late spring and early takes place; however, there are a variety of activesummer, a transition phase from growth to dortnancy metabolic processes that shift storage products back andduring late summer and fall, and a dormant phase dur- forth from insoluble to soluble pools or from one pro-ing winter. Translocation patterns and utilization of dnct to another. Chenaical analyses of tissue to deter-fixed carbon differ dudng each of these phases. During mine different storage and translocation products have
Received 16 September, 1981; revised 30 November, 1981
. Plant. 54,1982 0031-9317/82/040393-09 $03.00/0 © 1982 Physiologia Plantarum 393

been used to establish the general patterns of seasonalcarbon flow (Ishibe 1935, Zeigler 1964, Kandiah1979a, Kramer and Kozlowski 1979). Additional re-search has utilized "̂"C to follow the distribution andsubsequent utilization of carbon fixed at different timesof the year in both conifers (Gordon and Larson 1968,1970, Glerum and Balatinecz 1980) and hardwoods(Hansen and Grauslund 1973, Kandiah 1979b).
Recent studies on dormancy induction in cottonwoodhave concentrated on anatomical changes in buds andstems (Goffinet and Larson 1981) and on the accumu-lation of storage products in stems (Nelson and Dickson1981). The objective of this complementary study wasto follow (1) the photosynthetic fixation of ^''COj andthe distribution of ' t among different chemical frac-tions of both leaves and stems; and (2) the translocationof photosynthate from mature leaves to developing leafand stem sinks as plants progressed from active vegeta-tive growth to bud set and dormancy. Such '*C-tracerstudies revealed features of the deposition and turnoverof carbohydrate and other chemical fractions that wouldnot be possible to determine with total analyses of thesechemical fractions. In addition, it was possible, in a par-ticular stem section, to distinguish betvifeen carbohy-drate exported from a particular source leaf from thatproduced elsewhere. Such information is necessary inorder to understand the developmental physiology ofcottonwood.
Abbreviations - PI, Plastochron Index; LPl, Leaf PlastochronIndex, SD, Short Days; LD, Long Days.
Materials and methods
Plaot material
Cottonwood plants (Populus deltoides Bartr. ex.Marsh.) were grown from seed under controlled en-vironmental conditions in pots of quartz sand subirri-gated with a complete nutrient solution as describedpreviously (Dickson 1977). At a Plastochron Index (PI;Larson and Isebrands 1971, Lamoreaux et al. 1978) of12 to 14 the plants were moved into the dormancy in-ducing regime. Additional seedlings were maintainedtmder long-day (LD) conditions as controls (Nelson andDickson 1981). The dormancy inducing regime was an8-h photoperiod of 40 W m"̂ (400-700 nm, SylvaniaLifeline 96, F96 T12/CWT/VHO, GTE, Sylvania,Danvers, MA 01923), 20/14°C day-night temperatureand 'fe strength nutrient solution (Dickson 1977).
'••C treatments
Long-day control plants at PI 14, 20, and 26 and plantslinder short days (SD) were photosynthetically labeledwith 3.7 MBq of "COj for 30 min (1 nC = 37 kBq).Plants were placed in the treatment chamber andequilibrated for 1 h before treatment. A single leaf at
Leaf Plastochron Index (LPI) 7 was placed in a plexi-glass chamber and labeled under conditions describedpreviously (Dickson 1977). The control plants treatedat PI 14, 20, and 26 were approximately the same PI asSD plants at 0, 2, and 4 weeks under short days. TwoSD plants were randomly chosen and treated each weekfor 8 weeks. The plants were treated and returned to asmall growth chamber under SD for a 48-h transloca-tion period before harvest.
To examine the short-term distribution of fixed"^02, a second series of plants was grown under SD,treated with 3.7 MBq of "COj for 30 min and imme-diately harvested. Two replications of these plants weretreated after 0, 2, 4, 6, and 8 weeks under SD.
Harvest and sampling procedures
During harvest and subsampling, plants were sub-divided into three leaf fractions: developing leaves(pooled LPI 0 to 4), source leaf (LPl 7), and matureleaves (pooled LPI 5, 6, 8, and all other leaves sub-tending the source leaf); and four stem samples: stemsample one (bud and stem, both nodes and internodesdown to LPI 6), stem sample two (sample associatedwith the source leaf — all tissue subtending LPI 6, 7, and8), stem sample three (all tissue subtending leaf LPI 9down to the 6th leaf from the stem base), stem samplefour (all tissue between the 6th leaf and the cotyledonscars (Fig. 1). After harvesting, the stem samples were
< }€>O
co
Fig. 1. Diagram of an 18 leaf cottonwood plant showing thesampling scheme and sample identification. Three leaf frac-tions; developing leaves (pooled LPI 0 to 4), source leaf(LPI 7), mature leaves (pooled LPl 5, 6, 8, and all other leavessubtending the source leaf). Four stem fractions; sample 1 (budand stem down to LPl 6), sample 2 (sample associated with thesource leaf-stem tissue LPI 6, 7, 8) sample 3 (stem tissue sub-tending LPl 9 down to the 6th leaf from the stem base), sample4 (stem tissue between the 6th leaf and the cotyledons).
394 Physiol. Ptanl. 54, t9S2
separated into bark and xylem. All samples were quick-frozen, freeze-dried, ground to pass a 40-mesh Wileyscreen, and stored over Drierite at .-15°C untilanalyzed. Two LD growth room control plants weretreated and harvested at FI 14, 20, and 26 as above.
Extractinn and "^-determination
Total •'''C in the plant samples was determined witheither NCS<™> or PCS*'̂ "' (prepared solubilizers,Amersham/Searle, Arlington Heights, IL 60005). Leafmaterial (5 mg dry wt) was solubilized in NCS (0.1 mlH2O, 1.0 ml NCS) and counted in Spectrofluor (63 mlSpectrofluor per 1 toluene). Three drops of glacial ace-tic acid were added after solubilization to acidify thesample and reduce chemical fluorescence. Stem mat-erial (10 mg dry wt) was suspended and counted withPCS (4 ml H2O, extract 2 h, add 11 ml PCS, shake, andcount the resulting gel).
Activity in the individual chemical fractions was de-termined by liquid scintiOation spectrometry after ex-traction of leaf (5 mg dry wt), bark (10 mg dry wt), andxylem (10 mg dry wt) with methanol:chloroform:water(MCW; 12:5:3 v:v:v); and separation with a combina-tion of solvent, ion-exchange, and enzymatic techniques(Dickson 1979).
Specific activity was determined for both sugar andstarch in 25 mg samples of both source leaf and the stemsample associated with the source leaf. Total solublesugars were extracted with MCW, hydrolyzed with0.1 M HCl, and determined colorimetrically with3,5-dinitrosaIicylic acid (Clayton and Meredith 1966).enzymes, Clarase 900<''> and Diazyme 325"" (MilesLaboratory, Marshall Division, Elkhart, IN 46514;Haissig and Dickson 1979). The hydrolysate was thenanalyzed colorimetrically for glucose with o-toluidine(Cooper and McDaniel 1970).
The individual sugars were separated with thin-layerchromatography (TLC). After sampling to determinetotal soluble sugars, the neutral fraction of the water-alcohol phase of the MCW extract was separated fromamino acids and organic acids with ion exchange resins,dried in a vacuum oven (4O''C), and redissolved in 0.5ml of 50% ethanol. The neutral fraction containing thesoluble sugars was spotted (10 |il) on the TLC plate(Gelman SA, Gelman Inst. Co., Ann Arbor, MI48106), separated with two runs of ethyl acetate:glacialacetic acid:water (72:20:12) and developed withnaphthoresorcinol (100 ml absolute ethanol, 20 mgnaphthoresorcinol and 10 ml cone. H3PO4) at 100°C for10 min. Duplicate samples were spotted side-by-side.After separation, one unknown was masked duringcolor development. Sections of the TLC sheet contain-ing the undeveloped sugars were cut out, solubilizedwith NCS, and counted with liquid scintillation spec-trometry.
Results
Total "C recovered and its disliibutlon
Total '"C recovered after 48 h from LD control plantsranged from 60 to 70% of that applied (Tab. 1). Leavesof LD plants contained 80 to 90% of the "C whilethe stems contained 10 to 20% of that recovered. Ac-tivity decreased in stems and increased in leaves as theLD plants increased in size, primarily because thesource leaf at LPl 7 was relatively younger in a 26 leafplant compared to a 14 leaf plant and retained more ofthe fixed * t . In addition, a greater proportion of thephotosynthate exported from a leaf at LPI 7 would betranslocated to the young developing leaves comparedto the lower stem in a 26 leaf plant.
Total "C recovered from plants grown tmder SDranged from 59 to 17% of that applied (Tab. 1). "C inthe stems increased for 4-5 weeks, then decreased.Concomitantly, "C in leaves decreased then increased.The total ' t recovered is given in Tab. 1 as a basis forcomparing the percentage distributions. Variability ofthe tota] '''C fixed increased as the plants went dormantunder SD. Part of this variation could be attributed todifferent degrees of senescence in the randomly chosenplants. However, some plants that appeared very similarin degree of ieaf retention, chlorophyll content, andproportion of senescent tissue also varied widely in total^X: fixed. Even though the total " t fixed by differentleaves varied widely, the percentage distribution of that' t among chemical fractions and within the plant wasfairly uniform.
Young developing leaves were strong sinks forphotosynthate and contained about 40% of the "C re-covered from control plants (0 weeks. Fig. 2A). Trans-location to these developing leaves decreased rapidlyunder SD, paralleling the decreasing production and
Tab. 1. Total '*C recovered and its percentage distribution instem and leaves during dormancy induction. Recovery basedon 3.7 MBq applied, " t recovered 48 h after treatment. Val-ues and percentages are the average of two trees per treatment.S = Standard deviation.
14 leaf plant20 leaf plant26 leaf plant
1 week2345678
Total
MBq±S
2.22 ±0.0842.76±0.0032.60±0.395
2.18±O.O471.49+0.7921.84±0.5251.02±0.256L03±0.2870.54±0.3710.71±0.3040.63±0.464
recovered
Control60.074.670.2
% »C
in stems
plants18.212.69.6
in leaves
81.887.490.4
Plants under short days59.040.249.527.627.714.519.317.1
22.317.225.538.436.426.913.611.1
77.782.874.561.663.673.186.488.9
Physiot. Planl. 54, 19S2 395

WEEKS UNDER SHORT DWS
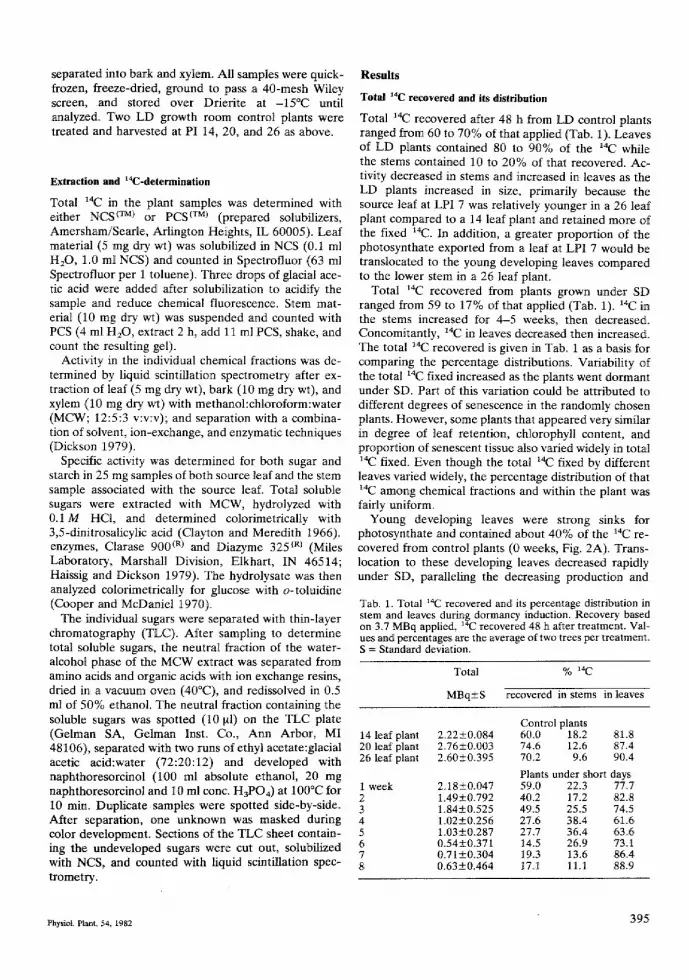
Fig. 2. Distribution of total ^^ within cottonwood plants andthe changes associated with dormancy induction. Percentagesare based on total ^ ^ recovered in plants 48 h after release of' t O j to the source leaf. (A) Leaves. (B) Stems. For a de-scription of the leaf and stem samples see Fig. 1. Each point onthe stem curves includes '"C io both bark and xylem. Rangebars are given for the source leaf and stem sample 3 to indicatethe variability of the data. For points with no bars the range didnot exceed the size of the symbol.
expansion of new leaves. By 4 weeks, these leaves con-tained only 2% of the total '"t. Mature leaves con-tained little "C 48 h after treatment except for a shortperiod (5 to 7 weeks) late in the dormancy inducingregime. "C recovered from the source leaf graduallyincreased under SD until by week 7 or 8 over 85% ofthe ' t was still in the source leaf after 48 h (Fig. 2A).
Activity in the stems also reflected the changinggrowth patterns of the plants as they went dormant. Forthe first 1 to 2 weeks under SD, most of the " t wasfound in the developing primary tissue ofthe stem (stemsample one) above the source leaf (Fig. 2B). As growthslowed under SD, progressively more photosynthatewas directed to the stem below the source leaf. By the4th or 5th week under SD, most of the "C was found instem sample 3. Total "C, however, can give a mislead-ing picture of "C distribution because sample weightenters into the calculation. After 4 weeks under SD,stem sample 3 contained a large proportion of the ex-ported "C. However, this sample consisted of all tissuesbetween sample 2 and 4 and increased in size (bothnumber of internodes and dry weight) up to about the4th or 5th week. In contrast, percentage distribution of'•<: based on specific activity (Bq/mg dry wt.) clearlyshows that a downward concentration gradient of '*C is
WEEKS UNDER SHORT DATS
Fig. 3. Distribution of *̂C within cottonwood plants and thechanges associated with dormancy induction. Percentages arebased on specific activity (Bq/mg dry wt) of the different plantparts. (A) Leaves. (B) Stems. For a description of the leaf andstem samples see Fig. 1. Range bars are given for source leafand stem sample 2.
present in the stem subtending the source leaf (Fig. 3B).The specific activity curves for stem samples 3 and 4(Fig. 3B) show an initial high level of "C when thistissue was relatively close to the source leaf (weeks 0and 1); low activity when the source leaf was fartheraway (weeks 2 and 3); and then higher activity when' • t no longer moved to the developing leaves but ac-cumulated in the lower stem. Specific activities also ac-centuated the decrease in translocation efficiency (in-creasing *̂C retention) of the source leaf after 4 or 5weeks tinder SD (Fig. 3A). Percentages of "C in ma-ture leaves are not shown in Fig. 3A because theseleaves never contained more than 1% ofthe "C recov-ered.
Distribution of "C within chemical fractions ofthe source leaf
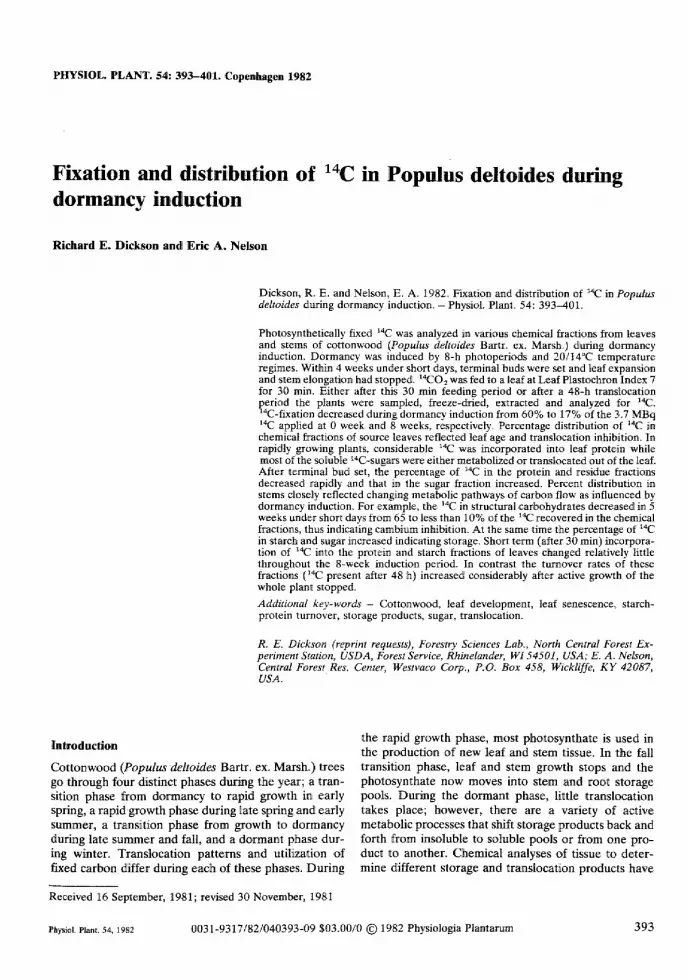
Incorporation of "̂"C into chemical fractions of thesource leaf for the first 3 to 4 weeks under SD indicateda mature but active leaf (Fig. 4). '*C-sugars weremostly translocated from or metabolized in the leafwithin 48 h. "C-incorporation into the protein, CHCI3(pigments and lipids), and residue (structural car-bohydrates) fractions indicated the continued synthesisand retention of essentialleaf chemical fractions. Amajor change in leaf function took place about the 4thweek under SD; "C recovered in the sugar fractionincreased rapidly and that found in most other fractions
396 Physiot. Ptant 54, 1982
WEEKS UNDER SHORT DAYS
Fig. 4. Distribution of ""C among major chemical fractionsfrom cottonwood source leaf laminae and the changes as-sociated with dormancy induction. Percentages are based onthe sum of the "C recovered in each chemical fraction 48 hafter release of '̂'CO2 to the source leaf. The source leaf was afully expanded, mature leaf at LPI 7. The percentage of "C inorganic acids (about 10%) and amino acids (1 to 2°/o) changedUttle with dormancy induction and are not shown for clarity.Range bars are given for the sugar and protein fractions.
(protein, residue, starch) decreased. After 7 or 8 weeksunder SD, about 70% of the "C recovered was still inthe sugar fraction of the leaf 48 h after labeling.
The distribution of '*C among the various leaf sugarsduring dormancy induction is shown in Tab. 2. After a30 min labeling period, most '"C was found in sucrose.There was little change in this short-term distribution ofcarbon as the plants went dormant under SD, althoughthe percentage of *̂C decreased slightly in sucrose andincreased in glucose and fructose. However, the dis-tribution of '*C among sugars did change considerably48 h after treatment. Activity in sucrose decreased withtime after " t O j treatment (30 min to 48 h) and withtime under SD, and increased in both the glucose plusfructose fraction and in stachyose with SD (Tab. 2).
Tab. 2. Distribution of "C among individual sugars of thesource leaf. Percentages are based on total "C recovery fromthe TLC sheets for all sugars shown and are the average of tworeplications per treatment.
Sugars
30 min treatmentStachyoseRaffinoseMelibioseSucroseGlucose and fructose
48 h treatmentStachyoseRaffinoseMelibioseSucroseGlucose and fructose
0
1.44.31.2
58.934.2
2.94.22.1
45.245.5
Weeks2
2.15.71.6
41.149.5
1.25.42.1
43.847.5
under short days4
1.83.31.5
57.436.0
1.94.72.3
25.565.5
6
1.12.61.9
50.444.0
10.46.33.3
28.152.0
8
2.43.91.8
48.843.1
9.94.42.3
29.953.5
Tab. 3. Concentrations and "C-specific activity of sugar andstarch in source leaves of cottonwood during dormancy induc-tion. "C in each fraction was that present 48 h after treatmentwith '"COj and is expressed as Bq/mg of sugar or starch. Val-ues are the average of two replications.
Weeksundershort days
012345678
Total soluble sugar
mg/g dry wt.
125172140169176177212261244
. kBq/mg
3.75.33.76.23.87.03.06.34.7
Starch
mg/g dry wt.
272824353052212133
kBq/mg
25.318.821.011.74.24.21.32.21.2
Tab. 4. Distribution of '*C among the major chemical fractionsof source leaves after 30 min in "COj. Percentages are basedon total activity of all chemical fractions. The "other" columnis the sum of CHCl ,̂ residue, organic acid, and amino addfractions. Percentages are the average of two replications. S isstandard deviation.
Weeksunder shortdays
02468
%
Sugar
48.547.352.461.657,4
total "C-activity inchemical fractions
Starch
25.826.130.923.923.1
Protein
13.515.111.38.8
15.1
Other
12.211.55.45.74.4
Total '•^Crecovered
kBq/mg ±S
11.9+0.4212.4±0.9013.1±0.959.6±0.826.9+1.10
The concentration of total soluble sugar in the sourceleaf about doubled during the eight weeks under SDwhile the specific activity changed very little, thus indi-cating a steady rate of carbon movement into this frac-tion (Tab. 3). In contrast, starch concentrations did notincrease in the lamina as plants went dormant while thespecific activity decreased greatly.
Initial carbon flow (afrer 30 min) into the majorchemical fractions changed relatively little over the 8week induction period (Tab. 4). There was an increaseof "C in the sugar fraction and a decrease of "C-incor-poration into the organic acids and amino acids (5 to2% for each fraction, included in the other column),but "C-incorporation into both starch and protein(averaging 25 and 13%, respectively) stayed relativelyconstant throughout the 8 weeks tinder SD. This con-stant initial incorporation rate when compared to thedecrease in starch specific activity (Tab. 3) and the de-crease of "̂C in both starch and proteio fractions after48 h (Fig. 4) indicated that turnover rates for these twofractions increased during dormancy indtiction. The '"Clost from these fractions may have been recovered insugars (Fig. 4, Tab. 3) or translocated out of the leaf.
26 Physiol. Plant. 54. 1982 397
WEEKS UNDER SHORT DAYS
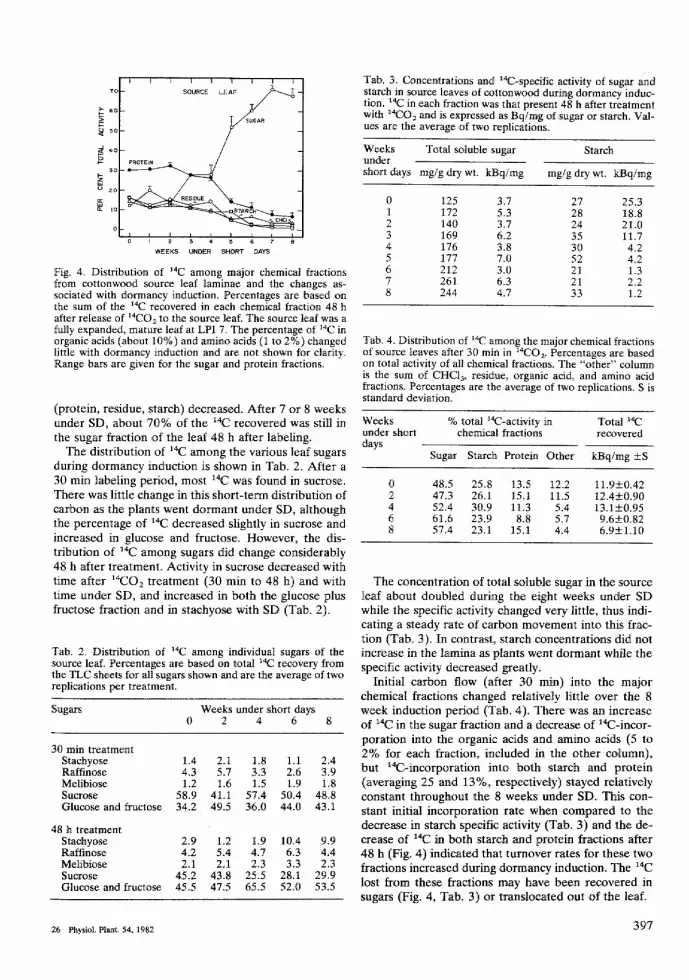
Fig. 5. Distribution of 'X^ among major chemical fractionsfrom cottonwood stems and the changes associated with dor-mancy induction. Percentages are based on the sum of the "Crecovered in each chemical fraction from either bark or xylem.The chemical fractions were extracted from the stem sampleassociated with the source ieaf (stem sample 2). (A) Bark. (B)Xylem. The bark sample consisted of all tissue that peeledfrom the xylem cylinder. Xylem samples after the 5th weekwere composed of both bark and xylem because the barkwould no longer peel from the dormant stem. The percentageof ' ' ^ in organic acids (about 5%) and amino acids (1 to 2%)changed little with dormancy induction and are not shown forclarity. Range bars are given for the sugar and residue frac-tions.
Distribution of "C within cbemkal fractions of the stem
Incorporation patterns of *'*C were very similar for bothbark and xylem of cottonwood stems as the plants wentdormant (Fig. 5A, B). In actively growing plants, mostof the "C was found in the residue (structtrral car-bohydrates) after 48 h. The percentage of "̂C incorpo-rated into residue decreased almost linearly under SD.By the fifth week, the bark would no longer slip fromthe xylem cylinder indicating the cambium was dor-mant. The percentage of "C in the sugar fraction in-creased slowly for the first 4 weeks then increasedrapidly for the remainder of the SD induction period.The percentage of "C found in starch increased tip tothe 4th week, then decreased. That found in the proteinand CHCis fractions increased up to about the 5th weekand then decreased.
Discussion
The distribution of ""C in leaves and stetns reflected
both changing sink strength of developing leaves, andtranslocation efficiency of the source leaf. The export ofphotosynthate from a particular source leaf to varioussinks around the plant is highly dependent on thegrowth rate or activity ofthe sink and the location ofthesource leaf in respect to that sink (Wardlaw 1968). Asource leaf at LPI 7, in actively growing cottonwoodplants of the size used in this study, is considered re-cently mature and is exporting photosynthate both tothe young developing, leaves and stem above and to thestem subtending the source leaf (Larson and Gordon1969). Under the growing conditions of this study, pro-duction of leaves by LD control plants was essentiallylinear at about 1 leaf per day. Leaf production con-tinued at this rate as long as the plants remained underlong-days (Goffinet and Larson 1981, Nelson andDickson 1981). Leaf production in the SD plants wasalso linear for about 3 weeks but at a lower rate. By 4 to5 weeks under SD, new leaf production had stopped,terminal buds were set and secondary development inthe stem had progressed almost to the bud (Goffinetand Larson 1981). This essentially eliminated the upperparts of the plants as sinks and most of the photosyn-thate exported from the source leaf was directed to thelower stem (Fig. 2).
Physiological patterns typical of senescence werefound during dormancy induction in this experimentwith cottonwood. Photosynthetic rate, as measured by'"COj fixation, decreased during induction. This de-crease in photosynthetic carbon fixation could resultfrom a number of factors. For example, stomatal resis-tance commonly increases during leaf senescence(Ceulemans and Impens 1979, Drew and Bazzaz 1979).In addition, a decrease in sink demand (Rawson andWoodward 1976) or an increase in leaf substrate levels(Neales and Incoll 1968) could also cause a decrease incarbon fixation. All of these factors were probablyoperating in these cottonwood leaves to decrease car-bon fixation. Basing initial '''COj fixation on that reco-vered after 48 h can lead to errors and must be consi-dered tentative in this experiment because no meas-urements were made of respiration losses or of translo-cation to the root system. Although a steep, decreasinggradient of ""C specific activity was found below thesource leaf (Fig. 3), it is possible that some photosyn-thate was translocated past the stem sinks for storage inthe roots. Such losses would lead to an underestimationof initial "C fixation.
Translocation from the leaf also decreased duringdormancy induction. Active, recently expanded cotton-wood leaves exported 50 to 60% of the "C initiallyfixed within 48 h (Fig. 2). By eight weeks under shortdays, only 13% of the '*C initially fixed by the sourceleaf was exported. These translocation patterns are inagreement with those found by Thrower (1967). In thatstudy, recently mature soybean leaves exported 30 to40% of the '*C initially fixed hi 2 h. During aging, ex-port declined continuously to about 13% just before
398 Physiot. Ptant. 54, 1982

leaf abscission. Although based on loss of "C from thesoybean source ieaf after 2 h, this pattern was verysimilar to that found in cottonwood leaves 48 h after"*CO2 fixation.
The factors causing this decrease in translocation effi-ciency are currently unknown. In some plants, translo-cation pathways may remain functional up to leafabscission (Zimmermann 1964). In other plants, failureof the translocation system precedes cessation of CO 2fixation. Decreasing translocation rates could resultfrom the initiation of callose in the phloem as leavessenesce (Scott et al. 1967), a decrease in available atjxin(Thrower 1967), or the lack of a suitable or preferredtranslocation product (Geiger 1979). Lack of translo-cate seems unlikely with SD cottonwood. Althoughthere was a shift in carbon flow from sucrose (the majortranslocation product in cottonwood leaves) to reducingsugars and stachyose under SD, 48% of the '"C waspresent in the leaves as sucrose after 30 min in '''CO2and 29% of the *̂C was still in sucrose 48 h after treat-ment, in addition, the total amotint of soluble sugar wasprobably not the cause of the decreasing translocationrate. However, it is possible that the "C-sucrose pres-ent in these leaves may not be in the normal transloca-tion pool. In any event, the loss of translocation effi-ciency would lead to stigar accumulation in the leaf(e.g.. Tab. 3, 24% dry wt.) as long as CO2 fixationcontinued. Sugar accumulation has also been found inleaves growing outside under natural conditions in latefall (Dickson, unpublished results). In six composite leafsamples from 4 species of trees collected during fallabscission, total soluble sugars ranged from 14 to 30%of leaf dry wt. Starch values were much lower andranged from 0.4 to 2% dr)' wt.
Translocation rates based on accumulation of re-cently fixed •'*C may not accurately reflect actual trans-location from leaves. If there is rapid hydrolysis of pro-tein and starch during senescence these additionalsources of carbon may provide substrate for transloca-tion out of the leaf. Such differential loading (a changein the normal pools or products associated with phloemloading in a tnature leaf) must take place during, senes-cence because much of the N, P, and K found in activemature leaves is translocated into the stem before leaffall (Oland 1963, Spencer and Titus 1972) while sugarsmay accumulate.
Much information is available concerning nitrogenmetabolism and translocation during leaf senescence.Nitrogen loss from a leaf can result from either a de-crease in protein synthesis or an increase in protein de-gradation, and there is evidence to support both pro-cesses (Woolhouse 1967, Beevers 1976). In contrast,relatively little is known about sugar-starch intercon-versions during leaf senescence (Thrower 1967). In thisstudy, the initial proportional incorporation of carbonafter 30 min (Tab. 4) into both starch and proteinchanged little over the 8 weeks under SD. In contrast,the percentage of ' t remaining in these fractions after
48 h was relatively constant for 3 to 4 weeks, then de-creased considerably for the rest of the SD period. Thisindicates an increase in turnover rates for these frac-tions. The increased turnover rate for protein is prob-ably initiaOy associated with soluble leaf proteins otherthan Fraction 1 protein (RuDP carboxylase) (Wool-house 1967, Dickmann et al. 1975, Wittenbach et al.1980). However, as leaf senescence progresses, most ofthe remaining protein is hydrolyzed and the amino acidsare transported into the stem for storage (Kliewer 1967,O'Kennedy et al. 1975, Hollwarth 1976).
The factors controlling starch-sugar interconversionduring leaf senescence are not well known. Starch oftenaccumulates in leaves after maturation (Wittenbach etal. 1980), then gradually declines during senescence(Thrower 1967). Carbon flow into starch is favored byhigh light intensity (Porter 1966), low temperatures(Yelenosky and Guy 1977), short photoperiods (Chat-terton and Silvius 1980), and various other environ-mental factors. In this experiment, there was little or nostarch accumulation in leaves during the 8 weeks underSD, although sugar did accumulate. Although data fromthis study indicated the initial rate of carbon incorpora-tion into starch was not affected by leaf age while turn-over rates were, considerably more research is requiredbefore it is clear how translocation efficiency, leaf sub-strate levels, starch-sugar metabolism, and other factorsinteract during leaf senescence.
Under SD induction, the cambium in the stem alsoprogressively became dormant and carbon translocatedto the stem was redirected from the production ofstructural carbohydrates (xylem formation) to the pro-duction of storage products (Fig. 5). This change in car-bon flow has important implications in wood formationbecause it shows that the growth of xylem elements didnot continue after the leaves were fully expanded andterminal buds were set. Thus, late summer diametergrowth might be insigniflcant even though green andfunctional leaves remain on the plant for sometime afterbud set. The applicability of this information to treesother than cottonwood needs to be investigated.
The pattern of ' t flow into both sugar and starchindicated storage at these times but did not correspondto accumulation patterns based on total analyses ofthese fractions (Nelson and Dickson 1981). Prioranalyses of these fractions showed that sugar concen-tration increased in stems for about 4 weeks under SDthen remained constant, while starch accumulated at analmost constant rate after about 3 weeks under SD. Incontrast, the percentage distributions of '*C in Fig. 5,show that the relative amount of carbon incorporationinto the sugar fraction increased while that in starchdecreased after 4 weeks. In addition, specific activity(Bq per mg) of both sugar and starch in the stem seg-ment sampled decreased throughout the SD period(2000 to 170 Bq/mg and 11,700 to 3.3 Bq/mg for sugarand starch, respectively).
A number of factors could contribute to these seem-
26* Plijsioi. Ptam. 54, 1982 399
ingly anomalous results. However, two factors - theturnover rate of translocated photosynthate and thechanging distribution of photosynthate within the stem— appear to be the most important. Dtiring the first fewweeks under SD, -"C sugars translocated to the stemwere rapidly converted to other chemical fractions. Af-ter the 4th week under SD, when the plants had setterminal bud and new leaf growth had stopped,^"C-sugars rapidly accumtilated and conversion to otherchemical fractions (e.g., starch) was inhibited (Fig. 5).By the 7th week under SD, over 70% of the "C trans-located into the stem was still in the sugar fraction 48 hafter fixation.. This indicates a very slow turnover rate ofthe recently fixed and translocated photosynthate.
The second factor that would lead to the accumula-tion of unlabeled sugar and starch in this section of stemwas the contribution of photosynthate from leavesabove the source leaf (e.g., LPI 4, 5, and 6). Duringdormancy induction, progressively more photosynthatefrom the upper leaves was translocated to the stemsubtending those leaves. For example, in plants sampledat week 5, about 25 and 45% of the "C exported fromLPI 7 was found in stem sample 2 and 3, respectively(Fig. 2). If we assume that LPI 5 and 6 are translocatingsimilarly to the internodes associated with LPI 7 (stemsample 2), most of the photosynthate accumulating inthis stem segment wotild come from the leaves aboveLPI 7 and would contain no "C. Thus specific activitywould decrease and unlabeled starch and other storageproducts would accumulate.
chemical fractions within the plant. Of particular in-terest in this study was the relatively short term (30 minand 48 h) changes in carbon flow among chemical frac-tions and the distribution of photosynthate throughoutthe plant as the plants went dormant. In addition, thisstudy has demonstrated a considerable loss of leaftranslocation efficiency, increasing turnover rates ofboth starch and protein in leaves, decreasing turnoverrates of sugar in both leaves and stems, and the relativecontributions of individual leaves to the accumulation ofstorage products in specific areas of the stem as cotton-wood plants went dormant under short days. Such in-formation is helpful in understanding the developmen-tal physiology of cottonwood which in tum can lead togreater control over wood formation in trees.
Acknowledgements — We wish to thank Gary L. Garton for hisvaluable technical assistance with the extractions and " t -de-terminations, and Miles Laboratories, Elkhart, Indiana forsupplying free of charge commercial preparations of Claraseand Diazyme.
Mention of companies, products, or trade names (e.g.,Amersham/Searle, NCS, Clarase 900) is for the information ofthe reader only and does not constitute endorsement by theForest Service or the U.S. Department of Agriculture.
References
Beevers, L. 1976. Nitrogen metaboUsm in plants. — Contem-porary biology series. - American Elsevier Publ. Co., NewYork. ISBN: 0-444-19502-5.
Ceulemans, R. & Impens, 1. 1979. Study of COj exchangeprocesses, resistance to carbon dioxide and chlorophyllcontent during leaf ontogenesis in poplar. - BioL Plant. 21:302-306.
Chatterton, N. J. & Silvius, S. E. 1980. Acclimation of photo-synthate partitioning and photosynthetic rates to changesin length of the daily photosynthetic period. - Ann. Bot.46: 739-745.
Clayton, J. W. & Meredith, W. O. S. 1966. The effect of thiolson the dinitrosalicylic acid test for reducing sugars. - J.Inst. Brew. 72: 537-540.
Cooper, G. R. & McDaniel, V. 1970. The determination ofglucose by the orthotoluidine method (Filtrate and directprocedure). -In Standard Methods of Clinical Chemistry.Vol. 6. (R. P. MacDonald, ed.), pp. 159-170. AcademicPress, New York.
Dickmann, D. 1., Gjerstad, D. H. & Gordon, J. C. 1975. De-velopmental patterns of CO2 exchange, diffusion resis-tance and protein synthesis in leaves of Populus xEuramericana. — Jn Environmental and Biological Controlof Photosynthesis. (R. Marceile, ed.), pp. 171-181. W.Junk, Publ., The Hague. ISBN: 906-193-1797.
Dickson, R. E. 1977. EDTA-promoted exudation of•̂ ''C-labeled compounds from detached cottonwood andbean leaves as related to translocation. - Can. J. For. Res.7: 277-284.
Dickson, R. E. 1979. Analytical procedures for the sequentialextraction of ^t-labeled constituents from leaves, barkand wood of cottonwood plants. — Physiol. Plant. 45:480-488.
Drew, A. P. & Bazzaz, F. A. 1979. Response of stomatal re-sistance and photosynthesis to night temperature inPopulus deltoides. - Oecologia 41: 89-98.
Geiger, D. R. 1979. Control of partitioning and export of car-bon in leaves of higher plants. -Bot. Gaz. 140: 241—248.
Glernm, C. & Balatinecz, J. J. 1980. Formation and distribu-tion of food reserves during autumn and their subsequentutilization in jack pine. — Can. J. Bot. 58: 40—54.
Goffinet, M. C. & Larson, P. R. 1981. Structural changes inPopulus deltoides terminal buds and in the vascular tran-sition zone of the stems during dormancy induction. — Am.J. Bot. 68: 118-129.
Gordon, J. C. & Larson, P. R. 1968. Seasonal course ofphotosynthesis, respiration, and distribution of ""C inyoung Pinus resinosa trees as related to wood formation. —Plant Physiol. 43: 1617-1624.
- &. Larson, P. R. 1970. Redistribution of "C-labeled re-serve food in young red pines during shoot elongation. -For. Sci. 16: 14-20.
Haissig, B. E. & Dickson, R. E. 1979. Starch measurement inplant tissue using enzymatic hydrolysis. - Physiol. Plant.47: 151-157.
Hansen, P. & Grauslund, J. 1973. "C-studies on apple trees,vo l . The seasonal variation and nature of reserves. —Physiol. Plant. 28: 24-32.
Hollwarth, M. 1976. Der Stickstoffhaushalt von Poppelrindenund seine ,Bezichungen zur Temperatur. - Z. Pflanzen-physiol. 80: 215-224.
Ishibe, O. 1935. The seasonal changes in starch and fat re-serves of some woody plants. - Mem. Coll. Sci. KyotoImperial Univ. Ser. B. 11: 1-53.
Kandiah, S. 1979a. Turnover of carbohydrates in relation togrowth in apple trees. I. Seasonal variation of growth andcarbohydrate reserves. -Ann. Bot. 44: 175-183.
- 1979b. Turnover of carbohydrates in relation to growth inapple treess. II. Distribution of '"C assimilates labeled inautumn, spring and summer. — Ann. Bot. 44: 185-195.
400 Physiot. Plant 54. t982

Kliewer, W. M. 1967. Annual cyclic changes in the concentra-tion of free amino acids in grapevines. — Am. J. EnologyViticult. 18: 126-137.
Kramer, P. J. & Kozlowski, T. T. 1979. Physiology of woodyplants. Academic Press, New York. ISBN: 0-12-425050'-5.
Lamoreaux, R. J., Chaney, W. R. & Brown, K. M. 1978. Theplastochron index: a review after two decades of use. -Am. J. Bot. 65: 586-593.
Larson, P. R. & Gordon, J. C. 1969. Leaf development,photosynthesis, and C " distribution in Populus deltoidesseedlings. - Am. J. Bot. 56: 1058-1066.
— & Isebrands, J. G. 1971. The plastochron index as appliedto developmental studies of cottonwood. - Can. J. For.Res. I: 1-11.
Neales, T. F. & Incoll, I. D. 1968. The control of leaf photo-synthesis by the level of assimilate concentration in theleaf: Areviewof the hypothesis.-Bot. Rev. 34: 107-125.
Nelson, E. A. & Dickson, R. E. 1981. Accumulation of foodreserves in cottonwood stems during dormancy induction.- Can. i. For. Res. 11: 145-154.
O'Kennedy, B. T., Hennerty, M. J. & Titus, J. S. 1975.Changes in the nitrogen reserves of apple shoots during thedormant season. - J. Hortic. Sci. 50: 321-329.
Oland, K. 1963. Changes in the content of dry matter andmajor nutrient elements of apple foliage during senescenceand abscission. - Physiol. Plant. 16: 682-694.
Porter, H. K. 1966. Leaves as collecting and distributing agentsfor carbon. - Aust. J. Sci. 29: 31-40.
Rawson, H. M. & Woodward, R. G. 1976. Photosynthesis andtranspiration in dicotyledonous plants. I. Expanding leavesof tobacco and sunflower. — Aust. J. Plant Physiol. 3:247-256.
Scott, P. C, Miller, L. W., Webster, B. D. & Leopold, A. C.1967. Structural changes during bean leaf abscission. —Am. J. Bot. 54: 730-734.
Spencer, P. W. & Titus, J. S. 1972. Biochemical and enzymaticchanges in apple leaf tissue during autumnal senescence. -Plant Physiol. 49: 746-750.
Thrower, S. L. 1967. The patterns of translocation during leafageing. -Symp. Soc. Exp. Bot. 21: 483-506.
Wardlaw, I. F. 1968. The control and pattern of movement ofcarbohydrates in plants. — Bot. Rev. 34: 79-105.
Wittenbach, V. A., Ackcrson, R. C, Giaquinta, R. T. &Hebert, R. R. 1980. Changes in photosynthesis, ribulosebiphosphate carboxylase, proteolytic activity and ultra-structure of soybean leaves during senescence. - Crop Sd.20: 225-231.
Woolhouse, H. W. 1967. The nature of senescence in plants. -Symp. Soc. Exp. Bot. 21: 179-213.
Yelenosky, G. & Guy, C. L. 1977. Carbohydrate accumulationin leaves and stems of 'Valencia' orange at progressivelycolder temperatures. -Bot. Gaz. 138: 13-17.
Ziegler, H. 1964. Storage, metabolism and distribution of re-serve material in trees. - In The Formation of Wood inForest Trees. (M. H. Zimmermaon, ed.), pp. 303—320.Academic Press, New York.
Zimmermann, M. H. 1964. The relation of transport to growthin dicotyledonous trees. - In The Formation of Wood inForest Trees. (M. H. Zimmermann, ed.), pp. 289-301.Academic Press, New York.
Edited by L.E.
Physiol. Ptant. 54, 1982 401

![A convenient method for regional monoamine oxidase-A determination by [14C]clorgyline autoradiography](https://img.dokumen.tips/doc/110x75/6344083bf474639c9b042ff1/a-convenient-method-for-regional-monoamine-oxidase-a-determination-by-14cclorgyline.jpg)

![Synthesis of (9Z,12E)- and (9E,12Z)-[1-14C]linoleic acid and (5Z,8Z,11Z,14E)-[1-14C]arachidonic ácid](https://img.dokumen.tips/doc/110x75/6346f18960c04fc79b06f2d7/synthesis-of-9z12e-and-9e12z-1-14clinoleic-acid-and-5z8z11z14e-1-14carachidonic.jpg)


![DNA binding of [14C]styrene in isolated rat hepatocytes](https://img.dokumen.tips/doc/110x75/63549a38c1c6b761fb0ebe52/dna-binding-of-14cstyrene-in-isolated-rat-hepatocytes.jpg)


