Embed Size (px)
Citation preview
1


EUROPEAN COMMUNICATION MONITOR 2013 A CHANGING LANDSCAPE – MANAGING CRISES, DIGITAL COMMUNICATION AND CEO POSITIONING IN EUROPE. RESULTS OF A SURVEY IN 43 COUNTRIES.
Ansgar Zerfass, Angeles Moreno, Ralph Tench, Dejan Verčič & Piet Verhoeven
A study conducted by the European Public Relations Education and Research Association (EUPRERA), the European Association of Communication Directors (EACD) and Communication Director magazine
4
Imprint
Published by:
EACD European Association of Communication Directors, Brussels. www.eacd-online.eu EUPRERA European Public Relations Education and Research Association, Brussels. www.euprera.org
Citation of this publication (APA style):
Zerfass, A., Moreno, A., Tench, R., Verčič, D., & Verhoeven, P. (2013). European Communication Monitor 2013. A Changing Landscape – Managing Crises, Digital Communication and CEO Positioning in Europe. Results of a Survey in 43 Countries. Brussels: EACD/EUPRERA, Helios Media.
Short quotation to be used in legends (charts/graphics): Source: European Communication Monitor 2013.
June 2013. Final and corrected version. All rights reserved.
© Prof. Dr. Ansgar Zerfass and the research team for the whole document and all parts, charts and data. The material presented in this document represents empirical insights and interpretation by the research team. It is intellectual property subject to international copyright. Illustration licensed by istockphoto.com. Title graphic provided by Helios Media. Permission is gained to quote from the content of this survey and reproduce any graphics, subject to the condition that the source including the internet address is clearly quoted and depicted on every chart. It is not allowed to use this data to illustrate promotional material for commercial services. Publishing this PDF document on websites run by third parties and storing this document in databases or on platforms which are only open to subscribers/members or charge payments for assessing information is prohibited. Please use a link to the official website www.communicationmonitor.eu instead.
This report (chart version) is available as a free PDF document at www.communicationmonitor.eu The report is also available as a booklet published by Helios Media, ISBN 978-3-942263-21-4.
Contact:
Please contact any member of the research team or the advisory board in your country or region if you are interested in discussing the insights of this survey or in joint research projects. Questions regarding the overall research may be directed to the lead researcher, Prof. Dr. Ansgar Zerfass, [email protected]
5
Foreword and Introduction 6
Research design 8
Methodology and demographics 10
CEO communication and reputation 16
Digital gatekeepers and social media communication 24
Social media skills and use by professionals 38
Communication strategies for different generations 50
International communication 60
Crisis communication 70
Strategic issues and influence 82
Status, budgets and perspectives 90
Salaries 102
Impact of professional associations 110
References 118
Partners and Sponsor 121
Advisory Board 124
Authors and Research Team 123
Content

6
The annual European Communication Monitor continues to provide valuable insights into the state-of-the-art in communications – this year looking, among other things, at the growing need for diversified communication strategies that address different audiences in specific ways.
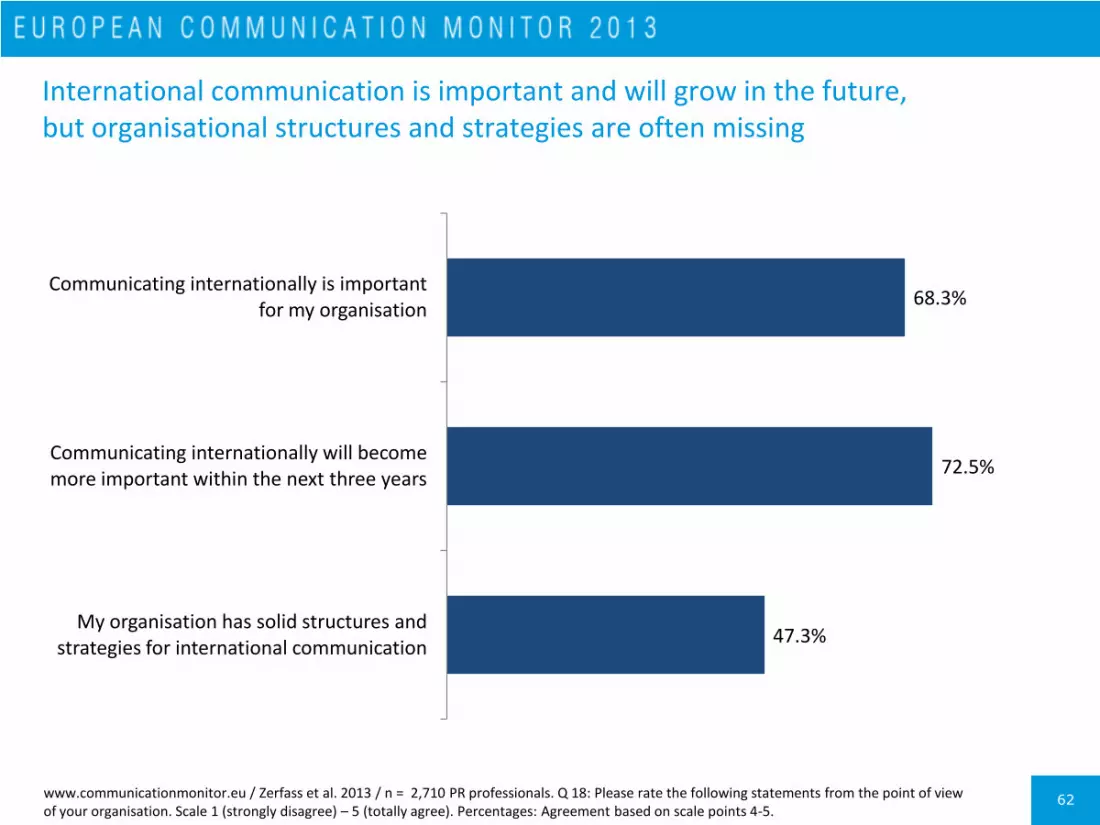
International communication is part of the daily business of 68 per cent of all communicators who answered this year’s questionnaire, with 73 per cent of the respondents convinced that communicating internationally will become even more important within the next three years. However, only 47 per cent believe that their organisation has solid structures in place to accommodate this challenge. As the European Association of Communication Directors (EACD), we will continue to offer peer-to-peer learning and training opportunities to help close this gap, and to support academic programmes that equip future communicators with a specifically international perspective.
Next to the challenge of communicating to a regionally diverse audience, this year’s monitor also looks at variations in addressing different generations. More than three quarters of communicators believe that the under-30 “digital native” generation is more interactive, more involved in communication and demands more feedback. According to our survey, 60 per cent of all organisations have already implemented age-specific communication strategies. However, with only 38 per cent believing that their organisation has adequate strategies and instruments to communicate with new gatekeepers on the social web, there is still clearly a strong demand for continuous training regarding communications in the social media age.
These are just a few of the main themes of this year’s monitor: I invite you to explore it in depth over the following pages. At the EACD, we continue to review the results carefully and take them as inspiration for our association’s work for the advancement of our profession.
Dr. Herbert Heitmann
President, European Association of Communication Directors (EACD)
Foreword

7
Strategic communication is an advanced management discipline which supports organisational goals and drives corporate value. A number of the most important fields of practice are researched in this survey: strategies for positioning the chief executive officer and other executives, for managing crises based on situative response approaches, for coping with the challenges of internationalisation, and for interacting with specific gatekeepers and audiences in the digital realm.
Many surveys in the field of communication management and public relations claim an international outreach. From time to time new studies enter and leave the field. The European Communication Monitor is the only continuing research worldwide that has built up an academic and professional infrastructure across 43 countries and has produced up-to-date data for seven years in a row. Insights have been disseminated in more than 60 publications in academic and professional journals, workshops and presentations around the globe.
With 2,710 communication professionals participating and country-specific analyses for 20 national markets, the ECM 2013 is the largest annual empirical survey in the field worldwide. On behalf of the research team and advisory board, I would like to thank everyone who participated in the survey as well as the broad range of national supporters. Sophia Charlotte Volk and Ronny Fechner did a great job as assistant researchers. Grit Fiedler, Vanessa Eggert and Johannes Schmid coordinated the project on behalf of our valued partners, the EACD and Communication Director magazine. Ketchum, the leading agency group on the continent, generously sponsors this joint initiative of the profession. Many thanks for this support.
Prof. Dr. Ansgar Zerfass
Professor of Communication Management, University of Leipzig, Germany & Executive Director, European Public Relations Education and Research Association (EUPRERA)
Introduction
Research design
9
Research design
The European Communication Monitor (ECM) is a unique, longitudinal transnational survey in communication management with a long tradition (Zerfass et al., 2007). It was organised for the seventh consecutive time in 2013. Owing to its depth, long-term consistency of questions and structure, as well as the consistently high and broad response rate from across Europe, this annual survey has developed into the most comprehensive research into communication management and public relations worldwide with 2,710 participating professionals in 2013 from 43 countries. Each year the ECM improves the understanding of the professional practice of communication in Europe and monitors trends in strategic communication to analyse the changing framework of the profession.
The study is conducted by a core group of five university professors, led by Professor Ansgar Zerfass from the University of Leipzig in Germany and supported by a wider professorial advisory board totalling 11 renowned universities across Europe. It is organised by the European Public Relations Education and Research Association (EUPRERA), the European Association of Communication Directors (EACD) and Communication Director magazine. This successful partnership between academia and practice is supported by Ketchum, Europe’s leading public relations agency, as generous sponsor.
The research framework for the survey has been modified and expanded once again in 2013. This year it includes a large number of independent and dependent variables along five key factors: personal characteristics of communication professionals (demographics, education, job status, professional experiences); features of the organisation (structure, country); attributes of the communication function; the current situation of strategic communication as well as perceptions on key developments in areas like strategies for positioning the chief executive officer, for managing crises, for dealing with international and cross cultural issues as well as interacting with gatekeepers and audiences in the changing, complex digital world.
Cross-tabulations, correlation analyses and longitudinal comparisons enable the researchers to identify dynamics in the field. To this end, several questions from previous ECM surveys (Zerfass et al., 2012, 2011, 2010, 2009, 2008) have been repeated.
The monitor is based on a wide range of situational theories about public relations and communication management. The empirical character of the study enables the profession to strengthen certain theoretical concepts in the field or reject them on the basis of the hypotheses formulated in the monitor project (e. g. Verhoeven et al., 2011). Examples of the conceptual background of this year’s edition are the theories and empirical debates on social media skills and their deficits (Tench et al., 2013), intercultural communication and competence (Verčič, 2013; Bücker & Poutsma, 2010), corporate communications (Van Riel & Fombrun, 2007; Zerfass, 2008; Cornelissen, 2011), strategic communication (Hallahan et al., 2007; Holtzhausen & Zerfass, 2013) and strategic crisis communication (Coombs, 2010, 2012).
Methodology and demographics

11
Chapter overview
This edition of the European Communication Monitor consisted of a questionnaire with 18 sections and 39 questions, based on hypotheses and instruments derived from previous research and literature. A pre-test with 36 practitioners in 13 European countries was held before the English language survey was launched in March 2013 and was online for four weeks. A personal invitation was sent to 30,000+ professionals throughout Europe via e-mail based on a database provided by the European Association of Communication Directors (EACD). Via national branch associations and networks additional invitations were distributed. 4,808 respondents started the survey and 2,802 of them completed it. The evaluation is then based on 2,710 fully completed replies by participants that were clearly identified as part of the population, being communication professionals in Europe. For the statistical analysis the Statistical Package for the Social Sciences (SPSS) was used for descriptive and analytical purposes. The results have been statistically tested with, depending on the variable, Pearson's chi-square tests (χ²), Spearman's rank correlation tests (rho), Kendall's rank correlation (tau b), Cramér’s V, and independent samples T-tests. The results are classified as significant (p ≤ 0.05)* or highly significant (p ≤ 0.01)** in the graphics and tables where appropriate. The significant correlations are also marked in the footnotes.
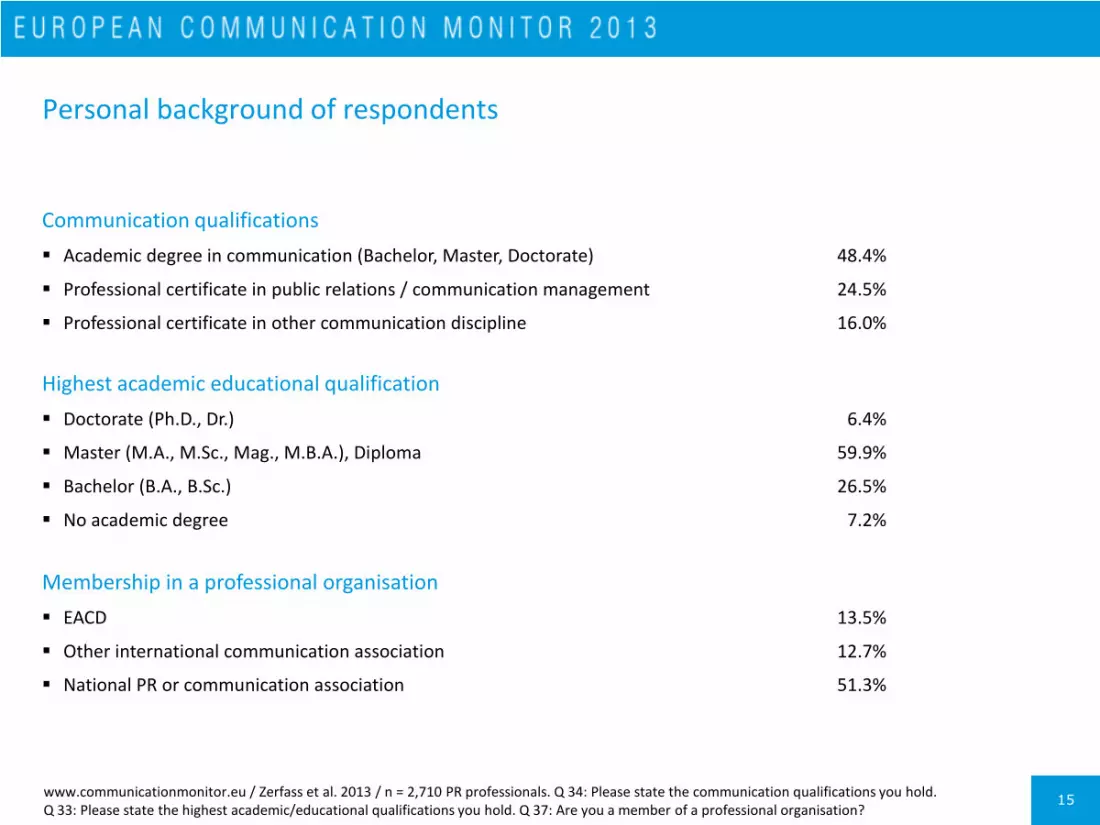
The demographics show that 43.2 per cent of the respondents hold a position as communication manager or as CEO of a communication consultancy. 28.4 per cent are responsible for a single communication discipline or are unit leaders and 22.5 per cent are team members or consultants. 58.3 per cent of the professionals interviewed have more than ten years of experience in communication management, 58 per cent of them are female and the average age is 40.9 years. A vast majority (92.8 per cent) of the respondents has an academic degree from a professional bachelor to a doctorate. Almost three out of four work in communication departments in organisations (joint stock companies, 26.2 per cent; private companies, 18.9 per cent; government-owned, public sector, political organisations, 16.3 per cent; non-profit organisations, associations, 13.4 per cent), and 25.2 per cent of the respondents are communication consultants working freelance or for agencies and consultancies.
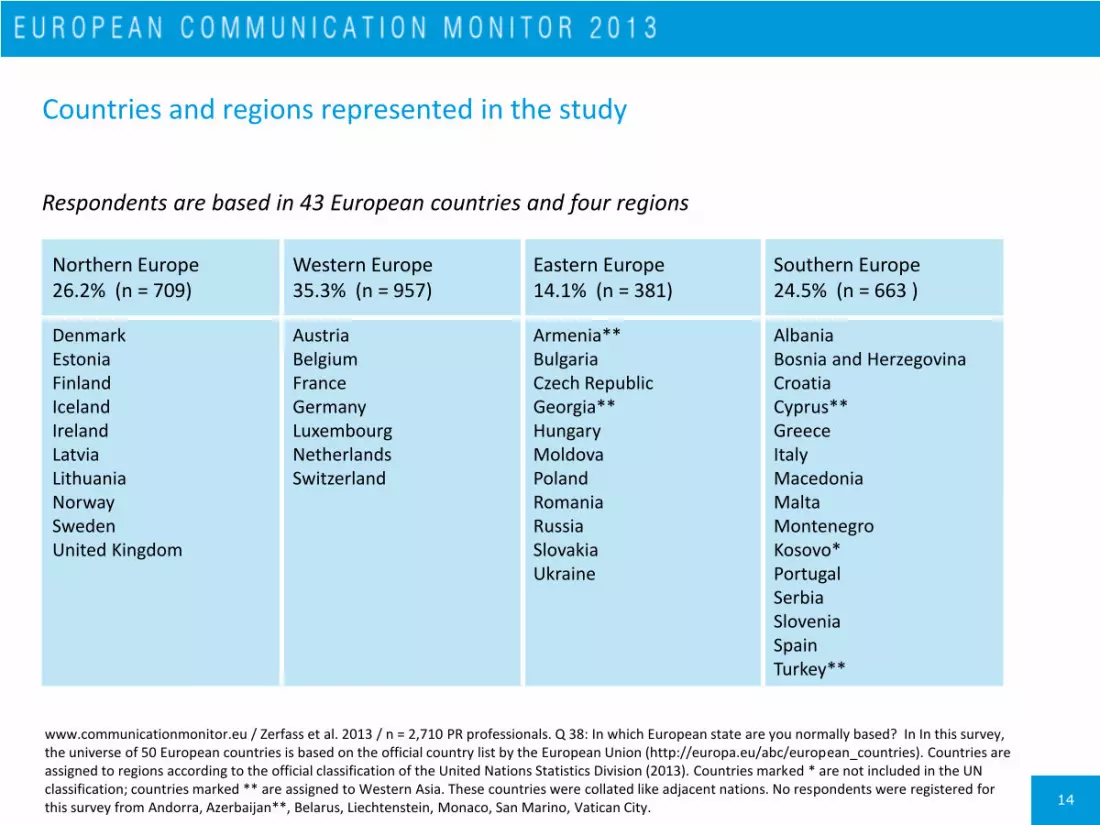
Most respondents (35.3 per cent) are based in Western Europe (countries like Germany, Netherlands, France), followed by Northern Europe (26.2 per cent, countries like Norway, Sweden, United Kingdom), Southern Europe (24.5 per cent, countries like Italy, Spain, Croatia), and Eastern Europe (14.1 per cent, countries like Poland, Czech Republic, Romania). In the survey, the universe of 50 European countries is based on the official list of European Countries by the European Union. Countries are assigned to regions according to the official classification of the United Nations Statistics Division. Respondents from countries that are not included in the UN classification or from countries that are assigned to Western Asia were collated like adjacent nations. No respondents were registered for this survey from Andorra, Azerbaijan, Belarus, Liechtenstein, Monaco, San Marino and Vatican City. Respondents of the survey are based in 43 European countries.

12
Research framework and questions
Situation
Communication in turbulent times, Q 1
Crisis communication, Q 2
Crisis communication situation, Q 3
Crisis communication strategies, Q 4
Crisis communication instruments, Q 5
Implementation of social media tools, Q 9
Social media skills and knowledge, Q 10
Communicating with different generations, Q 11
Communication strategies for different generations, Q 13
CEO communication activities, Q 15
CEO communication strategy, Q 16
CEO reputation, Q 17
International communication activities, Q 19
Countries relevant for international communication, Q 20
Regions targeted by international communication, Q 21
Professional social media use, Q 35
Private social media use, Q 36
Personal income, Q 39
Person (Communication professional)
Demographics Education Job status Professional experiences
Age, Q 30
Gender, Q 31
Membership in association(s), Q 37
Academic qualifications, Q 33
Communication qualifications, Q 34
Position and hierarchy level, Q 28
Dominant areas of work, Q 29
Experience on the job (years), Q 32
Communication function
Advisory influence, Q 25
Executive influence, Q 26
Organisation
Structure Country
Type of organisation (joint-stock company, private company, non-profit, governmental, agency), Q 27
European country, Q 38
European region, Q 38
Perception
Future career development, Q 1
Most important strategic issues, Q 6
Social media, perceptions and gatekeepers, Q 7
Importance of social media tools, Q 8
Communicating with digital natives, Q 12
CEO communication and organisational success, Q 14
International communication: importance and structures, Q 18
Challenges of international communication, Q 22
Role of professional associations, Q 23
Services of professional associations, Q 24

13
Demographic background of participants
www.communicationmonitor.eu / Zerfass et al. 2013 / n = 2,710 PR professionals. Q 28: What is your position? Q 27: Where do you work? Q 32: How many years of experience do you have in communication management/PR? Q 31: What is your gender? Q 30: How old are you?
Position Organisation
Head of communication, Agency CEO
43.2% Communication department
joint stock company 26.2% private company 18.9% government-owned, public sector,
political organisation 16.3% non-profit organisation, association 13.4%
Responsible for single communication discipline, Unit leader
28.4% 74.8%
Team member, Consultant
22.5% Communication consultancy, PR agency, Freelance consultant
25.2%
Other 5.9%
Job experience Gender / Age
More than 10 years 58.3% Female 58.0%
6 to 10 years 25.5% Male 42.0%
Up to 5 years 16.1% Age (on average) 40.9 years
14
Countries and regions represented in the study
Respondents are based in 43 European countries and four regions
Northern Europe 26.2% (n = 709)
Western Europe 35.3% (n = 957)
Eastern Europe 14.1% (n = 381)
Southern Europe 24.5% (n = 663 )
Denmark Estonia Finland Iceland Ireland Latvia Lithuania Norway Sweden United Kingdom
Austria Belgium France Germany Luxembourg Netherlands Switzerland
Armenia** Bulgaria Czech Republic Georgia** Hungary Moldova Poland Romania Russia Slovakia Ukraine
Albania Bosnia and Herzegovina Croatia Cyprus** Greece Italy Macedonia Malta Montenegro Kosovo* Portugal Serbia Slovenia Spain Turkey**
www.communicationmonitor.eu / Zerfass et al. 2013 / n = 2,710 PR professionals. Q 38: In which European state are you normally based? In In this survey, the universe of 50 European countries is based on the official country list by the European Union (http://europa.eu/abc/european_countries). Countries are assigned to regions according to the official classification of the United Nations Statistics Division (2013). Countries marked * are not included in the UN classification; countries marked ** are assigned to Western Asia. These countries were collated like adjacent nations. No respondents were registered for this survey from Andorra, Azerbaijan**, Belarus, Liechtenstein, Monaco, San Marino, Vatican City.
15
Communication qualifications
Academic degree in communication (Bachelor, Master, Doctorate) 48.4%
Professional certificate in public relations / communication management 24.5%
Professional certificate in other communication discipline 16.0%
Highest academic educational qualification
Doctorate (Ph.D., Dr.) 6.4%
Master (M.A., M.Sc., Mag., M.B.A.), Diploma 59.9%
Bachelor (B.A., B.Sc.) 26.5%
No academic degree 7.2%
Membership in a professional organisation
EACD 13.5%
Other international communication association 12.7%
National PR or communication association 51.3%
Personal background of respondents
www.communicationmonitor.eu / Zerfass et al. 2013 / n = 2,710 PR professionals. Q 34: Please state the communication qualifications you hold. Q 33: Please state the highest academic/educational qualifications you hold. Q 37: Are you a member of a professional organisation?
CEO communication and reputation
17
Chapter overview
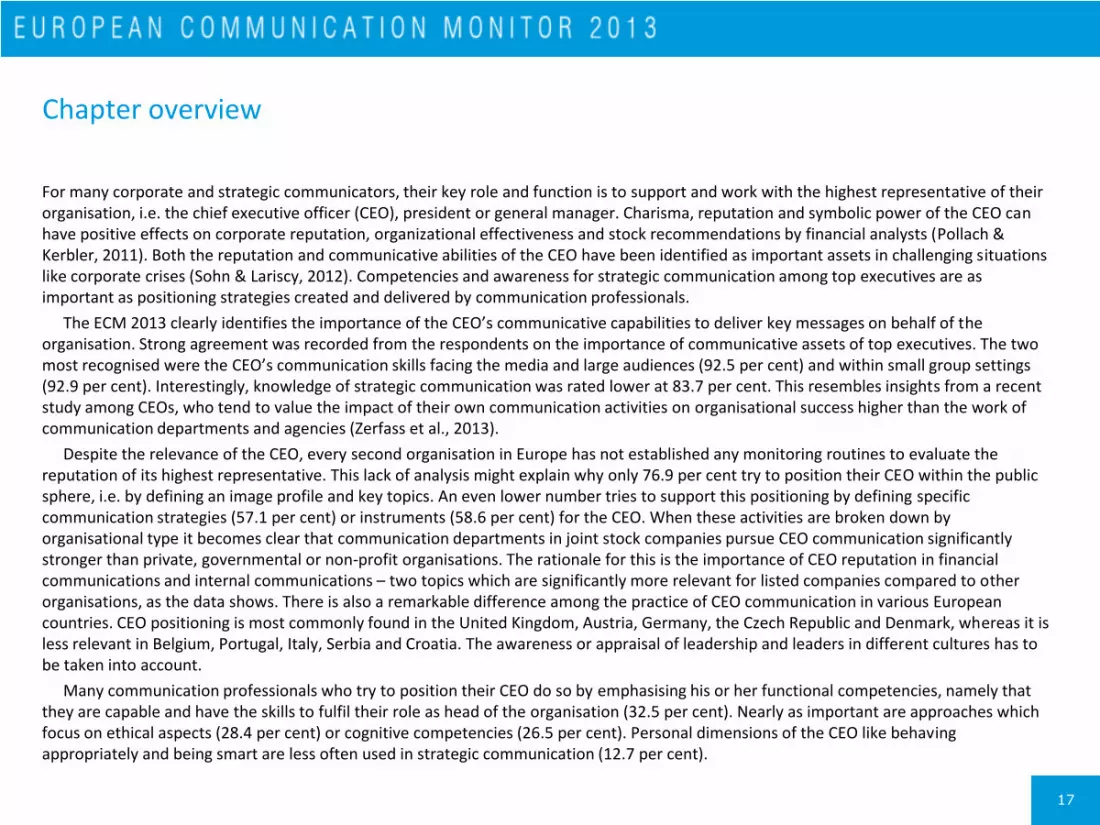
For many corporate and strategic communicators, their key role and function is to support and work with the highest representative of their organisation, i.e. the chief executive officer (CEO), president or general manager. Charisma, reputation and symbolic power of the CEO can have positive effects on corporate reputation, organizational effectiveness and stock recommendations by financial analysts (Pollach & Kerbler, 2011). Both the reputation and communicative abilities of the CEO have been identified as important assets in challenging situations like corporate crises (Sohn & Lariscy, 2012). Competencies and awareness for strategic communication among top executives are as important as positioning strategies created and delivered by communication professionals.
The ECM 2013 clearly identifies the importance of the CEO’s communicative capabilities to deliver key messages on behalf of the organisation. Strong agreement was recorded from the respondents on the importance of communicative assets of top executives. The two most recognised were the CEO’s communication skills facing the media and large audiences (92.5 per cent) and within small group settings (92.9 per cent). Interestingly, knowledge of strategic communication was rated lower at 83.7 per cent. This resembles insights from a recent study among CEOs, who tend to value the impact of their own communication activities on organisational success higher than the work of communication departments and agencies (Zerfass et al., 2013).
Despite the relevance of the CEO, every second organisation in Europe has not established any monitoring routines to evaluate the reputation of its highest representative. This lack of analysis might explain why only 76.9 per cent try to position their CEO within the public sphere, i.e. by defining an image profile and key topics. An even lower number tries to support this positioning by defining specific communication strategies (57.1 per cent) or instruments (58.6 per cent) for the CEO. When these activities are broken down by organisational type it becomes clear that communication departments in joint stock companies pursue CEO communication significantly stronger than private, governmental or non-profit organisations. The rationale for this is the importance of CEO reputation in financial communications and internal communications – two topics which are significantly more relevant for listed companies compared to other organisations, as the data shows. There is also a remarkable difference among the practice of CEO communication in various European countries. CEO positioning is most commonly found in the United Kingdom, Austria, Germany, the Czech Republic and Denmark, whereas it is less relevant in Belgium, Portugal, Italy, Serbia and Croatia. The awareness or appraisal of leadership and leaders in different cultures has to be taken into account.
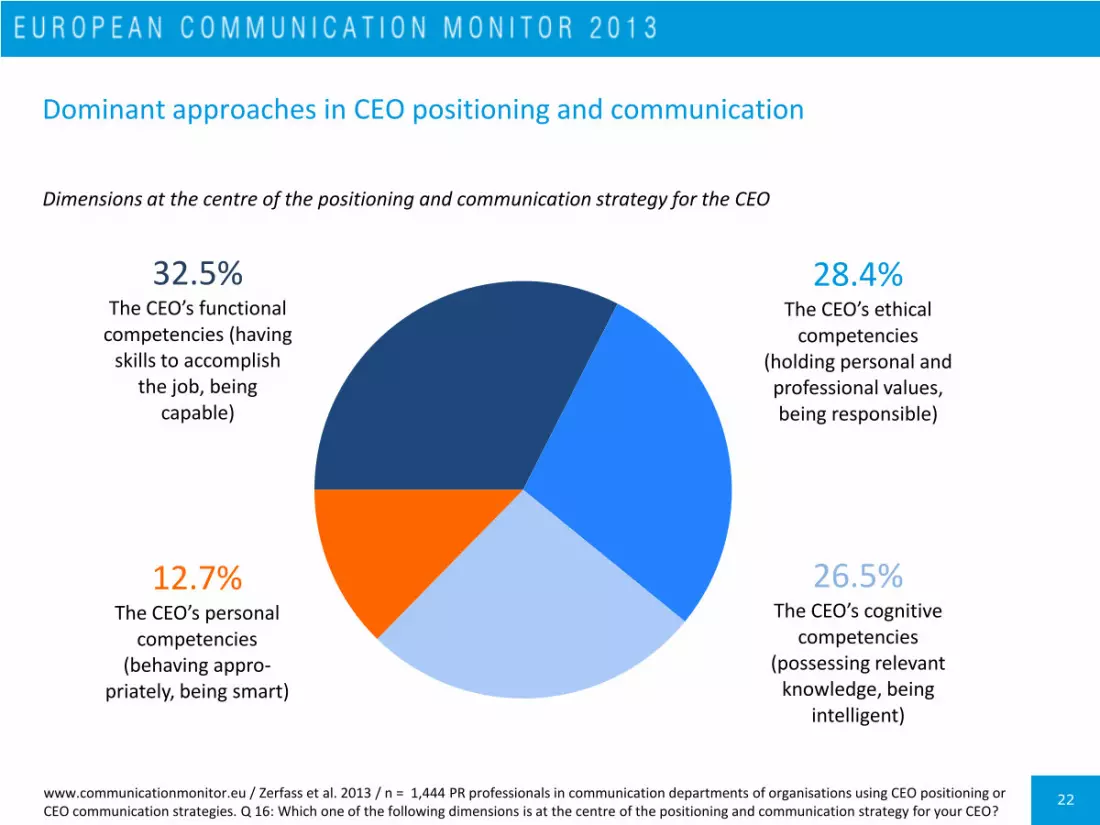
Many communication professionals who try to position their CEO do so by emphasising his or her functional competencies, namely that they are capable and have the skills to fulfil their role as head of the organisation (32.5 per cent). Nearly as important are approaches which focus on ethical aspects (28.4 per cent) or cognitive competencies (26.5 per cent). Personal dimensions of the CEO like behaving appropriately and being smart are less often used in strategic communication (12.7 per cent).

18
Communicative assets of the CEO have a major impact on organisational success
92.5%
92.9%
89.7%
83.7%
CEO’s communication skills facing the media and large audiences
CEO’s communication skills in interpersonal and small group settings
CEO’s personal reputation
CEO’s knowledge of strategic communication
Important factors for the overall success of an organisation
www.communicationmonitor.eu / Zerfass et al. 2013 / n = 2,027 PR professionals in communication departments. Q 14: Based on your professional experience, how important are the communicative assets of the CEO (= the highest representative of an organisation, i.e. chief executive officer, president, general manager etc.) for the overall success of an organisation? Scale 1 (not important) – 5 (very important). Percentages: Agreement based on scale points 4-5.

19
Practice of CEO and executive communication
76.9%
65.6%
58.6%
57.1%
55.3%
Positioning of the CEO
Positioning of other executives
Specific communication instruments for the CEO
Specific communication strategy for the CEO
Monitoring the CEO’s reputation
CEO / executive communication activities pursued by communication departments
www.communicationmonitor.eu / Zerfass et al. 2013 / n = 2,027 PR professionals in communication departments. Q 15: Does your organisation pursue any of the following activities?

20
CEO and executive communication activities in different types of organisations
www.communicationmonitor.eu / Zerfass et al. 2013 / n = 2,027 PR professionals in communication departments. Q 15: Does your organisation pursue any of the following activities? Highly significant correlations for all items (chi-square test, p ≤ 0.01).
86.0%
75.7%
68.6%
69.7%
65.6%
74.3%
64.4%
57.0%
55.7%
52.3%
71.6%
56.1%
53.0%
49.2%
53.9%
68.9%
58.7%
47.8%
43.5%
42.2%
Positioning of the CEO
Positioning of other executives
Specific communication instruments for the CEO
Specific communication strategy for the CEO
Monitoring the CEO’s reputation
Joint stock companies
Private companies
Governmental organisations
Non-profit organisations
21
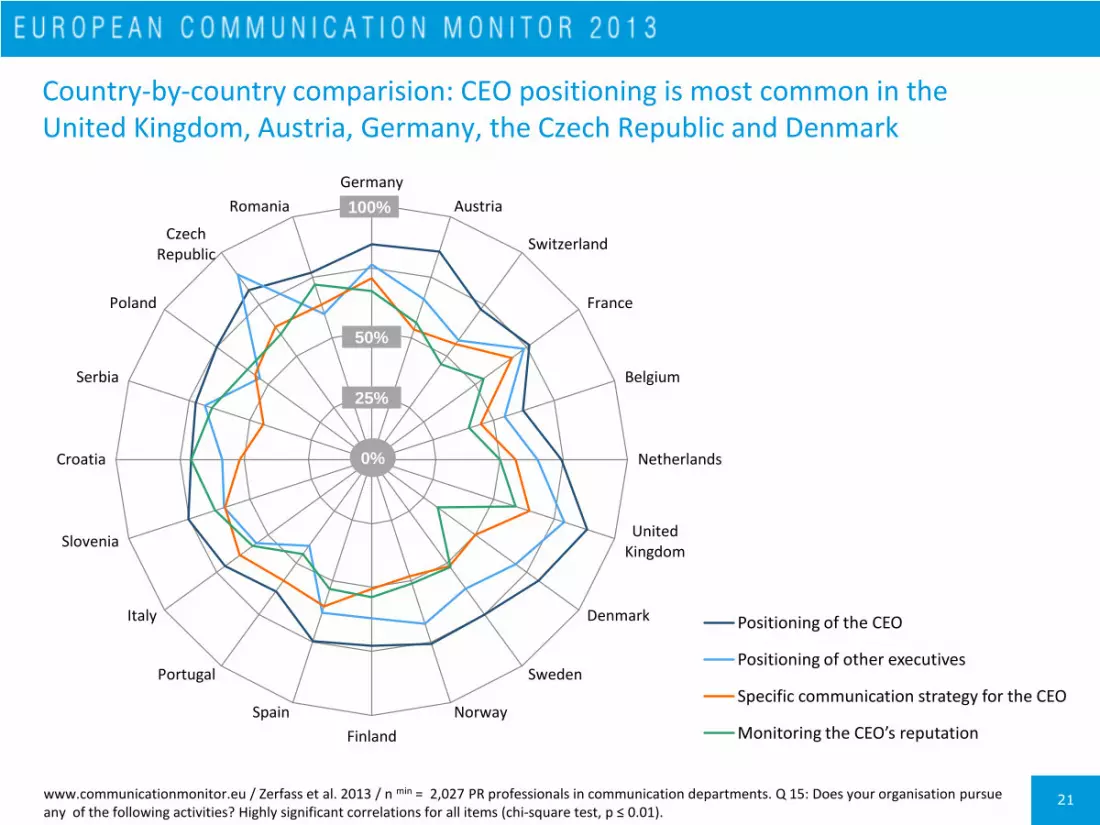
Country-by-country comparision: CEO positioning is most common in the United Kingdom, Austria, Germany, the Czech Republic and Denmark
www.communicationmonitor.eu / Zerfass et al. 2013 / n min = 2,027 PR professionals in communication departments. Q 15: Does your organisation pursue any of the following activities? Highly significant correlations for all items (chi-square test, p ≤ 0.01).
Germany
Austria
Switzerland
France
Belgium
Netherlands
United Kingdom
Denmark
Sweden
Norway
Finland
Spain
Portugal
Italy
Slovenia
Croatia
Serbia
Poland
Czech Republic
Romania
Positioning of the CEO
Positioning of other executives
Specific communication strategy for the CEO
Monitoring the CEO’s reputation
0%
100%
50%
25%
22
Dominant approaches in CEO positioning and communication
32.5% The CEO’s functional
competencies (having skills to accomplish
the job, being capable)
28.4% The CEO’s ethical
competencies (holding personal and professional values, being responsible)
26.5% The CEO’s cognitive
competencies (possessing relevant
knowledge, being intelligent)
12.7% The CEO’s personal
competencies (behaving appro-
priately, being smart)
Dimensions at the centre of the positioning and communication strategy for the CEO
www.communicationmonitor.eu / Zerfass et al. 2013 / n = 1,444 PR professionals in communication departments of organisations using CEO positioning or CEO communication strategies. Q 16: Which one of the following dimensions is at the centre of the positioning and communication strategy for your CEO?

23
Depending on the type of organisation, CEO reputation is most relevant in different areas of strategic communication
Joint stock companies
Private companies
Governmental organisations
Non-profit organisations
Overall
Marketing communications 7.0% 17.3% 3.1% 7.4% 8.8%
Financial communications 29.3% 12.4% 3.7% 2.9% 15.5%
Internal communications 20.9% 25.8% 15.9% 17.2% 20.5%
Political communication 15.7% 22.3% 26.4% 25.0% 21.1%
Public and community relations 12.9% 12.4% 39.7% 38.5% 22.4%
Crisis communications 14.1% 9.9% 11.2% 9.0% 11.6%
www.communicationmonitor.eu / Zerfass et al. 2013 / n = 1,444 PR professionals in communication departments using CEO positioning or specific CEO communication strategies. Q 17: What was the most important communicative situation for your organisation during the last 12 months, in which the reputation of the CEO was crucial for success? It was in the area of … (marketing, financial, … communications). Highly significant correlations for all items (chi-square test, p ≤ 0.01, Cramers V = 0.262).

Digital gatekeepers and social media communication
25
Chapter overview
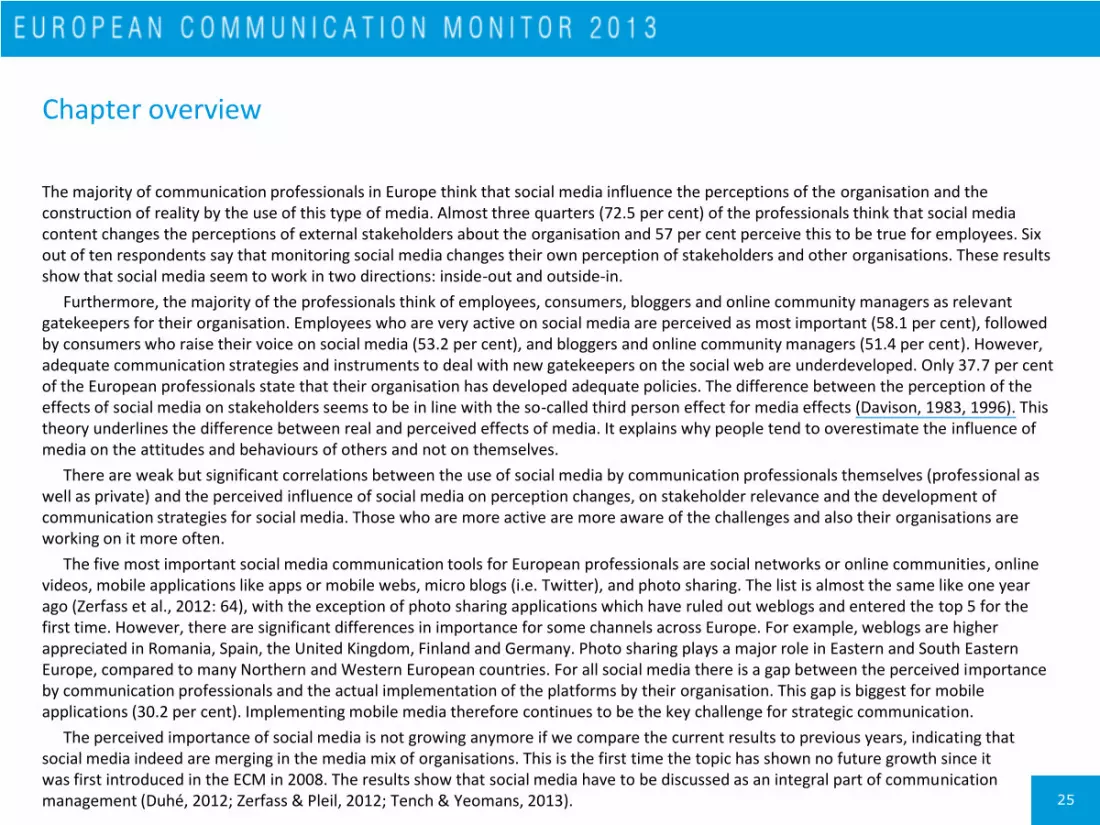
The majority of communication professionals in Europe think that social media influence the perceptions of the organisation and the construction of reality by the use of this type of media. Almost three quarters (72.5 per cent) of the professionals think that social media content changes the perceptions of external stakeholders about the organisation and 57 per cent perceive this to be true for employees. Six out of ten respondents say that monitoring social media changes their own perception of stakeholders and other organisations. These results show that social media seem to work in two directions: inside-out and outside-in.
Furthermore, the majority of the professionals think of employees, consumers, bloggers and online community managers as relevant gatekeepers for their organisation. Employees who are very active on social media are perceived as most important (58.1 per cent), followed by consumers who raise their voice on social media (53.2 per cent), and bloggers and online community managers (51.4 per cent). However, adequate communication strategies and instruments to deal with new gatekeepers on the social web are underdeveloped. Only 37.7 per cent of the European professionals state that their organisation has developed adequate policies. The difference between the perception of the effects of social media on stakeholders seems to be in line with the so-called third person effect for media effects (Davison, 1983, 1996). This theory underlines the difference between real and perceived effects of media. It explains why people tend to overestimate the influence of media on the attitudes and behaviours of others and not on themselves.
There are weak but significant correlations between the use of social media by communication professionals themselves (professional as well as private) and the perceived influence of social media on perception changes, on stakeholder relevance and the development of communication strategies for social media. Those who are more active are more aware of the challenges and also their organisations are working on it more often.
The five most important social media communication tools for European professionals are social networks or online communities, online videos, mobile applications like apps or mobile webs, micro blogs (i.e. Twitter), and photo sharing. The list is almost the same like one year ago (Zerfass et al., 2012: 64), with the exception of photo sharing applications which have ruled out weblogs and entered the top 5 for the first time. However, there are significant differences in importance for some channels across Europe. For example, weblogs are higher appreciated in Romania, Spain, the United Kingdom, Finland and Germany. Photo sharing plays a major role in Eastern and South Eastern Europe, compared to many Northern and Western European countries. For all social media there is a gap between the perceived importance by communication professionals and the actual implementation of the platforms by their organisation. This gap is biggest for mobile applications (30.2 per cent). Implementing mobile media therefore continues to be the key challenge for strategic communication.
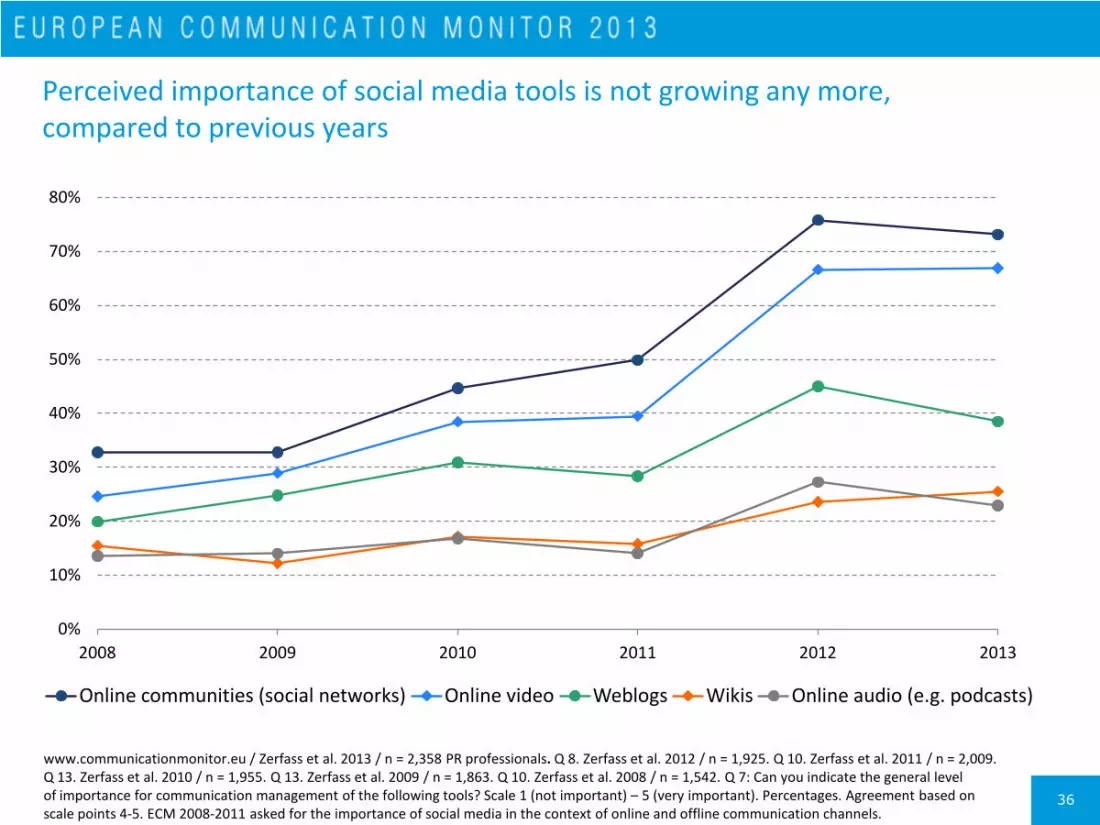
The perceived importance of social media is not growing anymore if we compare the current results to previous years, indicating that social media indeed are merging in the media mix of organisations. This is the first time the topic has shown no future growth since it was first introduced in the ECM in 2008. The results show that social media have to be discussed as an integral part of communication management (Duhé, 2012; Zerfass & Pleil, 2012; Tench & Yeomans, 2013).
26
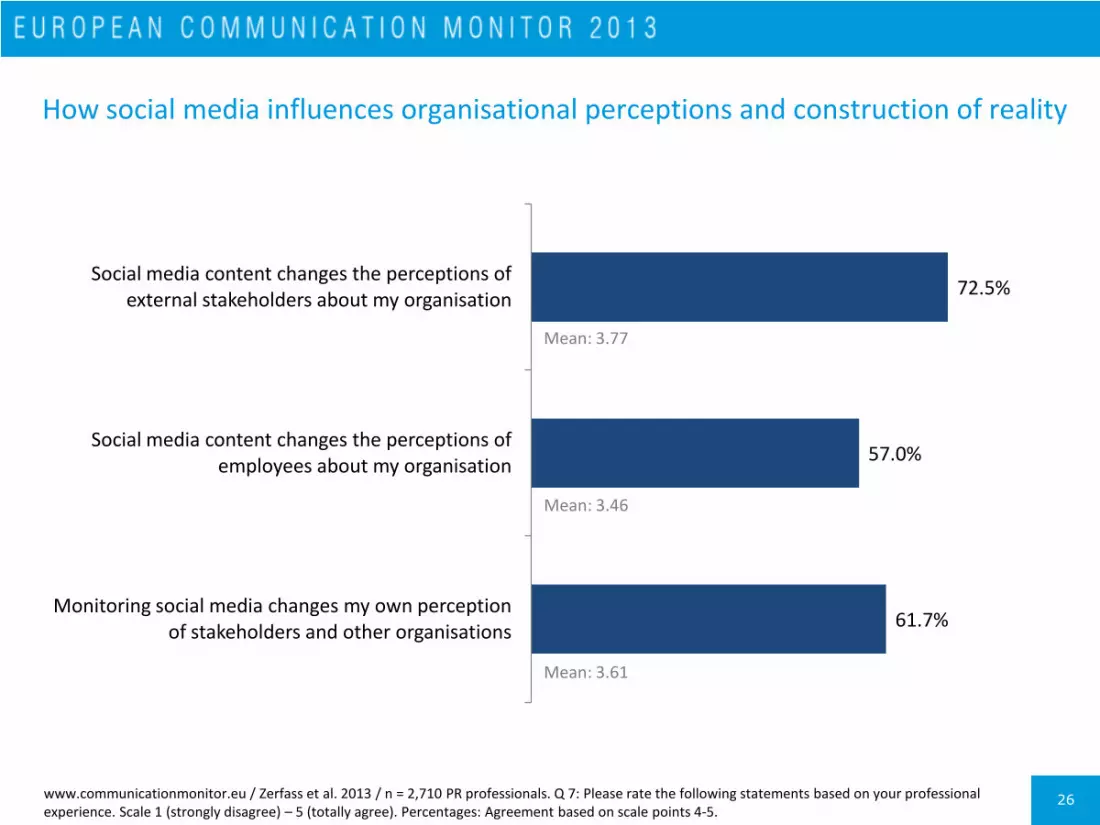
How social media influences organisational perceptions and construction of reality
www.communicationmonitor.eu / Zerfass et al. 2013 / n = 2,710 PR professionals. Q 7: Please rate the following statements based on your professional experience. Scale 1 (strongly disagree) – 5 (totally agree). Percentages: Agreement based on scale points 4-5.
72.5%
57.0%
61.7%
Social media content changes the perceptions of external stakeholders about my organisation
Social media content changes the perceptions of employees about my organisation
Monitoring social media changes my own perception of stakeholders and other organisations
Mean: 3.46
Mean: 3.61
Mean: 3.77
27
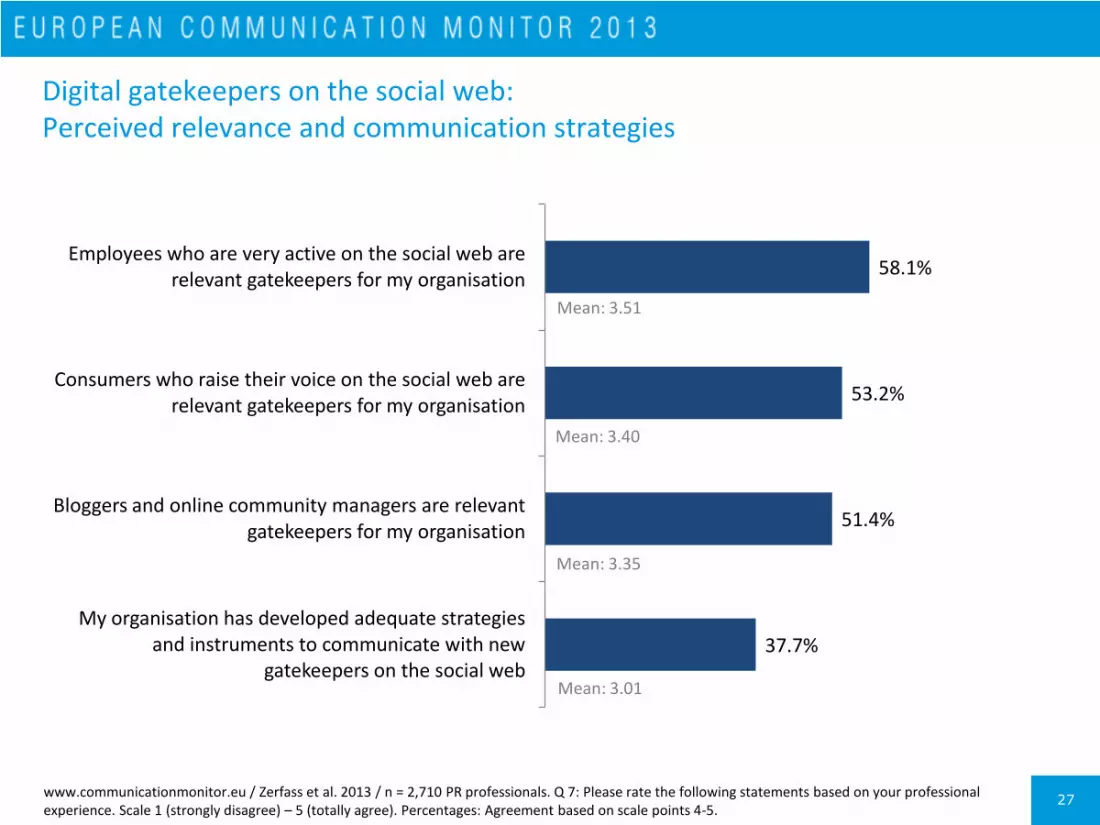
Digital gatekeepers on the social web: Perceived relevance and communication strategies
www.communicationmonitor.eu / Zerfass et al. 2013 / n = 2,710 PR professionals. Q 7: Please rate the following statements based on your professional experience. Scale 1 (strongly disagree) – 5 (totally agree). Percentages: Agreement based on scale points 4-5.
58.1%
53.2%
51.4%
37.7%
Employees who are very active on the social web are relevant gatekeepers for my organisation
Consumers who raise their voice on the social web are relevant gatekeepers for my organisation
Bloggers and online community managers are relevant gatekeepers for my organisation
My organisation has developed adequate strategies and instruments to communicate with new
gatekeepers on the social web
Mean: 3.51
Mean: 3.40
Mean: 3.35
Mean: 3.01
28
0
1
2
3
4
2.50 3.00 3.50 4.00
Germany Austria Switzerland France Belgium Netherlands
Consumers who raise their voice on the social web are
relevant gatekeepers for my organisation
Employees who are very active on the social web are relevant gatekeepers for my
organisation
My organisation has developed adequate
strategies and instruments to communicate with new
gatekeepers
Bloggers and online community managers are
relevant gatekeepers for my organisation
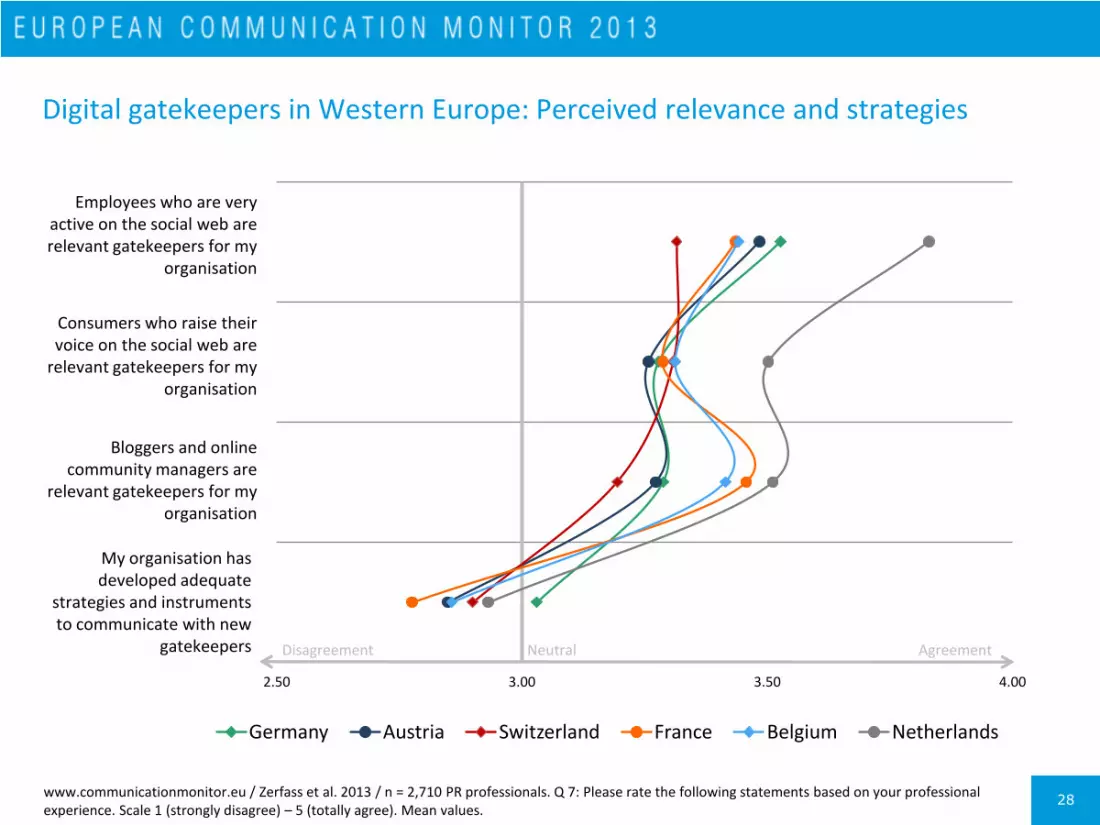
Digital gatekeepers in Western Europe: Perceived relevance and strategies
www.communicationmonitor.eu / Zerfass et al. 2013 / n = 2,710 PR professionals. Q 7: Please rate the following statements based on your professional experience. Scale 1 (strongly disagree) – 5 (totally agree). Mean values.
Disagreement Neutral Agreement

29
Digital gatekeepers in Northern Europe: Perceived relevance and strategies
www.communicationmonitor.eu / Zerfass et al. 2013 / n = 2,710 PR professionals. Q 7: Please rate the following statements based on your professional experience. Scale 1 (strongly disagree) – 5 (fully agree). Mean values.
0
1
2
3
4
2.50 3.00 3.50 4.00
United Kingdom Denmark Sweden Norway Finland
Consumers who raise their voice on the social web are
relevant gatekeepers for my organisation
Employees who are very active on the social web are relevant gatekeepers for my
organisation
My organisation has developed adequate
strategies and instruments to communicate with new
gatekeepers
Bloggers and online community managers are
relevant gatekeepers for my organisation
Disagreement Neutral Agreement
30
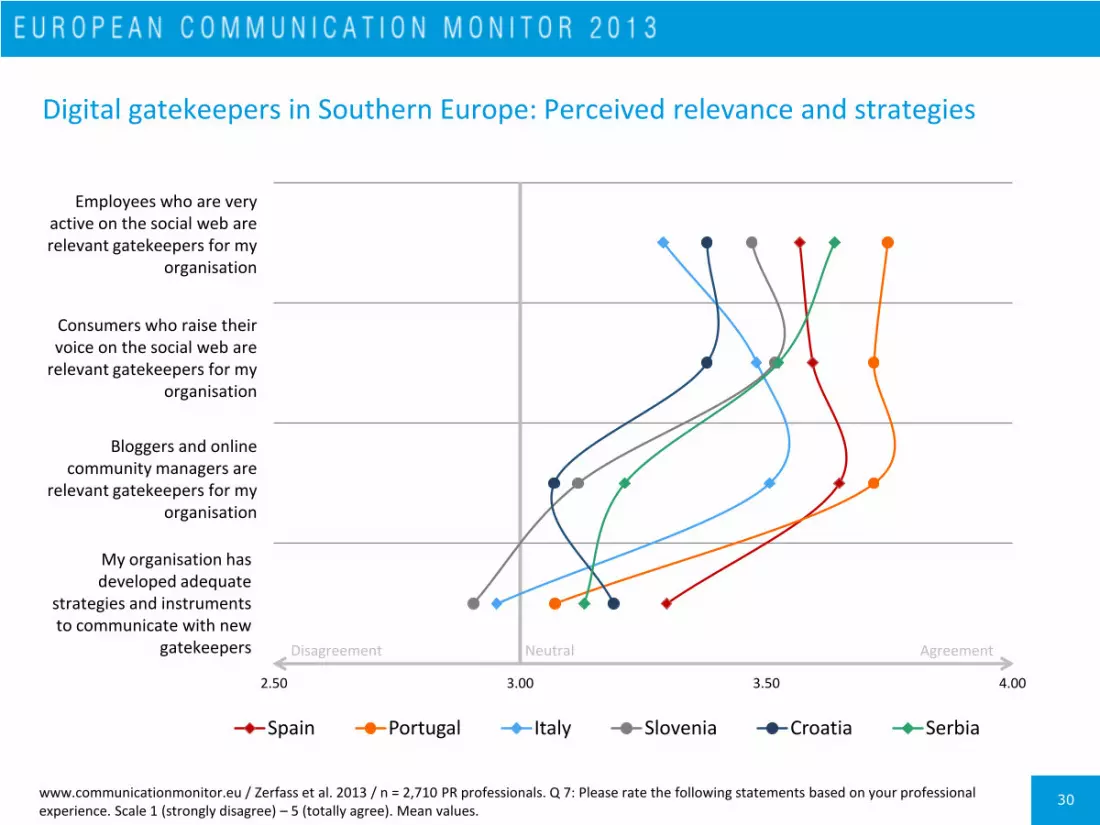
Digital gatekeepers in Southern Europe: Perceived relevance and strategies
www.communicationmonitor.eu / Zerfass et al. 2013 / n = 2,710 PR professionals. Q 7: Please rate the following statements based on your professional experience. Scale 1 (strongly disagree) – 5 (totally agree). Mean values.
0
1
2
3
4
2.50 3.00 3.50 4.00
Spain Portugal Italy Slovenia Croatia Serbia
Consumers who raise their voice on the social web are
relevant gatekeepers for my organisation
Employees who are very active on the social web are relevant gatekeepers for my
organisation
My organisation has developed adequate
strategies and instruments to communicate with new
gatekeepers
Bloggers and online community managers are
relevant gatekeepers for my organisation
Disagreement Neutral Agreement
31
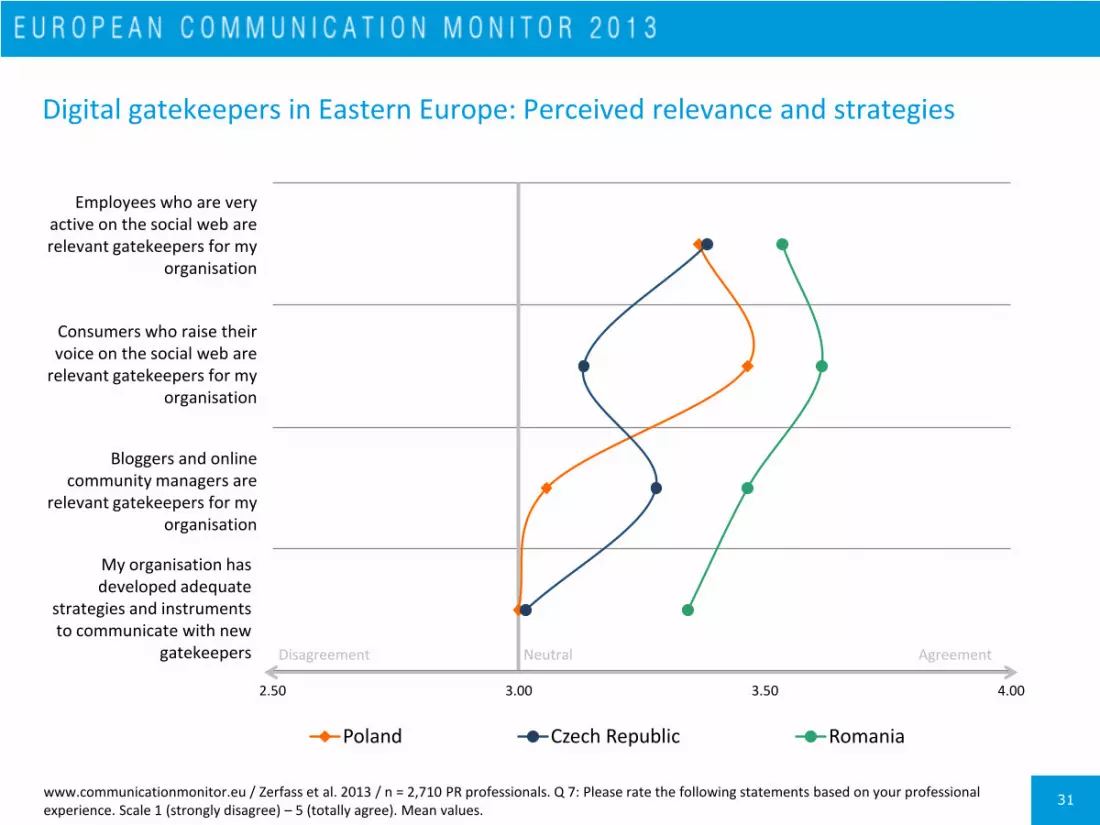
Digital gatekeepers in Eastern Europe: Perceived relevance and strategies
www.communicationmonitor.eu / Zerfass et al. 2013 / n = 2,710 PR professionals. Q 7: Please rate the following statements based on your professional experience. Scale 1 (strongly disagree) – 5 (totally agree). Mean values.
0
1
2
3
4
2.50 3.00 3.50 4.00
Poland Czech Republic Romania
Consumers who raise their voice on the social web are
relevant gatekeepers for my organisation
Employees who are very active on the social web are relevant gatekeepers for my
organisation
My organisation has developed adequate
strategies and instruments to communicate with new
gatekeepers
Bloggers and online community managers are
relevant gatekeepers for my organisation
Disagreement Neutral Agreement

32
Social media use of communication professionals correlates positively with perception changes, stakeholder relevance and strategy development
www.communicationmonitor.eu / Zerfass et al. 2013 / n = 2,710 PR professionals. Q 7: Please rate the following statements based on your professional experience. Q 35: How often do you use social media platforms (Facebook, Linked-In, Twitter, etc.) for professional reasons? Q 36: How often do you use social media platforms for private reasons? Highly significant correlations for all items (Kendall rank correlation, p ≤ 0.01).
Professional use of social media
Private use of social media
Social media content changes the perceptions of external stakeholders about my organisation
τ = 0.228 τ = 0.148
Social media content changes the perceptions of employees about my organisation
τ = 0.157 τ = 0.096
Monitoring social media changes my own perception of stakeholders and other organisations
τ = 0.184 τ = 0.133
Bloggers and online community managers are relevant gatekeepers for my organisation
τ = 0.160 τ = 0.106
Consumers who raise their voice on the social web are relevant gatekeepers for my organisation
τ = 0.133 τ = 0.100
Employees who are very active on the social web are relevant gatekeepers for my organisation
τ = 0.157 τ = 0.094
My organisation has developed adequate strategies and instruments to communicate with new gatekeepers on the social web
τ = 0.238 τ = 0.063
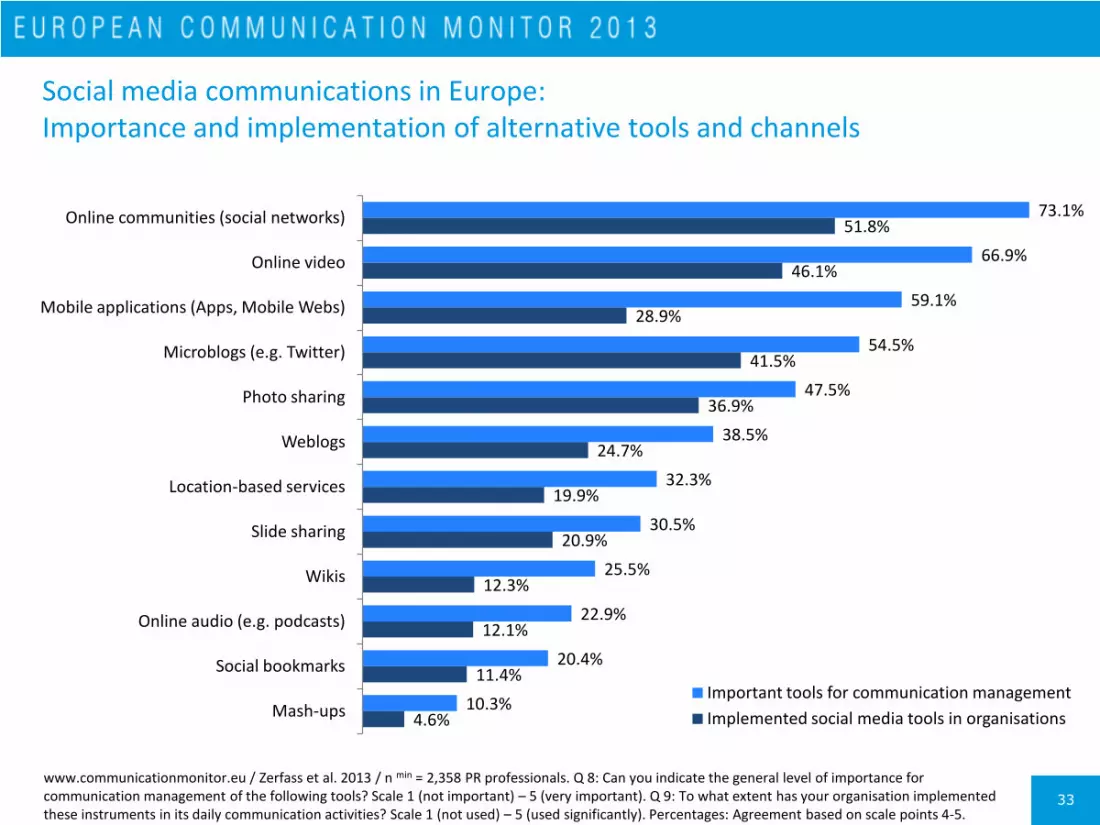
33
Social media communications in Europe: Importance and implementation of alternative tools and channels
73.1%
66.9%
59.1%
54.5%
47.5%
38.5%
32.3%
30.5%
25.5%
22.9%
20.4%
10.3%
51.8%
46.1%
28.9%
41.5%
36.9%
24.7%
19.9%
20.9%
12.3%
12.1%
11.4%
4.6%
Online communities (social networks)
Online video
Mobile applications (Apps, Mobile Webs)
Microblogs (e.g. Twitter)
Photo sharing
Weblogs
Location-based services
Slide sharing
Wikis
Online audio (e.g. podcasts)
Social bookmarks
Mash-ups Important tools for communication management
Implemented social media tools in organisations
www.communicationmonitor.eu / Zerfass et al. 2013 / n min = 2,358 PR professionals. Q 8: Can you indicate the general level of importance for communication management of the following tools? Scale 1 (not important) – 5 (very important). Q 9: To what extent has your organisation implemented these instruments in its daily communication activities? Scale 1 (not used) – 5 (used significantly). Percentages: Agreement based on scale points 4-5.
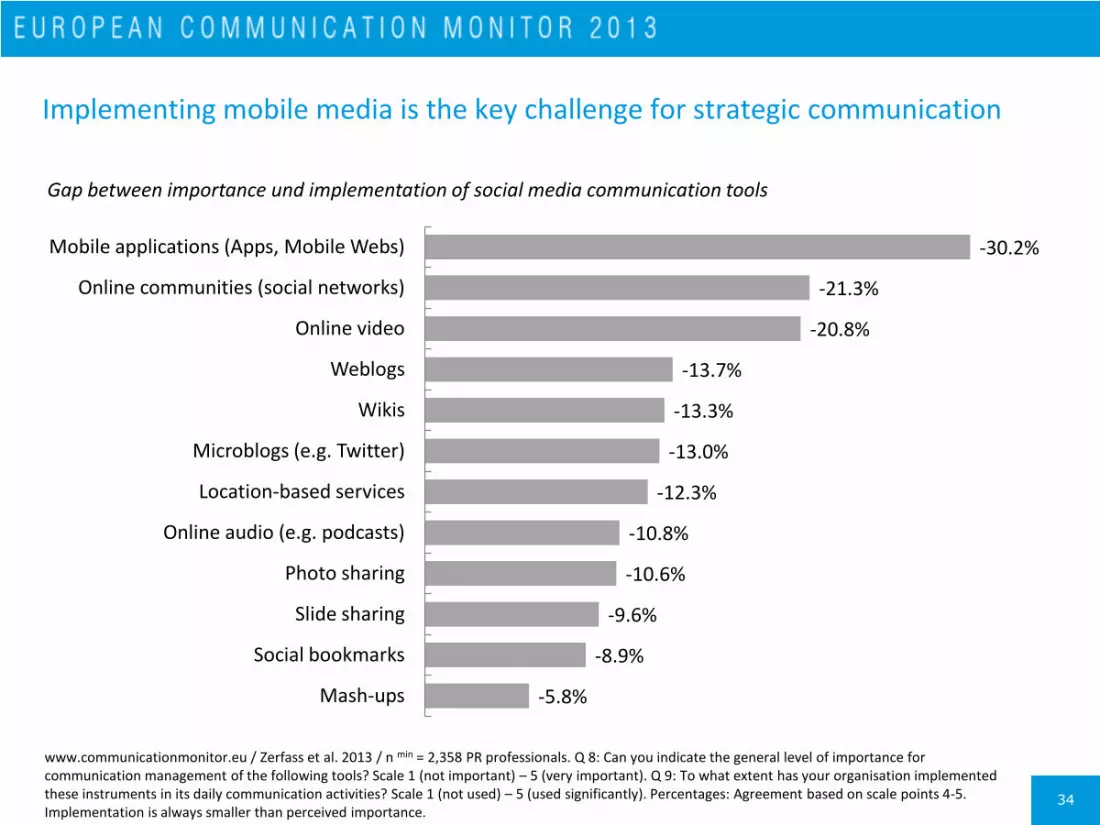
34
Implementing mobile media is the key challenge for strategic communication
-30.2%
-21.3%
-20.8%
-13.7%
-13.3%
-13.0%
-12.3%
-10.8%
-10.6%
-9.6%
-8.9%
-5.8%
Mobile applications (Apps, Mobile Webs)
Online communities (social networks)
Online video
Weblogs
Wikis
Microblogs (e.g. Twitter)
Location-based services
Online audio (e.g. podcasts)
Photo sharing
Slide sharing
Social bookmarks
Mash-ups
Gap between importance und implementation of social media communication tools
www.communicationmonitor.eu / Zerfass et al. 2013 / n min = 2,358 PR professionals. Q 8: Can you indicate the general level of importance for communication management of the following tools? Scale 1 (not important) – 5 (very important). Q 9: To what extent has your organisation implemented these instruments in its daily communication activities? Scale 1 (not used) – 5 (used significantly). Percentages: Agreement based on scale points 4-5. Implementation is always smaller than perceived importance.

35
Opportunities and needs for enhancing social media communication
www.communicationmonitor.eu / Zerfass et al. 2013 / n min = 2,358 PR professionals. Q 8: Can you indicate the general level of importance for communication management of the following tools? Scale 1 (not important) – 5 (very important). Q 9: To what extent has your organisation implemented these instruments in its daily communication activities? Scale 1 (not used) – 5 (used significantly). Percentages: Agreement based on scale points 4-5. Implementation is always smaller than perceived importance.
Wikis (2.71 | 2.06)
Social bookmarks (2.62 | 2.07)
Online audio (2.56 | 1.94)
Online video (3.78 | 3.25)
Weblogs (3.07 | 2.46)
Microblogs (3.46 | 3.00)
Online communities (3.95 | 3.43)
Photo sharing (3.26 | 2.93)
Slide sharing (2.88 | 2.40)
Mobile applications (3.58 | 2.65)
Mash-ups (2.30 | 1.76)
Location-based services (2.88 | 2.36)
1.00
3.00
5.00
1.00 3.00 5.00
Imp
ort
ance
of
soci
al m
edia
to
ols
Implementation of social media tools 1.00 (not used at all)
5.00 (used significantly)
5.00 (very important)
(not important) 1.00
36
Perceived importance of social media tools is not growing any more, compared to previous years
0%
10%
20%
30%
40%
50%
60%
70%
80%
2008 2009 2010 2011 2012 2013
Online communities (social networks) Online video Weblogs Wikis Online audio (e.g. podcasts)
www.communicationmonitor.eu / Zerfass et al. 2013 / n = 2,358 PR professionals. Q 8. Zerfass et al. 2012 / n = 1,925. Q 10. Zerfass et al. 2011 / n = 2,009. Q 13. Zerfass et al. 2010 / n = 1,955. Q 13. Zerfass et al. 2009 / n = 1,863. Q 10. Zerfass et al. 2008 / n = 1,542. Q 7: Can you indicate the general level of importance for communication management of the following tools? Scale 1 (not important) – 5 (very important). Percentages. Agreement based on scale points 4-5. ECM 2008-2011 asked for the importance of social media in the context of online and offline communication channels.

37
Significant differences between the perceived importance of weblogs, photo sharing and location based services across Europe
Weblogs Photo sharing Location-based
services Weblogs Photo sharing
Location-based services
Germany 44.9% 35.6% 35.3% Finland 45.6% 47.1% 29.2%
Austria 35.0% 45.5% 30.8% Spain 51.8% 48.6% 31.9%
Switzerland 36.0% 39.9% 34.3% Portugal 44,3% 46,9% 41.5%
France 38.8% 45.5% 26.2% Italy 38.4% 41.8% 38.1%
Belgium 38.3% 36.2% 27.8% Slovenia 30.7% 46.8% 35.1%
Netherlands 38.9% 44.8% 27.7% Croatia 28.3% 61.8% 35.2%
United Kingdom 45.6% 35.7% 22.7% Serbia 31.0% 69.5% 45.6%
Denmark 16.2% 38.2% 27.0% Poland 34.8% 55.9% 35.4%
Sweden 31.7% 47.2% 31.7% Czech Republic 16.7% 54.7% 36.5%
Norway 24.8% 38.5% 20.6% Romania 53.2% 67.4% 31.9%
www.communicationmonitor.eu / Zerfass et al. 2013 / n = 2,358 PR professionals. Q 8: Can you indicate the general level of importance for communication management of the following tools? Scale 1 (not important) – 5 (very important). Percentages: Agreement based on scale points 4-5. Highly significant correlations for all items (chi-square test, p ≤ 0.01).

Social media skills and use by professionals
39
Chapter overview
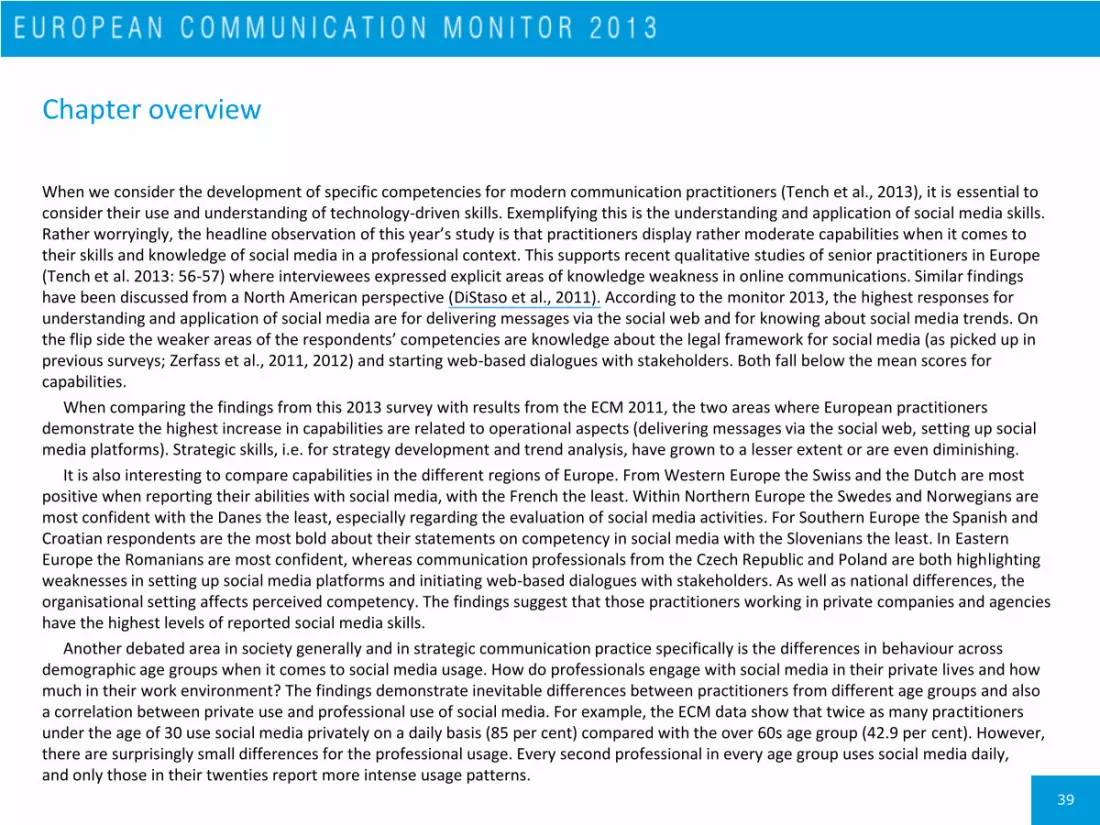
When we consider the development of specific competencies for modern communication practitioners (Tench et al., 2013), it is essential to consider their use and understanding of technology-driven skills. Exemplifying this is the understanding and application of social media skills. Rather worryingly, the headline observation of this year’s study is that practitioners display rather moderate capabilities when it comes to their skills and knowledge of social media in a professional context. This supports recent qualitative studies of senior practitioners in Europe (Tench et al. 2013: 56-57) where interviewees expressed explicit areas of knowledge weakness in online communications. Similar findings have been discussed from a North American perspective (DiStaso et al., 2011). According to the monitor 2013, the highest responses for understanding and application of social media are for delivering messages via the social web and for knowing about social media trends. On the flip side the weaker areas of the respondents’ competencies are knowledge about the legal framework for social media (as picked up in previous surveys; Zerfass et al., 2011, 2012) and starting web-based dialogues with stakeholders. Both fall below the mean scores for capabilities.
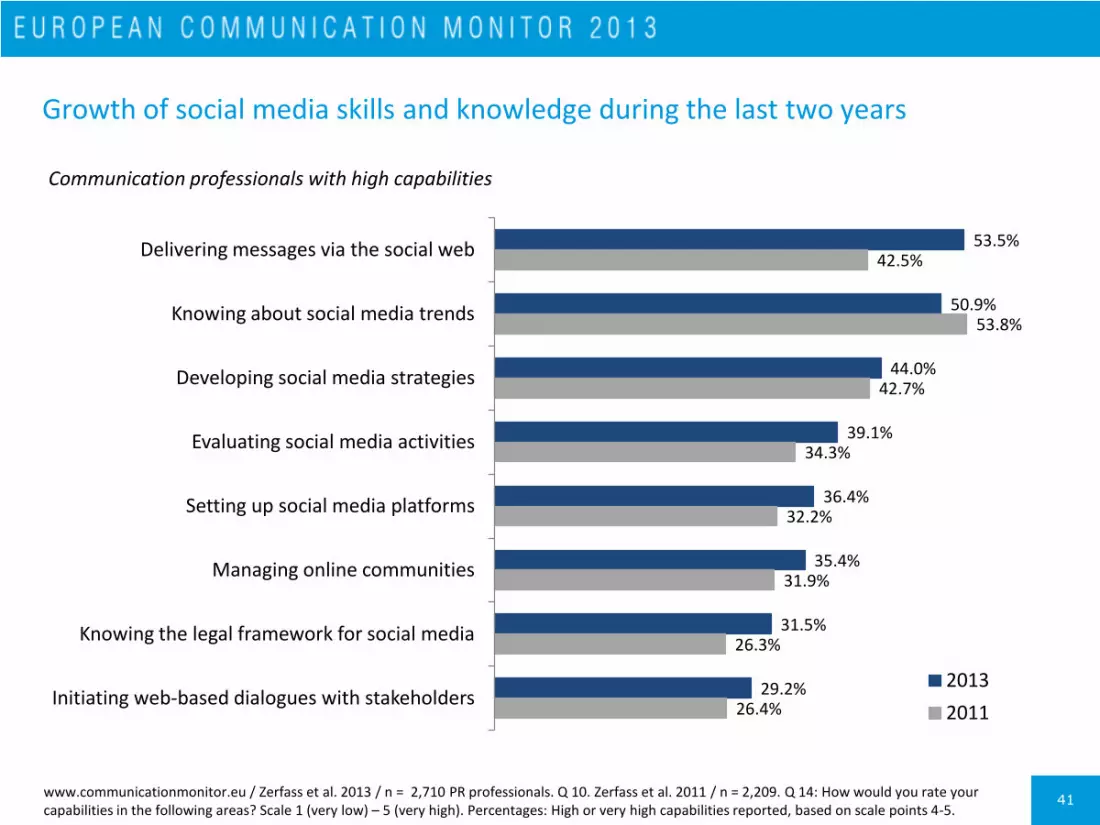
When comparing the findings from this 2013 survey with results from the ECM 2011, the two areas where European practitioners demonstrate the highest increase in capabilities are related to operational aspects (delivering messages via the social web, setting up social media platforms). Strategic skills, i.e. for strategy development and trend analysis, have grown to a lesser extent or are even diminishing.
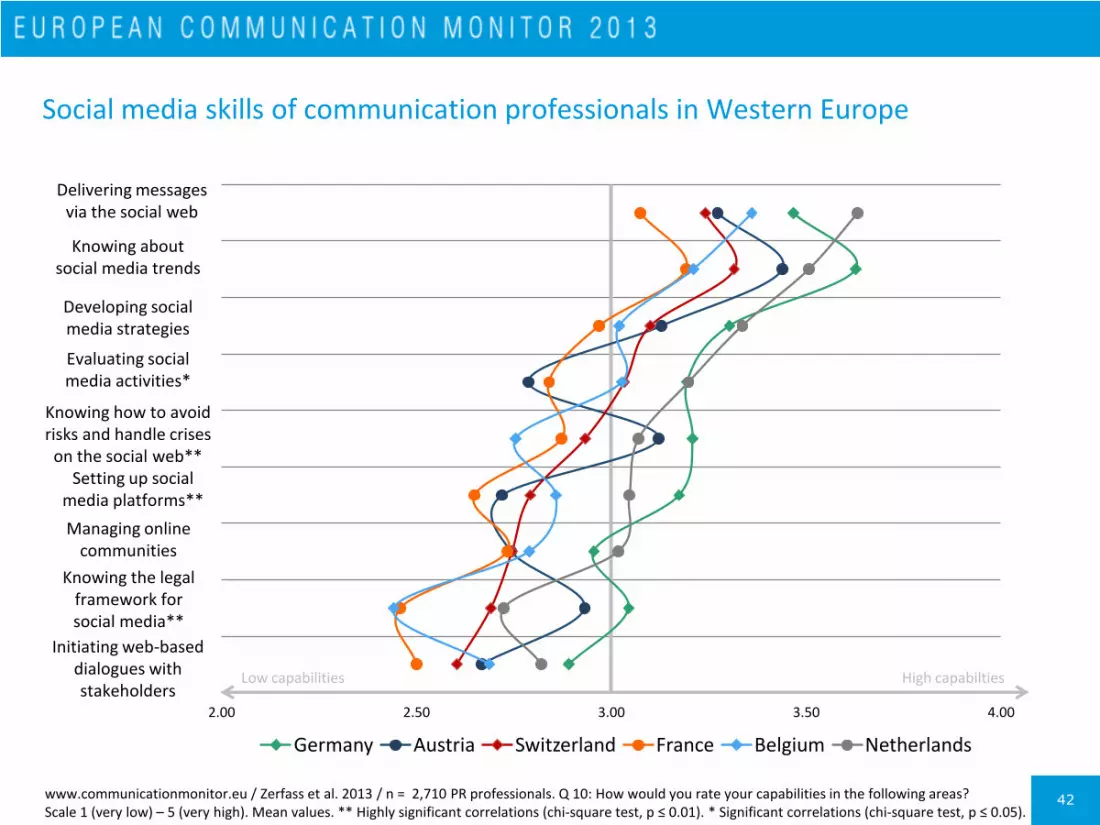
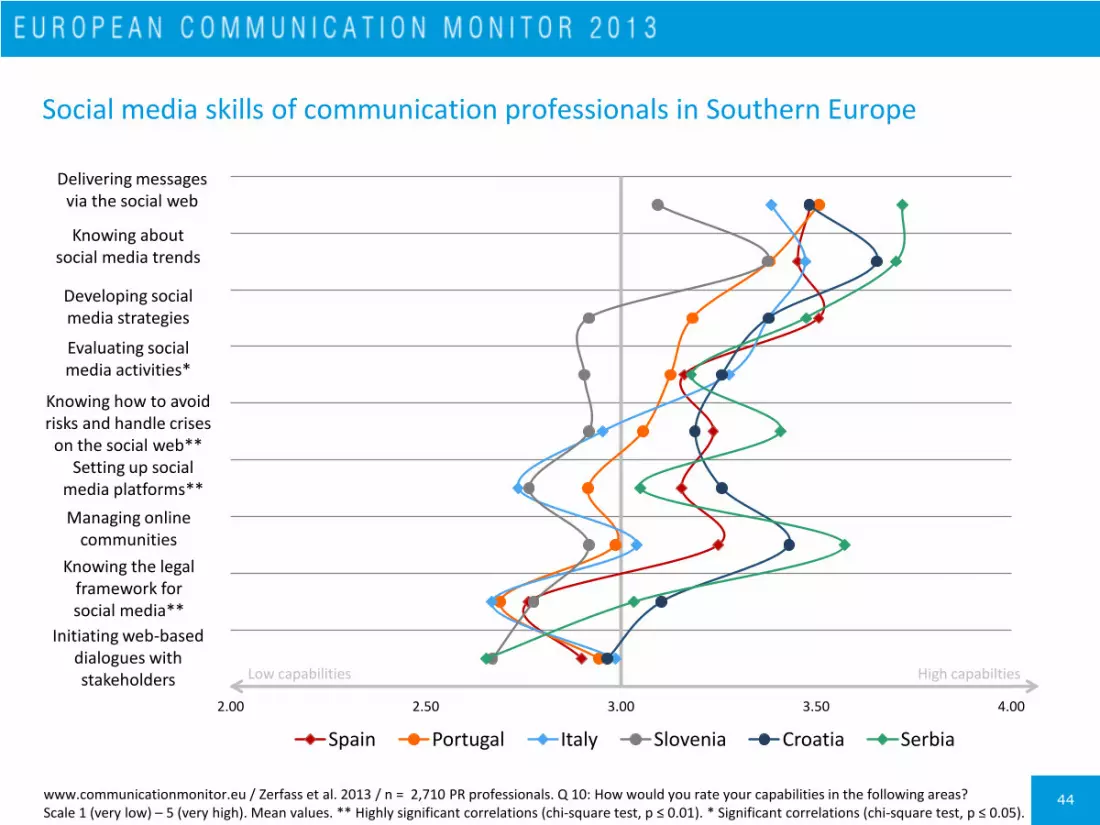
It is also interesting to compare capabilities in the different regions of Europe. From Western Europe the Swiss and the Dutch are most positive when reporting their abilities with social media, with the French the least. Within Northern Europe the Swedes and Norwegians are most confident with the Danes the least, especially regarding the evaluation of social media activities. For Southern Europe the Spanish and Croatian respondents are the most bold about their statements on competency in social media with the Slovenians the least. In Eastern Europe the Romanians are most confident, whereas communication professionals from the Czech Republic and Poland are both highlighting weaknesses in setting up social media platforms and initiating web-based dialogues with stakeholders. As well as national differences, the organisational setting affects perceived competency. The findings suggest that those practitioners working in private companies and agencies have the highest levels of reported social media skills.
Another debated area in society generally and in strategic communication practice specifically is the differences in behaviour across demographic age groups when it comes to social media usage. How do professionals engage with social media in their private lives and how much in their work environment? The findings demonstrate inevitable differences between practitioners from different age groups and also a correlation between private use and professional use of social media. For example, the ECM data show that twice as many practitioners under the age of 30 use social media privately on a daily basis (85 per cent) compared with the over 60s age group (42.9 per cent). However, there are surprisingly small differences for the professional usage. Every second professional in every age group uses social media daily, and only those in their twenties report more intense usage patterns.

40
Social media skills and knowledge: Communication professionals in Europe report moderate capabilities
www.communicationmonitor.eu / Zerfass et al. 2013 / n = 2,710 PR professionals. Q 10: How would you rate your capabilities in the following areas? Scale 1 (very low) – 5 (very high). Percentages: High or very high capabilities reported, based on scale points 4-5. Mean values.
53.5%
50.9%
44.0%
39.1%
38.9%
36.4%
35.4%
31.5%
29.2%
3.46
3.45
3.25
3.12
3.09
2.99
3.00
2.86
2.82
1.00 1.50 2.00 2.50 3.00 3.50 4.00
0 0.5
Delivering messages via the social web
Knowing about social media trends
Developing social media strategies
Evaluating social media activities
Knowing how to avoid risks and handle crises on the social web
Setting up social media platforms
Managing online communities
Knowing the legal framework for social media
Initiating web-based dialogues with stakeholders
Communication professionals with high capabilities Mean rating of capabilities (scale 1-5)
1.00 very low 3.00 very high 5.00
41
Growth of social media skills and knowledge during the last two years
www.communicationmonitor.eu / Zerfass et al. 2013 / n = 2,710 PR professionals. Q 10. Zerfass et al. 2011 / n = 2,209. Q 14: How would you rate your capabilities in the following areas? Scale 1 (very low) – 5 (very high). Percentages: High or very high capabilities reported, based on scale points 4-5.
53.5%
50.9%
44.0%
39.1%
36.4%
35.4%
31.5%
29.2%
42.5%
53.8%
42.7%
34.3%
32.2%
31.9%
26.3%
26.4%
Delivering messages via the social web
Knowing about social media trends
Developing social media strategies
Evaluating social media activities
Setting up social media platforms
Managing online communities
Knowing the legal framework for social media
Initiating web-based dialogues with stakeholders
Communication professionals with high capabilities
2013
2011
42
Social media skills of communication professionals in Western Europe
www.communicationmonitor.eu / Zerfass et al. 2013 / n = 2,710 PR professionals. Q 10: How would you rate your capabilities in the following areas? Scale 1 (very low) – 5 (very high). Mean values. ** Highly significant correlations (chi-square test, p ≤ 0.01). * Significant correlations (chi-square test, p ≤ 0.05).
2.00 2.50 3.00 3.50 4.00
Germany Austria Switzerland France Belgium Netherlands
Delivering messages via the social web
Knowing about social media trends
Knowing how to avoid risks and handle crises
on the social web**
Evaluating social media activities*
Developing social media strategies
Knowing the legal framework for social media**
Setting up social media platforms**
Initiating web-based dialogues with stakeholders
Managing online communities
Low capabilities High capabilties

43
2.00 2.50 3.00 3.50 4.00
United Kingdom Denmark Sweden Norway Finland
Social media skills of communication professionals in Northern Europe
Low capabilities High capabilties
www.communicationmonitor.eu / Zerfass et al. 2013 / n = 2,710 PR professionals. Q 10: How would you rate your capabilities in the following areas? Scale 1 (very low) – 5 (very high). Mean values. ** Highly significant correlations (chi-square test, p ≤ 0.01). * Significant correlations (chi-square test, p ≤ 0.05).
Delivering messages via the social web
Knowing about social media trends
Knowing how to avoid risks and handle crises
on the social web**
Evaluating social media activities*
Developing social media strategies
Knowing the legal framework for social media**
Setting up social media platforms**
Initiating web-based dialogues with stakeholders
Managing online communities
44
2.00 2.50 3.00 3.50 4.00
Spain Portugal Italy Slovenia Croatia Serbia
Social media skills of communication professionals in Southern Europe
Low capabilities High capabilties
www.communicationmonitor.eu / Zerfass et al. 2013 / n = 2,710 PR professionals. Q 10: How would you rate your capabilities in the following areas? Scale 1 (very low) – 5 (very high). Mean values. ** Highly significant correlations (chi-square test, p ≤ 0.01). * Significant correlations (chi-square test, p ≤ 0.05).
Delivering messages via the social web
Knowing about social media trends
Knowing how to avoid risks and handle crises
on the social web**
Evaluating social media activities*
Developing social media strategies
Knowing the legal framework for social media**
Setting up social media platforms**
Initiating web-based dialogues with stakeholders
Managing online communities

45
0
1
2
3
4
5
6
7
8
9
2.00 2.50 3.00 3.50 4.00
Poland Czech Republic Romania
Social media skills of communication professionals in Eastern Europe
Low capabilities High capabilties
www.communicationmonitor.eu / Zerfass et al. 2013 / n = 2,710 PR professionals. Q 10: How would you rate your capabilities in the following areas? Scale 1 (very low) – 5 (very high). Mean values. ** Highly significant correlations (chi-square test, p ≤ 0.01). * Significant correlations (chi-square test, p ≤ 0.05).
Delivering messages via the social web
Knowing about social media trends
Knowing how to avoid risks and handle crises
on the social web**
Evaluating social media activities*
Developing social media strategies
Knowing the legal framework for social media**
Setting up social media platforms**
Initiating web-based dialogues with stakeholders
Managing online communities

46
Professionals working in private companies and agencies report the highest level of social media skills
Joint stock companies
Private companies
Governmental organisations
Non-profit organisations
Consultancies and agencies
Overall
Knowing about social media trends**
47.7% 51.4% 46.8% 44.4% 59.9% 50.9%
Delivering messages via the social web**
45.6% 55.5% 50.2% 54.8% 61.6% 53.5%
Initiating web-based dialogues with stakeholders**
25.8% 28.3% 23.5% 28.4% 37.6% 29.2%
Setting up social media platforms*
33.0% 36.5% 33.0% 38.8% 40.7% 36.4%
Knowing the legal framework for social media
32.0% 31.3% 33.0% 25.6% 33.4% 31.5%
Managing online communities** 28.9% 34.8% 32.4% 36.4% 43.9% 35.4%
Developing social media strategies**
40.0% 44.3% 38.0% 41.0% 53.4% 44.0%
Evaluating social media activities**
38.5% 39.1% 32.6% 30.9% 48.3% 39.1%
Knowing how to avoid risks and handle crises on the social web**
36.1% 38.1% 36.4% 35.5% 45.8% 38.9%
www.communicationmonitor.eu / Zerfass et al. 2013 / n = 2,710 PR professionals. Q 10: How would you rate your capabilities in the following areas? Scale 1 (very low) – 5 (very high). Percentages: High or very high competencies reported, based on scale points 4-5. ** Highly significant correlations (chi-square test, p ≤ 0.01). * Significant correlations (chi-square test, p ≤ 0.05).
47
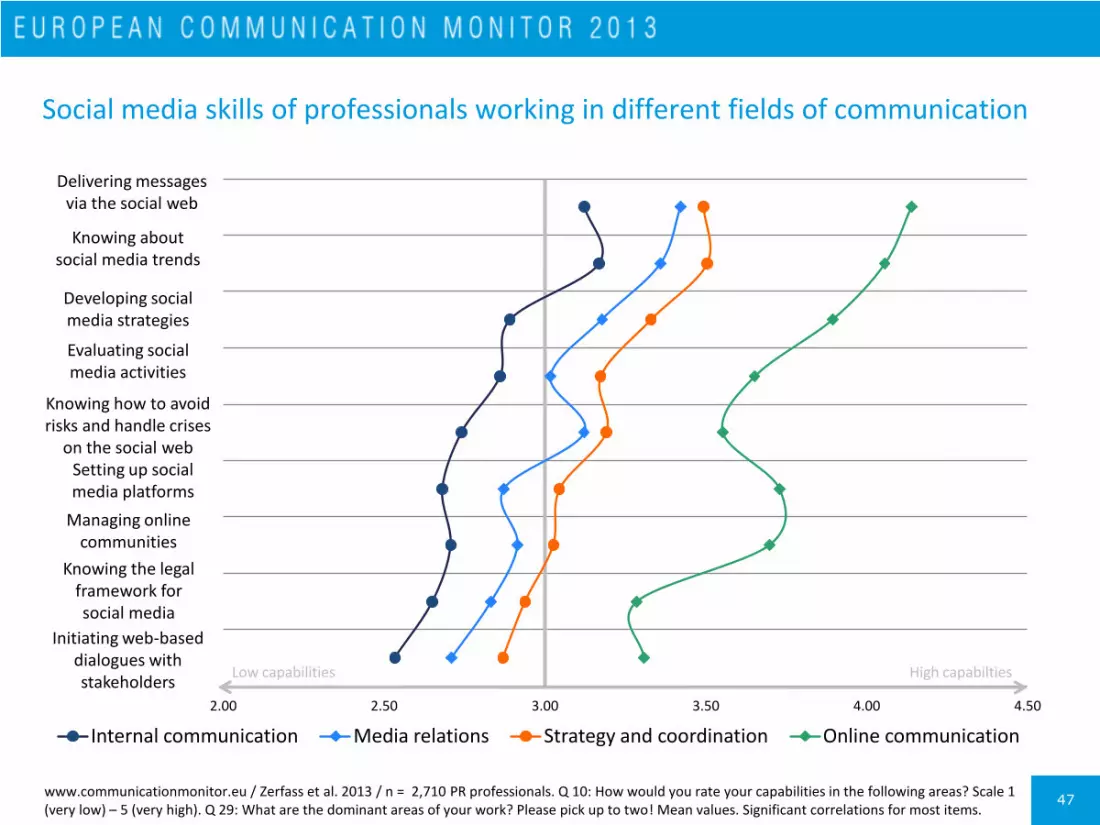
Social media skills of professionals working in different fields of communication
0
1
2
3
4
5
6
7
8
9
2.00 2.50 3.00 3.50 4.00 4.50
Internal communication Media relations Strategy and coordination Online communication
www.communicationmonitor.eu / Zerfass et al. 2013 / n = 2,710 PR professionals. Q 10: How would you rate your capabilities in the following areas? Scale 1 (very low) – 5 (very high). Q 29: What are the dominant areas of your work? Please pick up to two! Mean values. Significant correlations for most items.
Low capabilities High capabilties
Delivering messages via the social web
Knowing about social media trends
Knowing how to avoid risks and handle crises
on the social web
Evaluating social media activities
Developing social media strategies
Knowing the legal framework for social media
Setting up social media platforms
Initiating web-based dialogues with stakeholders
Managing online communities
48
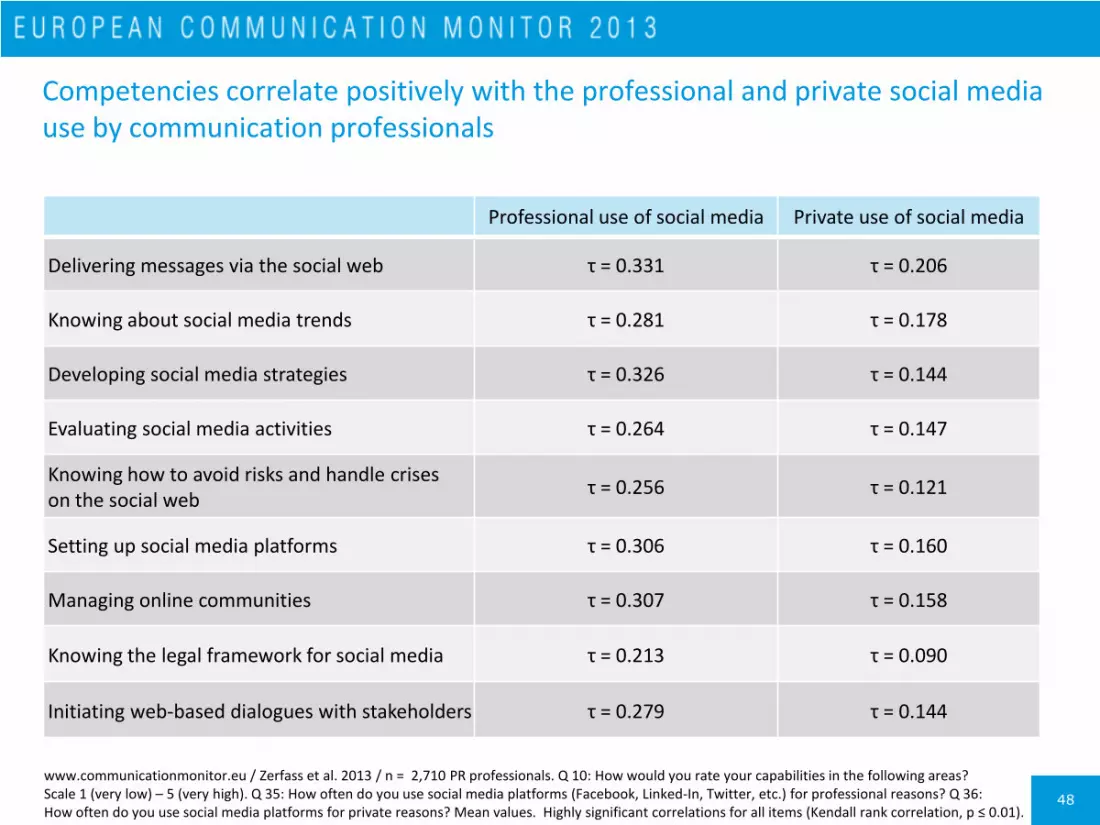
Competencies correlate positively with the professional and private social media use by communication professionals
Professional use of social media Private use of social media
Delivering messages via the social web τ = 0.331 τ = 0.206
Knowing about social media trends τ = 0.281 τ = 0.178
Developing social media strategies τ = 0.326 τ = 0.144
Evaluating social media activities τ = 0.264 τ = 0.147
Knowing how to avoid risks and handle crises on the social web
τ = 0.256 τ = 0.121
Setting up social media platforms τ = 0.306 τ = 0.160
Managing online communities τ = 0.307 τ = 0.158
Knowing the legal framework for social media τ = 0.213 τ = 0.090
Initiating web-based dialogues with stakeholders τ = 0.279 τ = 0.144
www.communicationmonitor.eu / Zerfass et al. 2013 / n = 2,710 PR professionals. Q 10: How would you rate your capabilities in the following areas? Scale 1 (very low) – 5 (very high). Q 35: How often do you use social media platforms (Facebook, Linked-In, Twitter, etc.) for professional reasons? Q 36: How often do you use social media platforms for private reasons? Mean values. Highly significant correlations for all items (Kendall rank correlation, p ≤ 0.01).

49
Professional and private use of social media by different age groups of communication professionals in Europe
www.communicationmonitor.eu / Zerfass et al. 2013 / n = 2,710 PR professionals. Q 35: How often do you use social media platforms (Facebook, Linked-In, Twitter, etc.) for professional reasons? Q 36: How often do you use social media platforms for private reasons? Significant correlations for professional use (Kendall rank correlation, p ≤ 0.05). Highly significant correlations for private use (Kendall rank correlation, p ≤ 0.01).
64.1%
85.0%
53.5%
71.3%
54.5%
61.6%
53.2%
50.2%
54.8%
42.9%
21.9%
9.6%
28.1%
18.3%
28.0%
20.7%
28.2%
23.9%
22.6%
28.6%
10.6%
3.7%
14.4%
7.6%
12.5%
13.1%
13.1%
17.3%
15.5%
14.3%
3.3%
4.0%
5.0%
4.7%
5.6%
8.6%
7.1%
14.3%
0% 100%
29 or younger
30 - 39
40 - 49
50 - 59
60 or older
Daily Several times per week Less than once or once a week Never
Professional use
Private use
Professional use
Private use
Professional use
Private use
Professional use
Private use
Professional use
Private use
Communicating strategies for different generations
51
Chapter overview
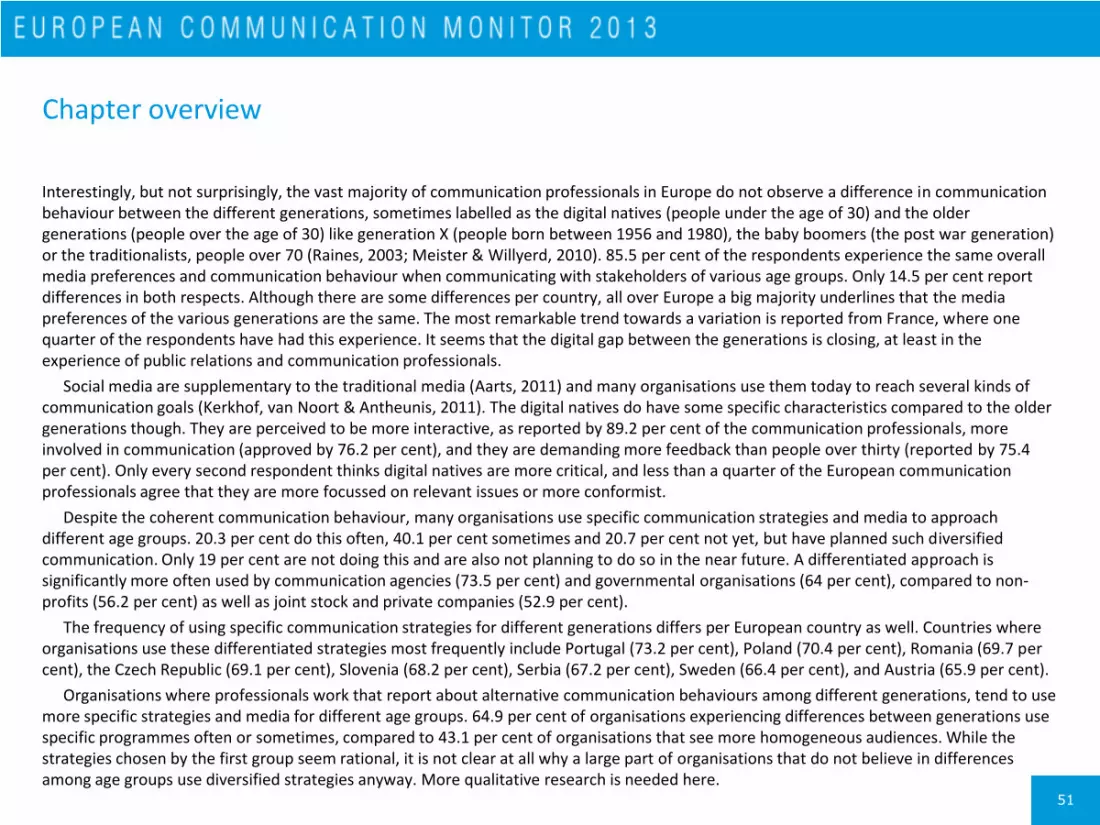
Interestingly, but not surprisingly, the vast majority of communication professionals in Europe do not observe a difference in communication behaviour between the different generations, sometimes labelled as the digital natives (people under the age of 30) and the older generations (people over the age of 30) like generation X (people born between 1956 and 1980), the baby boomers (the post war generation) or the traditionalists, people over 70 (Raines, 2003; Meister & Willyerd, 2010). 85.5 per cent of the respondents experience the same overall media preferences and communication behaviour when communicating with stakeholders of various age groups. Only 14.5 per cent report differences in both respects. Although there are some differences per country, all over Europe a big majority underlines that the media preferences of the various generations are the same. The most remarkable trend towards a variation is reported from France, where one quarter of the respondents have had this experience. It seems that the digital gap between the generations is closing, at least in the experience of public relations and communication professionals.
Social media are supplementary to the traditional media (Aarts, 2011) and many organisations use them today to reach several kinds of communication goals (Kerkhof, van Noort & Antheunis, 2011). The digital natives do have some specific characteristics compared to the older generations though. They are perceived to be more interactive, as reported by 89.2 per cent of the communication professionals, more involved in communication (approved by 76.2 per cent), and they are demanding more feedback than people over thirty (reported by 75.4 per cent). Only every second respondent thinks digital natives are more critical, and less than a quarter of the European communication professionals agree that they are more focussed on relevant issues or more conformist.
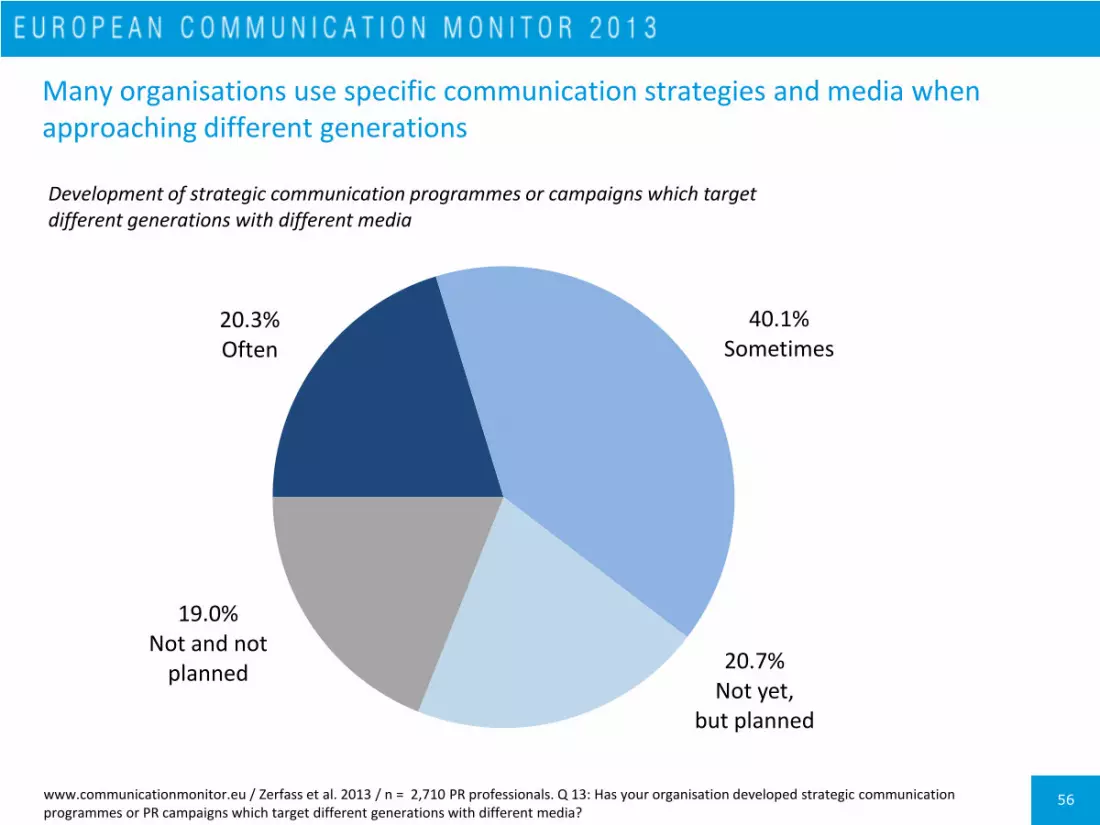
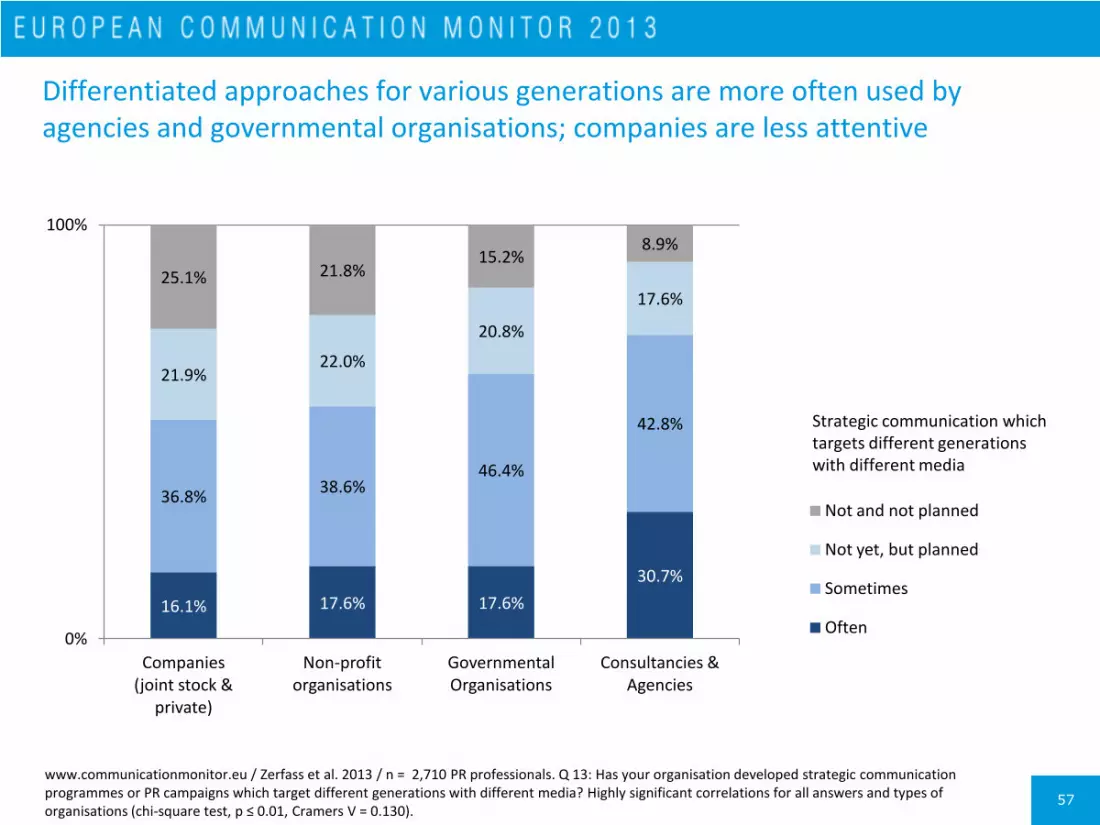
Despite the coherent communication behaviour, many organisations use specific communication strategies and media to approach different age groups. 20.3 per cent do this often, 40.1 per cent sometimes and 20.7 per cent not yet, but have planned such diversified communication. Only 19 per cent are not doing this and are also not planning to do so in the near future. A differentiated approach is significantly more often used by communication agencies (73.5 per cent) and governmental organisations (64 per cent), compared to non-profits (56.2 per cent) as well as joint stock and private companies (52.9 per cent).
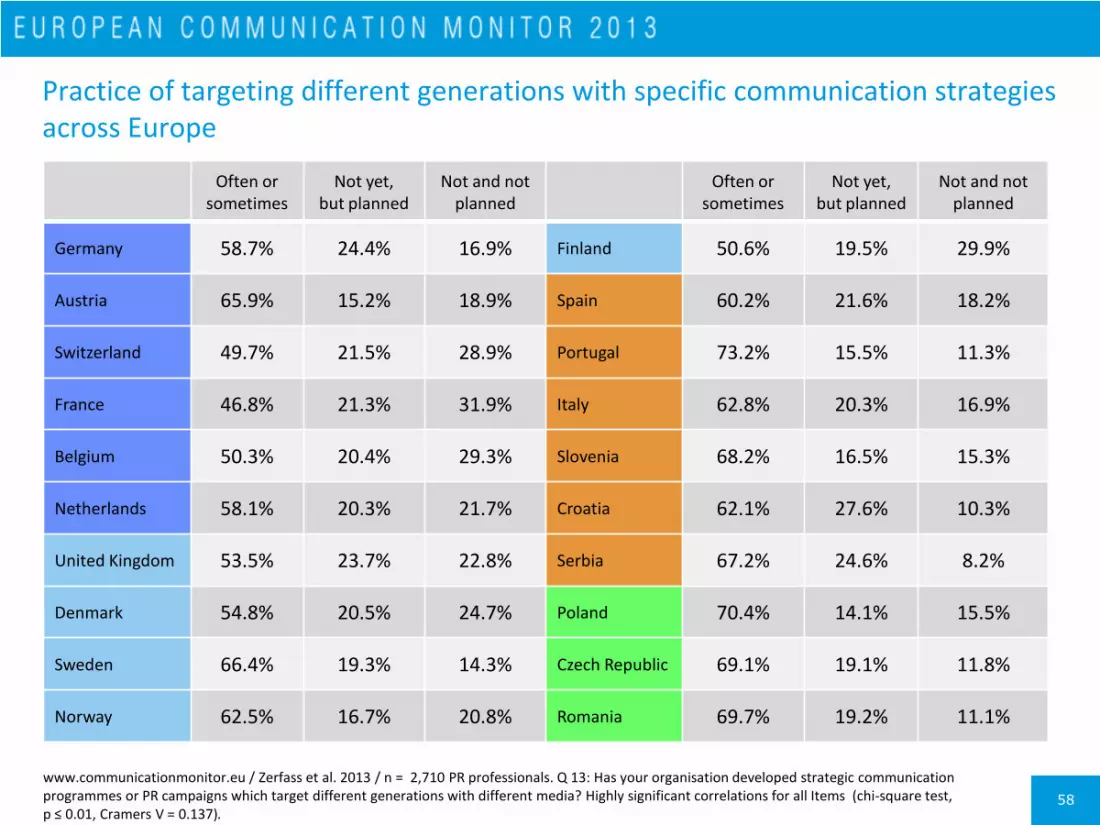
The frequency of using specific communication strategies for different generations differs per European country as well. Countries where organisations use these differentiated strategies most frequently include Portugal (73.2 per cent), Poland (70.4 per cent), Romania (69.7 per cent), the Czech Republic (69.1 per cent), Slovenia (68.2 per cent), Serbia (67.2 per cent), Sweden (66.4 per cent), and Austria (65.9 per cent).
Organisations where professionals work that report about alternative communication behaviours among different generations, tend to use more specific strategies and media for different age groups. 64.9 per cent of organisations experiencing differences between generations use specific programmes often or sometimes, compared to 43.1 per cent of organisations that see more homogeneous audiences. While the strategies chosen by the first group seem rational, it is not clear at all why a large part of organisations that do not believe in differences among age groups use diversified strategies anyway. More qualitative research is needed here.

52
Communicating behaviour of different generations: Most professionals experience the same media preferences
14.5% experience different media preferences
and communication behaviour
85.5% experience the same media preferences
and communication behaviour
When practitioners communicate with stakeholders of various age groups
www.communicationmonitor.eu / Zerfass et al. 2013 / n = 2,486 PR professionals. Q 11: Audience research suggests that people have different media preferences and communication behaviours depending on their age group (Digital natives, Generation X, Baby boomers, Traditionalists, etc.). Do you experience such differences among the stakeholders of your organisation or clients? Percentages: Agreement to “yes” (Different) or “no” (Same).
53
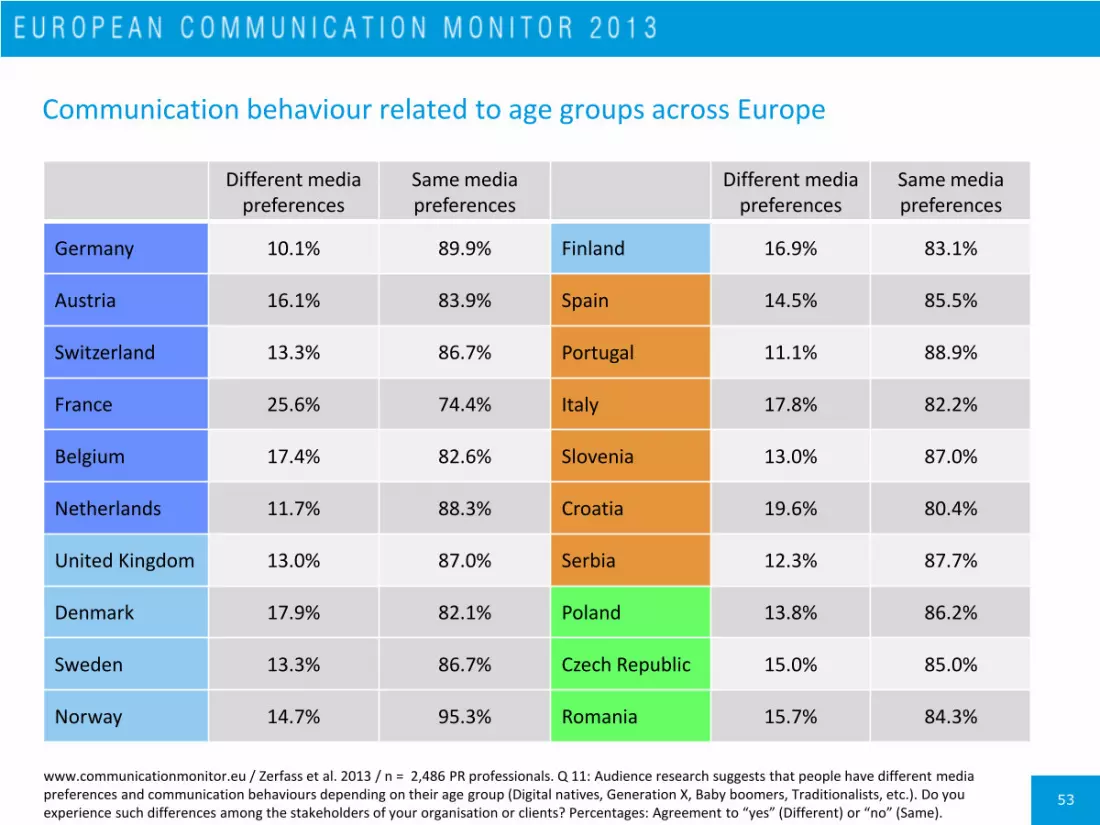
Communication behaviour related to age groups across Europe
Different media
preferences Same media preferences
Different media
preferences Same media preferences
Germany 10.1% 89.9% Finland 16.9% 83.1%
Austria 16.1% 83.9% Spain 14.5% 85.5%
Switzerland 13.3% 86.7% Portugal 11.1% 88.9%
France 25.6% 74.4% Italy 17.8% 82.2%
Belgium 17.4% 82.6% Slovenia 13.0% 87.0%
Netherlands 11.7% 88.3% Croatia 19.6% 80.4%
United Kingdom 13.0% 87.0% Serbia 12.3% 87.7%
Denmark 17.9% 82.1% Poland 13.8% 86.2%
Sweden 13.3% 86.7% Czech Republic 15.0% 85.0%
Norway 14.7% 95.3% Romania 15.7% 84.3%
www.communicationmonitor.eu / Zerfass et al. 2013 / n = 2,486 PR professionals. Q 11: Audience research suggests that people have different media preferences and communication behaviours depending on their age group (Digital natives, Generation X, Baby boomers, Traditionalists, etc.). Do you experience such differences among the stakeholders of your organisation or clients? Percentages: Agreement to “yes” (Different) or “no” (Same).

54
Communication behaviour of digital natives the generation under 30 years: more interactive, more involved in communication, demanding more feedback
89.2%
76.2%
75.4%
55.8%
24.8%
24.2%
10.8%
They are more interactive
They are more involved in communication
They demand more feedback
They are more critical
They are more focussed on relevant issues
They are more conformist
They have more fear of authority
Characterisation of digital natives, compared to previous generations
www.communicationmonitor.eu / Zerfass et al. 2013 / n = 2,710 PR professionals. Q 12: Do you believe that the younger generation (so-called digital natives, aged under 30 years) are communicating differently from previous generations? Please state whether you agree with those statements. Scale 1 (I don’t agree at all) – 5 (I fully agree). Percentages: Agreement based on scale points 4-5.
55
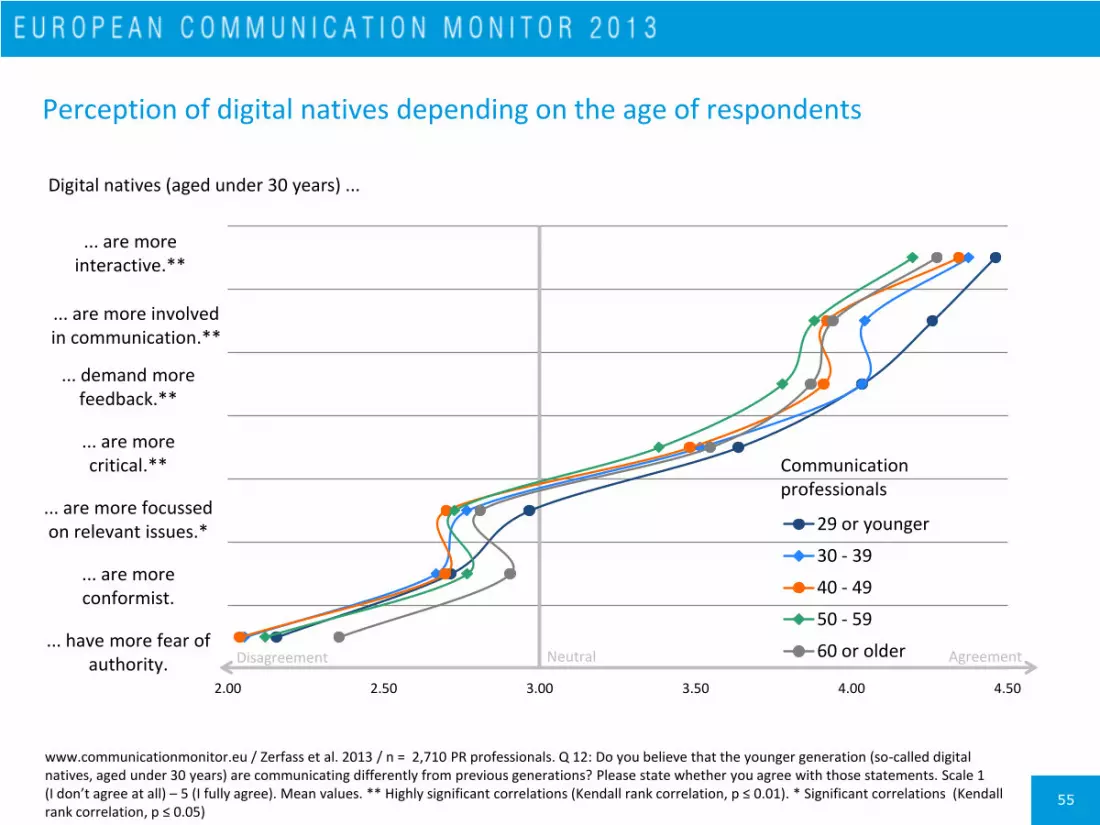
Perception of digital natives depending on the age of respondents
0
1
2
3
4
5
6
7
2.00 2.50 3.00 3.50 4.00 4.50
Digital natives (aged under 30 years) ...
29 or younger
30 - 39
40 - 49
50 - 59
60 or older
... are more interactive.**
... are more involved in communication.**
... are more focussed on relevant issues.*
... are more critical.**
... demand more feedback.**
... have more fear of authority.
... are more conformist.
Communication professionals
www.communicationmonitor.eu / Zerfass et al. 2013 / n = 2,710 PR professionals. Q 12: Do you believe that the younger generation (so-called digital natives, aged under 30 years) are communicating differently from previous generations? Please state whether you agree with those statements. Scale 1 (I don’t agree at all) – 5 (I fully agree). Mean values. ** Highly significant correlations (Kendall rank correlation, p ≤ 0.01). * Significant correlations (Kendall rank correlation, p ≤ 0.05)
Disagreement Neutral Agreement
56
Many organisations use specific communication strategies and media when approaching different generations
www.communicationmonitor.eu / Zerfass et al. 2013 / n = 2,710 PR professionals. Q 13: Has your organisation developed strategic communication programmes or PR campaigns which target different generations with different media?
20.3% Often
40.1% Sometimes
20.7% Not yet,
but planned
19.0% Not and not
planned
Development of strategic communication programmes or campaigns which target different generations with different media
57
Differentiated approaches for various generations are more often used by agencies and governmental organisations; companies are less attentive
16.1% 17.6% 17.6%
30.7%
36.8% 38.6%
46.4%
42.8%
21.9% 22.0%
20.8%
17.6% 25.1% 21.8%
15.2% 8.9%
0%
100%
Companies (joint stock &
private)
Non-profit organisations
Governmental Organisations
Consultancies & Agencies
Not and not planned
Not yet, but planned
Sometimes
Often
Strategic communication which targets different generations with different media
www.communicationmonitor.eu / Zerfass et al. 2013 / n = 2,710 PR professionals. Q 13: Has your organisation developed strategic communication programmes or PR campaigns which target different generations with different media? Highly significant correlations for all answers and types of organisations (chi-square test, p ≤ 0.01, Cramers V = 0.130).
58
Practice of targeting different generations with specific communication strategies across Europe
Often or sometimes
Not yet, but planned
Not and not planned
Often or
sometimes Not yet,
but planned Not and not
planned
Germany 58.7% 24.4% 16.9% Finland 50.6% 19.5% 29.9%
Austria 65.9% 15.2% 18.9% Spain 60.2% 21.6% 18.2%
Switzerland 49.7% 21.5% 28.9% Portugal 73.2% 15.5% 11.3%
France 46.8% 21.3% 31.9% Italy 62.8% 20.3% 16.9%
Belgium 50.3% 20.4% 29.3% Slovenia 68.2% 16.5% 15.3%
Netherlands 58.1% 20.3% 21.7% Croatia 62.1% 27.6% 10.3%
United Kingdom 53.5% 23.7% 22.8% Serbia 67.2% 24.6% 8.2%
Denmark 54.8% 20.5% 24.7% Poland 70.4% 14.1% 15.5%
Sweden 66.4% 19.3% 14.3% Czech Republic 69.1% 19.1% 11.8%
Norway 62.5% 16.7% 20.8% Romania 69.7% 19.2% 11.1%
www.communicationmonitor.eu / Zerfass et al. 2013 / n = 2,710 PR professionals. Q 13: Has your organisation developed strategic communication programmes or PR campaigns which target different generations with different media? Highly significant correlations for all Items (chi-square test, p ≤ 0.01, Cramers V = 0.137).

59
Organisations reporting about alternative communication behaviours among different age groups tend to use specific strategies and media
22.7%
10.0%
42.2%
33.1%
20.7%
17.2%
14.3%
39.7%
0%
10%
20%
30%
40%
50%
60%
70%
80%
90%
100%
Organisations experiencing different communication behaviour of various
age groups
Organisations experiencing the same communication behaviour of various
age groups
Not and not planned
Not yet, but planned
Sometimes
Often
www.communicationmonitor.eu / Zerfass et al. 2013 / n = 2,486 PR professionals. Q 11: Audience research suggests that people have different media preferences and communication behaviours depending on their age group. Do you experience such differences among the stakeholders of your organisation or clients? Q 13: Has your organisation developed strategic communication programmes or PR campaigns which target different generations with different media? Highly significant correlations for all items (chi-square test, p ≤ 0.01, Cramers V = 0.239).
Strategic communication which targets different generations with different media
International communication

61
Chapter overview
Crossing borders both privately and professionally is something that is familiar to most practitioners working in a European context. We clearly live in a multicultural world and communication managers are in the business of intercultural mediation. Wherever we live, we are exposed to other cultures. As a consequence academics argue intercultural competency is a necessary requirement for all workers and is not limited to those who work in different countries (Davies et al., 2011). The management of communication and relationships is directly concerned with the management of cultural differences (Tench & Yeomans, 2013).
The ECM 2013 data shows that international communication is considered a part of daily business for eight out of ten professionals surveyed. Furthermore, when asked about the importance of international communication a majority responded that it was important for their organisations (68.3 per cent). This re-affirms Bücker and Poutsma’s (2010) claim that managers who demonstrate intercultural competence are more likely to be able as well as to attract and work with relevant stakeholders such as partners and clients. In addition, 72.5 per cent of the ECM respondents acknowledge that communicating internationally will become more important in the next three years. In sharp contrast to this, only a minority of organisations (47.3 per cent) has already developed solid structures and strategies for international communication. This seems to be a major field of development within the practice in the near future.
Context matters though for international interaction and those practitioners working in non-profit and governmental organisations are less likely to practice internationally. From the respondents who do have an international outreach with their work, the majority are doing so with more than five countries and nearly a quarter with over 20 countries. This reflects the complex, multinational world communication practitioners are working in and the subsequent demand this places on their cross and intercultural skills and awareness. It is in this way that Verčič (2013) argues for the potential for public relations practitioners to act and perform like ‘intercultural interpreters’.
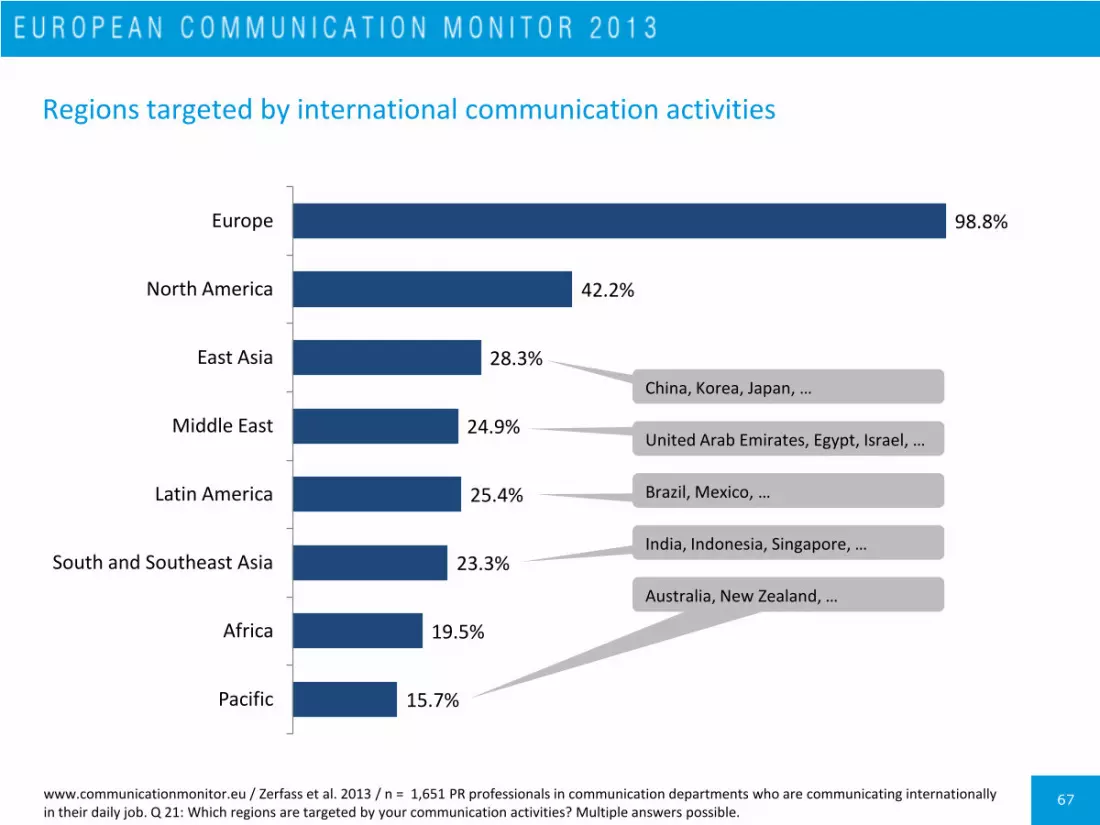
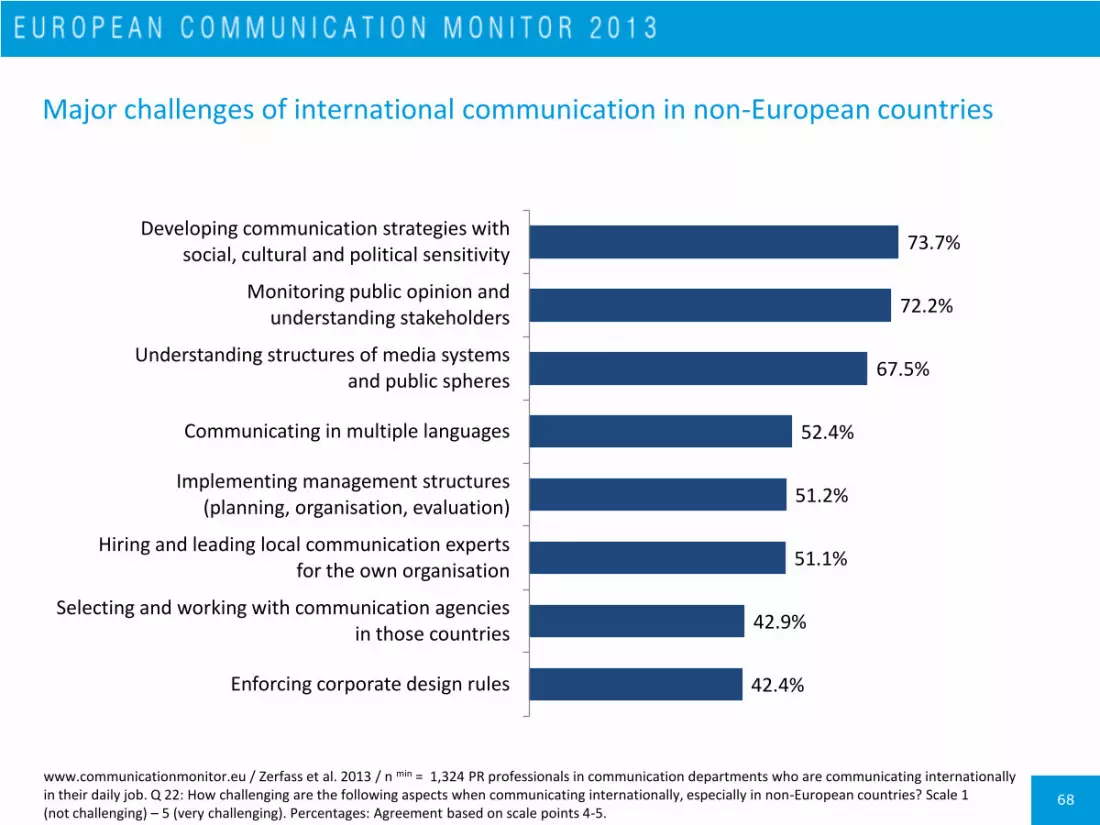
Perhaps inevitably given the ECM sample, the majority of targeted international communication activity is within Europe (98.8 per cent), with North America the next highest response (42.2 per cent), followed in third place by East Asia (28.3 per cent) which takes in China, Korea, Japan as major countries. Focusing on strategic communication internationally and outside Europe respondents were asked to name the most challenging issues at hand. The leading three were: Developing communication strategies with social, cultural and political sensitivity (73.7 per cent), monitoring public opinion and understanding stakeholders (72.2 per cent), and understanding structures of media systems and public spheres (67.5 per cent). These are pragmatic and analytical topics, underlining the early status of institutionalisation in this field. Management-oriented challenges like implementing management structures for international communication (which were reported as missing by a majority), hiring and leading professionals or working with agencies in foreign countries are mentioned by a lower, but still relevant, number of respondents (between 42.9 and 51.2 per cent).
62
International communication is important and will grow in the future, but organisational structures and strategies are often missing
68.3%
72.5%
47.3%
Communicating internationally is important for my organisation
Communicating internationally will become more important within the next three years
My organisation has solid structures and strategies for international communication
www.communicationmonitor.eu / Zerfass et al. 2013 / n = 2,710 PR professionals. Q 18: Please rate the following statements from the point of view of your organisation. Scale 1 (strongly disagree) – 5 (totally agree). Percentages: Agreement based on scale points 4-5.
63
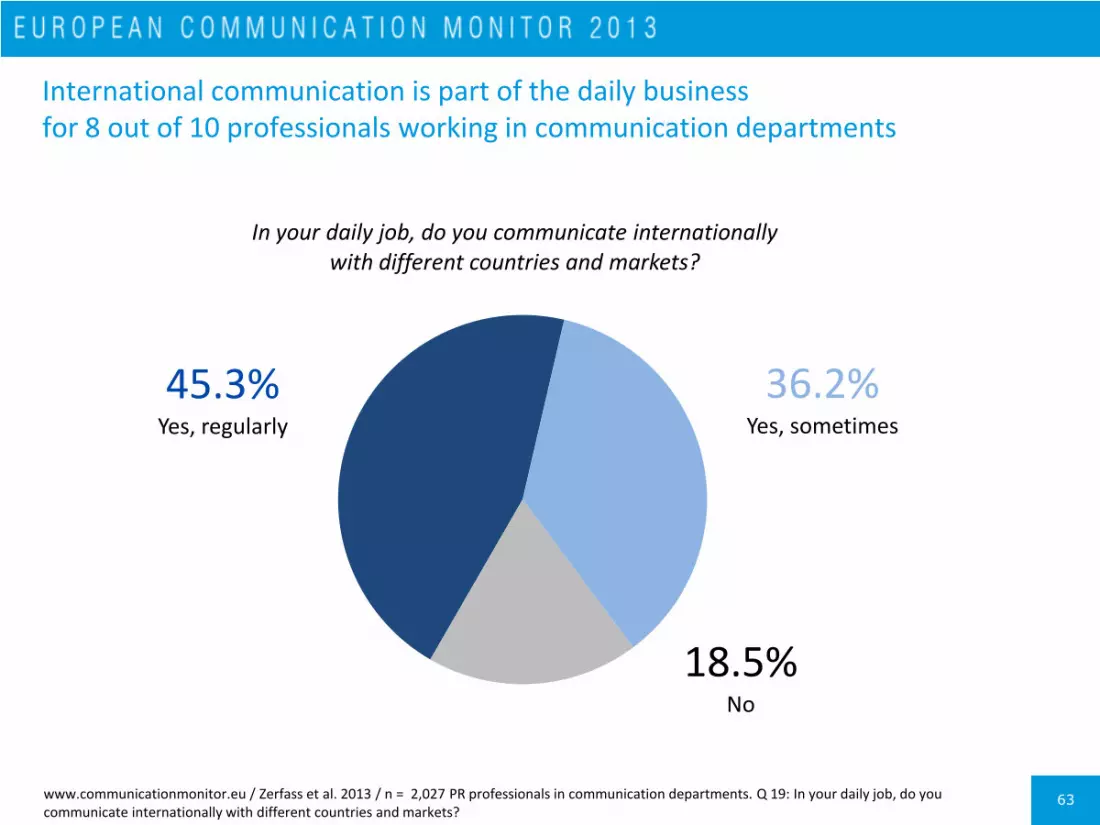
International communication is part of the daily business for 8 out of 10 professionals working in communication departments
45.3% Yes, regularly
36.2% Yes, sometimes
18.5% No
In your daily job, do you communicate internationally with different countries and markets?
www.communicationmonitor.eu / Zerfass et al. 2013 / n = 2,027 PR professionals in communication departments. Q 19: In your daily job, do you communicate internationally with different countries and markets?
64
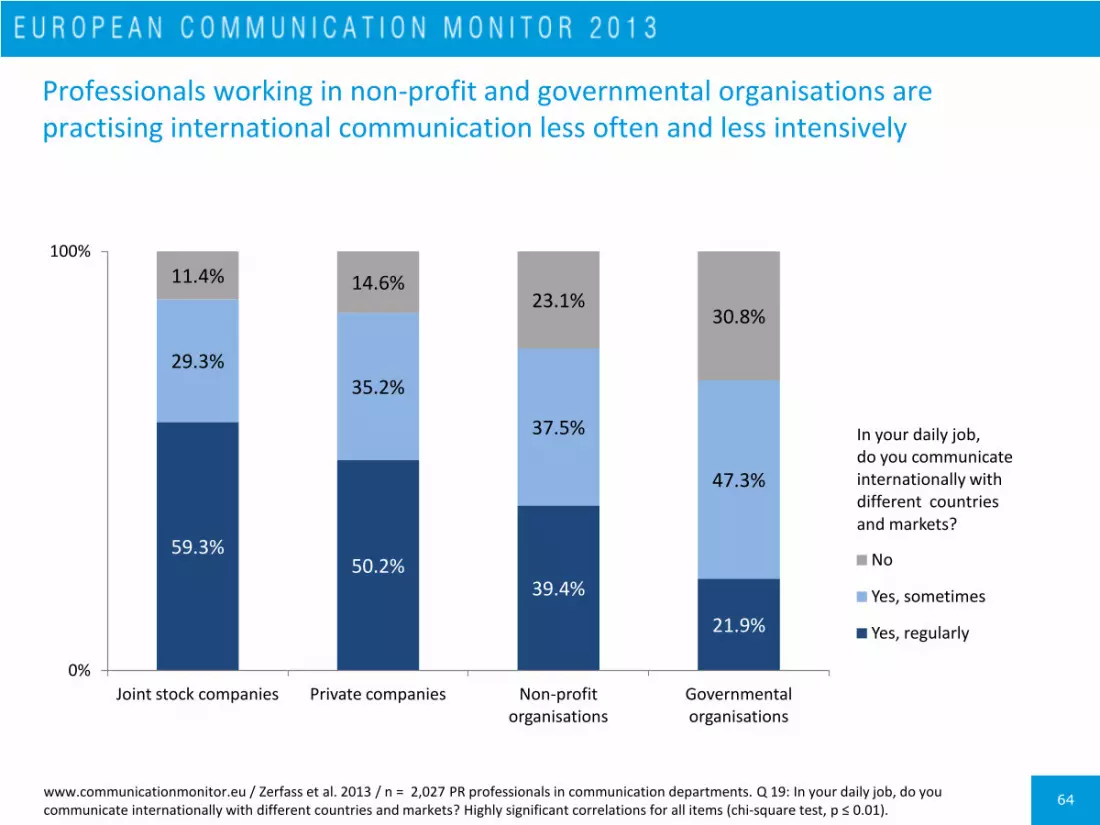
Professionals working in non-profit and governmental organisations are practising international communication less often and less intensively
59.3% 50.2%
39.4%
21.9%
29.3% 35.2%
37.5%
47.3%
11.4% 14.6% 23.1%
30.8%
0%
100%
Joint stock companies Private companies Non-profit organisations
Governmental organisations
In your daily job, do you communicate internationally with different countries and markets?
No
Yes, sometimes
Yes, regularly
www.communicationmonitor.eu / Zerfass et al. 2013 / n = 2,027 PR professionals in communication departments. Q 19: In your daily job, do you communicate internationally with different countries and markets? Highly significant correlations for all items (chi-square test, p ≤ 0.01).

65
A majority of communication professionals with international outreach deals with more than five countries
23.3%
13.2%
20.8%
42.8%
Number of relevant countries
More than 20 11 - 20 6 - 10 Up to 5
www.communicationmonitor.eu / Zerfass et al. 2013 / n = 1,651 PR professionals in communication departments who are communicating internationally in their daily job . Q 20: How many countries do you deal with in your communication role?

66
Number of relevant countries for international communication across Europe
More
than 20 11 - 20 6 - 10 Up to 5
More than 20
11 - 20 6 - 10 Up to 5
Germany 30.0% 17.3% 25.5% 27.3% Finland 25.4% 13.6% 28.8% 32.2%
Austria 23.2% 15.9% 21.7% 39.1% Spain 8.0% 17.0% 10.2% 64.8%
Switzerland 44.6% 13.9% 20.8% 20.8% Portugal 22.5% 15.0% 17.5% 45.0%
France 42.9% 17.5% 23.8% 15.9% Italy 22.2% 8.9% 17.8% 51.1%
Belgium 47.5% 20.8% 12.9% 18.8% Slovenia 14.5% 9.1% 20.0% 56.4%
Netherlands 25.0% 11.3% 22.6% 41.1% Croatia 6.7% 10.0% 23.3% 60.0%
United Kingdom 28.6% 14.3% 22.2% 34.9% Serbia 0.0% 2.6% 26.3% 71.1%
Denmark 27.1% 10.4% 20.8% 41.7% Poland 9.4% 12.5% 18.8% 59.4%
Sweden 25.6% 24.4% 19.5% 30.5% Czech Republic 16.0% 4.0% 16.0% 64.0%
Norway 13.9% 11.1% 18.1% 56.9% Romania 7.6% 12.1% 13.6% 66.7%
www.communicationmonitor.eu / Zerfass et al. 2013 / n = 1,651 PR professionals in communication departments who are communicating internationally in their daily job. Q 20: How many countries do you deal with in your communication role?
67
Regions targeted by international communication activities
98.8%
42.2%
28.3%
24.9%
25.4%
23.3%
19.5%
15.7%
Europe
North America
East Asia
Middle East
Latin America
South and Southeast Asia
Africa
Pacific
China, Korea, Japan, …
India, Indonesia, Singapore, …
United Arab Emirates, Egypt, Israel, …
Australia, New Zealand, …
Brazil, Mexico, …
www.communicationmonitor.eu / Zerfass et al. 2013 / n = 1,651 PR professionals in communication departments who are communicating internationally in their daily job. Q 21: Which regions are targeted by your communication activities? Multiple answers possible.
68
Major challenges of international communication in non-European countries
73.7%
72.2%
67.5%
52.4%
51.2%
51.1%
42.9%
42.4%
Developing communication strategies with social, cultural and political sensitivity
Monitoring public opinion and understanding stakeholders
Understanding structures of media systems and public spheres
Communicating in multiple languages
Implementing management structures (planning, organisation, evaluation)
Hiring and leading local communication experts for the own organisation
Selecting and working with communication agencies in those countries
Enforcing corporate design rules
www.communicationmonitor.eu / Zerfass et al. 2013 / n min = 1,324 PR professionals in communication departments who are communicating internationally in their daily job. Q 22: How challenging are the following aspects when communicating internationally, especially in non-European countries? Scale 1 (not challenging) – 5 (very challenging). Percentages: Agreement based on scale points 4-5.

69
Challenges of international communication in different types of organisations
Joint stock companies
Private companies
Governmental organisations
Non-profit organisations
Overall
Developing communication strategies with social, cultural and political sensitivity
73.4% 73.6% 74.9% 73.3% 73.7%
Monitoring public opinion and understanding stakeholders
71.1% 73.9% 72.4% 71.9% 72.2%
Understanding structures of media systems and public spheres*
65.1% 73.1% 66.8% 64.5% 67.5%
Implementing management structures (planning, organisation, evaluation)
49.5% 52.3% 53.6% 51.1% 51.2%
Communicating in multiple languages 50.3% 49.5% 61.3% 52.3% 52.4%
Hiring and leading local communication experts for the own organisation
51.2% 51.0% 51.9% 50.0% 51.1%
Selecting and working with communication agencies in those countries**
38.4% 45.8% 44.8% 47.1% 42.9%
Enforcing corporate design rules 43.4% 43.2% 40.5% 40.6% 42.4%
www.communicationmonitor.eu / Zerfass et al. 2013 / n = 1,324 PR professionals in communication departments who are communicating internationally in their daily job. Q 22: How challenging are the following aspects when communicating internationally, especially in non-European countries? Scale 1 (not challenging) – 5 (very challenging). Percentages: Agreement based on scale points 4-5. ** Highly significant correlations (chi-square test, p ≤ 0.01). * Significant correlations (chi-square test, p ≤ 0.05).
Crisis communication
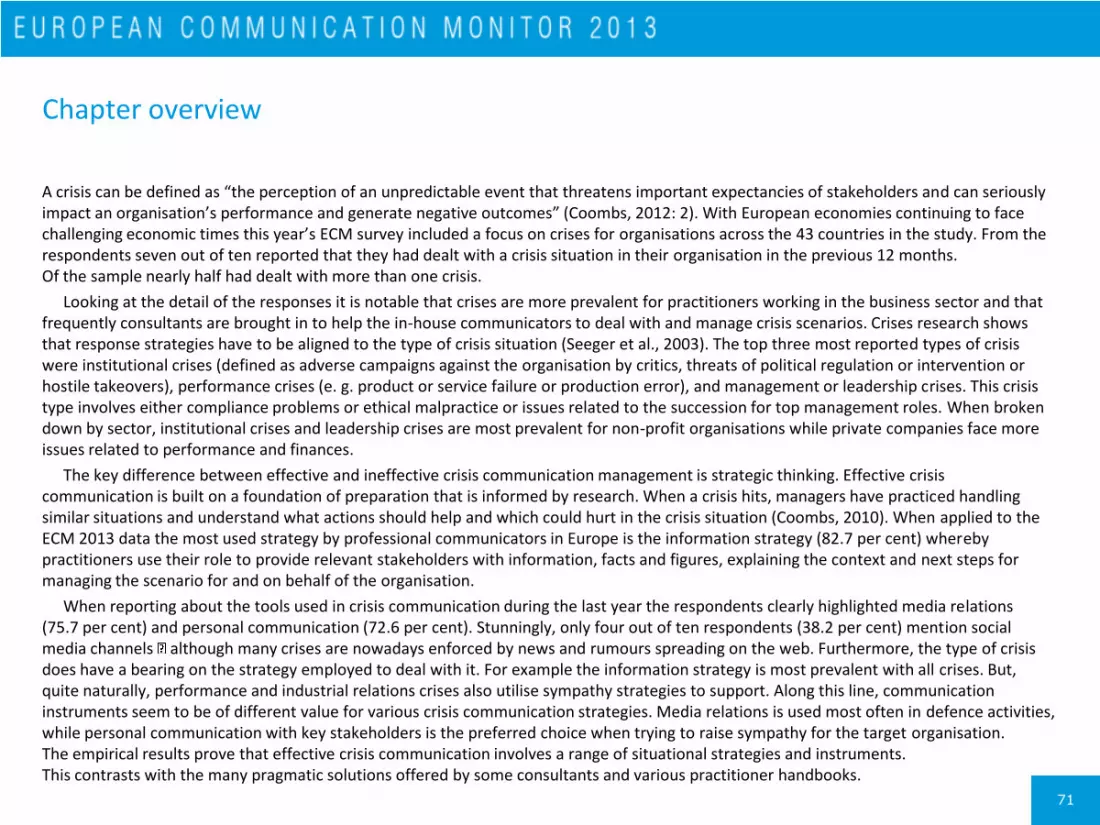
71
Chapter overview
A crisis can be defined as “the perception of an unpredictable event that threatens important expectancies of stakeholders and can seriously impact an organisation’s performance and generate negative outcomes” (Coombs, 2012: 2). With European economies continuing to face challenging economic times this year’s ECM survey included a focus on crises for organisations across the 43 countries in the study. From the respondents seven out of ten reported that they had dealt with a crisis situation in their organisation in the previous 12 months. Of the sample nearly half had dealt with more than one crisis.
Looking at the detail of the responses it is notable that crises are more prevalent for practitioners working in the business sector and that frequently consultants are brought in to help the in-house communicators to deal with and manage crisis scenarios. Crises research shows that response strategies have to be aligned to the type of crisis situation (Seeger et al., 2003). The top three most reported types of crisis were institutional crises (defined as adverse campaigns against the organisation by critics, threats of political regulation or intervention or hostile takeovers), performance crises (e. g. product or service failure or production error), and management or leadership crises. This crisis type involves either compliance problems or ethical malpractice or issues related to the succession for top management roles. When broken down by sector, institutional crises and leadership crises are most prevalent for non-profit organisations while private companies face more issues related to performance and finances.
The key difference between effective and ineffective crisis communication management is strategic thinking. Effective crisis communication is built on a foundation of preparation that is informed by research. When a crisis hits, managers have practiced handling similar situations and understand what actions should help and which could hurt in the crisis situation (Coombs, 2010). When applied to the ECM 2013 data the most used strategy by professional communicators in Europe is the information strategy (82.7 per cent) whereby practitioners use their role to provide relevant stakeholders with information, facts and figures, explaining the context and next steps for managing the scenario for and on behalf of the organisation.
When reporting about the tools used in crisis communication during the last year the respondents clearly highlighted media relations (75.7 per cent) and personal communication (72.6 per cent). Stunningly, only four out of ten respondents (38.2 per cent) mention social media channels although many crises are nowadays enforced by news and rumours spreading on the web. Furthermore, the type of crisis does have a bearing on the strategy employed to deal with it. For example the information strategy is most prevalent with all crises. But, quite naturally, performance and industrial relations crises also utilise sympathy strategies to support. Along this line, communication instruments seem to be of different value for various crisis communication strategies. Media relations is used most often in defence activities, while personal communication with key stakeholders is the preferred choice when trying to raise sympathy for the target organisation. The empirical results prove that effective crisis communication involves a range of situational strategies and instruments. This contrasts with the many pragmatic solutions offered by some consultants and various practitioner handbooks.
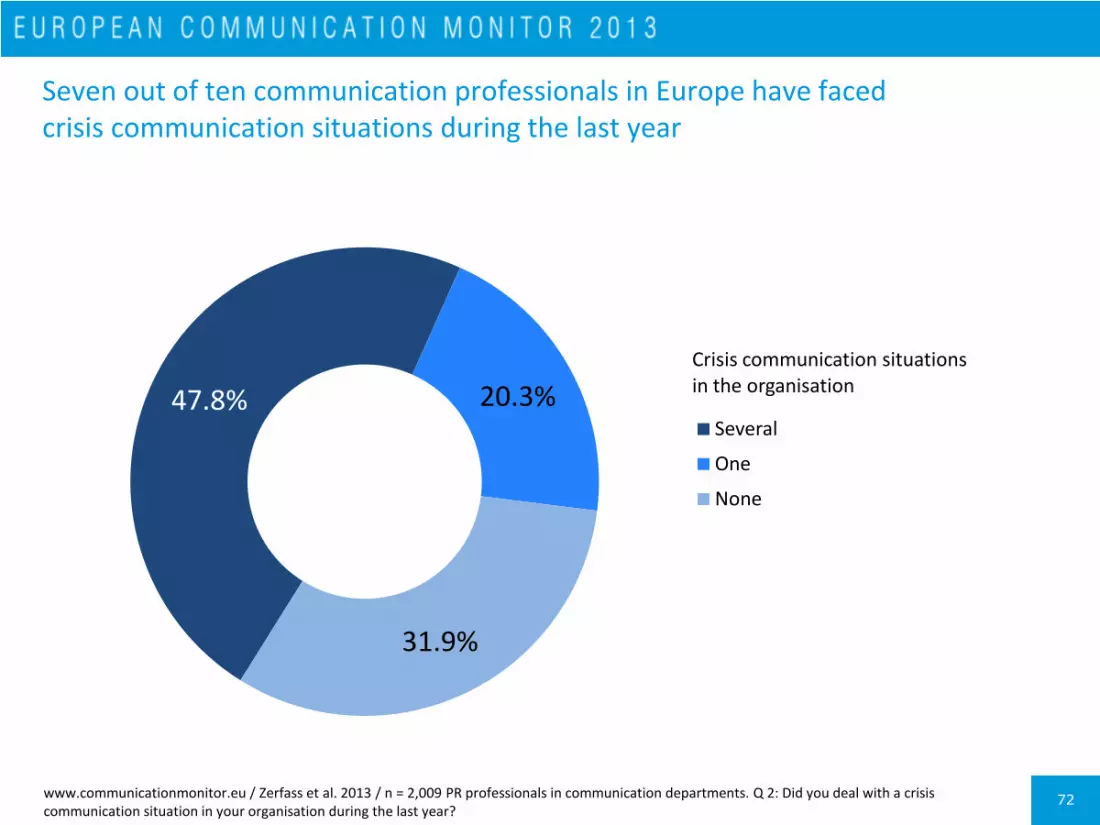
72
Seven out of ten communication professionals in Europe have faced crisis communication situations during the last year
www.communicationmonitor.eu / Zerfass et al. 2013 / n = 2,009 PR professionals in communication departments. Q 2: Did you deal with a crisis communication situation in your organisation during the last year?
47.8% 20.3%
31.9%
Crisis communication situations in the organisation
Several
One
None
73
Crisis communication is more prevalent in the business sector – professionals working in consultancies are often asked to help
www.communicationmonitor.eu / Zerfass et al. 2013 / n = 2,687 PR professionals. Q 2: Did you deal with a crisis communication situation in your organisation or for your clients during the last year?
55.4% 48.1% 45.5%
35.6%
55.6%
19.0% 21.4%
20.0%
22.1%
21.5%
25.6% 30.5% 34.6% 42.3%
22.9%
0%
100%
Joint stock companies Private companies Governmental organisations
Non-profit organisations Consultancies & Agencies
Several One No crisis communication situation dealt with in 2012/13

74
Instances of crisis communication situations in organisations across Europe
www.communicationmonitor.eu / Zerfass et al. 2013 / n = 1,742 PR professionals in in communication departments. Q 2: Did you deal with a crisis communication situation in your organisation or for your clients during the last year?
Several One None Several One None
Germany 52.9% 21.5% 25.6% Finland 33.3% 33.3% 33.3%
Austria 46.5% 16.3% 37.2% Spain 49.1% 22.2% 28.7%
Switzerland 42.6% 18.0% 39.3% Portugal 43.1% 23.5% 33.3%
France 46.6% 20.5% 32.9% Italy 39.0% 31.4% 29.5%
Belgium 28.9% 23.7% 47.4% Slovenia 62.7% 20.9% 16.4%
Netherlands 45.0% 17.2% 37.9% Croatia 60.5% 18.4% 21.1%
United Kingdom 51.6% 20.8% 27.7% Serbia 56.0% 22.0% 22.0%
Denmark 54.0% 19.0% 27.0% Poland 44.4% 28.9% 26.7%
Sweden 46.7% 21.0% 32.4% Czech Republic 51.9% 17.7% 30.4%
Norway 39.8% 16.3% 43.9% Romania 51.7% 6.9% 41.4%

75
Types of crises challenging communication managers in Europe
21.1%
18.7%
17.5%
13.6%
8.6%
6.9%
6.2%
7.5%
Institutional crisis (Adverse campaign by critics, threat of political regulation, hostile takeover attempt, ...)
Performance crisis (Product or service failure, breakdown of production lines, ...)
Management or leadership crisis (Top management succession, compliance problem, ethical misbehaviour, ...)
Financial or economic crisis (Declining revenue and profit, loss of market share, ...)
Crisis solely based on rumours or communication failure (no real problems)
Industrial relations crisis (Conflict with workers or unions, strikes, ...)
Natural crisis (Disaster, accident, ...)
None of the above
Most important crisis situation
www.communicationmonitor.eu / Zerfass et al. 2013 / n = 1,367 PR professionals in communication departments reporting a crisis situation during the last year. Q 3: Please think of the most important crisis situation for your organisation during the last year. How would you categorise this type of crisis?

76
Institutional crises and leadership crises are most important for non-profits; crises in private companies are often related to issues of performance and finances
www.communicationmonitor.eu / Zerfass et al. 2013 / n = 1,367 PR professionals in communication departments reporting a crisis situation during the last year. Q 3: Please think of the most important crisis situation for your organisation during the last year. How would you categorise this type of crisis? Highly significant correlations for all items (chi-square test, p ≤ 0.01).
Joint stock companies
Private companies
Governmental organisations
Non-profit organisations
Institutional crisis (Adverse campaign by critics, threat of political regulation, hostile takeover attempt, ...)
20.3% 16.0% 23.6% 27.8%
Performance crisis (Product or service failure, breakdown of production lines, ...)
20.7% 23.3% 17.0% 8.3%
Management or leadership crisis (Top management succession, compliance problem, ethical misbehaviour, ...)
15.2% 16.9% 19.3% 21.5%
Financial or economic crisis (Declining revenue and profit, loss of market share, ...)
14.6% 17.2% 8.5% 12.7%
Crisis solely based on rumours or communication failure (No real problems)
6.7% 9.4% 8.9% 11.7%
Natural crisis (Disaster, accident, ...)
7.0% 3.6% 10.8% 5.9%
Industrial relations crisis (Conflict with workers or unions, strikes, ...)
8.7% 6.6% 3.0% 3.9%
None of the above 6.7% 6.9% 8.9% 8.3%
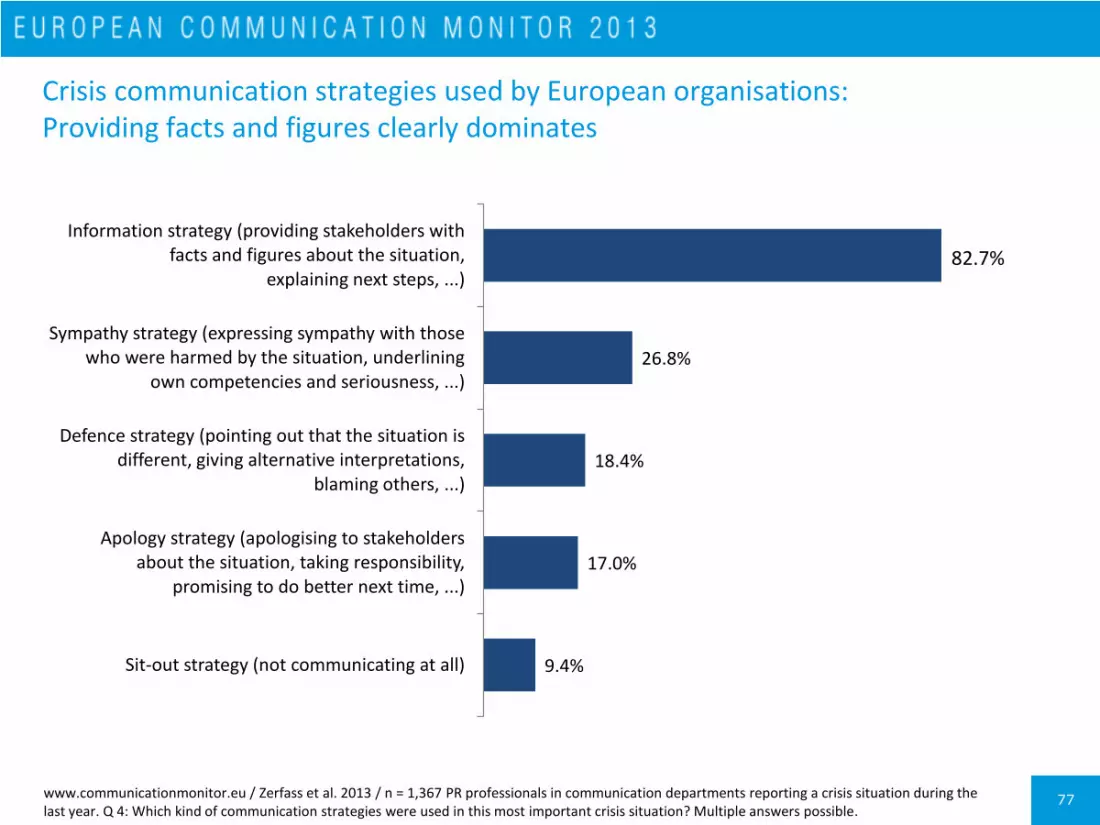
77
Crisis communication strategies used by European organisations: Providing facts and figures clearly dominates
www.communicationmonitor.eu / Zerfass et al. 2013 / n = 1,367 PR professionals in communication departments reporting a crisis situation during the last year. Q 4: Which kind of communication strategies were used in this most important crisis situation? Multiple answers possible.
26.8%
18.4%
17.0%
9.4%
Information strategy (providing stakeholders with facts and figures about the situation,
explaining next steps, ...)
Sympathy strategy (expressing sympathy with those who were harmed by the situation, underlining
own competencies and seriousness, ...)
Defence strategy (pointing out that the situation is different, giving alternative interpretations,
blaming others, ...)
Apology strategy (apologising to stakeholders about the situation, taking responsibility,
promising to do better next time, ...)
Sit-out strategy (not communicating at all)
82.7%
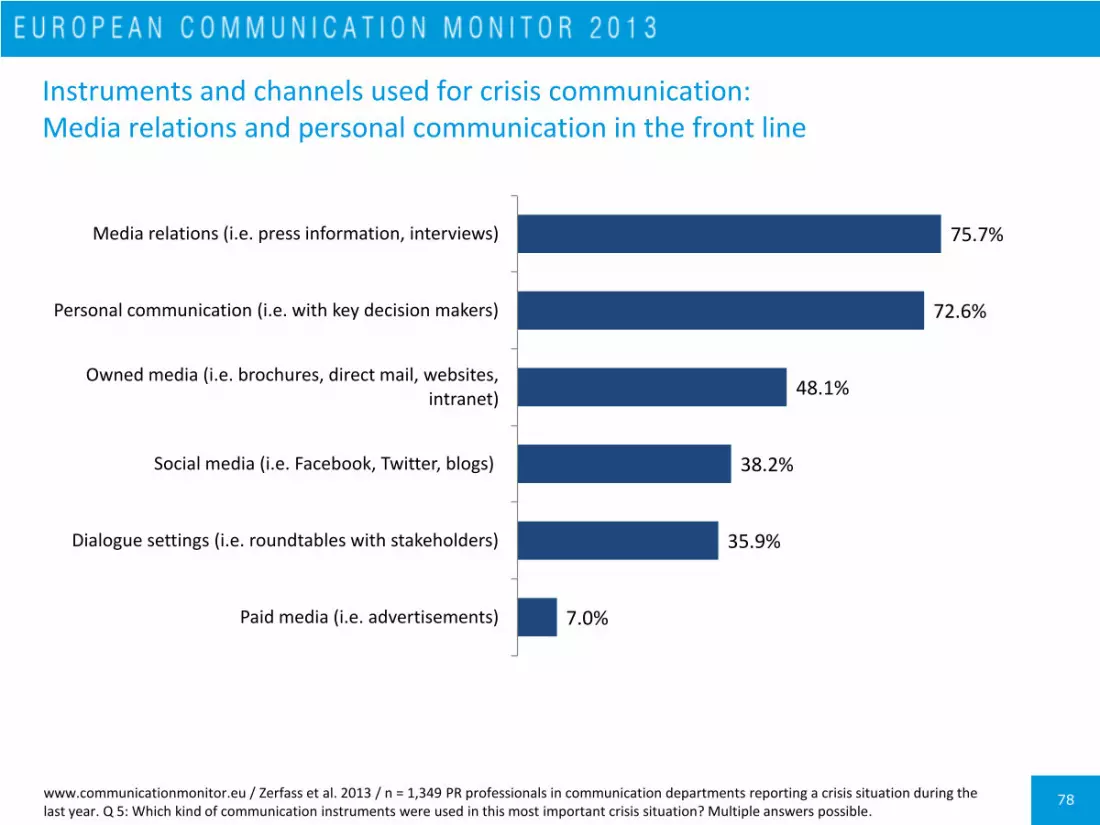
78
Instruments and channels used for crisis communication: Media relations and personal communication in the front line
75.7%
72.6%
48.1%
38.2%
35.9%
7.0%
Media relations (i.e. press information, interviews)
Personal communication (i.e. with key decision makers)
Owned media (i.e. brochures, direct mail, websites, intranet)
Social media (i.e. Facebook, Twitter, blogs)
Dialogue settings (i.e. roundtables with stakeholders)
Paid media (i.e. advertisements)
www.communicationmonitor.eu / Zerfass et al. 2013 / n = 1,349 PR professionals in communication departments reporting a crisis situation during the last year. Q 5: Which kind of communication instruments were used in this most important crisis situation? Multiple answers possible.
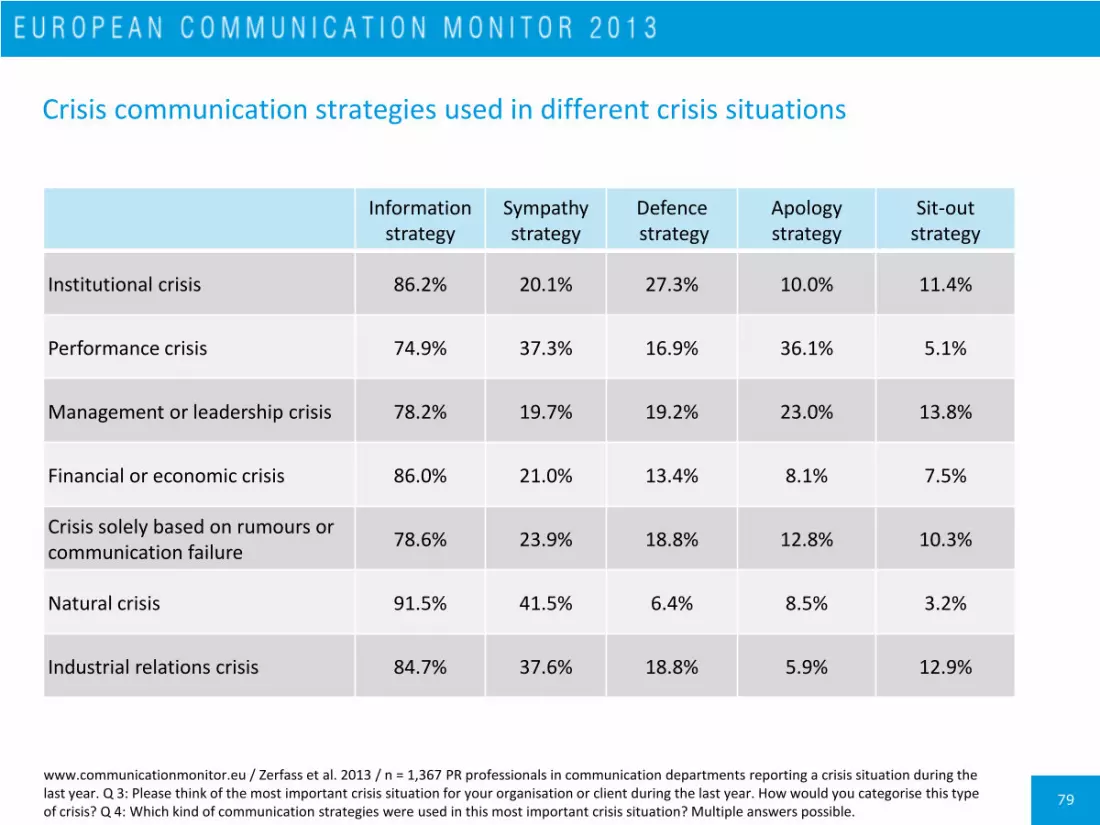
79
Crisis communication strategies used in different crisis situations
www.communicationmonitor.eu / Zerfass et al. 2013 / n = 1,367 PR professionals in communication departments reporting a crisis situation during the last year. Q 3: Please think of the most important crisis situation for your organisation or client during the last year. How would you categorise this type of crisis? Q 4: Which kind of communication strategies were used in this most important crisis situation? Multiple answers possible.
Information strategy
Sympathy strategy
Defence strategy
Apology strategy
Sit-out strategy
Institutional crisis 86.2% 20.1% 27.3% 10.0% 11.4%
Performance crisis 74.9% 37.3% 16.9% 36.1% 5.1%
Management or leadership crisis 78.2% 19.7% 19.2% 23.0% 13.8%
Financial or economic crisis 86.0% 21.0% 13.4% 8.1% 7.5%
Crisis solely based on rumours or communication failure
78.6% 23.9% 18.8% 12.8% 10.3%
Natural crisis 91.5% 41.5% 6.4% 8.5% 3.2%
Industrial relations crisis 84.7% 37.6% 18.8% 5.9% 12.9%

80
Communication instruments used in different crisis situations
Media relations
Personal communication
Owned media
Social media
Dialogue settings
Paid media
Institutional crisis 84.3% 77.4% 42.2% 41.1% 41.8% 9.4%
Performance crisis 76.6% 72.6% 50.0% 44.4% 31.7% 6.0%
Management or leadership crisis 72.3% 69.7% 49.8% 29.0% 34.2% 7.8%
Financial or economic crisis 68.6% 68.1% 57.3% 30.3% 38.4% 9.7%
Crisis solely based on rumours or communication failure
63.7% 72.6% 38.9% 46.0% 31.0% 8.0%
Natural crisis 85.1% 73.4% 48.9% 44.7% 23.4% 2.1%
Industrial relations crisis 71.8% 70.6% 42.4% 29.4% 47.1% 1.2%
www.communicationmonitor.eu / Zerfass et al. 2013 / n = 1,349 PR professionals in communication departments. Q 3: Please think of the most important crisis situation for your organisation or client during the last year. How would you categorise this type of crisis? Q 5: Which kind of communication instruments were used in this most important crisis situation? Multiple answers possible.
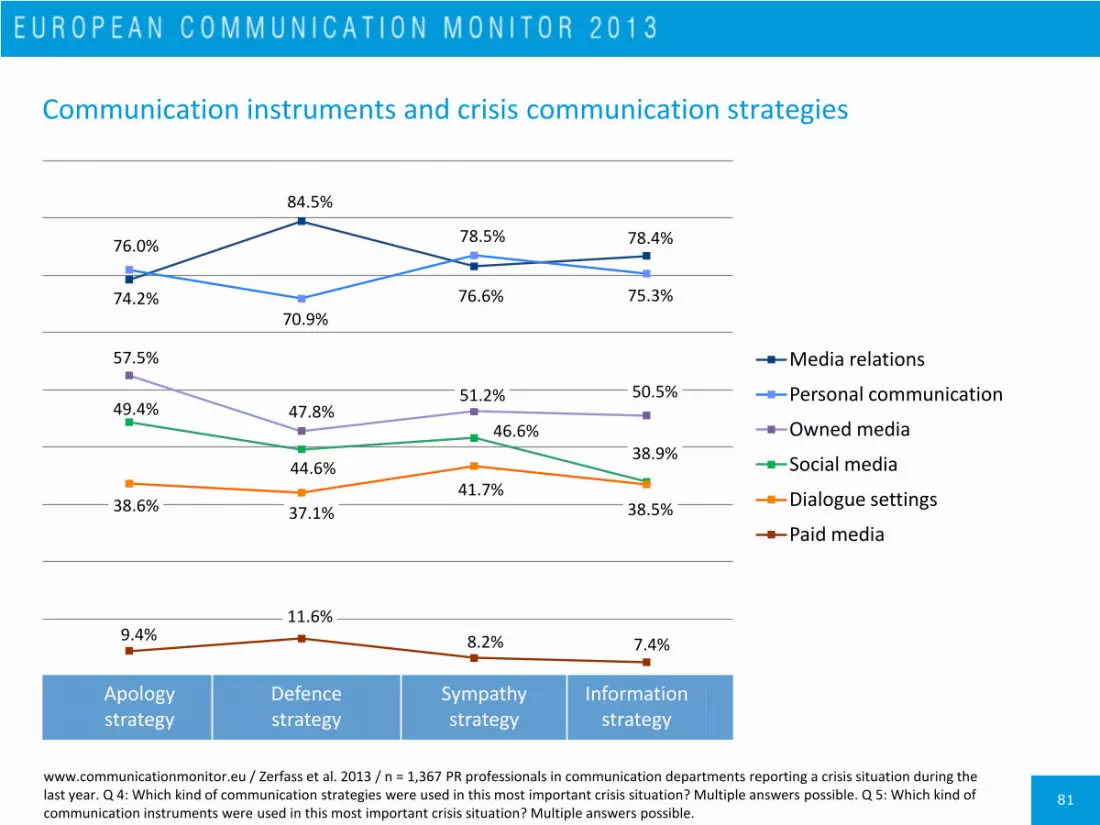
81
Communication instruments and crisis communication strategies
78.4%
76.6%
84.5%
74.2% 75.3%
78.5%
70.9%
76.0%
50.5% 51.2% 47.8%
57.5%
38.9% 46.6%
44.6%
49.4%
38.5% 41.7%
37.1% 38.6%
7.4% 8.2%
11.6% 9.4%
Media relations
Personal communication
Owned media
Social media
Dialogue settings
Paid media
www.communicationmonitor.eu / Zerfass et al. 2013 / n = 1,367 PR professionals in communication departments reporting a crisis situation during the last year. Q 4: Which kind of communication strategies were used in this most important crisis situation? Multiple answers possible. Q 5: Which kind of communication instruments were used in this most important crisis situation? Multiple answers possible.
Apology strategy
Defence strategy
Sympathy strategy
Information strategy

Strategic issues and influence
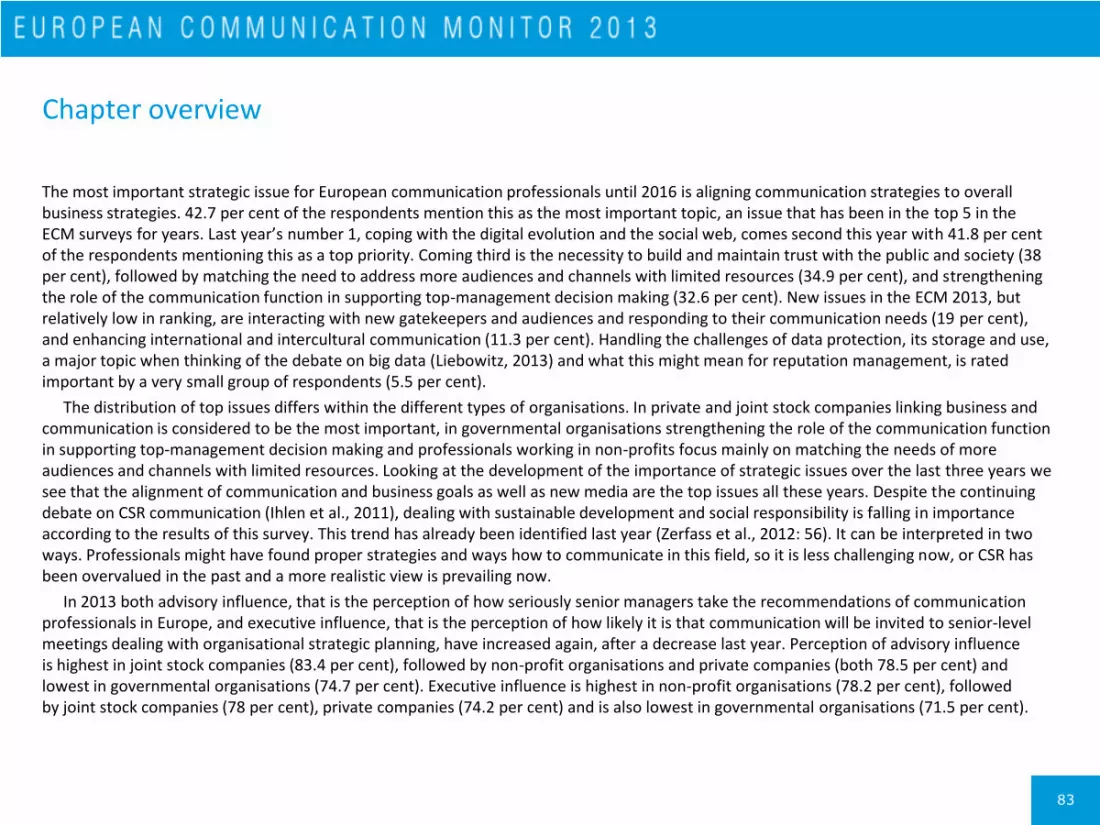
83
Chapter overview
The most important strategic issue for European communication professionals until 2016 is aligning communication strategies to overall business strategies. 42.7 per cent of the respondents mention this as the most important topic, an issue that has been in the top 5 in the ECM surveys for years. Last year’s number 1, coping with the digital evolution and the social web, comes second this year with 41.8 per cent of the respondents mentioning this as a top priority. Coming third is the necessity to build and maintain trust with the public and society (38 per cent), followed by matching the need to address more audiences and channels with limited resources (34.9 per cent), and strengthening the role of the communication function in supporting top-management decision making (32.6 per cent). New issues in the ECM 2013, but relatively low in ranking, are interacting with new gatekeepers and audiences and responding to their communication needs (19 per cent), and enhancing international and intercultural communication (11.3 per cent). Handling the challenges of data protection, its storage and use, a major topic when thinking of the debate on big data (Liebowitz, 2013) and what this might mean for reputation management, is rated important by a very small group of respondents (5.5 per cent).
The distribution of top issues differs within the different types of organisations. In private and joint stock companies linking business and communication is considered to be the most important, in governmental organisations strengthening the role of the communication function in supporting top-management decision making and professionals working in non-profits focus mainly on matching the needs of more audiences and channels with limited resources. Looking at the development of the importance of strategic issues over the last three years we see that the alignment of communication and business goals as well as new media are the top issues all these years. Despite the continuing debate on CSR communication (Ihlen et al., 2011), dealing with sustainable development and social responsibility is falling in importance according to the results of this survey. This trend has already been identified last year (Zerfass et al., 2012: 56). It can be interpreted in two ways. Professionals might have found proper strategies and ways how to communicate in this field, so it is less challenging now, or CSR has been overvalued in the past and a more realistic view is prevailing now.
In 2013 both advisory influence, that is the perception of how seriously senior managers take the recommendations of communication professionals in Europe, and executive influence, that is the perception of how likely it is that communication will be invited to senior-level meetings dealing with organisational strategic planning, have increased again, after a decrease last year. Perception of advisory influence is highest in joint stock companies (83.4 per cent), followed by non-profit organisations and private companies (both 78.5 per cent) and lowest in governmental organisations (74.7 per cent). Executive influence is highest in non-profit organisations (78.2 per cent), followed by joint stock companies (78 per cent), private companies (74.2 per cent) and is also lowest in governmental organisations (71.5 per cent).
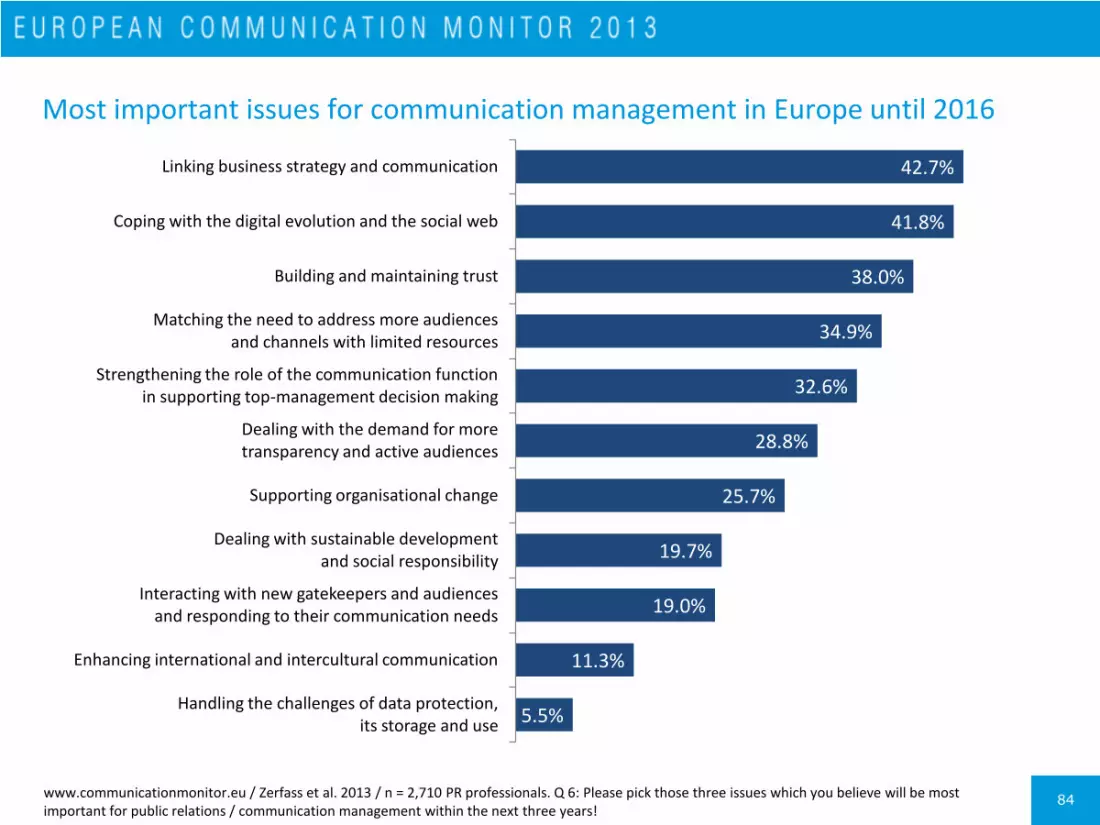
84
Most important issues for communication management in Europe until 2016
www.communicationmonitor.eu / Zerfass et al. 2013 / n = 2,710 PR professionals. Q 6: Please pick those three issues which you believe will be most important for public relations / communication management within the next three years!
42.7%
41.8%
38.0%
34.9%
32.6%
28.8%
25.7%
19.7%
19.0%
11.3%
5.5%
Linking business strategy and communication
Coping with the digital evolution and the social web
Building and maintaining trust
Matching the need to address more audiences and channels with limited resources
Strengthening the role of the communication function in supporting top-management decision making
Dealing with the demand for more transparency and active audiences
Supporting organisational change
Dealing with sustainable development and social responsibility
Interacting with new gatekeepers and audiences and responding to their communication needs
Enhancing international and intercultural communication
Handling the challenges of data protection, its storage and use
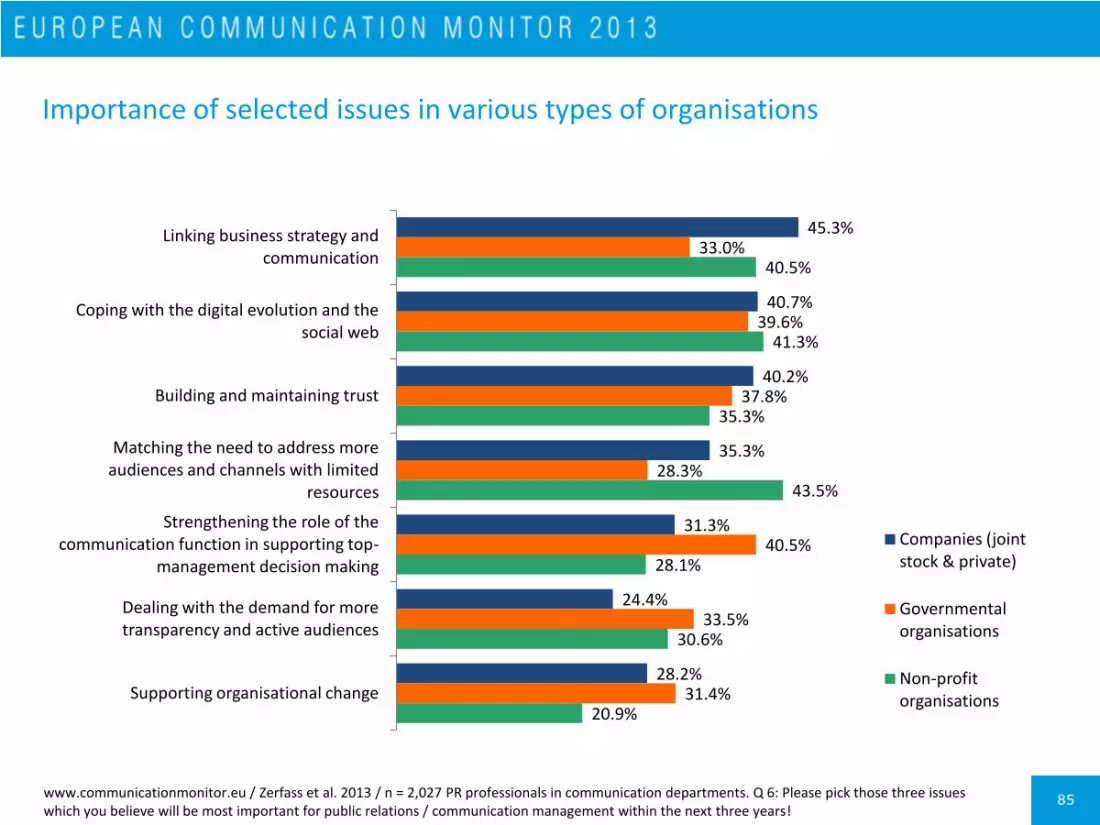
85
Importance of selected issues in various types of organisations
45.3%
40.7%
40.2%
35.3%
31.3%
24.4%
28.2%
33.0%
39.6%
37.8%
28.3%
40.5%
33.5%
31.4%
40.5%
41.3%
35.3%
43.5%
28.1%
30.6%
20.9%
Linking business strategy and communication
Coping with the digital evolution and the social web
Building and maintaining trust
Matching the need to address more audiences and channels with limited
resources
Strengthening the role of the communication function in supporting top-
management decision making
Dealing with the demand for more transparency and active audiences
Supporting organisational change
Companies (joint stock & private)
Governmental organisations
Non-profit organisations
www.communicationmonitor.eu / Zerfass et al. 2013 / n = 2,027 PR professionals in communication departments. Q 6: Please pick those three issues which you believe will be most important for public relations / communication management within the next three years!

86
Development of strategic issues during the last years
www.communicationmonitor.eu / Zerfass et al. 2013 / n = 2,710 PR professionals. Q 6. Zerfass et al. 2011 / n = 2,209. Q 12. Zerfass et al. 2009 / n = 1,863. Q 6: Please pick those three issues which you believe will be most important for public relations / communication management within the next three years!
47.3%
44.0%
42.7% 45.0%
54.9%
41.8%
34.6%
30.1%
38.0%
19.9% 19.2%
25.7%
38.0% 37.2%
19.7%
2009 2011 2013
Linking business strategy and communication
Coping with the digital evolution and the social web
Building and maintaining trust
Supporting organisational change
Dealing with sustainable development and social responsibility
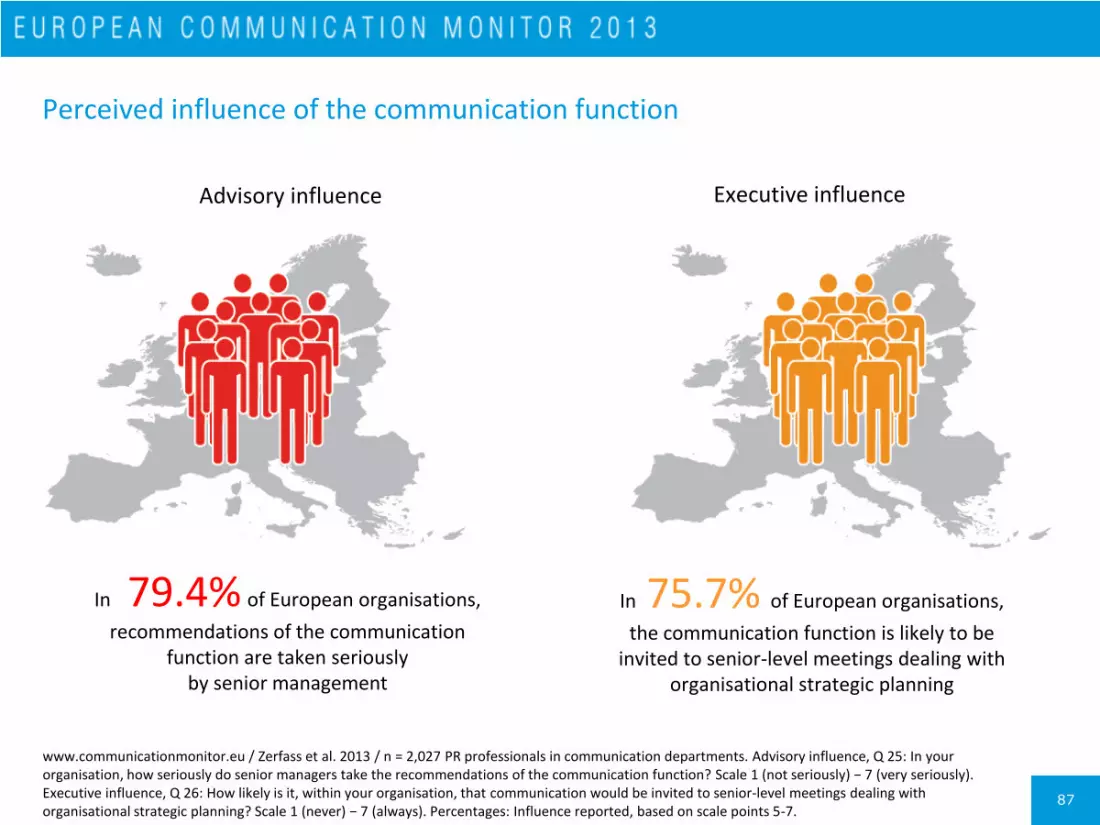
87
Perceived influence of the communication function
www.communicationmonitor.eu / Zerfass et al. 2013 / n = 2,027 PR professionals in communication departments. Advisory influence, Q 25: In your organisation, how seriously do senior managers take the recommendations of the communication function? Scale 1 (not seriously) − 7 (very seriously). Executive influence, Q 26: How likely is it, within your organisation, that communication would be invited to senior-level meetings dealing with organisational strategic planning? Scale 1 (never) − 7 (always). Percentages: Influence reported, based on scale points 5-7.
In 79.4% of European organisations,
recommendations of the communication function are taken seriously
by senior management
In 75.7% of European organisations,
the communication function is likely to be invited to senior-level meetings dealing with
organisational strategic planning
Advisory influence Executive influence
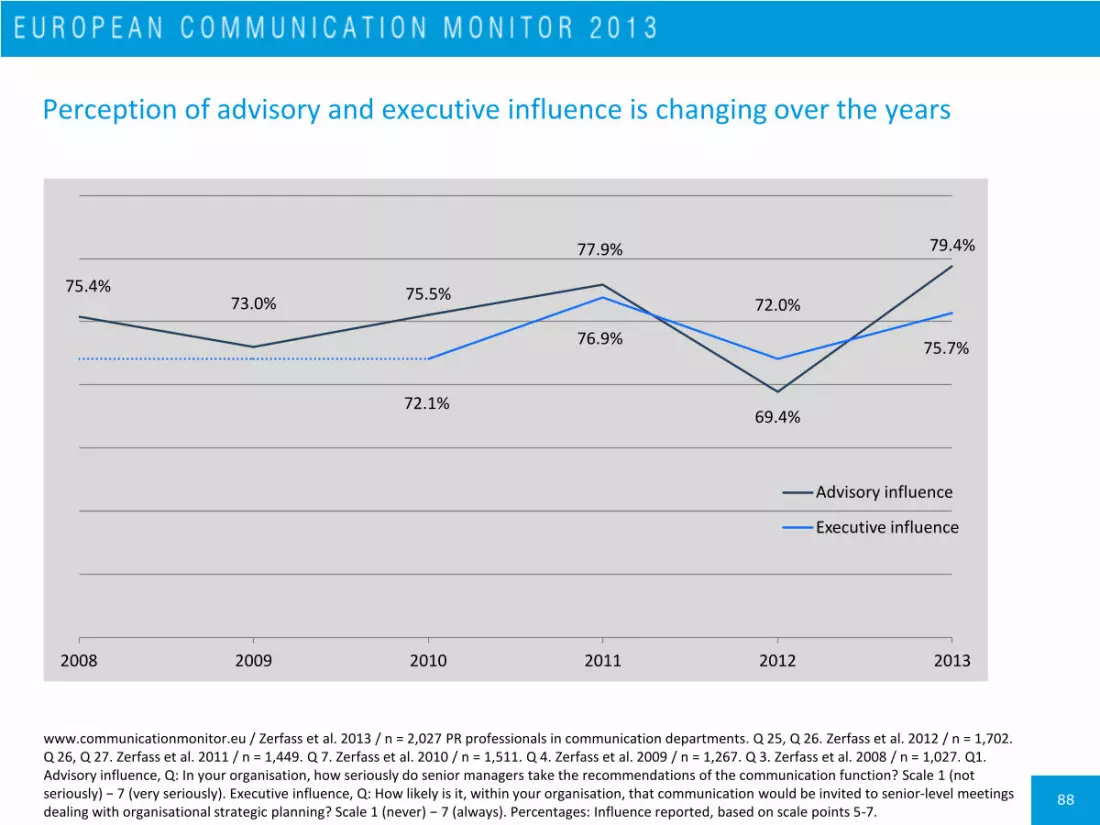
88
Perception of advisory and executive influence is changing over the years
www.communicationmonitor.eu / Zerfass et al. 2013 / n = 2,027 PR professionals in communication departments. Q 25, Q 26. Zerfass et al. 2012 / n = 1,702. Q 26, Q 27. Zerfass et al. 2011 / n = 1,449. Q 7. Zerfass et al. 2010 / n = 1,511. Q 4. Zerfass et al. 2009 / n = 1,267. Q 3. Zerfass et al. 2008 / n = 1,027. Q1. Advisory influence, Q: In your organisation, how seriously do senior managers take the recommendations of the communication function? Scale 1 (not seriously) − 7 (very seriously). Executive influence, Q: How likely is it, within your organisation, that communication would be invited to senior-level meetings dealing with organisational strategic planning? Scale 1 (never) − 7 (always). Percentages: Influence reported, based on scale points 5-7.
75.4% 73.0%
75.5%
77.9%
69.4%
79.4%
72.1%
76.9%
72.0%
75.7%
2008 2009 2010 2011 2012 2013
Advisory influence
Executive influence

89
Influence of the communication function in different types of organisations
83.4% 78.5% 78.5%
74.7% 78.0% 78.2%
74.2% 71.5%
Joint stock companies Non-profit organisations Private companies Governmental organisations
Advisory influence Executive influence*
www.communicationmonitor.eu / Zerfass et al. 2013 / n = 2,027 PR professionals in communication departments. Advisory influence, Q 25: In your organisation, how seriously do senior managers take the recommendations of the communication function? Scale 1 (not seriously) − 7 (very seriously). Executive influence, Q 26: How likely is it, within your organisation, that communication would be invited to senior-level meetings dealing with organisational strategic planning? Scale 1 (never) − 7 (always). Percentages: Agreement based on scale points 5-7. * Significant correlations (chi-square test, p ≤ 0.05).
Status, budgets and perspectives

91
The turbulent economic and political situation in Europe has provided threats and opportunities for strategic communication. While it seems harder than ever to gain resources, many organisations have realised that communication can help to gain trust and facilitate new partnerships in times of transition. The latter seems to be a major trend. In the ECM 2013, 87 per cent of the communication professionals working in communication departments state that communication has become more important for the overall success of their organisation within the last year. This positive development is visible all over Europe, with Austria, Norway, the United Kingdom, Germany and Poland leading the field.
However, the rising importance of communication does not go along with an increased influence and status of the communication function in organisations. This cognitive dimension of institutionalisation (Sandhu, 2009) is underdeveloped in most countries, just like any kind of economic underpinning which would result in rising resources. Despite the rise in importance identified by 87 per cent of the respondents, only 61.6 per cent say that the influence and status of their current role as a communication professional has increased. And only a small minority of 14.8 per cent report that their budgets have been increased above average compared to other functions in the organisation. Differences across Europe are quite strong for both issues. Influence and status have developed more positively in Norway, Denmark and Germany, while Croatia, Slovenia and the Czech Republic are lagging behind. In terms of resources, one third of the professionals in Norway and Denmark report rising budgets, which is at least 10 per cent more than in any other European country.
In the long run communication budgets and resources are going down in many European organisations, compared to other functions of the organisation. 41.1 per cent of the communication professionals say that their budgets are reduced above the average, going up from 37.2 per cent in 2010. For 44.1 per cent the budget has stayed the same, in 2010 this was 40.8 per cent. The development of communication budgets differs significantly in various kinds of organisations, with non-profit organisations on the front.
This disillusioning result provokes the question whether communication professionals in Europe fear the future or whether they are still optimistic about the development of their job life. According to the ECM 2013 data, the majority (58.5 per cent) is optimistic when thinking of their career. The support for this positive view is less strong in private companies, while worries are mostly reported by people working in agencies, governmental organisations and private companies. The positive self-perception is also higher in some Western and Northern European countries. Agreements of more than 70 per cent have been recorded in Norway, Sweden, and Switzerland.
Career development and influence in the organisation is positively related to the professional roles enacted by communication professionals. Those responsible for communication strategy and coordination of communication and those who are focused on consultancy, advising and coaching are significantly more optimistic about the future than their peers who take other roles. This complements insights from last year’s survey. According to the ECM 2012, aligning communication to organisational goals and coaching are positively correlated to the advisory and executive influence of the communication function at large (Zerfass et al., 2012: 48).
Chapter overview

92
Impact of the turbulent economic and political situation in Europe on strategic communication
www.communicationmonitor.eu / Zerfass et al. 2013 / n = 2,027 PR professionals in communication departments. Q 1: Please rate these statements based on your experience within the last 12 months. Scale 1 (less important, decreased, reduced) − 5 (more important, increased, increased). Percentages: Agreement based on scale points 4-5.
87.0%
61.6%
14.8%
Communication has become more important for the overall success of organisations
The influence and status of my current role as a communication professional has increased
Budgets for communication have been increased above average, compared to other functions

93
Communication has become more important for European organisations during the current downturn, when compared to the 2009/2010 economic crisis
www.communicationmonitor.eu / Zerfass et al. 2013 / n = 2,027 PR professionals in communication departments. Q 1. Zerfass et al. 2010 / n = 1.533. Q 1. Scale 1 (less important) − 5 (more important). Percentages: Agreement to scale points 4-5, 3, 1-2.
72.0%
87.0%
19.8%
8.4%
8.3%
4.6%
0% 100%
2010
2013
Rising importance of communication No change Declining importance
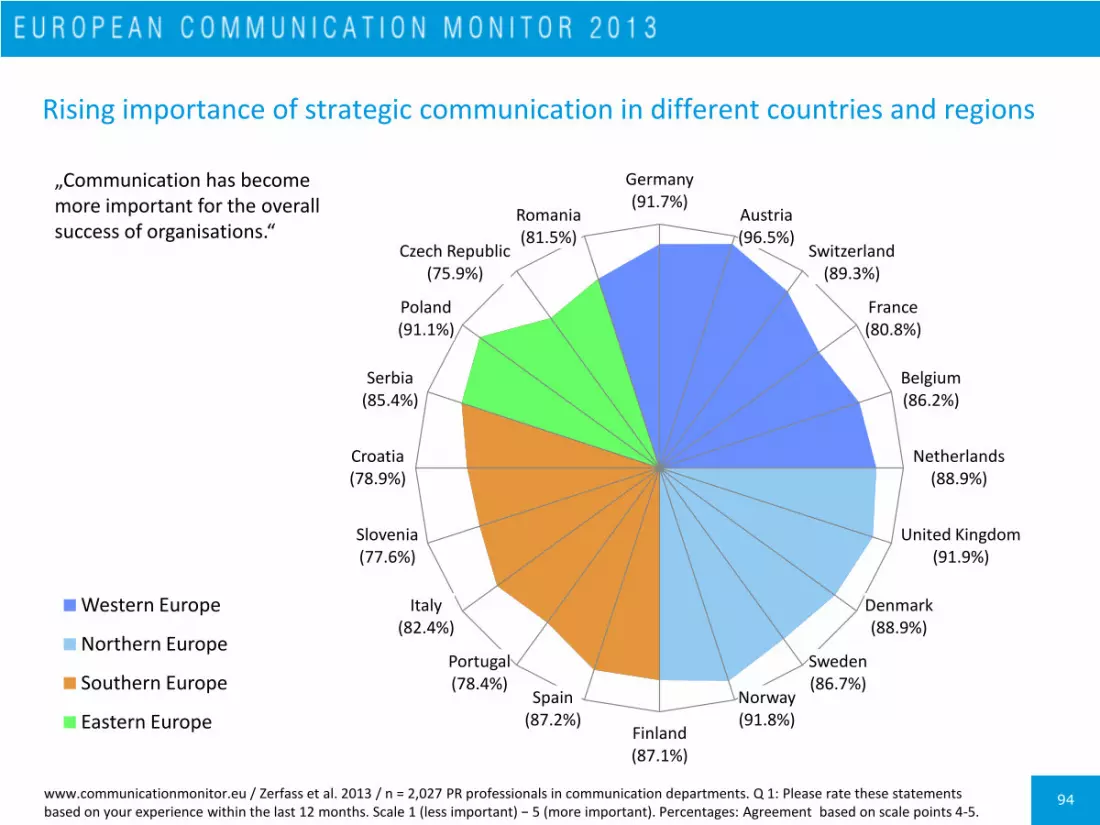
94
Rising importance of strategic communication in different countries and regions
www.communicationmonitor.eu / Zerfass et al. 2013 / n = 2,027 PR professionals in communication departments. Q 1: Please rate these statements based on your experience within the last 12 months. Scale 1 (less important) − 5 (more important). Percentages: Agreement based on scale points 4-5.
Germany (91.7%)
Austria (96.5%)
Switzerland (89.3%)
France (80.8%)
Belgium (86.2%)
Netherlands (88.9%)
United Kingdom (91.9%)
Denmark (88.9%)
Sweden (86.7%)
Norway (91.8%)
Finland (87.1%)
Spain (87.2%)
Portugal (78.4%)
Italy (82.4%)
Slovenia (77.6%)
Croatia (78.9%)
Serbia (85.4%)
Poland (91.1%)
Czech Republic (75.9%)
Romania (81.5%)
Western Europe
Northern Europe
Southern Europe
Eastern Europe
„Communication has become more important for the overall success of organisations.“
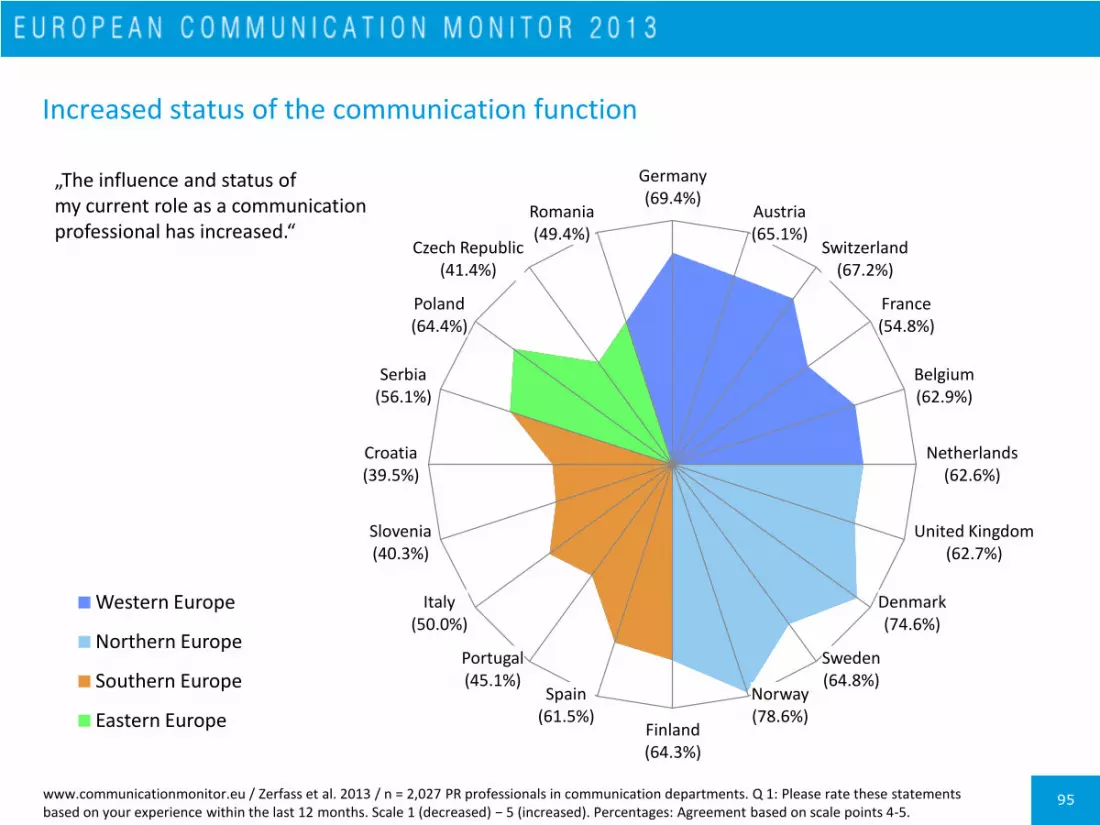
95
Increased status of the communication function
www.communicationmonitor.eu / Zerfass et al. 2013 / n = 2,027 PR professionals in communication departments. Q 1: Please rate these statements based on your experience within the last 12 months. Scale 1 (decreased) − 5 (increased). Percentages: Agreement based on scale points 4-5.
Germany (69.4%)
Austria (65.1%)
Switzerland (67.2%)
France (54.8%)
Belgium (62.9%)
Netherlands (62.6%)
United Kingdom (62.7%)
Denmark (74.6%)
Sweden (64.8%)
Norway (78.6%)
Finland (64.3%)
Spain (61.5%)
Portugal (45.1%)
Italy (50.0%)
Slovenia (40.3%)
Croatia (39.5%)
Serbia (56.1%)
Poland (64.4%)
Czech Republic (41.4%)
Romania (49.4%)
Western Europe
Northern Europe
Southern Europe
Eastern Europe
„The influence and status of my current role as a communication professional has increased.“

96
Positive development of communication budgets
www.communicationmonitor.eu / Zerfass et al. 2013 / n = 2,027 PR professionals in communication departments. Q 1: Please rate these statements based on your experience within the last 12 months. Scale 1 (reduced) − 5 (increased). Percentages: Agreement based on scale points 4-5.
Germany (17.4%)
Austria (10.5%)
Switzerland (18.0%)
France (15.1%)
Belgium (10.3%)
Netherlands (12.9%)
United Kingdom (9.9%)
Denmark (28.6%)
Sweden (18.1%)
Norway (31.6%)
Finland (12.9%)
Spain (14.7%)
Portugal (13.7%)
Italy (7.4%)
Slovenia (10.4%)
Croatia (7.9%)
Serbia (17.1%)
Poland (17.8%)
Czech Republic (10.3%)
Romania (7.4%)
Western Europe
Northern Europe
Southern Europe
Eastern Europe
„Budgets for communication have been increased above average, compared to other functions.“

97
In the long run, communication budgets and resources are going down in many European organisations, compared to other functions
www.communicationmonitor.eu / Zerfass et al. 2013 / n = 2,027 PR professionals in communication departments. Q1. Zerfass et al. 2010 / n = 1.533. Q 1. Scale 1 (reduced) − 5 (increased). Percentages: Agreement based on scale points 4-5.
22.0%
14.8%
40.8%
44.1%
37.2%
41.1%
0% 100%
2010
2013
Budgets increased above average Equal Budgets reduced above average

98
12.7%
16.2%
15.6%
16.3%
2.58
2.65
2.70
2.79
2.20 2.40 2.60 2.80 3.00 3.20
0.0% 50.0%
Joint stock companies
Private companies
Governmental organisations
Non-profit organisations
Organisations with a budget rise above average, compared to other functions
Mean development of budgets (scale: 1 reduced above average - 5 increased above average)
1.00 Reduced above average 3.00 Increased above average 5.00
Development of communication budgets within different types of organisations: Non-profits are doing better than others
www.communicationmonitor.eu / Zerfass et al. 2013 / n = 2,027 PR professionals in communication departments. Q 1: Please rate these statements based on your experience within the last 12 months. Scale 1 (reduced) − 5 (increased). Percentages: Agreement based on scale points 4-5. Means values. Significant correlation between type of organisation and budget development (chi-square test, p ≤ 0.05).
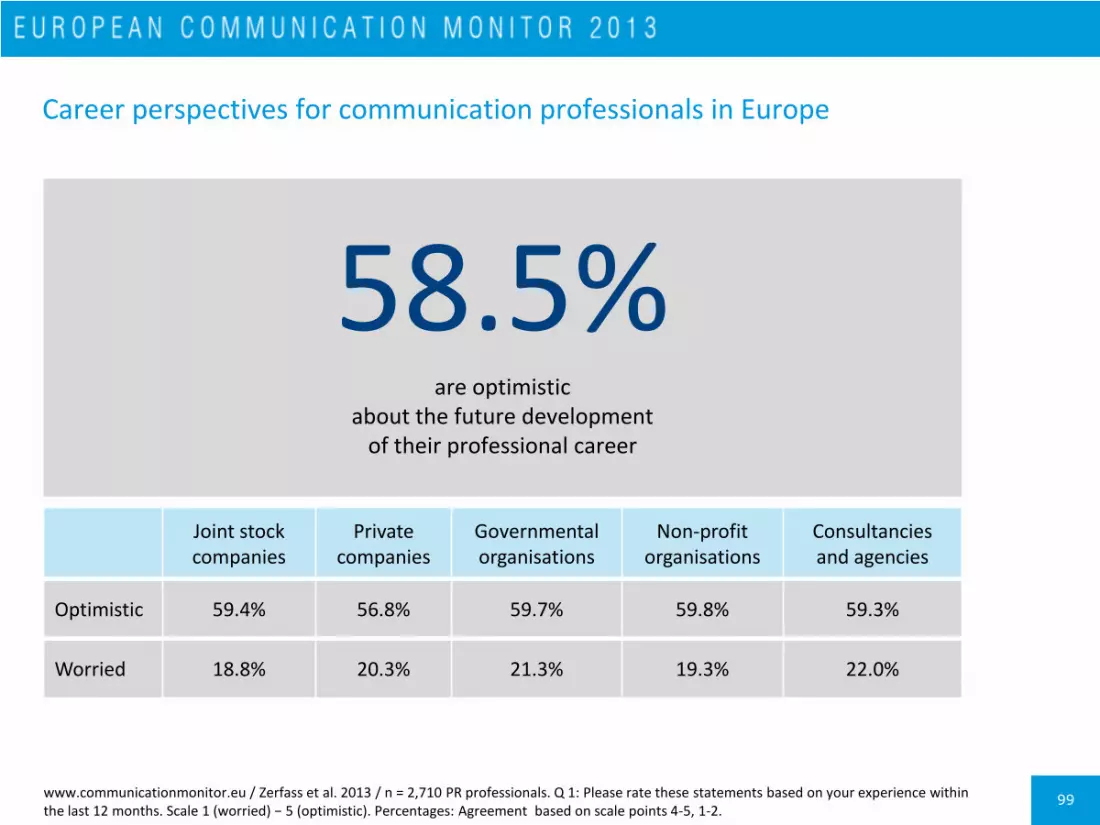
99
Career perspectives for communication professionals in Europe
58.5% are optimistic
about the future development of their professional career
Joint stock companies
Private companies
Governmental organisations
Non-profit organisations
Consultancies and agencies
Optimistic 59.4% 56.8% 59.7% 59.8% 59.3%
Worried 18.8% 20.3% 21.3% 19.3% 22.0%
www.communicationmonitor.eu / Zerfass et al. 2013 / n = 2,710 PR professionals. Q 1: Please rate these statements based on your experience within the last 12 months. Scale 1 (worried) − 5 (optimistic). Percentages: Agreement based on scale points 4-5, 1-2.

100
Positive self-perceptions about the future of communication careers in different countries
www.communicationmonitor.eu / Zerfass et al. 2013 / n = 2,710 PR professionals. Q 1: Please rate these statements based on your experience within the last 12 months. Scale 1 (worried) − 5 (optimistic). Percentages: Agreement based on scale points 4-5.
Germany (66.9%)
Austria (70.9%)
Switzerland (73.8%)
France (46.6%)
Belgium (51.7%)
Netherlands (60.8%)
United Kingdom (49.7%)
Denmark (68.3%)
Sweden (76.2%)
Norway (86.7%)
Finland (62.9%)
Spain (55.0%)
Portugal (39.2%)
Italy (38.9%)
Slovenia (34.3%)
Croatia (39.5%)
Serbia (56.1%)
Poland (60.0%)
Czech Republic (62.1%)
Romania (53.1%)
Western Europe
Northern Europe
Southern Europe
Eastern Europe
„I am optimistic about the future development of my professional career.“
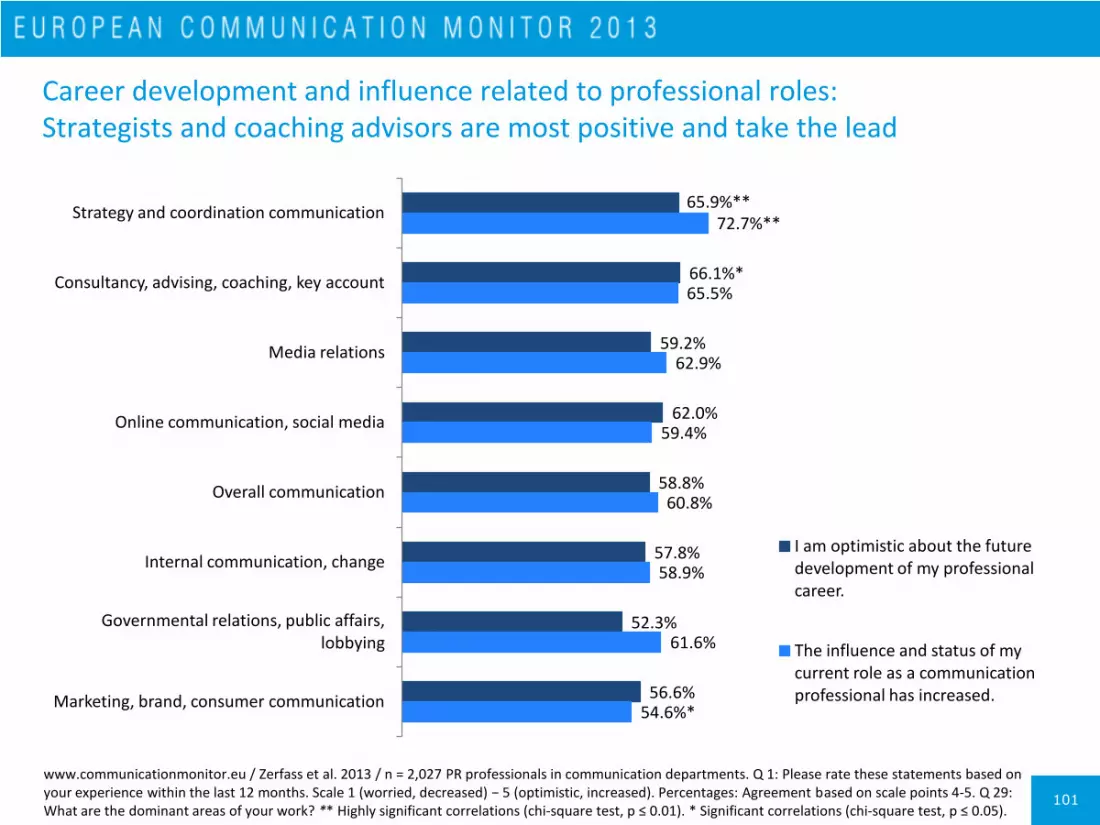
101
Career development and influence related to professional roles: Strategists and coaching advisors are most positive and take the lead
www.communicationmonitor.eu / Zerfass et al. 2013 / n = 2,027 PR professionals in communication departments. Q 1: Please rate these statements based on your experience within the last 12 months. Scale 1 (worried, decreased) − 5 (optimistic, increased). Percentages: Agreement based on scale points 4-5. Q 29: What are the dominant areas of your work? ** Highly significant correlations (chi-square test, p ≤ 0.01). * Significant correlations (chi-square test, p ≤ 0.05).
65.9%**
66.1%*
59.2%
62.0%
58.8%
57.8%
52.3%
56.6%
72.7%**
65.5%
62.9%
59.4%
60.8%
58.9%
61.6%
54.6%*
Strategy and coordination communication
Consultancy, advising, coaching, key account
Media relations
Online communication, social media
Overall communication
Internal communication, change
Governmental relations, public affairs, lobbying
Marketing, brand, consumer communication
I am optimistic about the future development of my professional career.
The influence and status of my current role as a communication professional has increased.
Salaries
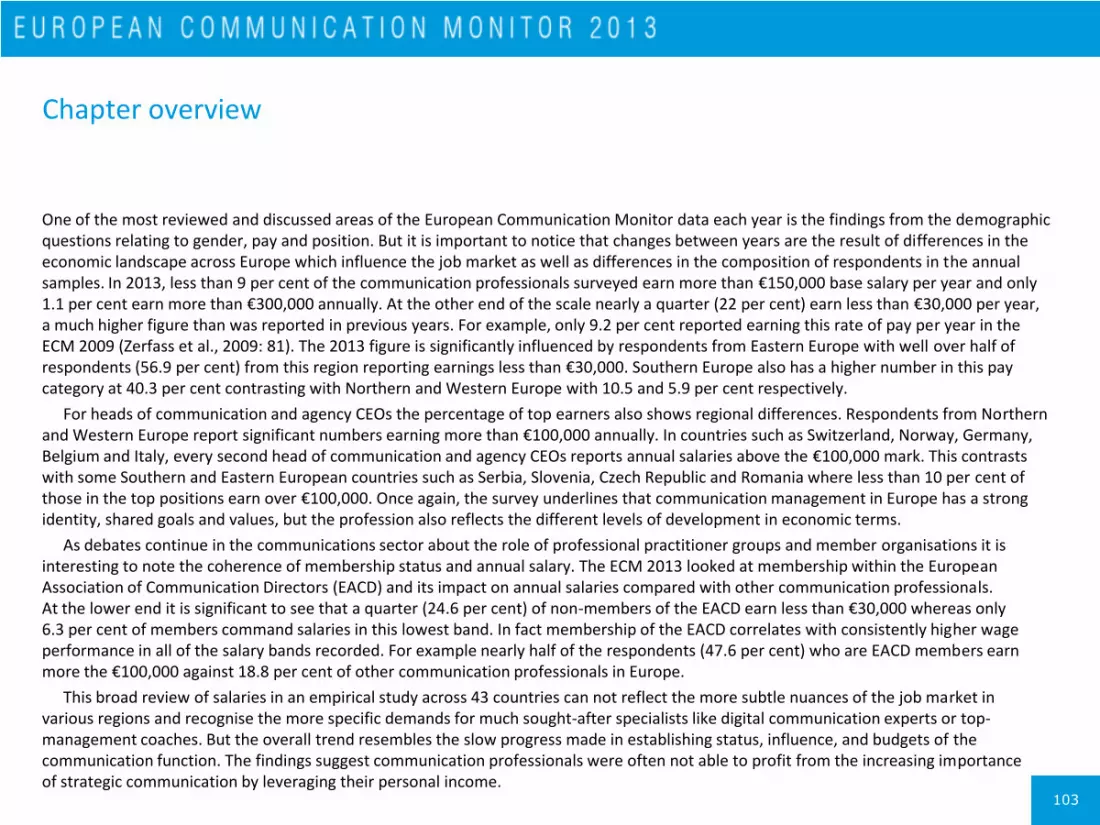
103
One of the most reviewed and discussed areas of the European Communication Monitor data each year is the findings from the demographic questions relating to gender, pay and position. But it is important to notice that changes between years are the result of differences in the economic landscape across Europe which influence the job market as well as differences in the composition of respondents in the annual samples. In 2013, less than 9 per cent of the communication professionals surveyed earn more than €150,000 base salary per year and only 1.1 per cent earn more than €300,000 annually. At the other end of the scale nearly a quarter (22 per cent) earn less than €30,000 per year, a much higher figure than was reported in previous years. For example, only 9.2 per cent reported earning this rate of pay per year in the ECM 2009 (Zerfass et al., 2009: 81). The 2013 figure is significantly influenced by respondents from Eastern Europe with well over half of respondents (56.9 per cent) from this region reporting earnings less than €30,000. Southern Europe also has a higher number in this pay category at 40.3 per cent contrasting with Northern and Western Europe with 10.5 and 5.9 per cent respectively.
For heads of communication and agency CEOs the percentage of top earners also shows regional differences. Respondents from Northern and Western Europe report significant numbers earning more than €100,000 annually. In countries such as Switzerland, Norway, Germany, Belgium and Italy, every second head of communication and agency CEOs reports annual salaries above the €100,000 mark. This contrasts with some Southern and Eastern European countries such as Serbia, Slovenia, Czech Republic and Romania where less than 10 per cent of those in the top positions earn over €100,000. Once again, the survey underlines that communication management in Europe has a strong identity, shared goals and values, but the profession also reflects the different levels of development in economic terms.
As debates continue in the communications sector about the role of professional practitioner groups and member organisations it is interesting to note the coherence of membership status and annual salary. The ECM 2013 looked at membership within the European Association of Communication Directors (EACD) and its impact on annual salaries compared with other communication professionals. At the lower end it is significant to see that a quarter (24.6 per cent) of non-members of the EACD earn less than €30,000 whereas only 6.3 per cent of members command salaries in this lowest band. In fact membership of the EACD correlates with consistently higher wage performance in all of the salary bands recorded. For example nearly half of the respondents (47.6 per cent) who are EACD members earn more the €100,000 against 18.8 per cent of other communication professionals in Europe.
This broad review of salaries in an empirical study across 43 countries can not reflect the more subtle nuances of the job market in various regions and recognise the more specific demands for much sought-after specialists like digital communication experts or top-management coaches. But the overall trend resembles the slow progress made in establishing status, influence, and budgets of the communication function. The findings suggest communication professionals were often not able to profit from the increasing importance of strategic communication by leveraging their personal income.
Chapter overview
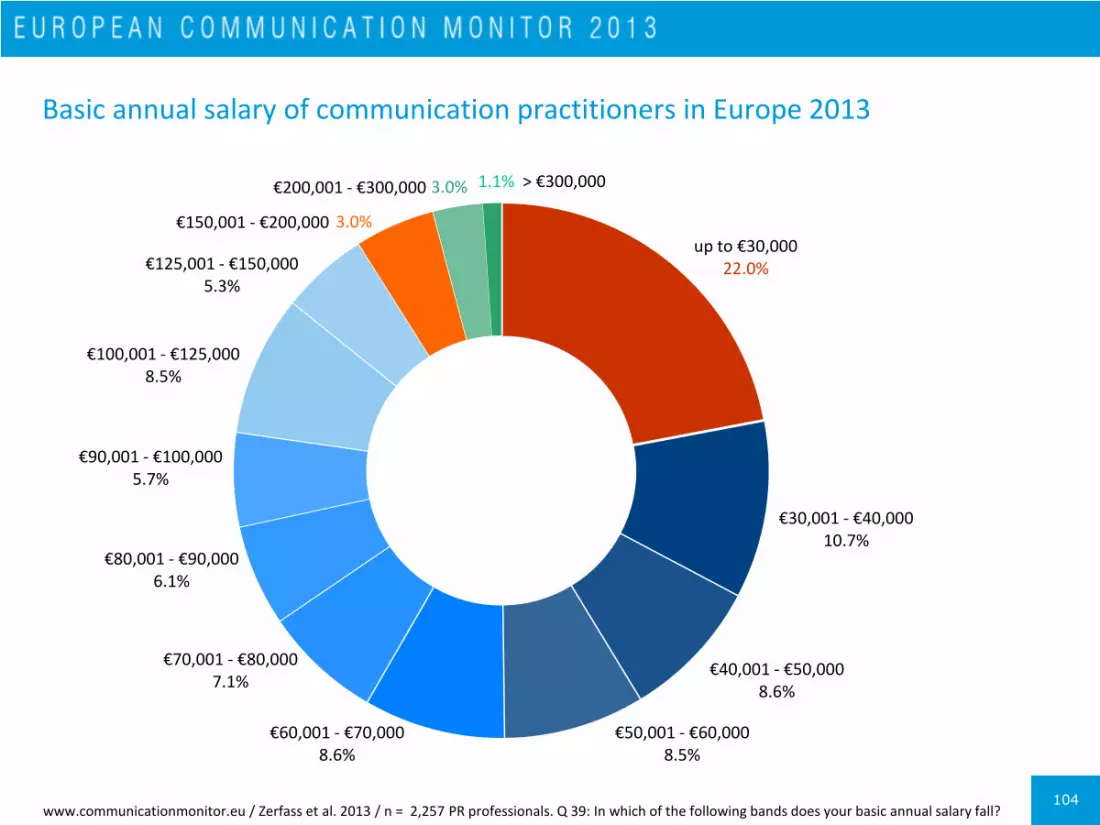
104
Basic annual salary of communication practitioners in Europe 2013
up to €30,000 22.0%
€30,001 - €40,000 10.7%
€40,001 - €50,000 8.6%
€50,001 - €60,000 8.5%
€60,001 - €70,000 8.6%
€70,001 - €80,000 7.1%
€80,001 - €90,000 6.1%
€90,001 - €100,000 5.7%
€100,001 - €125,000 8.5%
€125,001 - €150,000 5.3%
€150,001 - €200,000
€200,001 - €300,000 1.1% > €300,000 3.0%
3.0%
www.communicationmonitor.eu / Zerfass et al. 2013 / n = 2,257 PR professionals. Q 39: In which of the following bands does your basic annual salary fall?
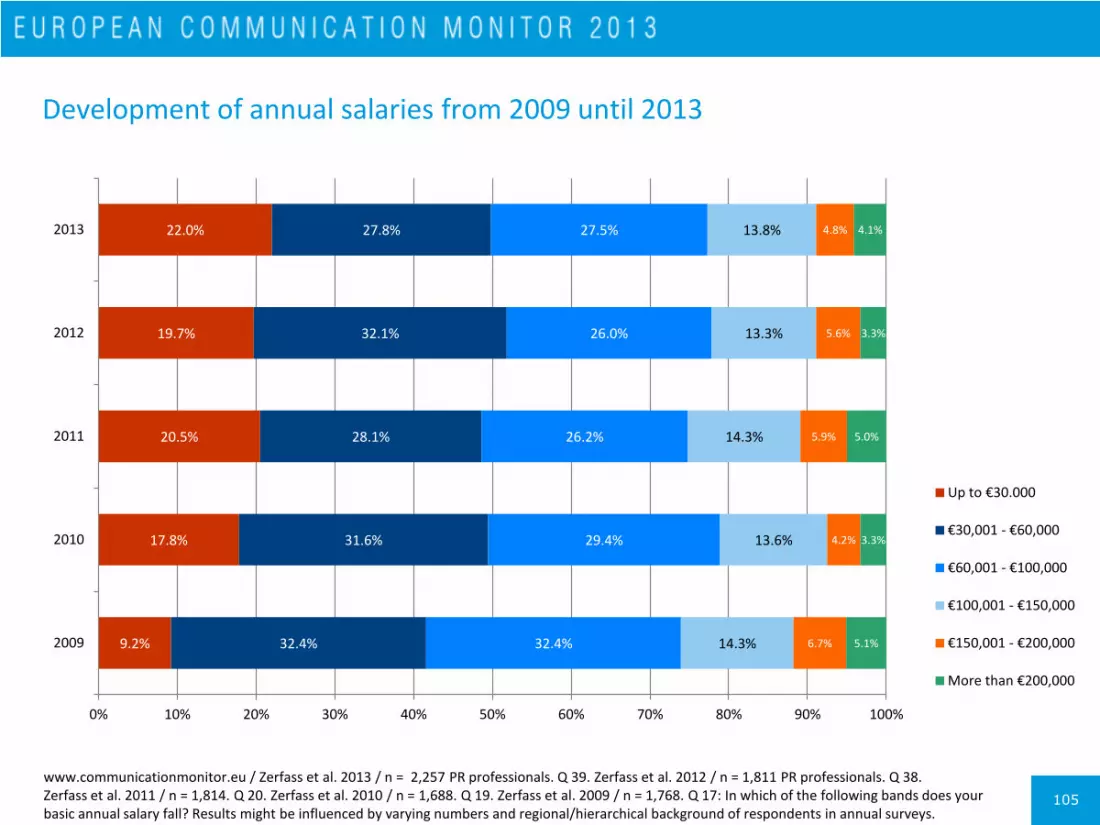
105
Development of annual salaries from 2009 until 2013
www.communicationmonitor.eu / Zerfass et al. 2013 / n = 2,257 PR professionals. Q 39. Zerfass et al. 2012 / n = 1,811 PR professionals. Q 38. Zerfass et al. 2011 / n = 1,814. Q 20. Zerfass et al. 2010 / n = 1,688. Q 19. Zerfass et al. 2009 / n = 1,768. Q 17: In which of the following bands does your basic annual salary fall? Results might be influenced by varying numbers and regional/hierarchical background of respondents in annual surveys.
9.2%
17.8%
20.5%
19.7%
22.0%
32.4%
31.6%
28.1%
32.1%
27.8%
32.4%
29.4%
26.2%
26.0%
27.5%
14.3%
13.6%
14.3%
13.3%
13.8%
6.7%
4.2%
5.9%
5.6%
4.8%
5.1%
3.3%
5.0%
3.3%
4.1%
0% 10% 20% 30% 40% 50% 60% 70% 80% 90% 100%
2009
2010
2011
2012
2013
Up to €30.000
€30,001 - €60,000
€60,001 - €100,000
€100,001 - €150,000
€150,001 - €200,000
More than €200,000
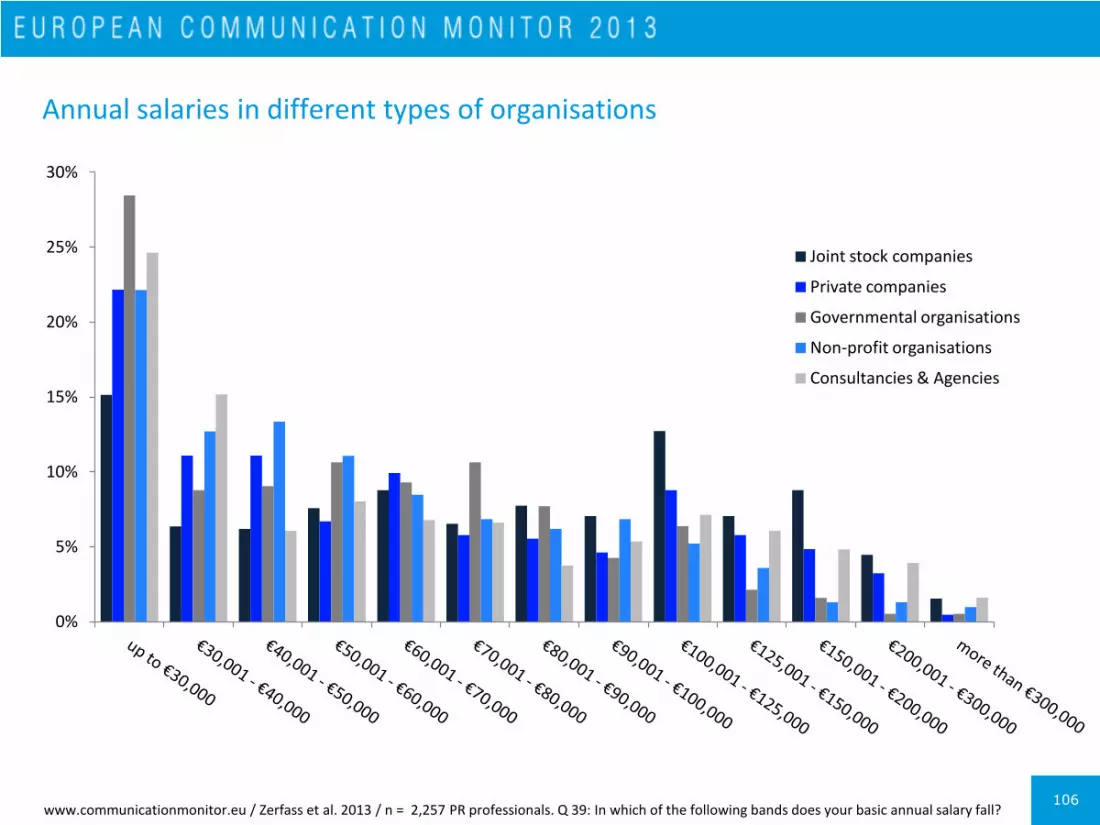
106
Annual salaries in different types of organisations
0%
5%
10%
15%
20%
25%
30%
Joint stock companies
Private companies
Governmental organisations
Non-profit organisations
Consultancies & Agencies
www.communicationmonitor.eu / Zerfass et al. 2013 / n = 2,257 PR professionals. Q 39: In which of the following bands does your basic annual salary fall?
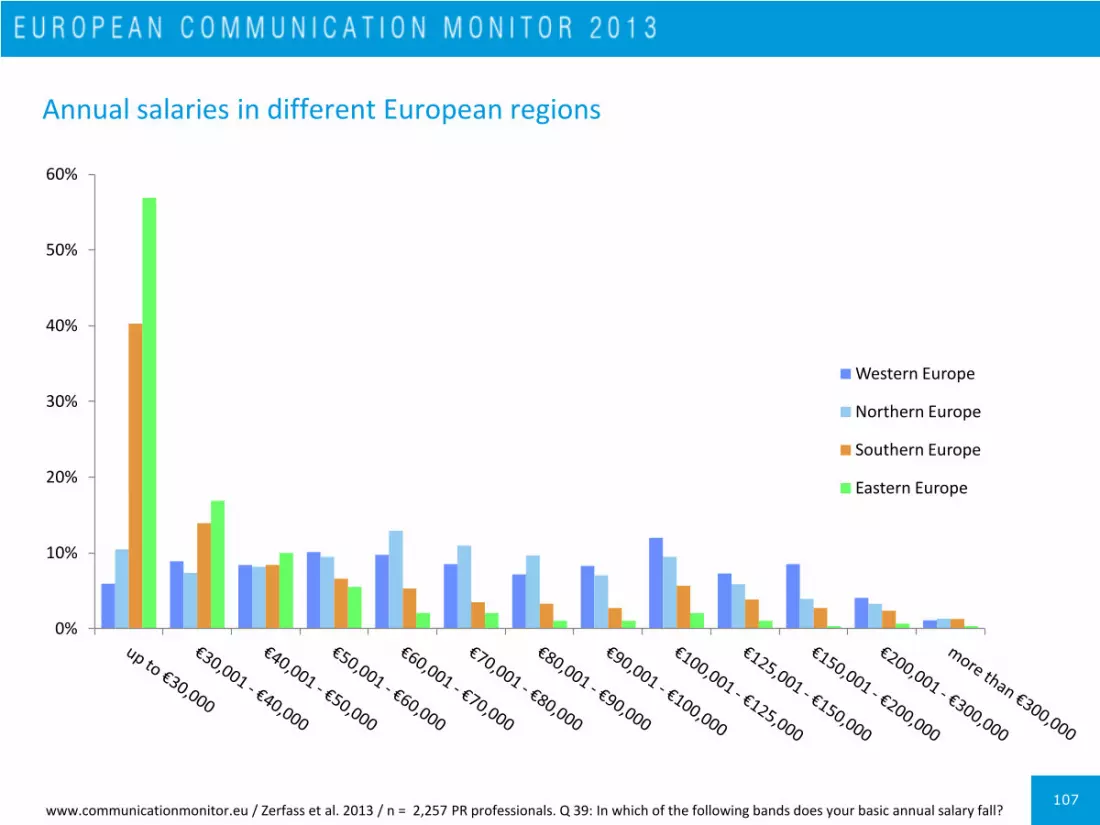
107
Annual salaries in different European regions
0%
10%
20%
30%
40%
50%
60%
Western Europe
Northern Europe
Southern Europe
Eastern Europe
www.communicationmonitor.eu / Zerfass et al. 2013 / n = 2,257 PR professionals. Q 39: In which of the following bands does your basic annual salary fall?

108
Annual salaries of heads of communication and agency CEOs in selected countries
31.7%
51.1%
43.8%
54.8%
45.5%
75.0%
44.0%
36.0%
68.9%
19.6%
40.2%
11.8%
49.0%
26.3%
0.0%
3.4%
29.2%
5.3%
11.8%
5.6%
0%
10%
20%
30%
40%
50%
60%
70%
80%
Up to €30.000 €30,001 - €60,000 €60,001 - €100,000 More than €100,000
www.communicationmonitor.eu / Zerfass et al. 2013 / n = 970 PR heads of communication. Q 39: In which of the following bands does your basic annual salary fall?
,
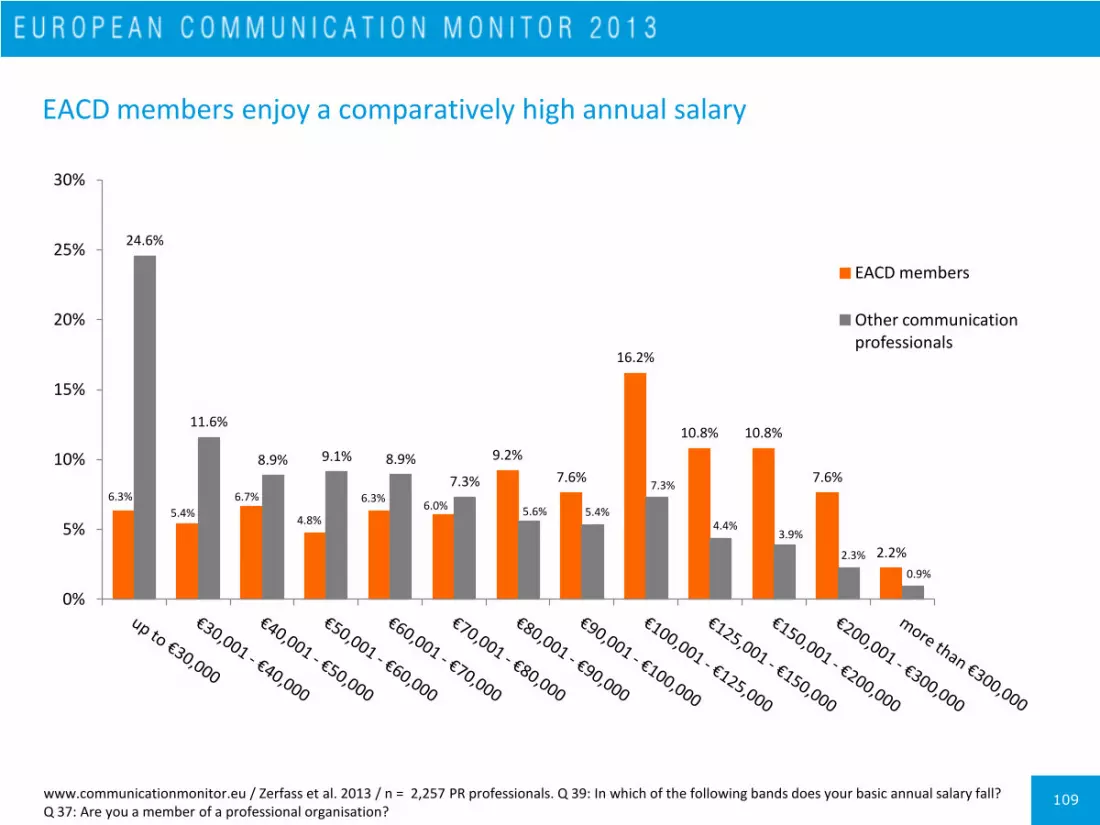
109
EACD members enjoy a comparatively high annual salary
6.3%
5.4%
6.7%
4.8%
6.3% 6.0%
9.2%
7.6%
16.2%
10.8% 10.8%
7.6%
2.2%
24.6%
11.6%
8.9% 9.1% 8.9%
7.3%
5.6% 5.4%
7.3%
4.4% 3.9%
2.3%
0.9%
0%
5%
10%
15%
20%
25%
30%
EACD members
Other communication professionals
www.communicationmonitor.eu / Zerfass et al. 2013 / n = 2,257 PR professionals. Q 39: In which of the following bands does your basic annual salary fall? Q 37: Are you a member of a professional organisation?
Impact of professional associations

111
Professional organisations can help communication professionals to develop their professional identity further and to strengthen the professionalisation of public relations and communication management (Van Ruler & Verčič, 2005; Cornelissen, 2011; Molleda et al., 2010, 2012). Strong national and international associations are considered to be important for this development. The perception of the impact of professional associations for advancing strategic communication is relatively modest. Nearly every third respondent (28.8 per cent) states that the European Association of Communication Directors (EACD) has a high impact on the development of the profession in Europe. 31.8 per cent think that the national professional organisation in the respective country is relevant. A relatively high value in national professional organisations is found in countries like Spain, Croatia, Sweden, Norway, Finland and Austria, where four out of ten professionals report a high or very high impact. A relatively high impact of the EACD is found in Spain, Croatia and Portugal.
Communication professionals with an international outreach and EACD members value this association significantly higher than professionals who do not have such an international dimension to their role or who are not affiliated. From the respondents stating that communicating internationally is important for their organisation, 32.5 per cent think that the impact of the EACD is high, while 46.5 per cent of the members support this view. The figures show that the EACD is more attractive for communication professionals working in international environments, and that any association has to improve its visibility and explain its role in institutionalising strategic communication to those working in the field.
Respondents were asked what they think are important functions of European associations like the EACD. The most important service for members and the profession at large is identifying trends in the field. This dimension, which is supported by studies like the ECM series of surveys, scores top with a mean value (M) of 4.08 on a 5-point scale ranging from not important (1) to very important (5). Other important goals are enhancing the reputation of the practical field (M = 3.96), knowledge transfer via magazines and websites for example (M = 3.88), and information sharing at events and conferences (M = 3.84). International networking opportunities focused on specific topics are valued more important than regional groups. Supporting academic research is rated quite important (M = 3.62), while promoting and honouring best practices with awards is judged the least relevant topic.
Interestingly, the services provided by communication associations are valued differently by professionals on different hierarchical levels in the practice. Practitioners working on a lower level value further education and networking opportunities both internationally and within their home country significantly higher than their superiors. This is true both for the comparison between team members and team leaders and between those team leaders and heads of communication. This result shows that the needs of those working in a young and dynamic profession like strategic communication are quite diverse, and associations might think of offering a differentiated portfolio of services to their membership.
Chapter overview
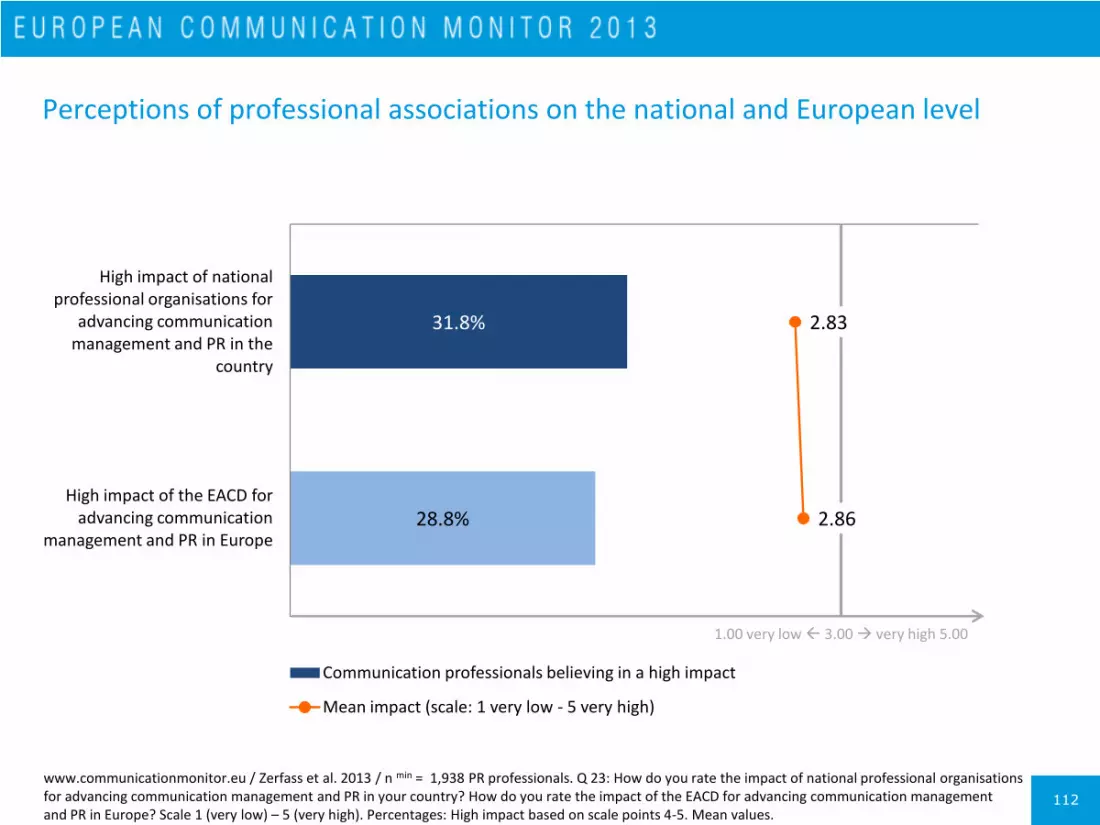
112
Perceptions of professional associations on the national and European level
www.communicationmonitor.eu / Zerfass et al. 2013 / n min = 1,938 PR professionals. Q 23: How do you rate the impact of national professional organisations for advancing communication management and PR in your country? How do you rate the impact of the EACD for advancing communication management and PR in Europe? Scale 1 (very low) – 5 (very high). Percentages: High impact based on scale points 4-5. Mean values.
31.8%
28.8%
2.83
2.86
1.00 1.50 2.00 2.50 3.00 3.50
0.0% 50.0%
High impact of national professional organisations for
advancing communication management and PR in the
country
High impact of the EACD for advancing communication
management and PR in Europe
Communication professionals believing in a high impact
Mean impact (scale: 1 very low - 5 very high)
1.00 very low 3.00 very high 5.00
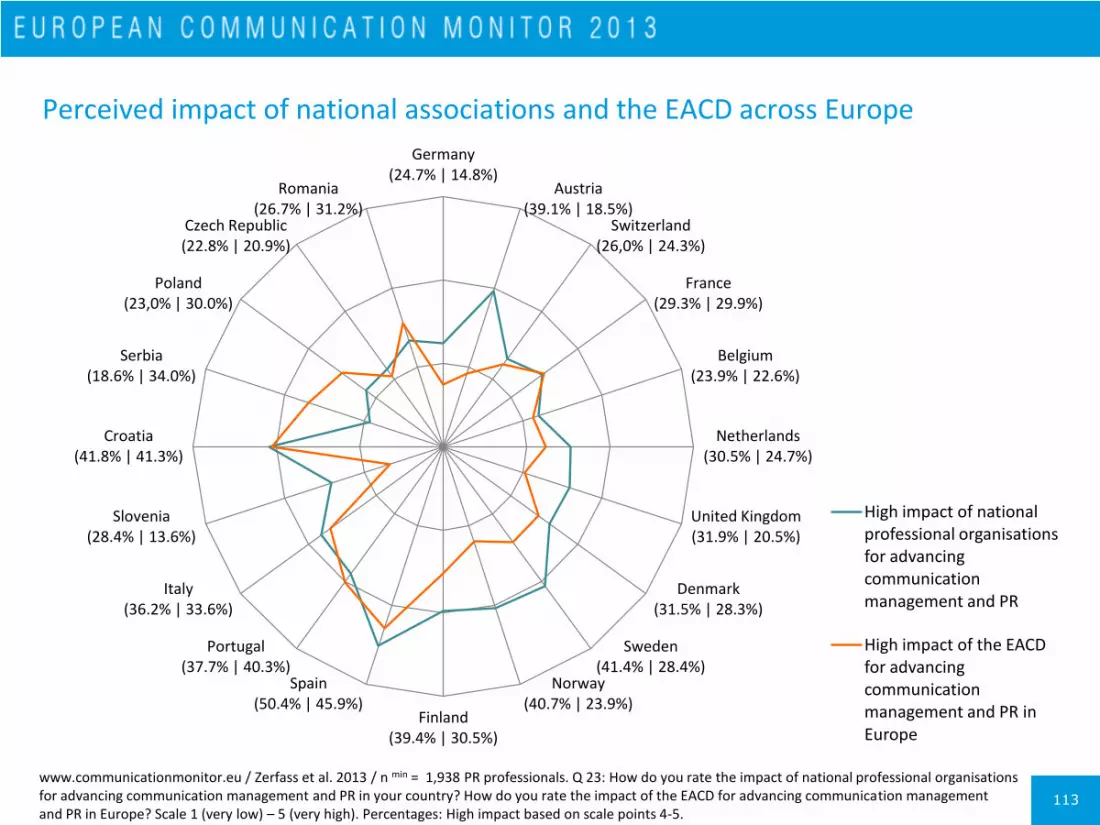
113
Perceived impact of national associations and the EACD across Europe
www.communicationmonitor.eu / Zerfass et al. 2013 / n min = 1,938 PR professionals. Q 23: How do you rate the impact of national professional organisations for advancing communication management and PR in your country? How do you rate the impact of the EACD for advancing communication management and PR in Europe? Scale 1 (very low) – 5 (very high). Percentages: High impact based on scale points 4-5.
Germany (24.7% | 14.8%)
Austria (39.1% | 18.5%)
Switzerland (26,0% | 24.3%)
France (29.3% | 29.9%)
Belgium (23.9% | 22.6%)
Netherlands (30.5% | 24.7%)
United Kingdom (31.9% | 20.5%)
Denmark (31.5% | 28.3%)
Sweden (41.4% | 28.4%)
Norway (40.7% | 23.9%)
Finland (39.4% | 30.5%)
Spain (50.4% | 45.9%)
Portugal (37.7% | 40.3%)
Italy (36.2% | 33.6%)
Slovenia (28.4% | 13.6%)
Croatia (41.8% | 41.3%)
Serbia (18.6% | 34.0%)
Poland (23,0% | 30.0%)
Czech Republic (22.8% | 20.9%)
Romania (26.7% | 31.2%)
High impact of national professional organisations for advancing communication management and PR
High impact of the EACD for advancing communication management and PR in Europe
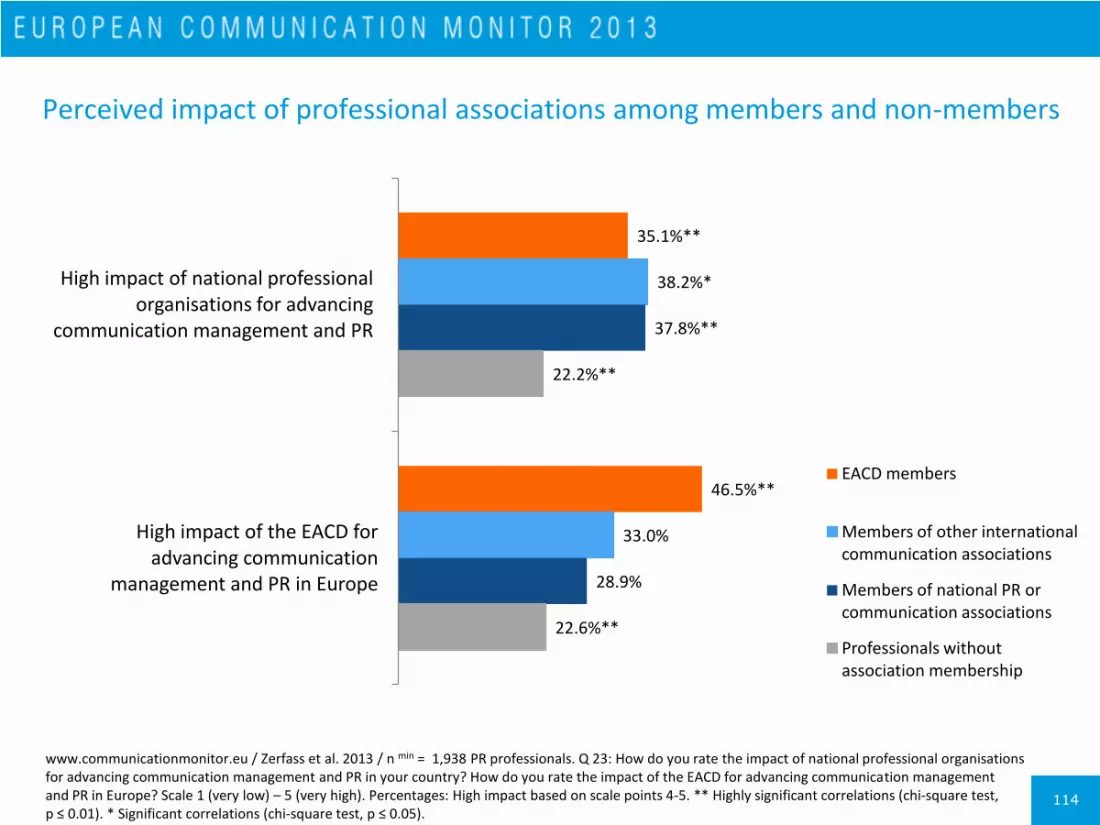
114
Perceived impact of professional associations among members and non-members
www.communicationmonitor.eu / Zerfass et al. 2013 / n min = 1,938 PR professionals. Q 23: How do you rate the impact of national professional organisations for advancing communication management and PR in your country? How do you rate the impact of the EACD for advancing communication management and PR in Europe? Scale 1 (very low) – 5 (very high). Percentages: High impact based on scale points 4-5. ** Highly significant correlations (chi-square test, p ≤ 0.01). * Significant correlations (chi-square test, p ≤ 0.05).
35.1%**
46.5%**
38.2%*
33.0%
37.8%**
28.9%
22.2%**
22.6%**
High impact of national professional organisations for advancing
communication management and PR
High impact of the EACD for advancing communication
management and PR in Europe
EACD members
Members of other international communication associations
Members of national PR or communication associations
Professionals without association membership
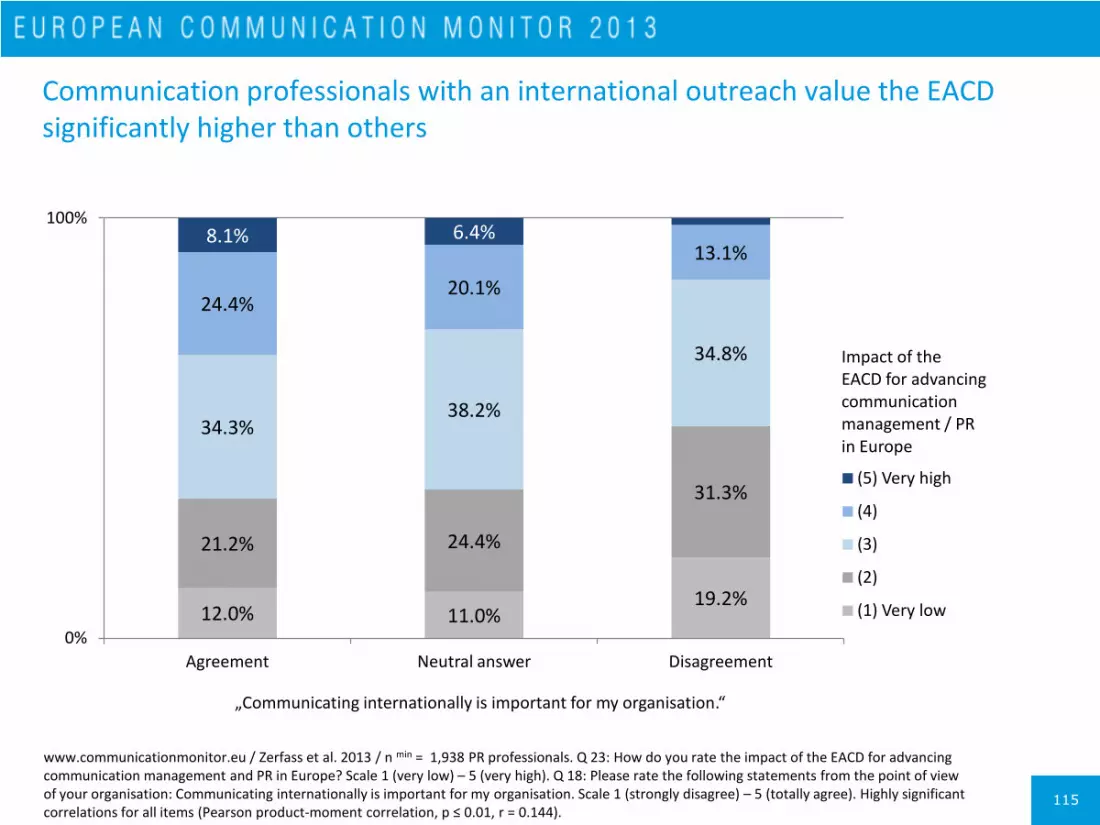
115
Communication professionals with an international outreach value the EACD significantly higher than others
12.0% 11.0% 19.2%
21.2% 24.4%
31.3%
34.3% 38.2%
34.8%
24.4% 20.1%
13.1% 8.1% 6.4%
0%
100%
Agreement Neutral answer Disagreement
„Communicating internationally is important for my organisation.“
Impact of the EACD for advancing communication management / PR in Europe
(5) Very high
(4)
(3)
(2)
(1) Very low
www.communicationmonitor.eu / Zerfass et al. 2013 / n min = 1,938 PR professionals. Q 23: How do you rate the impact of the EACD for advancing communication management and PR in Europe? Scale 1 (very low) – 5 (very high). Q 18: Please rate the following statements from the point of view of your organisation: Communicating internationally is important for my organisation. Scale 1 (strongly disagree) – 5 (totally agree). Highly significant correlations for all items (Pearson product-moment correlation, p ≤ 0.01, r = 0.144).

116
Important functions of European professional organisations like the EACD for developing the profession and serving its members
www.communicationmonitor.eu / Zerfass et al. 2013 / n min = 2,556 PR professionals. Q 24: In your opinion, how important are the following aspects for a European professional association like the EACD for developing the profession and serving its members? Scale 1 (not important) – 5 (very important). Mean values.
3.96
3.67
4.08
3.66
3.76
3.84
3.88
3.80
3.34
3.62
Enhancing the reputation of the profession
Promoting ethical guidelines
Identifying trends in the field
Networking opportunities within my home country (regional groups)
International networking opportunities within my areas of work (working groups)
Information sharing (events, congresses)
Knowledge transfer (magazines, websites)
Further education (training, seminars)
Honouring best practices (awards)
Supporting academic research
5 = very important 4 = important 3 = neutral 2 = less important 1 = not important
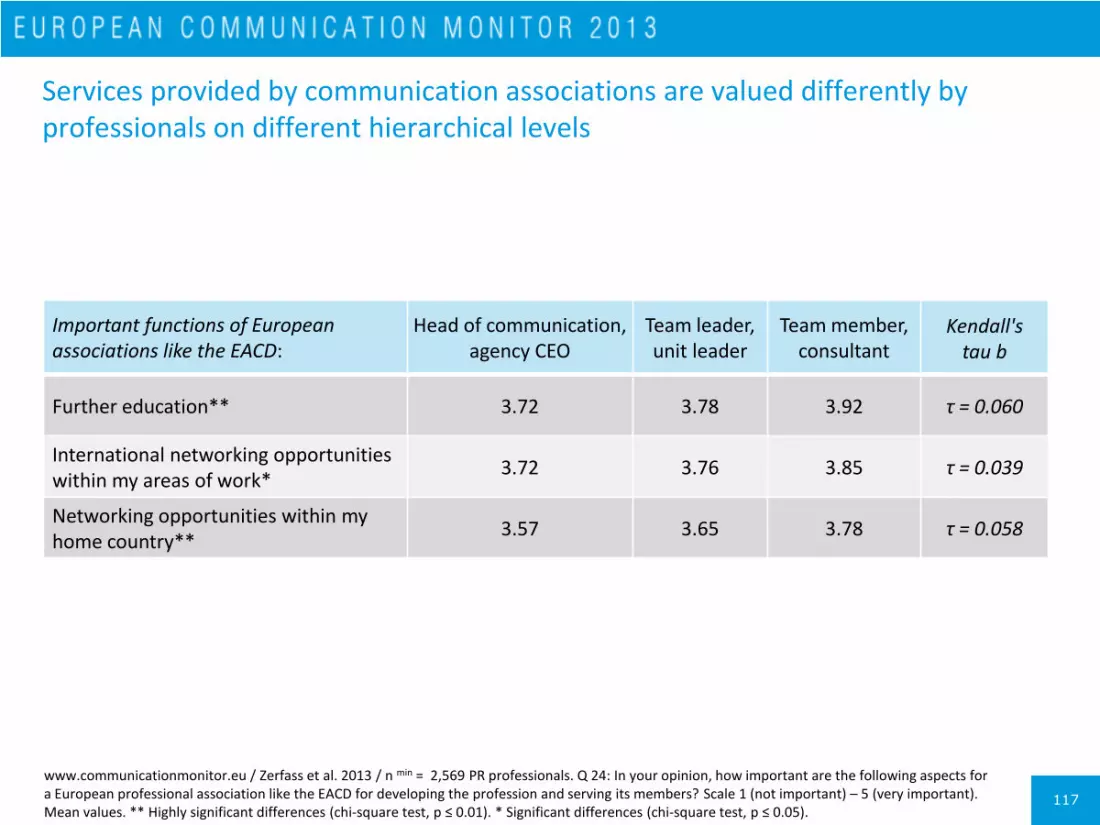
117
Services provided by communication associations are valued differently by professionals on different hierarchical levels
www.communicationmonitor.eu / Zerfass et al. 2013 / n min = 2,569 PR professionals. Q 24: In your opinion, how important are the following aspects for a European professional association like the EACD for developing the profession and serving its members? Scale 1 (not important) – 5 (very important). Mean values. ** Highly significant differences (chi-square test, p ≤ 0.01). * Significant differences (chi-square test, p ≤ 0.05).
Important functions of European associations like the EACD:
Head of communication, agency CEO
Team leader, unit leader
Team member, consultant
Kendall's tau b
Further education** 3.72 3.78 3.92 τ = 0.060
International networking opportunities within my areas of work*
3.72 3.76 3.85 τ = 0.039
Networking opportunities within my home country**
3.57 3.65 3.78 τ = 0.058

118
References
Aarts, N. (2011). Sociale media, hoe mensen daarmee communiceren [Social media, how people use them to communicate]. In D. van Osch & R. van Zijl (Eds.), Basis boek sociale media [Basic book social media] (pp. 45-70). Amsterdam: Boom Lemma.
Bücker, J., & Poutsma, E. (2010). Global management competencies: a theoretical foundation. Journal of Managerial Psychology, 25(8), 829-844.
Coombs, W. T. (2010). Parameters for Crisis Communication. In W. T. Coombs & S. J. Holladay (Eds.), Handbook of Crisis Communication (pp. 17-53). Malden, MA: Blackwell Publishing.
Coombs, W. T. (2012). Ongoing crisis communication: Planning, managing, and responding, 3rd ed. Los Angeles, CA: Sage.
Cornelissen, J. (2011). Corporate communication. A guide to theory and practice, 3rd edition. London: Sage.
Davies, A., Fidler, D., & Gorbis, M. (2011). Future World Skills 2020. Palo Alto, CA: Institute for the Future for University of Phoenix Research Institute.
Davison, W. P. (1983). The third person effect in communication. Public Opinion Quarterly, 47(1), 1-15.
Davison, W. P. (1996). The third-person effect revisited. International Journal of Public Opinion Research, 8(2), 113-119.
DiStaso, M. W., McCorkindale, T., & Wright, D. K. (2011). How public relations executives perceive and measure the impact of social media in their organizations. Public Relations Review, 37(3), 325-328.
Duhé, S. (Ed.) (2012). New Media and Public Relations, 2nd ed. New York: Peter Lang.
Hallahan, K., Holtzhausen, D. R., Van Ruler, B., Verčič, D., & Sriramesh, K. (2007). Defining strategic Communication. International Journal of Strategic Communication, 1(1), 3-35.
Holtzhausen, D. R., & Zerfass, A. (2013). Strategic Communication: Pillars and Perspectives of an Alternative Paradigm. In K. Sriramesh, A. Zerfass & J.-N. Kim (Eds.), Current Trends and Emerging Topics in Public Relations and Communication Management (pp. 283-302). New York: Routledge.
Ihlen, Ø., Bartlett, J., & May, S. (Eds.) (2011). The Handbook of Communication and Corporate Social Responsibility. Chichester: Wiley Blackwell.
Kerkhof, P., Van Noort, G., & Antheunis, M. (2011). Waarom bedrijven sociale media gebruiken [Why companies use social media]. In D. van Osch & R. van Zijl (Eds.), Basis boek sociale media [Basic book social media] (pp. 91-120). Amsterdam: Boom Lemma.
Liebowitz, J. (Ed.) (2013). Big Data and Business Analytics. Boca Raton, FL: CRC Press.

119
References
Meister, J. C., & Willyerd, K. (2010). The 2020 Workplace: How Innovative Companies Attract, Develop, and Keep Tomorrow's Employees Today. New York: Harper Business Books.
Molleda, J. C., Kochhart, S., & Moreno, A. (2012). An Intertwined Future: Exploring the Relationship between the Levels of Professionalism and Social Roles of Public Relations Practitioners. Proceedings of the PRSA Educators Academy, San Francisco, CA, October 2012, 128-145.
Molleda, J. C., Moreno, A., Athaydes, A., & Suárez, A. M. (2010). Macroencuesta latinoamericana de comunicación y relaciones públicas [Latinoamerican Macrosurvey of Communication and Public Relations]. Organicom, 13, 118-141.
Pollach, I., & Kerbler, E. (2012). Appearing Competent. A Study of Impression Management in U.S. and European CEO Profiles. Journal of Business Communication, 48(4), 355-372.
Raines, C. (2003). Connecting Generations: The Sourcebook for a New Workplace. Menlo Park, CA: Crisp Publications.
Sandhu, S. (2009). Strategic communication: an institutional perspective. International Journal of Strategic Communication, 3(2), 72-93.
Seeger, M. W., Sellnow, T. L., & Ulmer, R. R.(2003). Communication and Organizational Crisis. Westport, CT: Praeger.
Sohn, Y. J., & Lariscy, R. (2012). Resource-Based Crisis Management: The Important Role of the CEO's Reputation. Journal of Public Relations Research, 24(4), 318-337.
Tench, R., & Yeomans, L. (2013). Exploring Public Relations, 3rd ed., Harlow, Essex: Pearson Education, Prentice Hall.
Tench, R., Zerfass, A., Verhoeven, P., Verčič, D., Moreno, A., & Okay, A. (2013). Competencies and Role Requirements of Communication Professionals in Europe. Insights from quantitative and qualitative studies. ECOPSI Research Project. Leeds, UK: Leeds Metropolitan University.
United Nations Statistics Division (2013). Composition of macro geographical (continental) regions, geographical sub regions, and selected economic and other groupings (revised 11 February 2013). New York: United Nations. Available at http://unstats.un.org/unsd/methods/m49/m49regin.htm#europe
Van Riel, C. B. M., & Fombrun, C. J. (2007). Essentials of Corporate Communication. Abingdon, New York: Routledge.
Van Ruler, B., & Verčič, D. (2005). Reflective communication management: Future ways for public relations research. Communication Yearbook, 29, 239-273.
120
References
Verčič, D. (2013). Intercultural and multicultural context of public relations. In R. Tench & L. Yeomans (Eds.), Exploring Public Relations, 3rd ed. (pp. 70-82). Harlow, Essex: Pearson Education, Prentice Hall.
Verhoeven, P., Tench, R., & Zerfass, A. (2011). Strategic orientation of communication professionals in Europe. International Journal of Strategic Communication, 5 (2), 95-117.
Zerfass, A. (2008). Corporate Communication Revisited: Integrating Business Strategy and Strategic Communication. In A. Zerfass, B. van Ruler & K. Sriramesh (Eds.), Public Relations Research. European and International Perspectives and Innovations (pp. 65-96). Wiesbaden: VS Verlag für Sozialwissenschaften.
Zerfass, A., & Pleil, T. (Eds.) (2012). Handbuch Online-PR. Strategische Kommunikation in Internet und Social Web [Handbook online public relations. Strategic communication on the internet and social web]. Konstanz: UVK.
Zerfass, A., Moreno, A., Tench, R., Verčič, D., & Verhoeven, P. (2008). European Communication Monitor 2008. Trends in Communication Management and Public Relations – Results and Implications. Brussels, Leipzig: EUPRERA, University of Leipzig.
Zerfass, A., Moreno, A., Tench, R., Verčič, D., & Verhoeven, P. (2009). European Communication Monitor 2009. Trends in Communication Management and Public Relations – Results of a Survey in 34 Countries. Brussels: EACD, EUPRERA.
Zerfass, A., Schwalbach, J., & Sherzada, M. (2013). Unternehmenskommunikation aus der Perspektive des Top-Managements. Eine empirische Studie bei Vorständen und Geschäftsführern in deutschen Großunternehmen [Corporate Communications from the Perspective of Top Management. An Empirical Study among CEOs and Managing Directors of Large-Scale Enterprises in Germany]. Leipzig: University of Leipzig.
Zerfass, A., Tench, R., Verhoeven, P., Verčič, D., & Moreno, A. (2010). European Communication Monitor 2010. Status Quo and Challenges for Public Relations in Europe. Results of an Empirical Survey in 46 Countries. Brussels: EACD, EUPRERA.
Zerfass, A., Van Ruler, B., Rogojinaru, A., Vercic, D., & Hamrefors, S. (2007). European Communication Monitor 2007. Trends in Communication Management and Public Relations – Results and Implications. Leipzig, Brussels: University of Leipzig, EUPRERA.
Zerfass, A., Verčič, D., Verhoeven, P., Moreno, A., & Tench, R. (2012). European Communication Monitor 2012. Challenges and Competencies for Strategic Communication. Results of an Empirical Survey in 42 Countries. Brussels: EACD, EUPRERA.
Zerfass, A., Verhoeven, P., Tench, R., Moreno, A., & Verčič, D. (2011). European Communication Monitor 2011. Empirical Insights into Strategic Communication in Europe. Results of an Empirical Survey in 43 Countries. Brussels: EACD, EUPRERA.
121
Partners
European Public Relations Education and Research Association (EUPRERA)
The European Public Relations Education and Research Association is an autonomous organisation with members from more than 30 countries that aims at stimulating and promoting the knowledge and practice of communication management in Europe. Academic scholars and experienced practitioners work together to advance fundamental and applied research.
www.euprera.org
European Association of Communication Directors (EACD)
The EACD is the leading network for communication professionals across Europe with more than 2,000 members. It brings in-house communication experts together to exchange ideas and discuss the latest trends in international PR. Through Working Groups on specific communications topics and diverse publications, the EACD fosters ongoing professional qualification and promotes the reputation of the profession.
www.eacd-online.eu
Communication Director
Communication Director is a quarterly magazine for Corporate Communications and Public Relations in Europe. It documents opinions on strategic questions in communication, highlights transnational develop-ments and discusses them from a European perspective. The magazine is published by Helios Media, a specialist publishing house based in Berlin and Brussels.
www.communication-director.eu


123
Ketchum
Ketchum is a leading global communications firm with operations in more than 70 countries across six continents. Named 2012 PR Agency of the Year (PRWeek and European Excellence Awards) and the winner of an unprecedented three consecutive PRWeek Campaign of the Year Awards, Ketchum partners with clients to deliver strategic programming, game-changing creative and measurable results that build brands and reputations. Ketchum operates as Ketchum Pleon in Germany, Ketchum Maslov in Russia, Ketchum Sampark in India, and Ketchum Publico in Austria. Ketchum is a part of Diversified Agency Services, a division of Omnicom Group Inc.
www.ketchum.com
Sponsor
124
Prof. Dr. Emanuele Invernizzi | Professor of Corporate Communication IULM University, Milan, Italy. E-Mail: [email protected]
Prof. Dr. Valerie Carayol | Professor of Information and Communication Sciences University of Bordeaux, France. E-Mail: [email protected]
Prof. Dr. Francesco Lurati | Professor of Corporate Communication University of Lugano, Switzerland. E-Mail: [email protected]
Prof. Finn Frandsen | Professor of Corporate Communication Aarhus University, Denmark. E-Mail: [email protected]
Prof. Dr. Øyvind Ihlen | Professor of Journalism University of Oslo, Norway. E-Mail: [email protected]
Prof. Dr. Ryszard Lawniczak | Professor of Economics, International Business and International Public Relations MTU Warsaw & Poznan University of Economics, Poland. E-Mail: [email protected]
Statistical analysis and assistant researchers
Ronny Fechner M.A., University of Leipzig, Germany
Sophia Charlotte Volk B.A., University of Leipzig, Germany
Advisory Board
125
Prof. Dr. Ansgar Zerfass | Professor of Communication Management | Lead researcher University of Leipzig, Germany & BI Norwegian Business School, Norway. E-Mail: [email protected]
Ass. Prof. Dr. Piet Verhoeven | Associate Professor of Communication Science University of Amsterdam, Netherlands. E-Mail: [email protected]
Prof. Ralph Tench, Dr. | Professor of Communication Leeds Metropolitan University, United Kingdom. E-Mail: [email protected]
Prof. Dr. Angeles Moreno | Professor of Public Relations and Communication Management University Rey Juan Carlos, Madrid, Spain. E-Mail: [email protected]
Prof. Dr. Dejan Verčič | Professor of Public Relations University of Ljubljana, Slovenia. E-Mail: [email protected]
Authors & Research Team


128