Embed Size (px)
Citation preview
sustainability
Article
Influence of Income Level and Seasons on Quantityand Composition of Municipal Solid Waste: A CaseStudy of the Capital City of Pakistan
Amina Zia 1,*, Syeda Adila Batool 2, Muhammad Nawaz Chauhdry 1 and Soniya Munir 3
1 College of Earth and Environmental Sciences, University of the Punjab, Lahore 54000, Pakistan;[email protected]
2 Department of Space Science, University of the Punjab, Lahore 54000, Pakistan; [email protected] Lecturer College of Earth and Environmental Sciences, University of the Punjab, Lahore 54000, Pakistan;
[email protected]* Correspondence: [email protected]; Tel.: +92-051-5162-281 or +92-03-006-486-483
Received: 14 June 2017; Accepted: 28 August 2017; Published: 6 September 2017
Abstract: The current study aims to analyze and compare the quantity and composition of municipalsolid waste (MSW) at three socio-economic levels of population during all four seasons of theyear (spring, summer, monsoon and winter). In this study, 2164.75 kg of MSW was evaluated,from 1260 samples collected from 45 households. The average waste generation was estimated to be0.6 kg per capita per day. Waste generation rate for high, middle and low income groups was 0.890,0.612 and 0.346 kg per capita per day, respectively. Nevertheless, season specific analysis indicatedwaste generation rates of 0.78, 0.58, 0.48 and 0.75 kg per capita per day in spring, summer, monsoonand winter, respectively. A two way ANOVA statistical analysis further illustrated a significant effect(p = 0.00) of economic level and seasons on the amount and composition of waste generated by thecommunity. Moreover, the collected waste was segregated into 42 categories, where the highest wasthe organic fraction (57%), then diapers (12%), followed by plastic (8%), cardboard (3%) and paper(2%). The amounts of textile, diapers and plastics were highest in the lowest income group, while tetrapacks, metal, paper and yard waste were maximum in the high income group. It is concluded thatthe high income group generated the highest amount of waste and waste generation rate is higher inthe seasons of spring and winter compared to the other two seasons.
Keywords: integrated waste management; income groups; seasonal influence; generationrate; Islamabad
1. Introduction
The domain of this study comprises urban Islamabad. Islamabad is the capital and the tenthlargest city of Pakistan. The city lies at 33◦38′ N and 73◦07′ E. It has a population of 356,603 [1] and18 developed residential sectors, which are planned in parallel belts. Each sector is 3.1 km2 in area andis a self-contained community unit. The sectors have been named in numbers from east to west and inalphabetic order from north to south. Figure 1 shows the map of the study area. The city was built inthe 1960s to replace Karachi as Pakistan’s capital. It was not developed historically according to site orsituation. It is the only well planned city of Pakistan and therefore different from other cities of thecountry, which are developed historically with downtowns, old city, suburban areas and shantytowns.
Despite being the only well planned city of the country, even after 50 years of establishmentthe city does not have a proper waste disposal system. The total waste generation of Islamabad isapproximately 500–600 tons per day (200,750 tons per year) [1–3]. Sixty percent of the waste is collectedby Capital Development Authority (CDA) and the rest is contracted out to private contractors [2].
Sustainability 2017, 9, 1568; doi:10.3390/su9091568 www.mdpi.com/journal/sustainability

Sustainability 2017, 9, 1568 2 of 13
The authority spends over Rs 300 million ($2.8 million) every year taking care of the capital’s waste,but there is neither a waste sorting and segregation system nor a proper waste disposal site.
The waste disposal practice that is being carried out in Islamabad is open dumping without anygas collection or leachate control system to protect surface and ground water resources [3]. The currentdumping site, i.e., I-12, is situated in a residential area and is adjacent to a big government hospital,which is not suitability as a waste disposal site. As the population of the capital is increasing, so too isthe MSW, resulting in the increase of the problem of proper waste disposal.
Managing this ever increasing waste in a sustainable and socially acceptable manner has becomea problem for authorities [2,4,5]. Untreated waste imposes an economic cost for residents of the area,and is also an environmental hazard. Proper waste management is very important for the health andcomfort of residents [6–10].
Sustainability 2017, 9, 1568 2 of 13
contractors [2]. The authority spends over Rs 300 million ($2.8 million) every year taking care of the capital’s waste, but there is neither a waste sorting and segregation system nor a proper waste disposal site.
The waste disposal practice that is being carried out in Islamabad is open dumping without any gas collection or leachate control system to protect surface and ground water resources [3]. The current dumping site, i.e., I-12, is situated in a residential area and is adjacent to a big government hospital, which is not suitability as a waste disposal site. As the population of the capital is increasing, so too is the MSW, resulting in the increase of the problem of proper waste disposal.
Managing this ever increasing waste in a sustainable and socially acceptable manner has become a problem for authorities [2,4,5]. Untreated waste imposes an economic cost for residents of the area, and is also an environmental hazard. Proper waste management is very important for the health and comfort of residents [6–10].
Figure 1. Map of the Study Area (Islamabad).
Contemporary waste management literature/research and best practices suggest that shifting to a more environmentally friendly and sustainable waste management option requires an optimal combination of various management options such as recycling, composting, gasification, pyrolysis and incineration with energy recovery, instead of single waste management method [11–15]. Thus, integrated solid waste management is the only answer to successful MSW treatment and disposal [11,14,16,17]. If the waste management approach is established using authentic data, and is implemented properly, it will be a great breakthrough in reducing air, water and soil pollution caused by improper disposal of solid waste [16,18,19]. Unfortunately, proper management of waste is mostly not possible because authentic data about waste generate rate, composition and the factors affecting both, are not always available [20,21]. If available, these waste characterization studies can be further used as a baseline to generate an optimal waste management plan [6,13,20–22] using life cycle assessment (LCA) approach [23–26]. The importance of waste characterization for the establishment of waste management program is also emphasized by following studies [20,27–37].
To identify a sustainable integrated waste management approach for Islamabad that is socially and environmentally acceptable and economically viable, a waste characterization practice is necessary to determine the generation rate, composition and the factors affecting the municipal solid waste (MSW) which is the aim of this paper.
Although many similar studies have been conducted around in Pakistan and around the globe [16,19,36,38–41], none have been conducted in Islamabad. The findings of this study can be used as
Figure 1. Map of the Study Area (Islamabad).
Contemporary waste management literature/research and best practices suggest that shiftingto a more environmentally friendly and sustainable waste management option requires an optimalcombination of various management options such as recycling, composting, gasification, pyrolysisand incineration with energy recovery, instead of single waste management method [11–15].Thus, integrated solid waste management is the only answer to successful MSW treatment anddisposal [11,14,16,17]. If the waste management approach is established using authentic data, and isimplemented properly, it will be a great breakthrough in reducing air, water and soil pollutioncaused by improper disposal of solid waste [16,18,19]. Unfortunately, proper management of waste ismostly not possible because authentic data about waste generate rate, composition and the factorsaffecting both, are not always available [20,21]. If available, these waste characterization studies can befurther used as a baseline to generate an optimal waste management plan [6,13,20–22] using life cycleassessment (LCA) approach [23–26]. The importance of waste characterization for the establishment ofwaste management program is also emphasized by following studies [20,27–37].
To identify a sustainable integrated waste management approach for Islamabad that is sociallyand environmentally acceptable and economically viable, a waste characterization practice is necessaryto determine the generation rate, composition and the factors affecting the municipal solid waste(MSW) which is the aim of this paper.
Although many similar studies have been conducted around in Pakistan and around theglobe [16,19,36,38–41], none have been conducted in Islamabad. The findings of this study can be

Sustainability 2017, 9, 1568 3 of 13
used as baseline for developing an ideal waste management plan in Islamabad using LCA as well asevaluating the environmental burdens of the current SWM practice.
The study was conducted during four different seasons of the year at three socio-economic groupsof population to identify any seasonal as well as social differences in waste generation, because it isestablished from research that the waste composition and its generation rate largely depend upon thepopulation size and their living standards [33,34,39,42].
2. Methodology
In this study, sampling was conducted daily for one week each during the months of January,March, May and August 2012, representing four different seasons [22,43,44] of the year, i.e., winter(low temperature), spring (changing temperature), summer (high temperature) and monsoon (rainyseason, average annual rainfall 790.8 millimeter) (based on data from Pakistan MeteorologicalDepartment) [45], at three socioeconomic groups of population. During these sampling periods,to avoid any discrepancy, all the generated household waste was collected from the houses directly.
The process [46] used to characterize the household waste has following steps:
(1) Categorizing the population in socio-economic group(2) Sample Collection(3) Classifying and quantifying the fractions(4) Data Analysis.
2.1. Categorizing the Population in Socio-Economic Groups
As mentioned above, Islamabad has 18 developed residential sectors, and a population of356,603 residents. The administrative sectors are numbered as G-5 and F-5, which contain diplomaticenclave, administrative and public buildings. The residential sectors are numbered from 6 to 17(G, F and I), aligned on both sides of the leading civil and commercial centers called Blue Area.Three income level groups, i.e., high (Monthly income more than 30 million Rupees (S2865)), middle[Monthly income more than 10 million Rupees ($955 US)] and low income group (Monthly income upto 10 million Rupees ($955 US)) were classified on the basis of monthly income of the family, propertyvalue and plot sizes of the area (EPA, 1996).
The classification into three socio-economic groups is done based on field survey, social surveyand personal communication with the property dealers in the area, during the reconnaissancevisits. However, this criterion for economic class ranking is very different from other cities of thecountry, where monthly income of high, middle and low income groups is much lower than inIslamabad. i.e., high [Monthly income more than 60,000 Rupees ($700)], middle [Monthly income20,000 Rupees ($250 US)] and low income group (Monthly income up to 10,000 Rupees ($115)) [16,47].The demographic information of the 18 residential sectors is displayed in Table 1.
Table 1. Demographic information of study area.
Sr. No Socioeconomic Group Sectors in Each Group Population Households Studied
1 High Income Group E-7, 8, 9121,527 15F5, 6, 7, 8, 10, 11, 12 and I-8
2 Middle Income Group G-7, 8, 9, 10,11 172,093 15
3 Low Income Group I-10 and I-9 62,983 15
Total 18 sectors 356,603 45
2.2. Sample Collection
The sample collection method in this study was mainly the one used by Gomez et al [4] and alsosupported by California Integrated Waste Management Board (CIWMB) [48].

Sustainability 2017, 9, 1568 4 of 13
This procedure involved:
(1) Survey of households(2) Collection of samples(3) Transportation of samples(4) Segregation of samples(5) Quantification of components of waste.
The homeowners of designated neighborhoods were requested to contribute in the wasteclassification process. It was ensured that, during all four sampling seasons, the same houses wereincluded in the program. In each neighborhood, 15 houses [48,49] were approached randomly. The ladyof each household was requested to make sure that all generated waste was collected and handedover to us. The waste produced was collected every day of the week and stored in polythene bags.Each sample was labeled with the house and sector number. Every morning, the old bag was replacedby a new empty bag. After collection, the waste was transported in closed vehicle to a designatedplace, where it was segregated and weighed instantly.
It was assured that the waste was collected directly from houses so that no item is removed bythe sweepers or the scavengers to be sold, and the waste collected is truly representative of the area.
2.3. Classifying and Quantifying the Fractions
All waste collected in a day was then emptied on plastic sheets, weighed separately according tothe income groups and then segregated according to its composition. Overall, the entire waste wasclassified into forty-two categories [50]. After sorting the waste, all fractions were weighed separatelyusing a balance. The same routine was followed for the next six days. The same process of classifyingand weighing was repeated for all the three socio-economic groups of population and for all the fourseasons of the year.
2.4. Data Analysis
Data were statistically analyzed using a two way Analysis of Variance (ANOVA). The ANOVAis used to compare means of two or more variables using F-distribution. This parametric test willauthenticate the results by measuring the effect of socioeconomic levels and seasonal variation inthe solid waste generation rate, i.e., significant or non-significant. IBM SPSS. 22 was run to obtainthe results.
The moisture content of the MSW was also measured by heating the samples in an oven for 24 hat 105 ◦C.
3. Results
During the entire study period (2012–2013), 1260 samples were collected, weighing 2164.75 kgfrom 45 houses for one full week in all the four seasons of the year.
The amount of different components of waste was represented as weighted average values.Table 2 shows the results in kg per capita per day for every component of collected waste fromevery income group throughout the four seasons of the year 2012. The weighted average waste inIslamabad was calculated to be 0.603 kg per capita per day during this study (including 0.890, 0.612and 0.346 kg per capita per day for high, middle and low income groups, respectively). The wastegeneration rates in the seasons of spring, summer, monsoon and winter were 0.78, 0.58, 0.48 and0.75 kg per capita per day, respectively, during the study period. These figures represent the totalwaste collected from the households; it does not include the reused material at household level (sourceseparation). In comparison to other developing countries, this waste generation rate is higher, owingto the economic status of the city of Islamabad, which is more similar to developed countries ratherthan developing countries.

Sustainability 2017, 9, 1568 5 of 13
Table 2. Seasonal generation rate of waste fractions at middle, high and low income groups (kg/capita/day).
Waste ComponentsHigh Income Group Middle Income Group Low Income Group
Spring Summer Monson Winter Weighted Spring Summer Monson Winter Weighted Spring Summer Monson Winter Weighted
Organic Waste Vegetable Food Waste 0.845 0.459 0.260 0.524 0.495 0.311 0.374 0.338 0.429 0.376 0.192 0.197 0.183 0.163 0.183Yard Waste, Flowers 0.093 0.040 0.040 0.056 0.052 0.009 0.004 0.008 0.003 0.005 0.005 0.000 0.000 0.006 0.003
Animal Food Waste(bones) 0.000 0.000 0.000 0.007 0.002 0.000 0.000 0.000 0.000 0.000 0.000 0.000 0.000 0.000 0.000News print 0.047 0.030 0.024 0.022 0.029 0.014 0.003 0.004 0.011 0.007 0.005 0.005 0.007 0.007 0.006Magazines 0.009 0.009 0.004 0.002 0.006 0.000 0.000 0.000 0.000 0.000 0.000 0.000 0.000 0.000 0.000
Advertisements 0.000 0.000 0.000 0.000 0.000 0.003 0.000 0.000 0.002 0.001 0.000 0.000 0.000 0.000 0.000Books, Phone Books 0.014 0.001 0.000 0.000 0.002 0.002 0.000 0.000 0.007 0.002 0.002 0.000 0.001 0.002 0.001
Office paper 0.000 0.000 0.000 0.003 0.001 0.000 0.000 0.000 0.000 0.000 0.000 0.000 0.000 0.000 0.000
Paper Other Clean Paper 0.008 0.001 0.002 0.011 0.005 0.001 0.006 0.000 0.000 0.002 0.001 0.000 0.002 0.004 0.002Paper And Card Board 0.070 0.015 0.019 0.037 0.030 0.012 0.009 0.022 0.026 0.017 0.011 0.005 0.013 0.016 0.011
Kitchen Towels 0.010 0.004 0.000 0.000 0.003 0.000 0.000 0.000 0.002 0.001 0.000 0.000 0.000 0.000 0.000Dirty Paper (Tissue) 0.015 0.000 0.006 0.020 0.010 0.001 0.000 0.001 0.004 0.002 0.002 0.000 0.000 0.005 0.002
Dirty Cardboard 0.004 0.000 0.000 0.000 0.001 0.000 0.000 0.000 0.000 0.000 0.000 0.002 0.004 0.003 0.002Cigarette Butts 0.000 0.000 0.000 0.000 0.000 0.002 0.000 0.000 0.000 0.000 0.000 0.000 0.000 0.000 0.000
Other Clean Card Board 0.000 0.014 0.000 0.000 0.005 0.000 0.004 0.000 0.003 0.002 0.000 0.000 0.000 0.000 0.000
Tetra pack Tetra Packs 0.062 0.034 0.018 0.044 0.038 0.011 0.012 0.020 0.020 0.016 0.009 0.008 0.011 0.012 0.010Juice Carton (Carton/Plastic/Aluminum) 0.000 0.000 0.000 0.001 0.000 0.000 0.000 0.000 0.000 0.000 0.000 0.000 0.000 0.000 0.000
Soft Plastic (Polythene. Gloves, Disposable Plates) 0.050 0.031 0.013 0.033 0.031 0.017 0.009 0.015 0.023 0.016 0.011 0.007 0.010 0.023 0.013Plastic Bottles 0.037 0.007 0.002 0.006 0.010 0.004 0.001 0.006 0.014 0.007 0.003 0.005 0.002 0.003 0.004
Plastic Hard Plastics (Plates) 0.001 0.001 0.002 0.001 0.001 0.003 0.001 0.004 0.003 0.003 0.000 0.001 0.001 0.004 0.002Non Recyclable Plastic 0.011 0.014 0.003 0.008 0.009 0.011 0.002 0.002 0.011 0.006 0.006 0.002 0.004 0.007 0.005
Plastic Products (Toys, Hangers, Pens, Empty Tubes) 0.006 0.017 0.008 0.015 0.013 0.016 0.018 0.019 0.012 0.016 0.001 0.003 0.005 0.011 0.006
Diapers Diapers 0.131 0.026 0.042 0.051 0.052 0.058 0.064 0.060 0.078 0.067 0.062 0.055 0.038 0.112 0.071
Textile Textile 0.015 0.005 0.005 0.027 0.013 0.031 0.006 0.018 0.002 0.010 0.004 0.003 0.010 0.011 0.007Disposal Sanitary Clothes 0.000 0.000 0.000 0.002 0.001 0.003 0.001 0.000 0.004 0.002 0.000 0.003 0.002 0.005 0.003
Others Wood 0.007 0.002 0.000 0.000 0.002 0.000 0.000 0.000 0.000 0.000 0.000 0.000 0.001 0.000 0.000Shoes, Leather 0.013 0.006 0.000 0.000 0.004 0.000 0.012 0.000 0.008 0.007 0.001 0.002 0.003 0.000 0.001
Rubber 0.000 0.000 0.002 0.010 0.004 0.000 0.000 0.000 0.000 0.000 0.001 0.000 0.001 0.001 0.001
Glass Clear Glass 0.013 0.023 0.008 0.016 0.017 0.012 0.002 0.010 0.016 0.010 0.003 0.006 0.000 0.004 0.004Green Glass 0.000 0.000 0.002 0.000 0.000 0.000 0.000 0.000 0.000 0.000 0.000 0.001 0.000 0.000 0.000Brown Glass 0.031 0.003 0.006 0.000 0.007 0.009 0.006 0.001 0.016 0.008 0.006 0.001 0.004 0.004 0.003
Non-Recyclable Glass 0.000 0.000 0.000 0.000 0.000 0.007 0.001 0.000 0.000 0.001 0.001 0.000 0.000 0.000 0.000
Metals Beverage Cans 0.013 0.000 0.000 0.000 0.002 0.000 0.000 0.002 0.000 0.000 0.000 0.000 0.000 0.000 0.000Aluminum Foil And Container 0.007 0.000 0.000 0.010 0.004 0.000 0.000 0.000 0.002 0.001 0.000 0.000 0.000 0.000 0.000
Food Cans (Tinplates/Steel) 0.015 0.004 0.004 0.000 0.004 0.000 0.002 0.002 0.008 0.003 0.000 0.000 0.000 0.000 0.000Plastic-Coated Aluminum Foil 0.000 0.000 0.001 0.011 0.003 0.002 0.005 0.004 0.000 0.003 0.000 0.000 0.003 0.000 0.001
Other Metals 0.007 0.015 0.001 0.011 0.010 0.000 0.002 0.007 0.004 0.003 0.000 0.000 0.000 0.001 0.000
OtherNon-Combustibles Soil 0.023 0.000 0.000 0.000 0.003 0.003 0.000 0.002 0.002 0.001 0.002 0.000 0.000 0.000 0.000
Stones, Concrete 0.018 0.000 0.000 0.000 0.003 0.000 0.000 0.000 0.000 0.000 0.000 0.000 0.000 0.000 0.000Ash, Coal 0.000 0.000 0.000 0.000 0.000 0.000 0.000 0.000 0.000 0.000 0.000 0.000 0.000 0.000 0.000Ceramics 0.029 0.004 0.000 0.003 0.006 0.010 0.004 0.006 0.015 0.009 0.005 0.003 0.001 0.007 0.004Batteries 0.007 0.004 0.002 0.003 0.004 0.000 0.000 0.000 0.000 0.000 0.000 0.000 0.000 0.000 0.000
Other Non-Combustibles 0.003 0.009 0.001 0.015 0.008 0.007 0.002 0.016 0.009 0.007 0.000 0.000 0.000 0.005 0.002
Total Total 1.608 0.776 0.475 0.949 0.890 0.556 0.550 0.568 0.733 0.612 0.335 0.310 0.306 0.416 0.346

Sustainability 2017, 9, 1568 6 of 13
Comparative analysis of generation and composition of collected waste with other historicallydeveloped metropolis of Pakistan, e.g., Lahore (more than 2000 years old), indicated little differencein overall generation rate (0.7 kg per capita per day of Lahore compared to 0.6 kg/capita/day ofIslamabad) and characteristic of waste, but, by income group, the difference was very prominent(0.96, 0.73 and 0.67 kg per capita per day for high, middle and low income groups, respectively).The major reason for this difference is more organic fraction in the waste of Lahore comparedto Islamabad, because, in Islamabad, the trend is using more processed food compared to freshvegetables [16,47].
In Table 3, the moisture content of the MSW is provided during four seasons of the year and in allthree income groups. It indicated no effect of income groups on moisture content but slight differenceduring the seasons, with lowest moisture percentage in spring. The knowledge of moisture content isvery significant in planning proper integrated waste management.
Table 3. Moisture content of MSW of Islamabad over the year.
Seasons of the YearMoisture Content Percentage
High Income Group Middle Income Group Low Income Group
Spring 72.3 72.4 71.63Summer 90.59 89.09 90.77
Rainy season 88 88 88.8Winter 92.95 78.5 74.99
Average 85.96 81.9975 81.5475
4. Discussion
4.1. Socio-Economic Influence on the Composition and Generation Rate of Waste
Figure 2 shows the comparison of the amounts of different fractions of waste from threesocio-economic groups during four seasons of the year in Islamabad. As indicated in the Table 1, it isclear that, in Islamabad, the low income group has the lowest average annual waste generation, whilemaximum waste is generated in the high income group as compared to the other two income groups.
Sustainability 2017, 9, 1568 7 of 13
Comparative analysis of generation and composition of collected waste with other historically developed metropolis of Pakistan, e.g., Lahore (more than 2000 years old), indicated little difference in overall generation rate (0.7 kg per capita per day of Lahore compared to 0.6 kg/capita/day of Islamabad) and characteristic of waste, but, by income group, the difference was very prominent (0.96, 0.73 and 0.67 kg per capita per day for high, middle and low income groups, respectively). The major reason for this difference is more organic fraction in the waste of Lahore compared to Islamabad, because, in Islamabad, the trend is using more processed food compared to fresh vegetables [16,47].
In Table 3, the moisture content of the MSW is provided during four seasons of the year and in all three income groups. It indicated no effect of income groups on moisture content but slight difference during the seasons, with lowest moisture percentage in spring. The knowledge of moisture content is very significant in planning proper integrated waste management.
Table 3. Moisture content of MSW of Islamabad over the year.
Seasons of the Year Moisture Content Percentage
High Income Group Middle Income Group Low Income GroupSpring 72.3 72.4 71.63
Summer 90.59 89.09 90.77 Rainy season 88 88 88.8
Winter 92.95 78.5 74.99 Average 85.96 81.9975 81.5475
4. Discussion
4.1. Socio-Economic Influence on the Composition and Generation Rate of Waste
Figure 2 shows the comparison of the amounts of different fractions of waste from three socio-economic groups during four seasons of the year in Islamabad. As indicated in the Table 1, it is clear that, in Islamabad, the low income group has the lowest average annual waste generation, while maximum waste is generated in the high income group as compared to the other two income groups.
Figure 2. Quantitative comparison of waste fractions from three socio-economic groups during four seasons of the year in Islamabad.
Figure 2. Quantitative comparison of waste fractions from three socio-economic groups during fourseasons of the year in Islamabad.
Sustainability 2017, 9, 1568 7 of 13
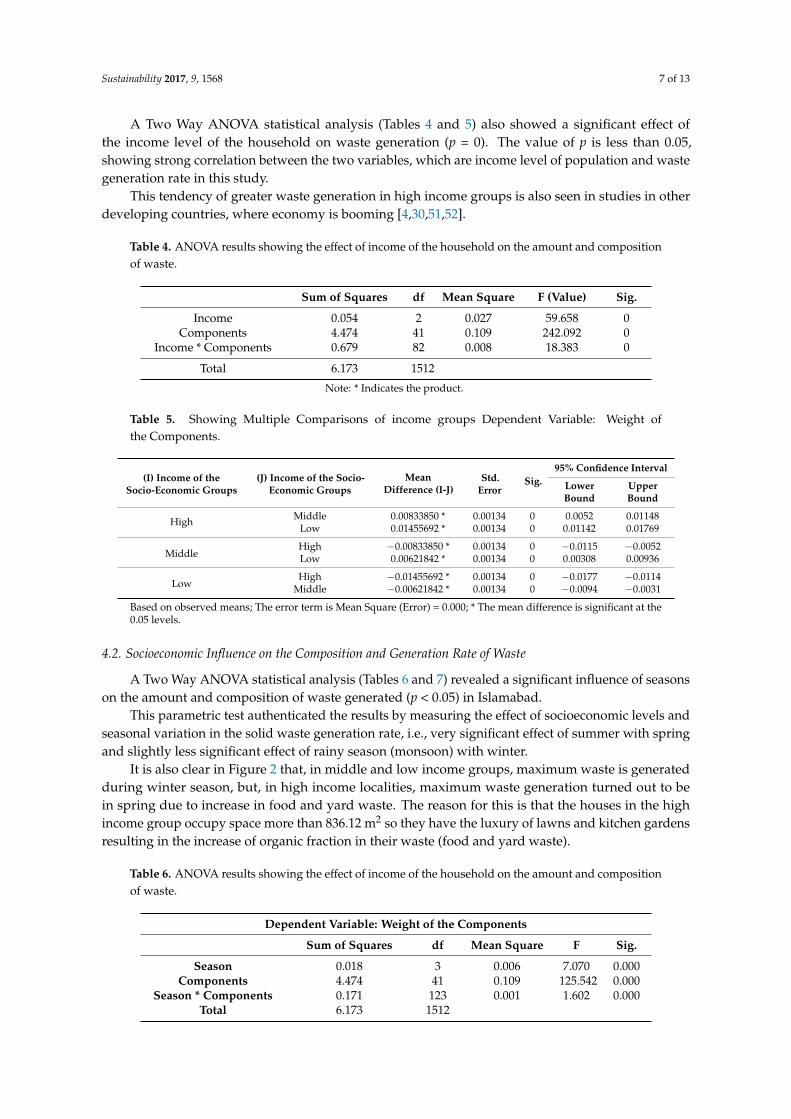
A Two Way ANOVA statistical analysis (Tables 4 and 5) also showed a significant effect ofthe income level of the household on waste generation (p = 0). The value of p is less than 0.05,showing strong correlation between the two variables, which are income level of population and wastegeneration rate in this study.
This tendency of greater waste generation in high income groups is also seen in studies in otherdeveloping countries, where economy is booming [4,30,51,52].
Table 4. ANOVA results showing the effect of income of the household on the amount and compositionof waste.
Sum of Squares df Mean Square F (Value) Sig.
Income 0.054 2 0.027 59.658 0Components 4.474 41 0.109 242.092 0
Income * Components 0.679 82 0.008 18.383 0
Total 6.173 1512
Note: * Indicates the product.
Table 5. Showing Multiple Comparisons of income groups Dependent Variable: Weight ofthe Components.
(I) Income of theSocio-Economic Groups
(J) Income of the Socio-Economic Groups
MeanDifference (I-J)
Std.Error
Sig.95% Confidence Interval
LowerBound
UpperBound
High Middle 0.00833850 * 0.00134 0 0.0052 0.01148Low 0.01455692 * 0.00134 0 0.01142 0.01769
MiddleHigh −0.00833850 * 0.00134 0 −0.0115 −0.0052Low 0.00621842 * 0.00134 0 0.00308 0.00936
LowHigh −0.01455692 * 0.00134 0 −0.0177 −0.0114
Middle −0.00621842 * 0.00134 0 −0.0094 −0.0031
Based on observed means; The error term is Mean Square (Error) = 0.000; * The mean difference is significant at the0.05 levels.
4.2. Socioeconomic Influence on the Composition and Generation Rate of Waste
A Two Way ANOVA statistical analysis (Tables 6 and 7) revealed a significant influence of seasonson the amount and composition of waste generated (p < 0.05) in Islamabad.
This parametric test authenticated the results by measuring the effect of socioeconomic levels andseasonal variation in the solid waste generation rate, i.e., very significant effect of summer with springand slightly less significant effect of rainy season (monsoon) with winter.
It is also clear in Figure 2 that, in middle and low income groups, maximum waste is generatedduring winter season, but, in high income localities, maximum waste generation turned out to bein spring due to increase in food and yard waste. The reason for this is that the houses in the highincome group occupy space more than 836.12 m2 so they have the luxury of lawns and kitchen gardensresulting in the increase of organic fraction in their waste (food and yard waste).
Table 6. ANOVA results showing the effect of income of the household on the amount and compositionof waste.
Dependent Variable: Weight of the Components
Sum of Squares df Mean Square F Sig.
Season 0.018 3 0.006 7.070 0.000Components 4.474 41 0.109 125.542 0.000
Season * Components 0.171 123 0.001 1.602 0.000Total 6.173 1512

Sustainability 2017, 9, 1568 8 of 13
Table 7. Multiple comparisons of four seasons (dependent variable: weight of the components).
(I) Season of the Year (J) Season of the Year MeanDifference (I-J) Std. Error Sig.
95% Confidence Interval
LowerBound
UpperBound
SpringSummer 0.00687789 * 0.0021444 0.007 0.0013618 0.0123939Monsoon 0.00913399 * 0.0021444 0 0.0036179 0.01465
Winter 0.0031782 0.0021444 0.449 −0.002338 0.0086943
SummerSpring −0.00687789 * 0.0021444 0.007 −0.012394 −0.001362
Monsoon 0.0022561 0.0021444 0.719 -0.00326 0.0077722Winter −0.0037 0.0021444 0.311 −0.009216 0.0018164
MonsoonSpring −0.00913399 * 0.0021444 0 −0.01465 −0.003618
Summer −0.002256 0.0021444 0.719 −0.007772 0.00326Winter −0.00595574 * 0.0021444 0.028 −0.011472 −0.00044
WinterSpring -0.003178 0.0021444 0.449 −0.008694 0.0023378
Summer 0.0036997 0.0021444 0.311 −0.001816 0.0092157Monsoon 0.00595574 * 0.0021444 0.028 0.0004397 0.0114718
Note: * Indicates the product.
It was also inferred from the results that the maximum amount of waste in all incomegroups during all season is food waste. This trend of food waste being the major fraction isalso apparent in other metropolises of the country such as Lahore as well as in many otherdeveloping countries [6,21,53,54]. However, since developed countries mostly use processed packedfood, this trend is not necessarily followed in developed countries [24,38,55,56]. The presence of higherpercentage of food waste indicates that the waste of Islamabad has a high potential for compostingor bio-gasification.
Paper and Cardboard fraction was calculated to be highest in high income group followed bymiddle and then low income group. The reason would be that the households with higher incomecan afford more products packed in cardboard containers (processed and ready to eat food products,toys, electric equipment, crockery, etc.) than the ones with low income.
In all three income groups, generation rate of PET is highest in the months of monsoon. The reasonfor this trend is the high temperatures and more humidity in these months, which ultimately lead toincreased use of drinks in plastic containers (juices, water, flavored drinks, etc.).
Tetra packs are used mostly for milk products, tea whiteners and juices. The generation rate oftetra packs is higher in summer due to high temperature, thus use of more fruit juices, etc. and again,there is an increase viewed in these products in winter because of the use of more milk products for teaand coffee. However, overall, the low income group has the lowest amount of this waste productiondue to their low purchasing power and their tendency of buying milk from the milk-man rather thanbuying pasteurized or UHT treated (and expensive) tetra pack milk.
This study indicates significant generation of diapers in all seasons, showing that the use ofdisposable diapers has increased a lot in the past few years. As opposed to the other related study inLahore this fraction was discovered to be more in low income group as compared to the two otherincome groups. The reason is that the people of high and middle income groups are more consciousabout the kind of waste they gave us compared to the low income group who considered giving usall of their waste a way to escape paying the waste collection fee to the sweepers for the period ofthe study.
Textile and shoe fractions were found to be least in high income areas because these items aregenerally given away to maids, etc., while middle and low income families, who do not have theluxury of housemaids, reuse clothes as much as they can and throw them in waste when they cannotbe used any further. The same trend was observed in other cities [19,40,57].
Fraction of glass in the waste was found highest in the middle income group, the reason being lowpurchasing power: low income households cannot buy expensive drinks packed in glass containers.Seasonal variation in glass generation rate is negligible.

Sustainability 2017, 9, 1568 9 of 13
Generation of metals (ferrous and nonferrous metals such as beverage tin cans, aluminum foodcontainers, etc.) was directly related to the economic level of the population. It was maximum in thehigh income area and the amount of metal found in the lowest income group was negligible becauseof their low purchasing power for tinned food as well as because they sell the metal to hawkers andearn money from their waste. Metal fraction was found to be more abundant in waste during springand winter as compared to the other two seasons.
Higher concentration of paper glass and textile in high income group is in accordance with otherwaste characterization studies [57,58] of the country.
As plastic utensils are cheaper than glass or ceramic ones, they are more within the purchasingpower of the lowest income group than the other two income groups. Thus, the lowest income grouphas higher generation rate of plastic than middle income group, while high income group generatesthe least amount of plastic as waste fraction. This trend is unique compared the findings in similarstudy in Lahore [40]. Moreover, more of this fraction was collected in winter and spring than in theother two seasons. Table 8 shows the comparison of Islamabad waste composition of Islamabad withsimilar studies in Lahore.
Table 8. Showing comparison of Islamabad waste composition with similar studies in Lahore.
Sr. No Waste Fractions IslamabadCity
Gulberg Town(Lahore) [56]
Aziz Bhatti Town(Lahore) [57]
DGB Town(Lahore) [16]
% % % %1 Paper 7.26 4.13 6.38 5.042 Glass 2.79 4.1 2.3 2.193 Ferrous Metals 0.64 - 0.7 0.024 Nonferrous Metals 1.04 0.4 0.4 0.475 Rigid Plastic 3.11 4.11 1.9 5.556 Film Plastic 4.38 4.22 5 12.947 Organic 59.95 68.07 63.8 67.028 Textile 1.81 4.19 0.4 19 Others 19.2 10.78 19.12 5.77
10 Total 100.18 100 100 100
Waste electrical and electronic equipment (WEEE) and furniture were not part of the study becausein Islamabad these items are given away by the high income group or in case of other two incomegroups are sold to the junkyards, where they are dismantled and sold in parts.
In the absence of a proper waste separation system, almost all of these waste categories endup in open dumps on the dumping site, where they become a source of health and environmentalproblems. For example, due to the absence of proper landfills, the leachate from organic waste iscontaminating the ground water. This can be easily avoided by separating this fraction to makecompost. Much revenue can be generated by recycling paper, plastic and glass, which would also helpreduce resource depletion [58]. Emission of greenhouse gases from dumping site would consequentlydecrease [3], although the high percentages of moisture in MSW would need to be catered first.
5. Conclusions
In this study, municipal solid waste was collected from three different localities of Islamabad withdifferent socio economic structure during four seasons of the year (spring, summer, monsoon andwinter of 2012) to better understand economic as well as seasonal effect on the generation rate andcomposition of waste in the city. This waste was then categorized in 42 categories.
For this study, 2164.75 kg of MSW was evaluated, from 1260 samples collected from 45 householdsduring four seasons of the year. As a result of this study, the waste generation rate of Islamabad wascalculated to be 0.6 kg/capita/day.

Sustainability 2017, 9, 1568 10 of 13
The results indicate that standard of living and waste generation in Islamabad are directlyrelated, i.e., high income group has the highest waste generation rate and low income group hasthe lowest. The waste generation rates of high, middle and low income groups were 0.89, 0.612 and0.346 kg/capita/day, respectively, during the study period.
As far as seasonal influence was concerned, it was observed that waste generation in the summerand monsoon was lower compared to higher amounts of waste generated during the seasons ofspring and winter. Moreover, the seasonal influence was more profound on the food and yard wastethan on the other fractions of waste. The waste generation rates in the seasons of spring, summer,monsoon and winter were 0.78, 0.58, 0.48 and 0.75 kg/capita/day. Respectively, during the studyperiod. Comparison with other national and international studies confirmed the influence of seasonsand income groups on generation rate and characteristics of waste. Statistical analysis also indicatedstrong relation of waste to different seasons and socioeconomic structure in the study area.
Higher percentage of recyclables (plastic and paper) and organic waste in the municipalwaste stream of Islamabad makes recycling and composting an encouraging prospect to reducethe environmental burdens of open dumping as well as offsetting the cost of solid waste managementby reducing the quantity of the waste to handle as well as by selling of compost and recycled products.
The results of this study can be used by planners, recycling industries and decision makers asreliable baseline data source for the establishment of an effective integrated waste management planfor the city of Islamabad.
Acknowledgments: This research did not receive any specific grant from funding agencies in the public,commercial or non-profit-sectors.
Author Contributions: The research was planned and designed by Syeda Adilla Batool. Research was performedby Amina Zia, including sample collection, sorting, weighing and further drying of samples for future analysis.The data were statistically analyzed with the help of Soniya Munir. Result interpretation and drafting ofpaper was a joint work of Muhammad Nawaz Chauhdry and Amina Zia, followed by critical revision byMuhammad Nawaz Chauhdry. All authors have critically read and approved the final manuscript.
Conflicts of Interest: The authors declare no conflict of interest.
References
1. Statistics Division of the Government of Pakistan (Statistics Department). Population and Housing Census,Islamabad City Report; Government of Pakistan: Islamabad, Pakistan, 1998.
2. CERES Associate Gulf UAE. Improvement of Environment by Solid Waste Management in Islamabad,Pakistan. 2006, pp. 3–6. Available online: http://projectpi.pk/services/solid-waste-management/ (accessedon 3 September 2017).
3. Ali, S.M.; Pervaiz, A.; Afzal, B.; Hamid, N.; Yasmin, A. Open dumping of municipal solid waste and itshazardous impacts on soil and vegetation diversity at waste dumping sites of Islamabad city. J. King SaudUniv. Sci. 2014, 26, 59–65. [CrossRef]
4. Gomez, G.; Meneses, M.; Ballinas, L.; Castells, F. Characterization of urban solid waste in Chihuahua, Mexico.Waste Manag. 2008, 28, 2465–2471. [CrossRef] [PubMed]
5. Al-Khatib, I.A.; Kontogianni, S.; Abu Nabaa, H.; Alshami, N.M.; Al-Sari’, M.I. Public perception ofhazardousness caused by current trends of municipal solid waste management. Waste Manag. 2015, 36,323–330. [CrossRef] [PubMed]
6. World Bank. What a Waste: Solid Waste Management in Asia Urban Waste Management; World Bank: Washington,DC, USA, 1999.
7. Misra, V.; Pandey, S.D. Hazardous waste, impact on health and environment for development of better wastemanagement strategies in future in India. Environ. Int. 2005, 31, 417–431. [CrossRef] [PubMed]
8. Ripa, M.; Fiorentino, G.; Vacca, V.; Ulgiati, S. The relevance of site-specific data in life cycle assessment (lca).The case of the municipal solid waste management in the metropolitan city of Naples (Italy). J. Clean. Prod.2017, 142 Pt 1, 445–460. [CrossRef]

Sustainability 2017, 9, 1568 11 of 13
9. Yıldız-Geyhan, E.; Yılan-Çiftçi, G.; Altun-Çiftçioglu, G.A.; Neset Kadırgan, M.A. Environmental analysis ofdifferent packaging waste collection systems for Istanbul—Turkey case study. Resour. Conserv. Recycl. 2016,107, 27–37. [CrossRef]
10. Aparcana, S. Approaches to formalization of the informal waste sector into municipal solid wastemanagement systems in low- and middle-income countries: Review of barriers and success factors.Waste Manag. 2017, 61, 593–607. [CrossRef] [PubMed]
11. McDougall, F.; White, P.; Franke, M.; Hindle, P. Integrated Solid Waste Management: A Life Cycle Inventory, 2nd ed.;Blackwell Science Ltd.: Hoboken, NJ, USA, 2001.
12. Nabavi-Pelesaraei, A.; Bayat, R.; Hosseinzadeh-Bandbafha, H.; Afrasyabi, H.; Chau, K.-W. Modeling ofenergy consumption and environmental life cycle assessment for incineration and landfill systems ofmunicipal solid waste management—A case study in Tehran metropolis of Iran. J. Clean. Prod. 2017, 148,427–440. [CrossRef]
13. Chifari, R.; Lo Piano, S.; Bukkens, S.G.F.; Giampietro, M. A holistic framework for the integrated assessmentof urban waste management systems. Ecol. Indic. 2016. [CrossRef]
14. Marshall, R.E.; Farahbakhsh, K. Systems approaches to integrated solid waste management in developingcountries. Waste Manag. 2013, 33. [CrossRef] [PubMed]
15. Othman, S.N.; Zainon Noor, Z.; Abba, A.H.; Yusuf, R.O.; Abu Hassan, M.A. Review on life cycle assessmentof integrated solid waste management in some asian countries. J. Clean. Prod. 2013, 41, 251–262. [CrossRef]
16. Batool, S.A.; Ch, M.N. Municipal solid waste management in Lahore city district, Pakistan. Waste Manag.2009, 29, 1971–1981. [CrossRef] [PubMed]
17. Hu, D.; Wang, R.; Yan, J.; Xu, C.; Wang, Y. A pilot ecological engineering project for municipal solid wastereduction, disinfection, regeneration and industrialization in Guanghan City, China. Ecol. Eng. 1998, 11,129–138. [CrossRef]
18. Zhao, W.; Huppes, G.; van der Voet, E. Eco-efficiency for greenhouse gas emissions mitigation of municipalsolid waste management: A case study of Tianjin, China. Waste Manag. 2011, 31, 1407–1415. [CrossRef][PubMed]
19. Jadoon, A.Z.; Batool, S.A.; Chaudhry, M.N. Assessment of factors affecting household solid waste generationand its composition in Gulberg town, Lahore, Pakistan. Mater. Cycles Waste Manag. 2013, 16, 73–81.[CrossRef]
20. Guerrero, L.A.; Maas, G.; Hogland, W. Solid waste management challenges for cities in developing countries.Waste Manag. 2013, 33, 220–232. [CrossRef] [PubMed]
21. Bing, X.; Bloemhof, J.M.; Ramos, T.R.P.; Barbosa-Povoa, A.P.; Wong, C.Y.; van der Vorst, J.G.A.J. Researchchallenges in municipal solid waste logistics management. Waste Manag. 2016, 48, 584–592. [CrossRef][PubMed]
22. United States Environmental Protection Agency. Solid Waste and Emergency Response; United StatesEnvironmental Protection Agency: Washington, DC, USA, 2002.
23. Qi, C.; Ma, X.; Wang, M.; Ye, L.; Yang, Y.; Hong, J. A case study on the life cycle assessment of recyclingindustrial mercury-containing waste. J. Clean. Prod. 2017, 161, 382–389. [CrossRef]
24. Erses Yay, A.S. Application of life cycle assessment (lca) for municipal solid waste management: A casestudy of sakarya. J. Clean. Prod. 2015, 94, 284–293. [CrossRef]
25. Ayodele, T.R.; Ogunjuyigbe, A.S.O.; Alao, M.A. Life cycle assessment of waste-to-energy (wte) technologiesfor electricity generation using municipal solid waste in nigeria. Appl. Energy 2017, 201, 200–218. [CrossRef]
26. De Felice, F.; Campagiorni, F.; Petrillo, A. Economic and environmental evaluation via an integrated methodbased on lca and mcda. Procedia Soc. Behav. Sci. 2013, 99, 1–10. [CrossRef]
27. Parizeau, K.; Maclaren, V.; Chanthy, L. Waste characterization as an element of waste management planning:Lessons learned from a study in Siem Reap, Cambodia. Resour. Conserv. Recycl. 2006, 49, 110–128. [CrossRef]
28. Ojeda, B.; Amp, X.; Tez, S.; Beraud-Lozano, J.L. The municipal solid waste cycle in Mexico: Final disposal.Resour. Conserv. Recycl. 2003, 39, 239–250.
29. Escarimosa, L.F.G.; Castaneda, G.; Quintal, C.A. Household Waste Management in the City of Tuxtla GutierreChiapas; Plaza y Valdez Editores Mexico: Mexico City, Mexico, 2001.
30. Buenrostro, O.; Bocco, G. Solid waste management in municipalities in Mexico: Goals and perspectives.Resour. Conserv. Recycl. 2003, 39, 251–263. [CrossRef]

Sustainability 2017, 9, 1568 12 of 13
31. Bernache-Perez, G.; Sánchez-Colón, S.; Garmendia, A.M.; Dávila-Villarreal, A.; Sánchez-Salazar, M.E. Solidwaste characterization study in the Guadalajara Metropolitan zone, Mexico. Waste Manag. Res. 2001, 19,413–424. [CrossRef] [PubMed]
32. Zsigraiová, Z.; Tavares, G.; Semiao, V.; Carvalho, M.D.G. Integrated waste-to-energy conversion and wastetransportation within island communities. Energy 2009, 34, 623–635. [CrossRef]
33. Von Schoenberg, A. Waste disposal in east Germany—An overview. Waemer Bull. 1990, 19, 4–5.34. Denison, R.A. Environmental life-cycle comparisons of recycling, land filling and incineration. A review of
recent studies. Annu. Rev. Energy Environ. 1996, 21, 191–237. [CrossRef]35. Qu, X.-Y.; Li, Z.-S.; Xie, X.-Y.; Sui, Y.-M.; Yang, L.; Chen, Y. Survey of composition and generation rate of
household wastes in Beijing, China. Waste Manag. 2009, 29, 2618–2624. [CrossRef] [PubMed]36. Denafas, G.; Ruzgas, T.; Martuzevicius, D.; Shmarin, S.; Hoffmann, M.; Mykhaylenko, V.; Ogorodnik, S.;
Romanov, M.; Neguliaeva, E.; Chusov, A.; et al. Seasonal variation of municipal solid waste generation andcomposition in four east European cities. Resour. Conserv. Recycl. 2014, 89, 22–30. [CrossRef]
37. Feng, T.-T.; Yang, Y.-S.; Xie, S.-Y.; Dong, J.; Ding, L. Economic drivers of greenhouse gas emissions in China.Renew. Sustain. Energy Rev. 2017, 78, 996–1006. [CrossRef]
38. Feniel Phillip, A.C. Household solid waste generation and characteristics in cape Haitian city, Republic ofHaiti. Resour. Conserv. Recycl. 2009, 54, 73–78. [CrossRef]
39. Gómez, G.; Meneses, M.; Ballinas, L.; Castells, F. Seasonal characterization of urban solid waste in Chihuahua,Mexico. Waste Manag. 2009, 29, 2018–2024. [CrossRef] [PubMed]
40. Kamran, A.; Chaudhry, M.N.; Batool, S.A. Effects of socio-economic status and seasonal variation onmunicipal solid waste composition: A baseline study for future planning and development. Environ. Sci. Eur.2015, 27. [CrossRef]
41. Al-Jarallah, R.; Aleisa, E. A baseline study characterizing the municipal solid waste in the state of Kuwait.Waste Manag. 2014, 34, 952–960. [CrossRef] [PubMed]
42. Bandara, N.J.; Hettiaratchi, J.P.; Wirasinghe, S.C.; Pilapiiya, S. Relation to waste generation and compositionto socio-economic factors: A case study. Environ. Monit. Assess. 2007, 135, 31–39. [CrossRef] [PubMed]
43. ASTM International. Standards Test Method for Determination of the Composition of Unprocessed Municipal SolidWaste; ASTM D5231-92; ASTM International: West Conshohocken, PA, USA, 2016.
44. Ontario Waste Diversion Organization (OWDO). Residential Curbside Waste Audit Guide, Ontario WasteDiversion Organizational Behavior and Human Decision Processes; Ontario Waste Diversion Organization:North York, ON, Canada, 2002; p. 9.
45. Tchobanoglous, G.; Kreith, F. Handbook of Solid Waste Management, 2nd ed.; McGraw-Hill Book Company:New York, NY, USA, 2002.
46. World Health Organization (WHO). Procedure for Solid Waste Generation Survey; World Health Organization:Geneva, Switzerland, 1996.
47. California Integrated Waste Management Board (CIWMB); Centre for Integrated Water and BasinManagement. Conducting a Diversion Study: A Guide for Local Jurisdictions; California Department of ResourcesRecycling and Recovery: Sacramento, CA, USA, 1998.
48. Riber, C.; Petersen, C.; Christensen, T.H. Chemical composition of material fractions in danish householdwaste. Waste Manag. 2009, 29, 1251–1257. [CrossRef] [PubMed]
49. Qdais, H.A.A.; Hamoda, M.F.; Newham, J. Analysis of residential solid waste at generation sites.Waste Manag. Res. 1997, 15, 395–406. [CrossRef]
50. Zeng, Y.; Trauth, K.M.; Peyton, R.L.; Banerji, S. Characterization of solid waste disposed at Columbia sanitarylandfill in Missouri. Waste Manag. Res. 2005, 23, 62–71. [CrossRef] [PubMed]
51. Sadef, Y.; Nizami, A.; Batool, S.; Chaudary, M.; Ouda, O.; Asam, Z.; Habib, K.; Rehan, M.; Demirbas, A.Waste-to-energy and recycling value for developing integrated solid waste management plan in Lahore.Energy Sources Part B Econ. Plan. Policy 2016, 11, 569–579. [CrossRef]
52. Organization for Economic Cooperation and Development (OECD). Environmental Data Compendium;Organization for Economic Cooperation and Development: Paris, France, 1997.
53. Janssen, A.M.; Nijenhuis-de Vries, M.A.; Boer, E.P.J.; Kremer, S. Fresh, frozen, or ambient food equivalentsand their impact on food waste generation in dutch households. Waste Manag. 2017, 67, 298–307. [CrossRef][PubMed]

Sustainability 2017, 9, 1568 13 of 13
54. Nabegu, A.B. An analysis of municipal solid waste in Kano Metropolis, Nigeria. J. Hum. Ecol. 2010, 31,111–119.
55. Majeed, A.; Batool, S.A.; Chaudhry, M.N. Informal waste management in the developing world: Economiccontribution through integration with the formal sector. Waste Biomass Valoriz. 2017, 8, 679–694. [CrossRef]
56. Hussain, F.; Chaudhry, M.N.; Batool, S.A. Assessment of key parameters in municipal solid wastemanagement: A prerequisite for sustainability. Int. J. Sustain. Dev. World Ecol. 2014, 21, 519–525. [CrossRef]
57. Seng, B.; Hirayama, K.; Katayama-Hirayama, K.; Ochiai, S.; Kaneko, H. Scenario analysis of the benefitof municipal organic-waste composting over landfill, Cambodia. J. Environ. Manag. 2013, 114, 216–224.[CrossRef] [PubMed]
58. Manahil Estate. Lay Out Map of Islamabad; Manahil Estate: Islamabad, Pakistan, 2017. Available online:https://i1.wp.com/manahilestate.com/wp-content/uploads/2014/02/islamabad_sectors.jpg (accessedon 3 September 2017).
© 2017 by the authors. Licensee MDPI, Basel, Switzerland. This article is an open accessarticle distributed under the terms and conditions of the Creative Commons Attribution(CC BY) license (http://creativecommons.org/licenses/by/4.0/).