Embed Size (px)
Citation preview
This is a peer-reviewed, post-print (final draft post-refereeing) version of the following publisheddocument, This is a non-final version of an article published in final form in Jeffreys, Mark, De Ste Croix, Mark B , Lloyd, Rhodri S, Oliver, Jon L and Hughes, Jonathan (2017) The effect of varying plyometric volume on stretch-shortening cycle capability in collegiate male rugby players. Journal of Strength and Conditioning Research, 33 (1). pp. 139-145. and is licensed under Creative Commons: Attribution-Noncommercial 4.0 license:
Jeffreys, Mark, De Ste Croix, Mark B ORCID: 0000-0001-9911-4355, Lloyd, Rhodri S, Oliver, Jon L and Hughes, Jonathan ORCID: 0000-0002-9905-8055 (2019) The effect of varying plyometric volume on stretch-shortening cycle capability in collegiate male rugby players. Journal of Strength and Conditioning Research, 33 (1). pp. 139-145. doi:10.1519/JSC.0000000000001907
Official URL: https://journals.lww.com/nsca-jscr/Fulltext/2019/01000/The_Effect_of_Varying_Plyometric_Volume_on.15.aspxDOI: http://dx.doi.org/10.1519/JSC.0000000000001907EPrint URI: http://eprints.glos.ac.uk/id/eprint/4509
Disclaimer
The University of Gloucestershire has obtained warranties from all depositors as to their title in the material deposited and as to their right to deposit such material.
The University of Gloucestershire makes no representation or warranties of commercial utility, title, or fitness for a particular purpose or any other warranty, express or implied in respect of any material deposited.
The University of Gloucestershire makes no representation that the use of the materials will notinfringe any patent, copyright, trademark or other property or proprietary rights.
The University of Gloucestershire accepts no liability for any infringement of intellectual property rights in any material deposited but will remove such material from public view pending investigation in the event of an allegation of any such infringement.
PLEASE SCROLL DOWN FOR TEXT.
Plyometric training volume 1
The effect of varying plyometric volume on stretch-shortening cycle capability in 1
collegiate male rugby players 2
Running Title: Plyometric training volume 3
MARK JEFFREYS1, MARK B. A. DE STE CROIX
1, RHODRI S. LLOYD
2, JON L. 4
OLIVER 2
, JONATHAN D. HUGHES1
5
1.
Exercise and Sport Research Centre, University of Gloucestershire, United Kingdom 6
2. School of Sport, Cardiff Metropolitan University, United Kingdom 7
8
CORRESPONDENCE 9
Name: Jonathan Hughes 10
Address: Exercise and Sport Research Centre 11
School of Sport and Exercise, 12
University of Gloucestershire 13
Oxstalls Campus, Oxstalls Lane 14
Gloucester, GL2 9HW 15
United Kingdom 16
Email: [email protected] Tel: +44 1242 715165 17
18
No sources of external funding were received for this work. 19
20
Plyometric training volume 2
ABSTRACT 1
The purpose of this study was to identify the effectiveness of low and high volume 2
plyometric loads on developing stretch shortening cycle capability in collegiate rugby 3
players. A between- group repeated measures design was used. Thirty six subjects (age 20.3 4
±1.6 yrs, mass 91.63 ±10.36kg, stature 182.03 ±5.24cm) were randomly assigned to one of 5
three groups, a control group (CG), a low volume plyometric group (LPG) or a high volume 6
plyometric group (HPG). Data were collected from a force plate, and measures of reactive 7
strength index (RSI) and leg stiffness were calculated from jump height, contact time and 8
flight time. A significant between group × time (F = 4.01, P <0.05) interaction effect for RSI 9
was observed. Bonferroni post hoc analysis indicated that both the LPG training group (P = 10
0.002) and HPG training group (P = 0.009) were significantly higher than the control group. 11
No significant interaction effect between time × group were observed for leg stiffness (F = 12
1.39, P = 0.25). The current study has demonstrated that it is possible to improve reactive 13
strength capabilities via the use of a low volume plyometric program. The low volume 14
program elicited the same performance improvement in RSI as a high volume program whilst 15
undertaking a lower dose. This suggests that strength and conditioning coaches may be able 16
to benefit from the ability to develop more time efficient and effective plyometric programs. 17
Keywords: training, reactive strength, leg stiffness 18
19
20
21
22
23
24
25
Plyometric training volume 3
INTRODUCTION 1
The stretch-shortening cycle (SSC) is a naturally occurring muscle function whereby a 2
muscle is stretched and this is immediately followed by a concentric action of the same 3
muscle. The SSC can be found in common movements such as running, jumping and 4
hopping. When a concentric action of the muscle immediately follows an eccentric action, 5
then the concentric action is more powerful than when the shortening action occurs on its 6
own (10, 23). Efficient SSC movements can not only result in a more powerful propulsive 7
force, but can also lead to energy conservation and an athlete can reduce the metabolic costs 8
of such a movement (29). 9
It is clear that the increased propulsive force and reduction of metabolic costs would be 10
advantageous when training for sports performance. One of the most common modalities for 11
training the SSC is via the use of plyometrics (9) relying on powerful, quick movements 12
which utilize the SSC (27). Plyometric exercises enable a muscle to attain maximal external 13
force in a very short time, (2) and utilize the increased power developed by the SSC (4). 14
Literature has demonstrated that plyometric training can be used to improve agility, running 15
economy and power output (10, 11), as well as strength, coordination and possible reduction 16
of injuries (7). 17
There are a number of methods to determine SSC function using field based measures. 18
Rebound jump testing can provide information on the reactive strength index (RSI) and leg 19
stiffness. RSI represents maximal activities requiring the utilization of the SSC actions (21), 20
and is calculated by dividing the height jumped by the time spent in contact with the ground 21
when developing force (9). Leg stiffness is the most common representation of SSC muscle 22
action as it represents the spring-mass model that characterizes the biomechanical properties 23
of whole-body SSC actions (22), particularly during rapid movements such as decelerations 24
and change of direction experienced during field based running sports (24, 25, 26). 25
Plyometric training volume 4
It has been demonstrated that one of the physiological properties to be altered following 1
plyometric training is musculotendinous stiffness (5). Although this benefit has been 2
demonstrated to be due to plyometric training, there are a number of factors that may affect 3
the success of a plyometrics program, including age, gender and training history (7). Saez de 4
Villareal et al. (7) also point out that research studies have differed in terms of duration, 5
volume and intensity within their studies and as such there is still a lack of clarity as to the 6
optimal levels and combinations of these factors to achieve maximum performance. 7
It has been shown that both low and moderate plyometric training frequencies (420 and 840 8
total jumps) produced greater jumping and sprinting gains than a high frequency (1680 total 9
jumps) of plyometric training program (8). Further, a meta-analysis of 56 plyometric studies, 10
which included training programs of more than 10 weeks consisting of more than 20 sessions 11
with more than 50 jumps per session were evidenced to maximize the probability of obtaining 12
significantly greater improvements in performance (7). 13
It has been identified that strength and conditioning coaches working with rugby football 14
players face two main challenges: Firstly, to provide appropriate metabolic conditioning in 15
the most time-efficient manner; secondly, to develop and maintain high levels of strength and 16
power while athletes are concurrently performing high volumes of metabolic training and 17
team practices (12). It is therefore important that training programs are designed to be as time 18
efficient as possible. The purpose of this study was to determine the effects of low and high 19
volume plyometric programs on improvements in reactive strength and leg stiffness. It is 20
suggested that if low plyometric volumes are as effective as high volume plyometric 21
programs then this will be more time efficient and therefore very beneficial to the strength 22
and conditioning coach. Therefore, the aim of the proposed study is to identify whether 23
similar performance benefits are gained from a low volume plyometric program and a high 24
volume plyometric program for rugby populations. It was hypothesized that both the low and 25
Plyometric training volume 5
high plyometric training programs would improve subjects’ SSC muscle actions, with the 1
magnitude of change in RSI and leg stiffness being similar between the two training groups. 2
METHODS 3
Experimental Approach to the Problem 4
The experiment was carried out utilizing a between- group, repeated measures design to 5
examine the effect of different plyometric volumes on measures of SSC in collegiate rugby 6
players. The subjects were randomly assigned to one of three groups, a control group (CG), a 7
low volume plyometric group (LPG) and a high volume plyometric group (HPG). Data were 8
collected from a force plate, and measures of RSI and leg stiffness were calculated from jump 9
height, contact time and flight time data. The estimation of sample size for the study was 10
calculated using data collected from an initial pilot study. 10 male subjects (age 20.4 ± 0.8yr; 11
stature 1.86 ± 0.09m and body mass 86.3 ± 15.2kg) took part in the reliability study. Subjects 12
undertook testing during two separate sessions (test – retest) which were held one week apart 13
to ascertain the reliability of the force plate measuring RSI: 14
15
RSI CV – 6.1% 16
17
Where CV refers to the coefficient of variation, and SWC refers to the smallest worthwhile 18
change. The smallest worthwhile change was calculated as a factor of 0.2 of the between-19
subject standard deviation (15). 20
21
Sample size = 8*(CV2/SWC
2) 22
According to the data, the calculated group size was seven subjects per group. 23
24
Subjects 25
Plyometric training volume 6
Thirty six male collegiate rugby union players aged 20.3 ± 1.6 yrs, body mass 91.63 ± 10.36 1
kg, stature 1.82 ± 0.05 m, with 1- 2 years history of plyometric training, volunteered to 2
participate in the study. The subjects were randomly assigned to one of three groups, a 3
control group (CG), a low volume plyometric group (LPG), or a high volume plyometric 4
group (HPG). Subjects were counterbalanced within each group, to ensure equal splits of 5
forwards and backs. Subjects were required to attend at least 80% of the training sessions in 6
order to be included in the final analysis of the study. Following the completion of the 7
training program, 29 subjects qualified for inclusion for the final analysis from the three 8
different groups: LPG (n = 10), HPG (n = 9) and control (n = 10). None of the subjects 9
reported an injury at the time of testing. The project received ethical approval by the 10
University’s Research Ethics committee, and subjects completed both a subject consent and 11
physical activity readiness questionnaire (PARQ) which were obtained prior to testing. 12
Subject confidentiality was upheld with any information and data being kept in accordance 13
with the Data Protection Act (1998), and subject anonymity was maintained at all times. 14
Subject identification was only known by the principal researcher and the supervisory team. 15
Procedures 16
Subjects attended two familiarisation sessions prior to the initial testing procedure. These 17
sessions took place two weeks prior to the testing at the same time and place that the testing 18
occurred. The familiarisation sessions included all techniques that would be used during the 19
testing sessions. Subjects were also allowed practice attempts at all techniques as part of the 20
warm up immediately prior to testing. Throughout the familiarisation, subjects were 21
encouraged to minimize contact with the ground and maximize height. Testing was 22
completed at the same time on each of the testing days at the same indoor venue. Testing was 23
carried out by the same tester. All subjects were asked to refrain from eating, drinking or 24
taking part in any physical activity for up to one hour before testing. All subjects were also 25
Plyometric training volume 7
asked to wear the same footwear and clothing for all testing and training sessions. Testing 1
included drop jumps from 30cm, 45cm, and 60cm along with two footed hopping. 2
3
All jump tests were performed on a 900 mm x 600 mm force platform (type 9287BA, Kistler 4
Instrumente AG, Winterthur, Switzerland) fitted with an integrated charge amplifier. All 5
output data was automatically captured on a PC, at a smapling rate of 1000Hz and saved in 6
the Bioware software package) (Bioware® V.3.2.6). For all jump tests, subjects were 7
encouraged to jump as high as possible, whilst minimising ground contact time. Three trials 8
of each drop jump were performed during the testing sessions, with the best score being used 9
for data analysis (3). For the repeated jumps, 10 jumps were completed and the middle 6 were 10
recorded and used for analysis. 11
12
Reactive Strength Index: 13
RSI was measured using a drop jump, performed starting from a standing position, with the 14
hands placed on the hips. Subjects stepped off the box with one foot, landing with two feet 15
simultaneously onto the force plate. As contact was made with the force plate subjects 16
immediately performed a vertical jump. The drop jumps were carried out at heights of 30cm, 17
45cm and 60cm (30). Subjects were given three trials at each height with the best trial being 18
used for analysis (3). RSI was calculated by dividing jump height (mm) by contact time (ms) 19
(18). 20
Jump height = (flight time2
× gravity)/8 21
RSI = jump height (mm) / ground contact time (ms) 22
Leg Stiffness: 23
Plyometric training volume 8
Leg stiffness was measured via the use of double leg rebound jumps (hops). The double-leg 1
10 multiple hops were performed starting from a standing position. Subjects performed a 2
series of 10 hops at a frequency that was self selected by the subject (14, 26). During the 3
hopping tests, subjects were instructed to hop with their torso’s upright and their hands on 4
their hips (13) and encouraged to maximize the rigidity in their lower limbs and minimize the 5
ground contact time (18). Leg stiffness (kN∙m-1
) was calculated from force plate data using 6
the average ground contact times and flight times across the middle 6 rebound jumps (jumps 7
3 – 8), together with body mass, using the equation of Dalleau et al. (2004):(6). 8
Leg Stiffness (KN) =M*π(Tf+Tc)]/Tc2((Tf+Tc/ π)-(Tc/4)) (19) 9
Where KN refers to leg stiffness, M is the total body mass, Tc is equal to ground contact time 10
and Tf represents the flight time. 11
Training intervention 12
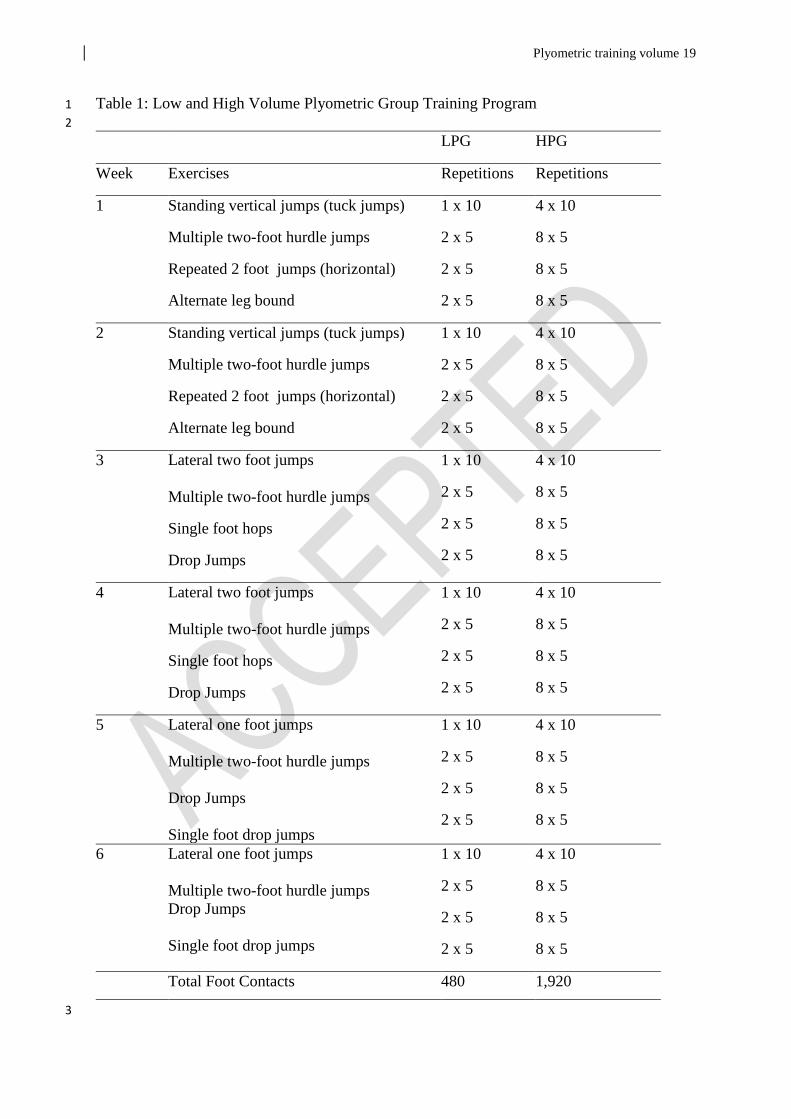
The study involved a 6 week plyometric training program for both experimental groups, 13
which reflects the training protocol durations reported elsewhere in the literature (1, 20, 27, 14
28). The 6 week program formed part of the club’s periodized training program. The sessions 15
took place on an indoor surface and were delivered alongside the normal club strength and 16
conditioning program. Total training time was determined by the intensity of the sessions and 17
the need for subjects to be recovered between sets, with more rest provided for those 18
exercises that elicited greater eccentric loading (17). At least 48 hours was planned between 19
each plyometric group to allow for relevant recovery. The sessions consisted of a range of 20
plyometric drills which included drop jumps, lateral and horizontal jumps, hurdle jumps and 21
bounds (Table 1). The drop jump height was individually prescribed based on the optimal 22
drop jump height identified during the initial testing phase (the height where the RSI score 23
was equalled or bettered). Verbal feedback was provided during each session which was 24
Plyometric training volume 9
aimed at minimising contact time and increasing flight time wherever possible. Feedback was 1
also provided in relation to any postural or technical issues although this was minimal as each 2
subject had 1 – 2 years of plyometric training history. The control group undertook their 3
regular club strength and conditioning training of two sessions a week along with the regular 4
in season program of games and skill based training, but did not undertake any plyometric 5
based training during the duration of the study. 6
7
***Insert Table 1 near here*** 8
9
Statistical Analyses 10
Descriptive statistics (mean ± SD) for the different variables were calculated. The training 11
related effects were assessed via a between-group repeated measures analysis of variance 12
(ANOVA). For RSI a 3 × 2 × 3 RM ANOVA was performed where drop height, trial and 13
group were the measured variables (group × trial × height). Drop height referrers to the 30cm, 14
45cm and 60cm heights used for both the pre and post testing, trial refers to the pre and post 15
tests, and the group refers to the Control group, HPG or LPG. For leg stiffness a 3 × 2 RM 16
ANOVA was utilized where group and time were the measured variables (group × trial), 17
where group refers to the Control group, HPG or LPG and trial refers to pre or post testing. 18
Mauchly’s test was used to test for sphericity of the data and where it was violated a Huynh-19
Feldt adjustment was utilized. Levene’s test was used to assess the equality of variances 20
within the samples. A Bonferronni analysis was used for all post hoc analysis. Three trials of 21
each jump were performed during the testing sessions, with the best score being used for RSI 22
data analysis. The middle 6 rebound jumps (jumps 3 – 8) were used to analyse leg stiffness. 23
The classification of effect sizes was determined by Cohen’s d. The effect size was classified 24
Plyometric training volume 10
as trivial (0.00 ≤ d ≤ 0.49), moderate (0.50 ≤ d ≤ 0.79), and large (d ≥ 0.80). All statistical 1
analysis was carried out via SPSS® (Chicago, Illinois). 2
RESULTS 3
Means (± SD) for reactive strength index for each group are shown in Table 2. Mauchly’s test 4
indicated that the assumption of sphericity had been violated for the main effects of trial × 5
height, χ2(2) = 10.74, P < 0.01. Therefore degrees of freedom were corrected using Huynh 6
Feldt estimates of sphericity (ε = .84 for the main effect of trial × height). 7
*** Insert Table 2 near here *** 8
9
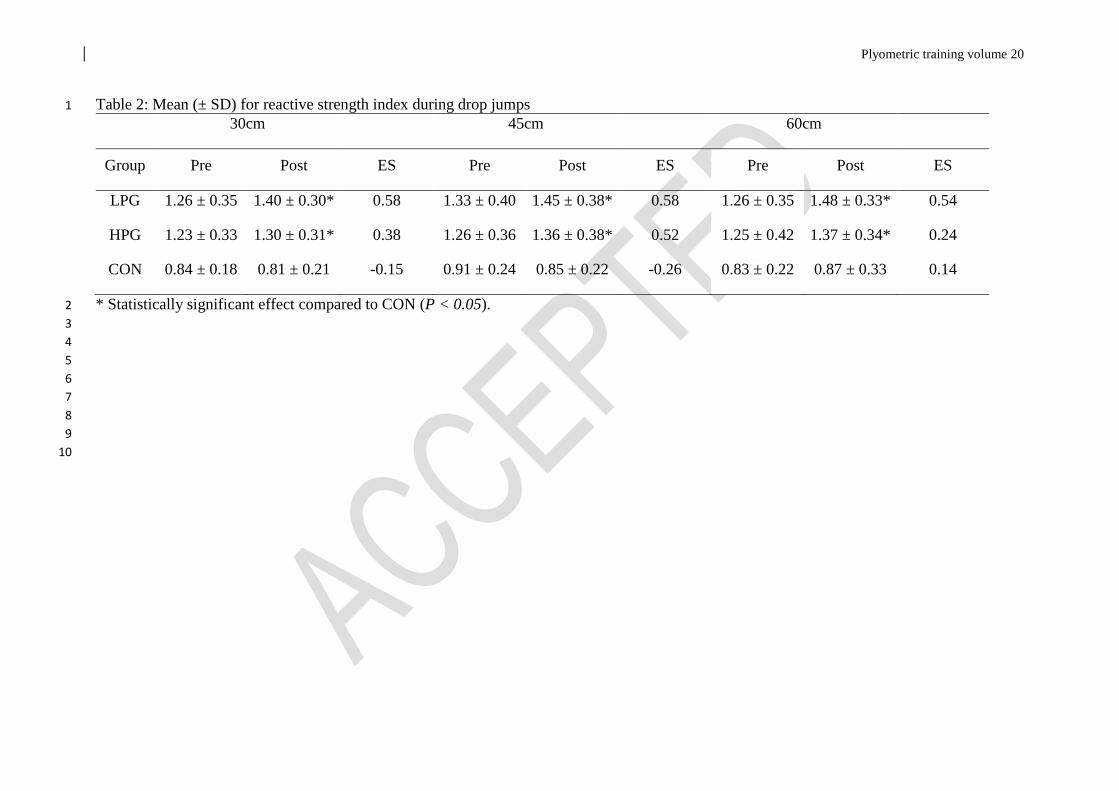
A significant interaction effect (group × time) was evidenced for measures of RSI (F = 4.01, 10
P < 0.05). Bonferroni post hoc analysis indicated that the LPG training group demonstrated a 11
significant difference (P = 0.002) from the control group, whilst the HPG training group (P = 12
0.009) also demonstrated a significant difference from the control group. However, there was 13
no significant difference between those in the LPG training group and the HPG training 14
group. (Table 2). 15
***Insert Table 3 near here*** 16
17
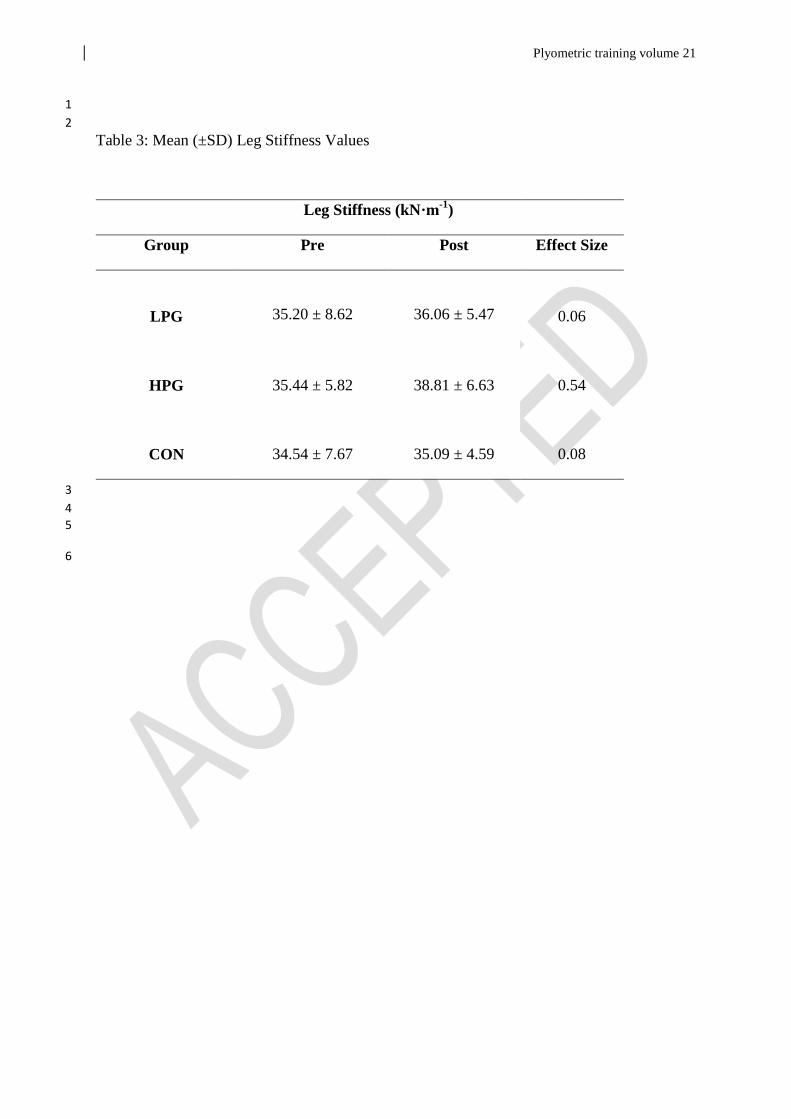
No significant interaction effects (trial × group) or main effects were observed for meaures of 18
leg stiffness (F = 1.39, P = 0.25), all groups showed increases in post testing values, with 19
trivial effect sizes demonstrated for the LPG (0.06) and control groups (0.08), and a moderate 20
effect size (0.54) shown for HPG measures. 21
22
DISCUSSION 23
Plyometric training volume 11
The aim of the study was to identify whether similar SSC performance benefits are evident 1
from a low volume plyometric program or a high volume plyometric program. Results 2
demonstrate that changes in RSI in both LPG and HPG groups were significantly difference 3
compared to the CON group. Further, the results indicate that a low volume plyometric 4
program produces similar performance enhancements in terms of RSI as a high volume 5
program, supporting the study’s hypothesis. No significant changes were evident for leg 6
stiffness in either experimental group compared to the CON group. 7
As the RSI is a measure of SSC capability and more importantly being efficient at 8
overcoming eccentric forces (10), it can be proposed that the subjects in both the HPG and 9
LPG groups will have increased their SSC capabilities. There are a number of potential 10
contributing factors to this change in function and may include; increased neural excitation 11
before the concentric action, giving a greater potentiation effect, increased utilisation of 12
stored elastic energy in the musculotendinous unit, a desensitisation of the Golgi-tendon 13
organ’s inhibitory response and an increase in the reflex contributions of the muscle spindles 14
(10). However it is beyond the scope of this study to ascertatin the mechanism of the change 15
for this population and training program. The LPG group had a smaller standard deviation 16
which suggests that subjects in the group were eliciting similar training effects, whilst the 17
larger standard deviation found within the HPG groups suggests that there are larger 18
individual differences within the group. Interestingly the control group showed a stable score 19
in RSI across the study period, despite it being lower than the two training groups across both 20
baseline and post intervention measures. This would indicate that exposure to only rugby 21
specifc strength and conidtioning training maybe sufficient to maintain but not improve RSI. 22
The results of the training interventions suggests that the same or better training effect can be 23
accomplished with a low volume training program as with a high volume training program 24
(480 contacts vs. 1920 contacts), and with greater variability in the training reposne of the 25
Plyometric training volume 12
HPG. These data are aligned with a study indicated that a low (420 total contacts) and 1
moderate (840 contacts) frequency plyometric program produced greater jumping and 2
sprinting gains than a high (1680 contacts) frequency program (8). However it must be 3
identified here that the focus of Saez de Villareal et al (7) study was frequency of sessions 4
rather than volume of sessions completed and that the training program consisted only of 5
drop jumps which may have limited ecological validity to many practioners. 6
A meta- analysis evidenced that to maximize any potential significant training effects on 7
measures of RSI, plyometric programs should be designed to include volumes of more than 8
10 weeks, with at least 20 sessions and with at least 50 jumps of a high intensity nature in 9
each session (7). The analysis reported a 3.2cm increase in SJ and an 2.9cm increase in CMJ 10
(7). This led the authors to state that plyometric training is effective in improving the vertical 11
jump height (7% increases). The current study would seem to induce similar changes with 12
just fewer than 50% of the suggested minimum contacts. Previous reeaech has indicated that 13
it takes 4 months of plyometric training to inhibit the Golgi-tendon organ and utilize the 14
potentiation caused by the activation of muscle spindles (29). The results obtained for RSI are 15
somewhat interesting in that they also show that the temporal pattern of increased SSC 16
muscle actions is more rapid than literature suggests. This suggests that the results of this 17
study could be of significant practical importance to strength and conditioning coaches, when 18
looking to plan effective and efficient training programs. 19
Results revealed that there were no significant increases in leg stiffness as a result of the HPG 20
or LPG, although the results did demonstrate a moderate (0.54) and small (0.06) effect size 21
for both experimental groups respectively. Although this improvement exists, further analysis 22
of the data reveals that the response to the training programs was found to be individualized 23
with some subjects increasing considerably, whilst others demonstrated no improvement and 24
some even showed a decrement in their performance levels. This result is suppored by a 25
Plyometric training volume 13
recent study that implemented a fatigue protocol, evidencing that some particpants showed 1
improvement whilst others demonstrated no increase or even a decrease in stiffness 2
performance (25). 3
It may be seen as somewhat surprising that as leg stiffness is so closely linked to SSC 4
function (24) that subjects in both experimental groups saw a significant increase in 5
performance of RSI values whilst no significant increases were detected in leg stiffness. 6
However, there are some contributory factors that may help to explain the lack of significant 7
improvement. Examination of the scientific literature shows that care needs to be taken when 8
interpreting results as leg stiffness is modulated depending on the specific demands of any 9
particular task (31). Also movements that vary kinematically, even slightly, may engender 10
significant differences in leg stiffness. 11
Modulation of leg stiffness adjustment for a range of hopping frequencies, has been identified 12
that as hopping frequencies increased then leg stiffness increased (13). Whilst undertaking 13
both the testing and the training program, all movements were carried out at the preferred 14
frequency of the subject and so they may not have had the opportunity to carry out 15
movements where a potentail increase in leg stiffness occured. 16
Within the same study, the authors also identified that the increase in leg stiffness was mainly 17
due to the decrease in vertical displacement of the centre of mass (COM). They propose that 18
as the hopping frequency increases, the stiffness of the spring-mass system increases and the 19
displacement of the COM decreases so that contact time is minimized and the ability is 20
created to bounce off the ground in less time. Within the training program, whilst subjects 21
were encouraged to minimize contact time and jump as high as possible, there was no 22
particular attention paid to the amount of COM displacement and as a result, this may have 23
had an impact on the stiffness developed within the training sessions. 24
Plyometric training volume 14
A recent study on leg stiffness in hopping, with subjects to selecting their own hopping 1
frequency, suggests that subjects accommodate their hopping frequency in order to maintain 2
their leg stiffness despite any increase in hopping intensity (16). They go on to suggest that 3
adjustments may occur in what seems to be similar hopping conditions and that subjects 4
prefer to select an ‘optimal’ leg stiffness which is independent of differences in hopping 5
intensity, where frequency of hopping is not a constraint. This suggests that even within the 6
testing conditions carried out within the present study, subjects could select their ‘optimum’ 7
stiffness based on the fact that they were able to hop at their preferred frequency. 8
PRACTICAL APPLICATIONS 9
From the results of the current study, it can be suggested that a low volume plyometric 10
program produces similar performance enhancements in terms of reactive strength as a high 11
volume program, yet with a greater efficiency (25% of the total for HPG). The results would 12
also suggest that increasing the number of contacts within a program would not necessarily 13
lead to an increase in reactive strength capabilities in collegiate rugby players with 1-2 years 14
training history. The results would also support the suggestion of de Villarreal et al. (8) and 15
Sankey et al. (27), that there may be a minimal training threshold required to gain a 16
significant performance improvement and after which further training is no longer 17
advantageous. However, the practical applications of this study would only apply to athletes 18
with limited plyometric training experience. These results may not be the same in individuals 19
with either a lower or higher training age and more research is needed to understand the dose-20
response relationship in different populations 21
22
Plyometric training volume 15
REFERENCES 1
2
1. Adams K, O'Shea JP, O'Shea KL, and Climstein M. The Effect of Six Weeks of 3
Squat, Plyometric and Squat-Plyometric Training on Power Production. The Journal 4
of Strength & Conditioning Research 6: 36-41, 1992. 5
2. Brewer C. Strength and conditioning for games players. Coachwise Business 6
Solutions, 2005. 7
3. Castagna C, Chaouachi A, Rampinini E, Chamari K, and Impellizzeri F. Aerobic and 8
explosive power performance of elite Italian regional-level basketball players. The 9
Journal of Strength & Conditioning Research 23: 1982-1987, 2009. 10
4. Chandler TJ and Brown LE. Conditioning for strength and human performance. 11
Lippincott Williams & Wilkins, 2008. 12
5. Cornu C, Silveira M-IA, and Goubel F. Influence of plyometric training on the 13
mechanical impedance of the human ankle joint. European journal of applied 14
physiology and occupational physiology 76: 282-288, 1997. 15
6. Dalleau G, Belli A, Viale F, Lacour J, and Bourdin M. A simple method for field 16
measurements of leg stiffness in hopping. Int J Sports Med 25: 170-176, 2004. 17
7. de Villarreal ES-S, Kellis E, Kraemer WJ, and Izquierdo M. Determining variables of 18
plyometric training for improving vertical jump height performance: a meta-analysis. 19
The Journal of Strength & Conditioning Research 23: 495-506, 2009. 20
8. de Villarreal ESS, González-Badillo JJ, and Izquierdo M. Low and moderate 21
plyometric training frequency produces greater jumping and sprinting gains compared 22
with high frequency. The Journal of Strength & Conditioning Research 22: 715-725, 23
2008. 24
9. Dodd DJ and Alvar BA. Analysis of acute explosive training modalities to improve 25
lower-body power in baseball players. The Journal of Strength & Conditioning 26
Research 21: 1177-1182, 2007. 27
10. Flanagan EP and Comyns TM. The use of contact time and the reactive strength index 28
to optimize fast stretch-shortening cycle training. Strength & Conditioning Journal 30: 29
32-38, 2008. 30
11. Flanagan EP and Harrison AJ. Muscle dynamics differences between legs in healthy 31
adults. The Journal of Strength & Conditioning Research 21: 67-72, 2007. 32
Plyometric training volume 16
12. Gamble P. Physical Preparation for Elite-Level Rugby Union Football. Strength & 1
Conditioning Journal 26: 10-23, 2004. 2
13. Hobara H, Inoue K, Muraoka T, Omuro K, Sakamoto M, and Kanosue K. Leg 3
stiffness adjustment for a range of hopping frequencies in humans. Journal of 4
Biomechanics 43: 506-511, 2010. 5
14. Hobara H, Kanosue K, and Suzuki S. Changes in muscle activity with increase in leg 6
stiffness during hopping. Neuroscience letters 418: 55-59, 2007. 7
15. Hopkins WG. Sample sizes for magnitude-based inferences about clinical, practical or 8
mechanistic significance. Medicine and Science in Sports and Exercise 38, 2006. 9
16. Kuitunen S, Ogiso K, and Komi P. Leg and joint stiffness in human hopping. 10
Scandinavian Journal of Medicine & Science in Sports 21: e159-e167, 2011. 11
17. Lloyd RS, Meyers RW, and Oliver JL. The natural development and trainability of 12
plyometric ability during childhood. Strength & Conditioning Journal 33: 23-32, 13
2011. 14
18. Lloyd RS, Oliver JL, Hughes MG, and Williams CA. Reliability and validity of field-15
based measures of leg stiffness and reactive strength index in youths. Journal of 16
Sports Sciences 27: 1565-1573, 2009. 17
19. Lloyd RS, Oliver JL, Hughes MG, and Williams CA. The effects of 4-weeks of 18
plyometric training on reactive strength index and leg stiffness in male youths. The 19
Journal of Strength & Conditioning Research 26: 2812-2819, 2012. 20
20. Makaruk H and Sacewicz T. Effects of plyometric training on maximal power output 21
and jumping ability. Human Movement 11: 17-22, 2010. 22
21. McClymont D. Use of the reactive strength index (RSI) as an indicator of plyometric 23
training conditions. Presented at Science and Football V: The proceedings of the fifth 24
World Congress on Sports Science and Football, Lisbon, Portugal, 2005. 25
22. McMahon TA and Cheng GC. The mechanics of running: how does stiffness couple 26
with speed? Journal of biomechanics 23: 65-78, 1990. 27
23. Nicol C, Avela J, and Komi PV. The stretch-shortening cycle. Sports Medicine 36: 28
977-999, 2006. 29
24. Oliver J and Smith PM. Neural control of leg stiffness during hopping in boys and 30
men. Journal of Electromyography and Kinesiology 20: 973-979, 2010. 31
25. Oliver JL, Croix MBDS, Lloyd RS, and Williams CA. Altered neuromuscular control 32
of leg stiffness following soccer-specific exercise. European Journal of Applied 33
Physiology 114: 2241-2249, 2014. 34
Plyometric training volume 17
26. Padua DA, Carcia CR, Arnold BL, and Granata KP. Gender differences in leg 1
stiffness and stiffness recruitment strategy during two-legged hopping. Journal of 2
Motor Behavior 37: 111-126, 2005. 3
27. Sankey SP, Jones PA, and Bampouras T. Effects of two plyometric training 4
programmes of different intensity on vertical jump performance in high school 5
athletes. Serbian Journal of Sports Sciences 2: 123-130, 2008. 6
28. Turner AM, Owings M, and Schwane JA. Improvement in running economy after 6 7
weeks of plyometric training. The Journal of Strength & Conditioning Research 17: 8
60-67, 2003. 9
29. Turner AN and Jeffreys I. The stretch-shortening cycle: Proposed mechanisms and 10
methods for enhancement. Strength & Conditioning Journal 32: 87-99, 2010. 11
30. Wallace BJ, Kernozek TW, White JM, Kline DE, Wright GA, Peng H-T, and Huang 12
C-F. Quantification of vertical ground reaction forces of popular bilateral plyometric 13
exercises. The Journal of Strength & Conditioning Research 24: 207-212, 2010. 14
31. Wilson JM and Flanagan EP. The role of elastic energy in activities with high force 15
and power requirements: a brief review. The Journal of Strength & Conditioning 16
Research 22: 1705-1715, 2008. 17

Plyometric training volume 18
Legends to tables 1
Table 1: Low and High Volume Plyometric Group Training Program 2
3
Table 2: Mean (± SD) for reactive strength index during drop jumps 4
5
Table 3: Mean (±SD) Leg Stiffness Values 6
7
8 9
Plyometric training volume 19
Table 1: Low and High Volume Plyometric Group Training Program 1
2
LPG HPG
Week Exercises Repetitions Repetitions
1
Standing vertical jumps (tuck jumps)
Multiple two-foot hurdle jumps
Repeated 2 foot jumps (horizontal)
Alternate leg bound
1 x 10
2 x 5
2 x 5
2 x 5
4 x 10
8 x 5
8 x 5
8 x 5
2
Standing vertical jumps (tuck jumps)
Multiple two-foot hurdle jumps
Repeated 2 foot jumps (horizontal)
Alternate leg bound
1 x 10
2 x 5
2 x 5
2 x 5
4 x 10
8 x 5
8 x 5
8 x 5
3
Lateral two foot jumps
Multiple two-foot hurdle jumps
Single foot hops
Drop Jumps
1 x 10
2 x 5
2 x 5
2 x 5
4 x 10
8 x 5
8 x 5
8 x 5
4
Lateral two foot jumps
Multiple two-foot hurdle jumps
Single foot hops
Drop Jumps
1 x 10
2 x 5
2 x 5
2 x 5
4 x 10
8 x 5
8 x 5
8 x 5
5
Lateral one foot jumps
Multiple two-foot hurdle jumps
Drop Jumps
Single foot drop jumps
1 x 10
2 x 5
2 x 5
2 x 5
4 x 10
8 x 5
8 x 5
8 x 5
6
Lateral one foot jumps
Multiple two-foot hurdle jumps
Drop Jumps
Single foot drop jumps
1 x 10
2 x 5
2 x 5
2 x 5
4 x 10
8 x 5
8 x 5
8 x 5
Total Foot Contacts 480 1,920
3
Plyometric training volume 20
Table 2: Mean (± SD) for reactive strength index during drop jumps 1
30cm 45cm 60cm
Group Pre Post ES Pre Post ES Pre Post ES
LPG 1.26 ± 0.35 1.40 ± 0.30* 0.58 1.33 ± 0.40 1.45 ± 0.38* 0.58 1.26 ± 0.35 1.48 ± 0.33* 0.54
HPG 1.23 ± 0.33 1.30 ± 0.31* 0.38 1.26 ± 0.36 1.36 ± 0.38* 0.52 1.25 ± 0.42 1.37 ± 0.34* 0.24
CON 0.84 ± 0.18 0.81 ± 0.21 -0.15 0.91 ± 0.24 0.85 ± 0.22 -0.26 0.83 ± 0.22 0.87 ± 0.33 0.14
* Statistically significant effect compared to CON (P < 0.05). 2
3
4
5
6
7
8
9
10
Plyometric training volume 21
1
2
Table 3: Mean (±SD) Leg Stiffness Values
Leg Stiffness (kN·m-1
)
Group Pre Post Effect Size
LPG
35.20 ± 8.62
36.06 ± 5.47 0.06
HPG
35.44 ± 5.82
38.81 ± 6.63 0.54
CON
34.54 ± 7.67
35.09 ± 4.59 0.08
3
4
5
6


