Embed Size (px)
Citation preview

2nd Quarter 2022
22002222

Republic of the Philippines
PRESIDENT RODRIGO ROA DUTERTE
Republic of the Philippines PHILIPPINE STATISTICS AUTHORITY
CLAIRE DENNIS S MAPA Ph.D. Undersecretary
National Statistician and Civil Registrar General
Copyright @2022 by Philippine Statistics Authority PSA Complex, East Avenue, Diliman
Quezon City, Philippines

Table of Contents
GNI and GDP by Industrial Origin 1st Quarter 2021 and 1st Quarter 2022 Growth Rates (In percent; at constant 2018 prices)
1
GNI and GDP by Expenditure Shares 1st Quarter 2021 and 1st Quarter 2022, Growth Rates (In percent; at constant 2018 prices)
2
GNI and GDP by Industrial Origin: 2019 to 2021 (In percent; at constant 2018 prices)
3
GNI and GDP by Expenditure Shares: 2019 to 2021 (In percent; at constant 2018 prices)
4
Gross Regional Domestic Product by Region: 2019 to 2021 (as of April 2022)
5
Daily Minimum Wage Rates by Sector in National Capital Region: 2017 to 2022 (In pesos)
6
Total Approved Foreign Investments (FI), By Investment Promotion Agency 1st Quarter 2021 and 2022 (In million pesos)
7
Total Approved Foreign Investments (FI), By Country of Investor, 1st Quarter 2021 and 2022 (In million pesos)
8
Total Approved Investments By Nationality (Filipino and Foreign) 1st Quarter 2021 and 2022 (In million pesos)
9

Table of Contents
First Semester Per Capita Poverty and Food Threshold By Region: 2018 and 2021 (In Pesos)
10
First Semester Poverty and Subsistence Incidence Among Population, by Region: 2018 and 2021 (In Percent)
11
First Semester Poverty and Subsistence Incidence Among Population, by Region: 2015 and 2018 (In Percent)
12
Number of Geo-Political Subdivisions (As of 31 March 2022) 13
Key Macro Economic and Social Indicators 14
Total Population 15 Years Old and Over and Employment Status, Philippines: January 2022 to October 2021 (In thousands except rates)
22

1
by Industrial Origin: 1st Quarter 2021 and 1st Quarter 2022 Growth Rates (In percent; at constant 2018 prices)
Industry Growth Rates (%)
2021-2022 2020-2021 1st Qtr 1st Qtr
Agriculture, Forestry, and Fishing 0.2 (1.3) Industry 10.4 (4.2)
Mining and quarrying 17.0 2.0 Manufacturing 10.1 0.8 Electricity, steam, water and waste management 5.8 1.1 Construction 13.5 (22.6)
Services 8.6 (4.0) Wholesale and retail trade; repair of motor vehicles and motorcycles 7.3 (3.4) Transportation and storage 26.5 (19.9) Accommodation and food service activities 21.0 (22.5) Information and communication 7.7 6.6 Financial and insurance activities 7.2 4.3 Real estate and ownership of dwellings 7.9 (11.7) Professional and business services 8.8 (3.6) Public administration and defense: compulsory social activities 0.8 7.5 Education 7.8 0.3 Human health and social work activities 1.2 13.0 Other services 22.3 (38.7)
Gross Domestic Product (GDP) 8.3 (3.8) Net primary income from the rest of the world 103.2 (75.9)
Gross National Income (GNI) 10.7 (10.5) Source: Philippine Statistics Authority
Gross National Income and Gross Domestic Product

2
Gross National Income and Gross Domestic Product by Expenditure: 1st Quarter 2021 and 1st Quarter 2022 Growth Rates (In percent; at constant 2018 prices)
Expenditure Items Growth Rates (%)
2021-2022 2020-2021 1st Qtr 1st Qtr
Household final consumption expenditure 10.1 (4.8) Government final consumption expenditure 3.6 16.1
Gross capital formation 20.0 (13.9)
Gross fixed capital formation 11.0 (18.2)
1. Construction 13.2 (25.2)
2. Durable equipment 9.8 (11.0) 3. Breeding stocks and orchard development 3.2 (3.2)
4. Intellectual property products 11.5 1.1
Changes in inventories - -
Valuables (37.0) (18.1)
Exports of goods and services 10.3 (8.4)
Exports of goods 5.9 2.8
Exports of services 16.2 (20.0) Less: Imports of goods and services 15.6 (7.5)
Imports of goods 12.6 (0.4)
Imports of services 32.0 (33.6)
Gross Domestic Product (GDP) 8.3 (3.8) Net primary income from the rest of the world 103.2 (75.9)
Gross National Income (GNI) 10.7 (10.5) Source: Philippine Statistics Authority

3
Gross National Income and Gross Domestic Product by Industrial Origin: 2019 to 2021 (In percent; at constant 2018 prices)
Industry
Growth Rates (%) Percent Share to GNI
2019-2020
2020-2021
2019 2020 2021
Agriculture, Forestry, and Fishing (0.2) (0.3) 9.2 10.2 9.6
Services (9.1) 5.4 60.4 60.7 60.5 Wholesale and retail trade; repair of motor vehicles and motorcycles (6.1) 4.2 18.0 18.7 18.4 Transportation and storage (30.6) 6.3 3.8 2.9 3.0 Accommodation and food service activities (45.5) 7.2 2.2 1.3 1.3 Information and communication 5.1 9.2 2.9 3.3 3.4 Financial and insurance activities 5.6 4.7 8.6 10.1 10.0 Real estate and ownership of dwellings (16.7) 2.2 6.4 5.9 5.7 Professional and business services (9.6) 6.2 6.1 6.1 6.1 Public administration and defense: compulsory social activities 4.5 5.7 4.5 5.2 5.2 Education (10.2) 8.3 4.0 3.9 4.0 Human health and social work activities (5.1) 14.1 1.7 1.7 1.9 Other services (41.0) 2.0 2.3 1.5 1.4
GDP share to GNI (9.5) 5.7 91.0 93.0 96.7 Net primary income from the rest of the world (31.1) (51.3) 9.0 7.0 3.3
Gross National Income (GNI) (11.5) 1.7 100.0 100.0 100.0 Source: Philippine Statistics Authority
Industry (13.1) 8.5 30.4 29.2.2 29.9 Mining and quarrying (18.6) 5.0 0.9 0.8 0.8 Manufacturing (9.8) 8.8 18.7 18.6 19.2 Electricity, steam, water and waste management (0.4) 4.5 3.1 3.4 3.3 Construction (25.5) 10.0 7.8 6.4 6.7
4
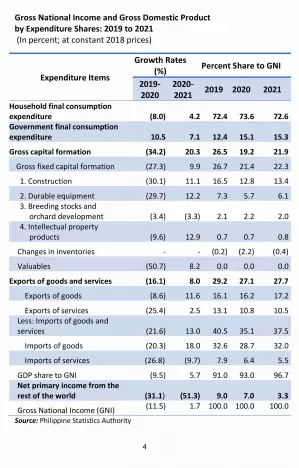
Gross National Income and Gross Domestic Product by Expenditure Shares: 2019 to 2021 (In percent; at constant 2018 prices)
Expenditure Items
Growth Rates (%) Percent Share to GNI
2019-2020
2020-2021
2019 2020 2021
Household final consumption expenditure (8.0) 4.2 72.4 73.6 72.6 Government final consumption expenditure 10.5 7.1 12.4 15.1 15.3
Gross capital formation (34.2) 20.3 26.5 19.2 21.9
Gross fixed capital formation (27.3) 9.9 26.7 21.4 22.3
1. Construction (30.1) 11.1 16.5 12.8 13.4
2. Durable equipment (29.7) 12.2 7.3 5.7 6.1 3. Breeding stocks and orchard development (3.4) (3.3) 2.1 2.2 2.0 4. Intellectual property products (9.6) 12.9 0.7 0.7 0.8
Changes in inventories - - (0.2) (2.2) (0.4)
Valuables (50.7) 8.2 0.0 0.0 0.0
Exports of goods and services (16.1) 8.0 29.2 27.1 27.7
Exports of goods (8.6) 11.6 16.1 16.2 17.2
Exports of services (25.4) 2.5 13.1 10.8 10.5 Less: Imports of goods and services (21.6) 13.0 40.5 35.1 37.5
Imports of goods (20.3) 18.0 32.6 28.7 32.0
Imports of services (26.8) (9.7) 7.9 6.4 5.5
GDP share to GNI (9.5) 5.7 91.0 93.0 96.7 Net primary income from the rest of the world (31.1)
(51.3)
9.0
7.0
3.3
Gross National Income (GNI) (11.5) 1.7 100.0 100.0 100.0
Source: Philippine Statistics Authority

5
Gross Regional Domestic Product by Region: 2019 to 2021 (In percent; at constant 2018 prices)
Region Growth Rates (%)
2020-2021 2019-2020
Philippines 5.7 (9.5)
National Capital Region (NCR) 4.4 (10.0)
Cordillera Administrative Region (CAR) 7.5 (10.2)
Region I (Ilocos Region) 4.6 (7.7)
Region II (Cagayan Valley) 5.1 (9.8)
Region III (Central Luzon) 7.4 (13.9)
Region IV-A (CALABARZON) 7.6 (10.5)
MIMAROPA Region 3.3 (7.5)
Region V (Bicol Region) 4.3 (8.3)
Region VI (Western Visayas) 5.9 (9.7)
Region VII (Central Visayas) 5.4 (9.5)
Region VIII (Eastern Visayas) 6.0 (7.4)
Region IX (Zamboanga Peninsula) 5.7 (5.2)
Region X (Northern Mindanao) 6.3 (5.3)
Region XI (Davao Region) 5.9 (7.5)
Region XII (SOCCSKSARGEN) 5.2 (4.4)
Region XIII (Caraga) 7.2 (6.9) Bangsamoro Autonomous Region in Muslim Mindanao (BARMM) 7.5 (1.9) Note: As of April 2022 Source: Philippine Statistics Authority

6
Daily Minimum Wage Rates by Sector in National Capital Region 2017 to 2022 (In pesos)
Indicator/Sector Effective
05 Oct 2017
Effective 11 Jan 2018
Effective 22 Nov 2018
Effective 04 June
2022
Non-Agriculture 512.00 512.00 537.00 570.00
Agriculture
Plantation and Non-Plantation 475.00 475.00 500.00 533.00
Retail/Service
Establishments employing 15 workers or less
475.00 475.00 500.00 533.00
Manufacturing
Establishments regularly employing less than 10 workers
475.00 475.00 500.00 533.00
Note: Upon effectivity as per Wage Order No. NCR-23, a P33.00/day basic wage increase is being granted in addition to the previous wage order.
Source: National Wages and Productivity Commission

7
Total Approved Foreign Investments (FI) By Investment Promotion Agency 1st Quarter 2021 and 2022 (In million pesos)
Agency
Approved FI Share to Total (%) Q1 2022
Growth rate Q1 2021– Q1 2022
Q1 2022 Q1 2021
AFAB - 39.4 - -
BOI 4,326.9 6,838.1 48.2 (36.7)
BOI BARMM - - - -
CDC 71.4 357.3 0.8 (80.0)
CEZA - 49.1 - -
PEZA 4,473.5 12,186.6 49.8 (63.3)
SBMA 108.8 76.4 1.2 42.4
Total 8,980.6 19,546.9 100.0 (54.1)
**Growth rates greater than 1,000; dash (-) equivalent to zero. Note: Details may not add up to totals due to rounding. Sources: Philippine Statistics Authority; Authority of the Freeport Area Bataan (AFAB); Board of Investments (BOI); Board of Investments-Bangsamoro Autonomous Region in Muslim Mindanao (BOI-BARMM); Clark Development Corporation (CDC); Cagayan Economic Zone Authority (CEZA); Philippine Economic Zone Authority (PEZA); Subic Bay Metropolitan Authority (SBMA)

8
Total Approved Foreign Investments (FI)
Country Approved FI Share to
Total (%) Q1 2022
Growth rate Q1 2021- Q1 2022
Q1 2022 Q1 2021
Australia 220.45 43.6 2.5 405.5 British Virgin Islands 220.38 - 2.5 -
Canada 5.31 14.4 0.1 (63.2)
Cayman Islands - 1,136.8 - -
China (PROC) 182.53 339.0 2.0 (54.3)
Denmark 4.00 - - -
France - 56.8 - -
Germany - 407.4 - -
Hongkong 7.10 146.8 0.1 (95.2)
India - 34.0 - -
Japan 3,561.42 10,716.6 39.7 (66.8)
South Korea 1,663.30 592.6 18.5 180.7
Malaysia - - - -
Netherlands 51.34 78.1 0.6 (34.3)
Singapore 1,634.70 85.4 18.2 **
Switzerland 585.96 95.9 6.5 511.2
Taiwan 66.68 169.9 0.7 (60.7)
Thailand - 8.3 - (100.0)
UK 0.72 470.1 - (99.8)
USA 291.99 322.3 3.3 (9.4)
Others 484.76 4,768.8 5.4 (89.8)
Total 8,980.6 19,546.9 100.0 (54.1) ** Growth rates greater than 1,000; Dash (-) equivalent to zero. Note: Details may not add up to totals due to rounding. Source: Philippine Statistics Authority
By Country of Investor: 1st Quarter 2021 and 2022 (In million pesos)

9
Total Approved Investments by Nationality (Filipino and Foreign) 1st Quarter 2021 and 2022 (In million pesos)
Nationality
Q1 2021 Q1 2022 Growth rate (%)
Q1 2021-Q1 2022
Amount % Share to Total
Amount % Share to Total
Filipino 145,346.8 88.1 181,588.7 95.3 24.9
Foreign 19,546.9 11.9 8,980.6 4.7 (54.1)
Total 164,893.6 100.0 190,569.3 100.0 15.6
Notes: 1. Approved Investments refer to the project cost or committed investments
by Filipino and foreign. 2. Filipino investments include all committed investments of Filipinos in
wholly and partially owned companies. 3. Details may not add up to totals due to rounding. Sources: Authority of the Freeport Area of Bataan (AFAB), Board of Investments (BOI), Board of Investments-Bangsamoro Autonomous Region in Muslim Mindanao (BOI-BARMM), Clark Development Corporation (CDC), Cagayan Economic Zone Authority (CEZA), Philippine Economic Zone Authority (PEZA) and Subic Bay Metropolitan Authority (SBMA)

10
First Semester Per Capita Poverty and Food Threshold By Region: 2018 and 2021 (In pesos)
Region Per Capita
Poverty Threshold Per Capita
Food Threshold 2018 u 2021 2018u 2021
Philippines 12,638 14,498 8,849 10,071
NCR 14,102 16,625 9,848 11,609
CAR 12,358 14,023 8,622 9,796
I 12,837 15,470 9,012 10,802
II 12,182 14,226 8,511 9,930
III 12,976 16,226 9,144 11,351
IV-A 13,669 15,604 9,689 10,750
MIMAROPA 11,472 13,054 7,988 9,103
V 11,975 13,873 8,340 9,750
VI 11,964 13,519 8,322 9,455
VII 12,724 15,174 8,847 10,578
VIII 12,195 13,550 8,527 9,484
IX 12,424 14,467 8,725 10,468
X 12,259 14,302 8,559 9,964
XI 12,718 13,324 8,880 9,289
XII 12,082 13,298 8,392 9,254
XIII 12,346 13,613 8,643 9,520
BARMM 13,599 14,126 9,577 9,956 U=updated; Back estimation of the 2018 first semester poverty statistics was made due to the adoption of the 2015 Census of Population (POPCEN 2015) results for the weights used in the Family Income and Expenditure Survey (FIES) and the urban-rural classification of barangays. Source: Philippine Statistics Authority
11
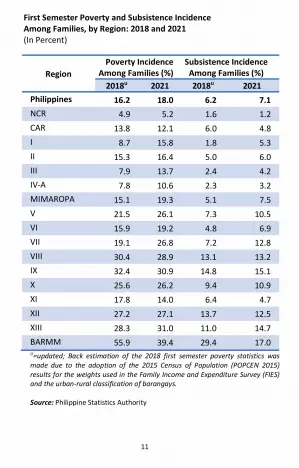
First Semester Poverty and Subsistence Incidence Among Families, by Region: 2018 and 2021 (In Percent)
Region Poverty Incidence
Among Families (%) Subsistence Incidence
Among Families (%) 2018u 2021 2018u 2021
Philippines 16.2 18.0 6.2 7.1 NCR 4.9 5.2 1.6 1.2 CAR 13.8 12.1 6.0 4.8 I 8.7 15.8 1.8 5.3 II 15.3 16.4 5.0 6.0 III 7.9 13.7 2.4 4.2 IV-A 7.8 10.6 2.3 3.2 MIMAROPA 15.1 19.3 5.1 7.5 V 21.5 26.1 7.3 10.5 VI 15.9 19.2 4.8 6.9 VII 19.1 26.8 7.2 12.8 VIII 30.4 28.9 13.1 13.2 IX 32.4 30.9 14.8 15.1 X 25.6 26.2 9.4 10.9 XI 17.8 14.0 6.4 4.7 XII 27.2 27.1 13.7 12.5 XIII 28.3 31.0 11.0 14.7 BARMM 55.9 39.4 29.4 17.0 U=updated; Back estimation of the 2018 first semester poverty statistics was made due to the adoption of the 2015 Census of Population (POPCEN 2015) results for the weights used in the Family Income and Expenditure Survey (FIES) and the urban-rural classification of barangays. Source: Philippine Statistics Authority

12
First Semester Poverty and Subsistence Incidence Among Population, by Region: 2018 and 2021 (In Percent)
Region Poverty Incidence
Among Population (%) Subsistence Incidence Among Population (%)
2018u 2021 2018u 2021 Philippines 21.1 23.7 8.5 9.9 NCR 6.6 7.8 2.0 1.9 CAR 17.9 16.2 7.9 6.7 I 11.7 20.2 2.8 7.1 II 19.3 20.9 6.7 8.1 III 10.4 18.2 3.3 6.0 IV-A 10.5 14.8 3.1 4.9 MIMAROPA 20.5 25.7 7.1 10.6 V 28.1 33.5 10.0 14.4 VI 20.9 25.3 6.9 9.8 VII 24.3 33.0 9.2 16.4 VIII 37.3 36.0 16.9 17.3 IX 39.9 37.4 19.6 19.5 X 32.0 33.8 12.7 15.0 XI 23.8 19.4 9.5 7.1 XII 33.6 34.1 17.6 17.1 XIII 35.2 38.3 14.7 19.1 BARMM 63.2 45.8 36.1 21.5 U=updated; Back estimation of the 2018 first semester poverty statistics was made due to the adoption of the 2015 Census of Population (POPCEN 2015) results for the weights used in the Family Income and Expenditure Survey (FIES) and the urban-rural classification of barangays. Source: Philippine Statistics Authority

13
Regions Provinces Cities Municipalities Barangays Population
(As of 01 May 2020)
Philippines 81 146 1,488 42,046 109,035,343 a/
NCR - 16 1 1,710 13,484,462
CAR 6 2 75 1,178 1,797,660
I 4 9 116 3,267 5,301,139
II 5 4 89 2,311 3,685,744
III 7 14 116 3,102 12,422,172
IV-A 5 20 122 4,019 16,195,042
MIMAROPA 5 2 71 1,460 3,228,558
V 6 7 107 3,471 6,082,165
VI 6 16 117 4,051 7,954,723
VII 4 16 116 3,003 8,081,988
VIII 6 7 136 4,390 4,547,150
IX 3 5 67 1,904 3,875,576
X 5 9 84 2,022 5,022,768
XI 5 6 43 1,162 5,243,536
XII 4 4 45 1,095 4,901,486
XIII 5 6 67 1,311 2,804,788
BARMM* 5 3 116 2,590 4,404,288 a/ Population counts for regions do not add up to the national total. Includes 2,098 Filipinos in Philippine Embassies, Consulates and Missions Abroad. *Per PSA Board Resolution No. 13 Series of 2021 - Approving and Adopting the Third quarter 2021 Philippine Standard. Geographic Code Updates to include the Bangsamoro Autonomous Region in Muslim Mindanao (BARMM) and correct the names of 137 barangays. Source: Philippine Statistics Authority
Number of Geo-Political Subdivisions (As of 31 March 2022)

14
Indicator Latest Year ago Previous
Price Indices May 2022 May 2021 Apr 2022
1 Consumer Price Index (2018 = 100) 113.9 108.1 113.4
2 Inflation Rate (in percent) (2018 = 100) 5.4 4.1 4.9
Foreign Trade April 2022 April 2021 Mar 2022
3 Exports (in million USD) 6,128.58 5,780.47 7,175.33
4 Imports (in million USD) 10,901.73 8,878.34 12,182.57
Money and Banking May 2022 May 2021 April 2022
5 Balance of Payments (in million USD) (1,606) (1,397) (415)
6 Peso per US $ 52.3618 47.9552 51.9760
7 Stocks Composite Index 6,774.68 6,628.49 6,731.25
Government Cash Operations
Mar 2022 Mar 2021 Feb 2022
8 National government outstanding debt (in million pesos) 12,679,785 10,773,830 12,093,500
9 National government revenues (in million pesos) 293,883 216,161 212,402
Tourism Dec 2021 Dec 2020 Nov 2021
10 Visitor Arrivals 24,353 19,793 20,530
Continued
Key Macro Economic and Social Indicators

15
Indicator Latest Year ago Previous
Labor and Employment April 2022p April 2021r March 2022p
11 Underemployment Rate (in percent) 14.0 17.2 15.8
12 Unemployment Rate (in percent) 5.7 8.7 5.8
Demography May 2020 Aug 2015
13 Population (in thousands) 109,035 100,981
2015-2020 2010-2020
14 Population Growth Rate (annual average in percent) 1.63 1.67
Education 2020-2021 2019-2020
15 Net Enrolment Number (public, private, SUC/LUC, PSO)
Pre-school (Kinder) 2,055,635 2,044,745
Elementary school 12,595,169 13,287,961
Junior high school 8,339,391 8,503,650
Senior high school 3,236,827 3,194,035
16 Health and Vital Statistics Feb 2022p Feb 2021p Jan 2022p
Birth 4,080 83,898 64,007
Marriages 976 30,639 20,519
Deaths 1,952 53,107 41,853
2020 2019
17 Under-5 mortality rate 9.11 12.83
18 Infant mortality rate 7.34 9.04
Sources: Philippine Statistics Authority, Bangko Sentral ng Pilipinas, Department of Tourism, Philippine Stock Exchange, Inc., Bureau of Treasury, Department of Education
Continued
Key Macro Economic and Social Indicators (Continued)

16
Key Macro Economic and Social Indicators (Continued)
Indicator Latest
May 2022 Year ago
May 2021 Previous Apr 2022
Consumer Price Index (2018=100)
Philippines 113.9 108.1 113.4
National Capital Region (NCR) 110.9 105.9 110.3 Cordillera Administrative Region (CAR) 114.1 106.7 113.6
Region I (Ilocos Region) 114.2 108.0 113.8
Region II (Cagayan Valley) 116.1 110.5 115.6
Region III (Central Luzon) 116.1 108.8 115.4
Region IV-A (CALABARZON) 114.2 108.7 113.9
MIMAROPA Region 118.1 112.2 117.2
Region V (Bicol Region) 118.4 112.9 117.6
Region VI (Western Visayas) 114.8 108.4 113.8
Region VII (Central Visayas) 110.2 104.7 110.0
Region VIII (Eastern Visayas) 114.8 108.0 114.4
Region IX (Zamboanga Peninsula) 111.9 106.0 111.1 Region X (Northern Mindanao) 114.8 109.7 114.4
Region XI (Davao Region) 114.7 107.8 113.4
Region XII (SOCCSKSARGEN) 116.4 111.2 115.7
Region XIII (Caraga) 115.9 110.3 115.1 Bangsamoro Autonomous Region in Muslim Mindanao (BARMM) 112.5 109.9 112.2 Source: Philippine Statistics Authority Continued

17
Key Macro Economic and Social Indicators (Continued)
Indicator Latest
May 2022 Year ago
May 2021 Previous Apr 2022
Inflation Rate (2018=100)
Philippines 5.4 4.1 4.9
National Capital Region (NCR) 4.7 2.6 4.4 Cordillera Administrative Region (CAR) 6.9 2.8 6.3
Region I (Ilocos Region) 5.7 4.1 5.2
Region II (Cagayan Valley) 5.1 6.3 4.6
Region III (Central Luzon) 6.7 4.4 6.1
Region IV-A (CALABARZON) 5.1 5.1 4.7
MIMAROPA Region 5.3 5.4 4.1
Region V (Bicol Region) 4.9 7.1 4.2
Region VI (Western Visayas) 5.9 4.1 4.9
Region VII (Central Visayas) 5.3 2.3 5.4
Region VIII (Eastern Visayas) 6.3 4.3 6.1
Region IX (Zamboanga Peninsula) 5.6 3.0 4.5 Region X (Northern Mindanao) 4.6 5.1 4.6
Region XI (Davao Region) 6.4 3.5 5.3
Region XII (SOCCSKSARGEN) 4.7 5.4 4.2
Region XIII (Caraga) 5.1 4.7 4.4 Bangsamoro Autonomous Region in Muslim Mindanao (BARMM) 2.4 2.5 2.1 Source: Philippine Statistics Authority Continued

18
Key Macro Economic and Social Indicators (Continued)
Indicator Latest
April 2022p Year ago Apr 2021f
Previous Jan 2022p,1
Labor Force Participation Rate
Philippines 63.4 63.2 60.5
National Capital Region (NCR) 61.0 60.1 58.8 Cordillera Administrative Region (CAR) 66.2 64.2 65.0
Region I (Ilocos Region) 68.5 64.4 62.0
Region II (Cagayan Valley) 65.9 62.8 62.9
Region III (Central Luzon) 60.6 57.0 58.6
Region IV-A (CALABARZON) 64.9 64.8 62.2
MIMAROPA Region 63.5 69.1 62.8
Region V (Bicol Region) 62.3 60.1 58.4
Region VI (Western Visayas) 62.3 61.7 63.0
Region VII (Central Visayas) 66.1 67.2 60.0
Region VIII (Eastern Visayas) 60.0 62.3 58.0
Region IX (Zamboanga Peninsula) 60.4 67.1 60.0
Bangsamoro Autonomous Region in Muslim Mindanao (BARMM) 62.6 65.0 55.6 p – preliminary Continued f – final 1 - Preliminary estimate excludes Surigao del Norte and Dinagat Notes: 1. All estimates used the 2015 POPCEN-based Population Projection. 2. Details may not add up to totals due to rounding. Source: Philippine Statistics Authority
Region X (Northern Mindanao) 68.7 71.4 62.7
Region XI (Davao Region) 57.4 59.2 59.5
Region XII (SOCCSKSARGEN) 67.8 67.8 63.0
Region XIII (Caraga) 66.9 69.1 62.9

19
Key Macro Economic and Social Indicators (Continued)
Indicator Latest
Apr 2022p Year ago Apr 2021f
Previous Jan 2022p,1
Employment Rate (in percent)
Philippines 94.3 91.3 93.6
National Capital Region (NCR) 92.5 85.6 92.7 Cordillera Administrative Region (CAR) 95.6 94.0 94.8
Region I (Ilocos Region) 94.1 92.5 92.8
Region II (Cagayan Valley) 96.2 91.2 95.7
Region III (Central Luzon) 94.8 91.2 94.3
Region IV-A (CALABARZON) 93.2 86.6 92.6
MIMAROPA Region 94.8 94.1 93.5
Region V (Bicol Region) 93.8 93.0 92.2
Region VI (Western Visayas) 94.4 92.5 95.3
Region VII (Central Visayas) 94.8 91.8 92.0
Region VIII (Eastern Visayas) 94.0 95.0 93.0
Region IX (Zamboanga Peninsula) 97.1 96.7 95.0 Region X (Northern Mindanao) 95.9 94.5 94.9
Region XI (Davao Region) 96.2 95.8 95.2
Region XII (SOCCSKSARGEN) 94.6 95.2 95.6
Region XIII (Caraga) 95.9 94.2 94.5 Bangsamoro Autonomous Region in Muslim Mindanao (BARMM) 91.9 93.4 92.5 p – preliminary Continued f – final 1 - Preliminary estimate excludes Surigao del Norte and Dinagat Notes: 1. All estimates used the 2015 POPCEN-based Population Projection. 2. Details may not add up to totals due to rounding. Source: Philippine Statistics Authority

20
Key Macro Economic and Social Indicators (Continued)
Indicator Latest
Apr 2022p Year ago Apr 2021f
Previous Jan 2022p,1
Unemployment Rate (in percent)
Philippines 5.7 8.7 6.4
National Capital Region (NCR) 7.5 14.4 7.3 Cordillera Administrative Region (CAR) 4.4 6.0 5.2
Region I (Ilocos Region) 5.9 7.5 7.2
Region II (Cagayan Valley) 3.8 8.8 4.3
Region III (Central Luzon) 5.2 8.8 5.7
Region IV-A (CALABARZON) 6.8 13.4 7.4
MIMAROPA Region 5.2 5.9 6.5
Region V (Bicol Region) 6.2 7.0 7.8
Region VI (Western Visayas) 5.6 7.5 4.7
Region VII (Central Visayas) 5.2 8.2 8.0
Region VIII (Eastern Visayas) 6.0 5.0 7.0
Region IX (Zamboanga Peninsula) 2.9 3.3 5.0 Region X (Northern Mindanao) 4.1 5.5 5.1
Region XI (Davao Region) 3.8 4.2 4.8
Region XII (SOCCSKSARGEN) 5.4 4.8 4.4
Region XIII (Caraga) 4.1 5.8 5.5 Bangsamoro Autonomous Region in Muslim Mindanao (BARMM) 8.1 6.6 7.5 p – preliminary Continued f – final 1 - Preliminary estimate excludes Surigao del Norte and Dinagat Notes: 1. All estimates used the 2015 POPCEN-based Population Projection. 2. Details may not add up to totals due to rounding. Source: Philippine Statistics Authority

21
Key Macro Economic and Social Indicators (Continued)
Indicator Latest
Apr 2022p Year ago Apr 2021f
Previous Jan 2022p,1
Uderemployment Rate (in percent)
Philippines 14.0 17.2 14.9
National Capital Region (NCR) 7.0 15.5 9.0 Cordillera Administrative Region (CAR) 12.7 18.7 18.9
Region I (Ilocos Region) 16.0 17.7 14.7
Region II (Cagayan Valley) 15.1 15.3 19.9
Region III (Central Luzon) 7.6 9.6 9.4
Region IV-A (CALABARZON) 17.1 18.6 13.7
MIMAROPA Region 20.2 24.2 25.0
Region V (Bicol Region) 21.2 20.3 22.6
Region VI (Western Visayas) 16.4 21.6 17.0
Region VII (Central Visayas) 10.6 20.8 16.4
Region VIII (Eastern Visayas) 14.8 15.5 19.8
Region IX (Zamboanga Peninsula) 20.5 16.9 18.7 Region X (Northern Mindanao) 14.0 19.7 14.9
Region XI (Davao Region) 8.1 9.0 11.0
Region XII (SOCCSKSARGEN) 23.0 18.5 19.5
Region XIII (Caraga) 14.7 29.2 19.2 Bangsamoro Autonomous Region in Muslim Mindanao (BARMM) 18.0 11.5 12.6 p – preliminary Continued f – final 1 - Preliminary estimate excludes Surigao del Norte and Dinagat Notes: 1. All estimates used the 2015 POPCEN-based Population Projection. 2. Details may not add up to totals due to rounding. Source: Philippine Statistics Authority

22
Indicator 2022 Apr p
2022 Mar p
2022 Feb p
2022 Jan p,1
Total population 15 years
old and over 76,374 76,256 76,154 75,895 Labor Force 48,393 49,850 48,606 45,943 Employed 45,631 46,975 45,480 43,018 Worked less than 40 Hours (Part-time) (%) 35.7 33.8 32.9 30.3 Worked 40 hours and Over (Full-time) (%) 63.3 65.5 66.4 69.2 With a job but not at work (%) 1.0 0.7 0.7 0.5 Underemployed 6,399 7,422 6,382 6,397 Unemployed 2,762 2,875 3,126 2,925 Labor Force Participation Rate (%) 63.4 65.4 63.8 60.5 Employment Rate (%) 94.3 94.2 93.6 93.6 Underemployment Rate (%) 14.0 15.8 14.0 14.9 Unemployment Rate (%) 5.7 5.8 6.4 6.4
Continued
p – preliminary 1 - Preliminary estimate excludes Surigao del Norte and Dinagat Notes: 1. All estimates used the 2015 POPCEN-based Population Projection. 2. Details may not add up to totals due to rounding. Source: Philippine Statistics Authority, Labor Force Survey
Total Population 15 Years Old and Over and Employment Status, Philippines: Jan 2022-Apr 2022 (In thousands except rates) (Concluded)

23
Definitions: Labor Force - population 15 years old and over who are either employed or unemployed Employed - persons 15 years old and over who, during the reference week, were reported at work for at least an hour Unemployed - persons 15 years old and over without work or had no job/business, looking or seeking work, and available for work during the reference week Underemployed - employed persons who want additional hours of work in their present job, or to have additional job, or to have a new job with longer working hours Visibly Underemployed—underemployed persons who worked for less than 40 hours during the reference week Invisibly Underemployed - underemployed persons who worked for 40 hours or more during the reference week Employment Generation - year-on-year incremental change in employment. Visibly Underemployed - underemployed persons who worked for less than 40 hours during the reference week Invisibly Underemployed - underemployed persons who worked for 40 hours or more during the reference week Source: Philippine Statistics Authority


