Embed Size (px)
Citation preview
THIS REPORT CONTAINS ASSESSMENTS OF COMMODITY AND TRADE ISSUES MADE BY
USDA STAFF AND NOT NECESSARILY STATEMENTS OF OFFICIAL U.S. GOVERNMENT
POLICY
Date:
GAIN Report Number:
Approved By:
Prepared By:
Report Highlights:
Malaysia continues to be a net importer of food products with annual imports of more than $12 billion,
including consumer-oriented and fishery product imports of $4.9 billion. With per capita income of over
$8,180 and a middle and upper class making up 61 percent of the population, Malaysia shows good
potential for growth as a market for high value consumer products. Best U.S. product prospects include
fresh fruits and vegetables, pet foods, dried fruits, nuts, frozen potatoes and processed juices.
Loh Lee Pin
Chris P. Rittgers
2011
Exporter Guide
Malaysia
MY1015
12/30/2011
Required Report - public distribution
Post:
Executive Summary: SECTION I. MARKET OVERVIEW
Malaysia is politically and economically stable and open to foreign trade. Transportation,
communications, banking and health services are modern and efficient. With a population of around
28.5 million, it is one of the most developed nations in Southeast Asia. About 61 percent of its
population falls into the middle to upper income group of consumers; with GDP per capita income of
$8,180. Its economy has a firm foundation that includes strong manufacturing, service and agricultural
sectors. GDP growth will be about 5 percent in 2011. For 2012, Malaysian government officials have
maintained GDP growth projections of between five and six percent in view of the implementation of its
Economic Transformation Program (ETP). The ETP initiatives focus on a few key growth engines
which are expected to make substantial contributions to Malaysia’s economic performance and to
transform Malaysia into a high income nation by 2020. However, most research houses expect
Malaysia to grow between three and five per cent in 2012 due to weaker external demand.
The inflation rate for 2011 is expected to rise to 2.8 percent from 1.7 percent in 2010. Although prices
are expected to rise in view of the rising global commodity and food prices, inflation is however
expected to remain moderate going into 2012.
The Malaysian food and beverage market is becoming increasingly sophisticated and is supplied by
both local and imported products. The strong economic growth in the late 80's and early 90's contributed
to major changes in consumer purchases and consumption patterns. Malaysians living in urban areas are
relatively brand conscious, and they prefer to shop in stores, which offer them convenience and good
product selections. Hypermarkets/large format stores are now the dominant format in
urban/metropolitan areas in Malaysia with about 45 to 60 percent of urban household shoppers using
them as the main outlet for the majority of their packaged groceries. Traditional markets are losing
ground, but are still important outlets for fresh fruits and vegetables.
Author Defined:
Advantages and Challenges for U.S. Suppliers
Advantages
Challenges
Malaysia’s economy will continue to grow,
resulting in an increasing number of consumers
in the middle-income group demanding greater
variety and quality of foods consumed.
Though consumers are demanding greater
variety and quality in the foods consumed, they
are generally price sensitive towards purchases.
Thus retailers often purchase food items that are
more affordable to the majority of the
consumers.
Kuala Lumpur
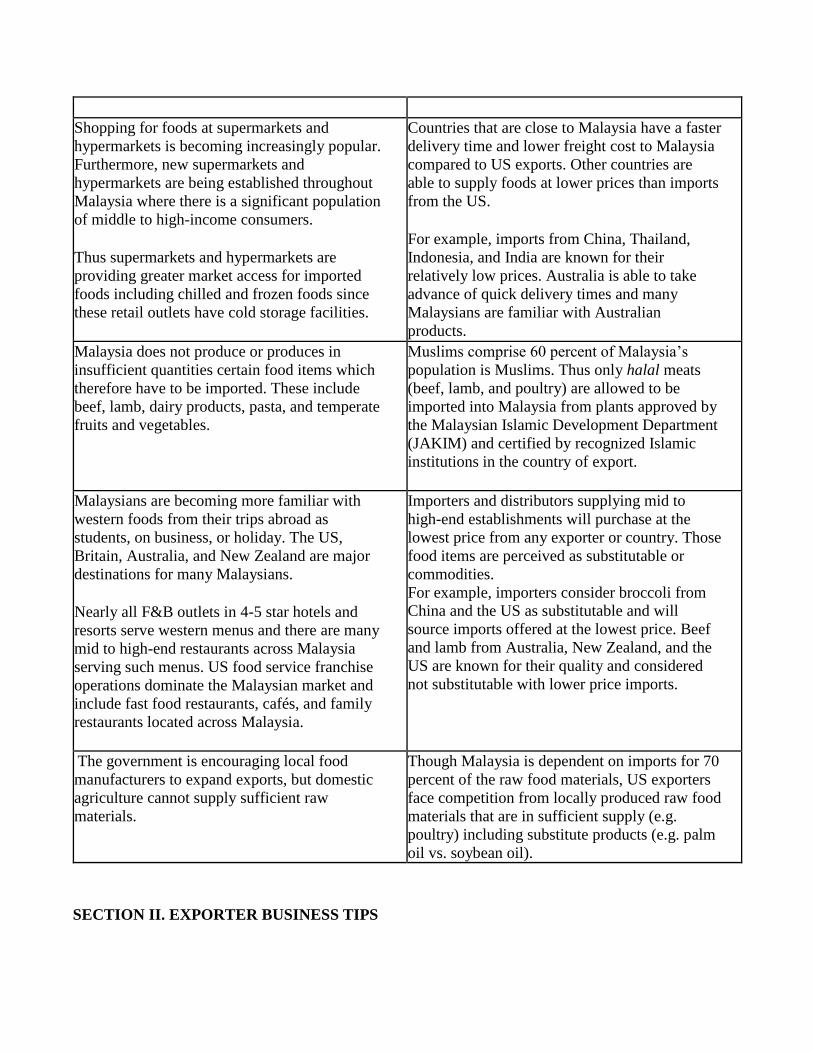
Shopping for foods at supermarkets and
hypermarkets is becoming increasingly popular.
Furthermore, new supermarkets and
hypermarkets are being established throughout
Malaysia where there is a significant population
of middle to high-income consumers.
Thus supermarkets and hypermarkets are
providing greater market access for imported
foods including chilled and frozen foods since
these retail outlets have cold storage facilities.
Countries that are close to Malaysia have a faster
delivery time and lower freight cost to Malaysia
compared to US exports. Other countries are
able to supply foods at lower prices than imports
from the US.
For example, imports from China, Thailand,
Indonesia, and India are known for their
relatively low prices. Australia is able to take
advance of quick delivery times and many
Malaysians are familiar with Australian
products.
Malaysia does not produce or produces in
insufficient quantities certain food items which
therefore have to be imported. These include
beef, lamb, dairy products, pasta, and temperate
fruits and vegetables.
Muslims comprise 60 percent of Malaysia’s
population is Muslims. Thus only halal meats
(beef, lamb, and poultry) are allowed to be
imported into Malaysia from plants approved by
the Malaysian Islamic Development Department
(JAKIM) and certified by recognized Islamic
institutions in the country of export.
Malaysians are becoming more familiar with
western foods from their trips abroad as
students, on business, or holiday. The US,
Britain, Australia, and New Zealand are major
destinations for many Malaysians.
Nearly all F&B outlets in 4-5 star hotels and
resorts serve western menus and there are many
mid to high-end restaurants across Malaysia
serving such menus. US food service franchise
operations dominate the Malaysian market and
include fast food restaurants, cafés, and family
restaurants located across Malaysia.
Importers and distributors supplying mid to
high-end establishments will purchase at the
lowest price from any exporter or country. Those
food items are perceived as substitutable or
commodities. For example, importers consider broccoli from
China and the US as substitutable and will
source imports offered at the lowest price. Beef
and lamb from Australia, New Zealand, and the
US are known for their quality and considered
not substitutable with lower price imports.
The government is encouraging local food
manufacturers to expand exports, but domestic
agriculture cannot supply sufficient raw
materials.
Though Malaysia is dependent on imports for 70
percent of the raw food materials, US exporters
face competition from locally produced raw food
materials that are in sufficient supply (e.g.
poultry) including substitute products (e.g. palm
oil vs. soybean oil).
SECTION II. EXPORTER BUSINESS TIPS
Business Customs Malaysians are accustomed to doing business with foreigners and readily accommodate foreign business
manners. Younger businessmen are prepared to start new business relationships with foreign companies
without the advantage of a personal meeting. These businessmen also prefer to communicate with
foreign suppliers electronically.
Prior to initiating any export sales to Malaysia, it would be advantageous to conduct a market survey
with particular reference to the competitive environment. It is common for foreign exporters to appoint a
local sales agent/importer to distribute their goods, expedite clearance of goods from ports and draw on
existing networks of wholesalers and retailers. Regular visits by U.S. exporters to the market are also
critical to enhance business relationships. General Consumer Tastes and Preferences Malaysia is a multiracial society consisting of three major races. The Malays account for 60 percent of
the population, with Islam as the official religion; slightly more than 20 percent of Malaysians are
Chinese who may be Buddhist or Christian. Indians form 7.1 percent of the population and they are
largely Hindus. There is also a sizeable expatriate population and Malaysia is a popular tourist
destination for Asia, the Middle East and Europe.
Lunch and dinner meals consist mainly of rice together with two or three meats/fish and vegetable
dishes that are prepared according to the styles and traditions of various ethnic communities. The
Malays and Indians prepare their dishes with hot spices while Chinese prefer to stir-fry. Religious
affiliation affects food consumption in Malaysia. Muslims do not eat pork, and only eat meat products
that have been certified halal, and many Buddhists and Hindus do not eat beef. Thus, halal chicken
meat is popular among all consumers and Malaysia has one of the world’s highest per capita
consumption rates at 35 kg.
With rising affluence and education levels, consumers’ shopping and eating lifestyles have changed
drastically over the years. Malaysians, especially in urban and cosmopolitan areas, prefer to shop in
modern retail outlets, which offer them one-stop shopping options. However, traditional stores such as
provision and grocery shops, which are conveniently located in residential areas and workplaces, are
still popular.
Malaysians are adventurous in their eating habits. Eating out is common and is relatively inexpensive.
Open air, street-stall food is popular. Fine dining restaurants and foodservice outlets incorporating
international cuisines are found in Klang Valley and other major cities where spending power and
population concentration are higher. Most consumers frequent this type of restaurants to dine in style
and comfort and to experience the best and most sophisticated culinary standards in the country.
With a Muslim population of 60 percent, the demand for halal foods by Malaysian consumers has
increased over the years. The expectation of halal standard in food products have extended from meat
and meat products to non meat-based products such snacks, confectionery, dairy, bakery, etc. Almost all
food and ingredients destined for the food service sector must be certified halal. Halal is fast becoming
recognized as a new benchmark for quality, hygiene and safety. Food products and ingredients that have
halal certificates have added marketing value in Malaysia. Hence, most retailers, foodservice operators
and food manufacturers are inclined to ask for halal certificates for non-meat based food products and

ingredients.
Food Standards and Regulations Malaysian health and food labeling requirements are fairly liberal. The labeling requirements specify
that imported and domestically produced processed food items must be labeled in English or Bahasa
Malaysia. Labels must contain the following information:
(a) An appropriate description of the product; (b) A list of ingredients in descending order of proportion by weight; if the item contains any animal product, a statement as to the presence of such animal products
(beef, pork, lard, gelatins, etc.,) (c) if the item contains any alcohol, a statement as to the presence of alcohol; (d) the minimum net weight of the product; in the case of a product packed in liquid, the minimum
drained weight of the food; (e) the name and address of the manufacturer; (f) the name and address of the importer (this can be affixed at the time of import); (g) a statement of shelf life or expiry dates.
Certain food additives, preservatives, and artificial colorings approved for use in the United States may
not be permitted in Malaysia. Codex approved items are generally allowed if there are no provisions or
regulations pertaining to the additives and preservatives in the Malaysian Food Regulation. In addition,
products with labels that include phrases such as “Contains No Palm Oil” or “Contains No Tropical
Oils” will not be allowed for import. (Malaysia is a palm oil producing country and is a strong advocate
of this commodity).
In addition to the general labeling requirements above, nutritional labeling is compulsory for the
following foods: prepared cereal foods; various types of bread; variety of milk and powdered milk,
including sweetened condensed milk, evaporated milk and cultured milk; canned meat; canned fish;
canned vegetable, canned fruit and various types of fruit juices, salad dressing and mayonnaise, various
types of soft drink including botanical drink, soya bean milk and soya bean drink. General Import and Inspection Procedures All food consignments are subject to random checking and sampling at the 34 entry points around the
country to ensure food items imported into the country are safe and comply with the prescribed
standards and regulations. All meat, poultry and dairy product shipments must be accompanied by
appropriate USDA documentation. International freight forwarders normally handle documentation and
other formalities with authorities at entry points. Provided all necessary documents are in order, no
problems or delays should occur in clearance of goods.
Halal requirement and certification All beef and poultry products must be certified halal and the products must originate from
slaughterhouses that have been inspected and approved by the Malaysian veterinary and religious
authorities. An Islamic Center approved by the Malaysian Islamic Development Department (JAKIM)
must supervise the slaughter and processing and issue the halal certificate for meat and poultry. The
Islamic Center must be listed by the packing plant on the original JAKIM application form or the
application must be appropriately amended to make use of a new Islamic Center.
U.S. exporters should also be aware that importers might request for additional certificates, which are
not required by the authority, either to meet the demand of their own customers or for marketing
purposes. For further processed food (which contains no meat), there is no known requirements for any
certificate, but exporters are encouraged to acquire halal certification from approved Islamic Centers
(http://www.halal.gov.my/v3/index.php/ms/senarai-badan-islam-yang-diiktiraf) to cater to the Muslim
consumer market as Muslims account for more than half of Malaysia’s population and Muslims
consume foods that are halal. The Halal Certificate should accompany the shipment and the products
should have the approved Islamic Center’s halal logo on their packaging for information and marketing
purposes.
SECTION III. MARKET SECTOR STRUCTURE AND TRENDS
Malaysia continues to be a net importer of food products with annual imports of more than $12 billion.
Food imports have been growing on an average of 23 percent per annum over the last few years and will
likely to grow at similar rates over the next five years
In 2010, the total imports of consumer-oriented and edible fishery products to Malaysia were estimated
at $4.9 billion. Total imports from the United States were $349 million, representing 7 percent market
share. China is the major supplier with imports at $998 million, representing 20 percent of the market
share. India took the second spot with imports worth of $572 million which is 12% of the market share,
followed by New Zealand (9%) and Australia (7%).
China is the main supplier of vegetables with reported imports at $242 million in 2010. Turnip, cabbage,
carrot, potato and garlic were among the major items. China is the market leader for mandarin oranges
($33 million), apples ($24 million) and pears ($19 million). Since the US and China are both in the
northern hemisphere with similar seasons, US exporters have to compete aggressively with Chinese
exporters who can sell their produce at lower prices. South Africa overtook China as the major supplier
of oranges with $10 million worth of imports. US Valencia oranges, apples and grapes are popular in
the Malaysian market. Imports for 2010 were at $16.6 million, $5.9 million and $5.6 million
respectively. Fresh strawberries, raspberries, blueberries and cranberries are niche markets and the U.S.
is a major supplier with imports worth $1 million annually. Competition is less intense with supplies
from Australia and South Africa since they have the opposite seasons.
By tradition, New Zealand is the most favored for dairy products followed by Australia. In 2010,
imports of full cream milk powder, skim milk powder, butter and cheeses from New Zealand were at
$321 million while imports from US overtook Australia, at $86 million and $85 million respectively.
US whey is finding a growing market with an increase of 65 per cent from 2009, estimated at $22
million.
India is the leading supplier of red meat market with total imports of $239 million (89,370 metric tons)
in 2010. Indian beef and buffalo meat caters to the mass market. In the foodservice sector, competition
for US beef comes from Australia and New Zealand, with total imports amounted to $49 million and
$10 million respectively in the same year. US beef is considered premium and is found only in high-end
foodservice outlets and restaurants serving Japanese, Korean and Western cuisines.
Malaysia is self-sufficient in poultry (broiler/eggs) production. Chicken parts and chicken wings are
imported periodically to meet the demand from the local processing industry. In 2010, China is the
major supplier for chicken parts and chicken wing at $51 million. Imports from Denmark and Thailand
were at $7 million respectively.
Malaysia is a net importer of fish and seafood products with an annual import at $724 million in 2010.
China is the main supplier with $242 million, followed by Indonesia ($121 million) and Thailand ($116
million).
An increasing number of middle to high income consumers in Malaysia demand high quality imported
exotic fish and seafood, especially live, and the bulk of these will be consumed in middle to high-end
Chinese seafood restaurants. Lobsters (Boston, Rock), abalone, oysters, scallops, clams (Razor, Blood,
Sea, Jacknife), green mussels, crabs (Snow, King, Blue Swimmer, Dungeness), prawns (Mantis),
geoduck, farmed sturgeon, razor fish, turbot, grouper, sea bass, bamboo fish, coral trout and carp are
popular.
High-end western restaurants and high-end hotels have a demand for premium fresh, chilled or frozen
products, such as salmon, cod, Dover sole, halibut as well as oysters, scallops, clams, lobsters, crabs and
alike. Most salmon imports (fresh/chilled, frozen and smoked) are distributed to these types of food
service outlets.
Supermarkets and hypermarkets are good for fresh chilled or frozen lobsters, crabs, large prawns,
mackerel, cod, salmon (included smoked), Hoki, Dori, mackerel, crab meat, mussels, scallops and
clams.
Opportunities exist for US fish and seafood exporters to develop their market presence in Malaysia by
supplying to these major businesses.
Distribution for consumer-ready food products Private companies are the major entities in the food distribution system. Food importers and
commissioned agents place orders with foreign suppliers and distribute to supermarkets/grocery stores
and hotels in the cities and to sundry shops in the rural areas. Several of the larger supermarket and
hypermarket chains are importing directly from overseas.
Most products from the United States enter through the ports of Klang, Penang and Johor.
Transshipment of food products through Singapore has declined with improvement in shipping facilities
offered by major ports in Malaysia. Westport, situated in Port Klang and the Port of Tanjung Pelepas (in
Johor) have further enhanced Malaysia as a shipping hub.
Malaysia has seven international airports, including the Kuala Lumpur International Airport (KLIA),
one of the biggest and most modern airports in the region. Malaysia’s modern highway network is the
backbone of the country’s transport system as 90% of passenger and cargo movements are by roads.
Roads link almost every town in Malaysia, and products move efficiently between cities and rural areas.
Food Retail Sector
Malaysia has a large and growing food retail market that is supplied by local and imported products.
The current total retail sales of food and beverages are estimated at US$11 billion. The forecast for this
sector is likely to grow by around 10 percent per annum over the next three to five years.
Malaysian households spend an average 24 percent of their household income on retail purchase of
foods. Due to rising affluence and higher education level, Malaysian consumers have become more
sophisticated and demand higher quality for the goods that they purchased.
According to Retail Group Malaysia, the bulk of retail food sales are channeled through the traditional
stores, such as provision stores, grocery stores, specialty food stores and other sundry shops. This sub-
sector commands close to 60 percent of food sales today. Modern stores such as supermarkets,
hypermarkets and department stores with supermarkets only have around 39 percent share of the retail
food market. Convenience stores have remained insignificant, with only about 1 percent share of the
retail food market.
Independent grocery stores and wet markets are found in the residential areas of both urban and rural
towns across Malaysia. Most of the food items sold by grocery stores are canned foods, dried foods,
snack foods, ice cream, and soft drinks. Fresh produces such as fruits and vegetables are seldom sold
and usually do not sell frozen or chilled foods other than ice cream. However, grocery stores known as
mini-markets, which are larger and more modern than the traditional grocery stores, would sell these
food items. However, they are relatively fewer in numbers compared to the traditional grocery stores.
Wet markets include daily wet markets operating in permanent buildings and weekly morning and night
markets operating in non-permanent locations. Food items sold are generally fresh fruits, vegetable,
meat and fish. Imports are usually apples, oranges, grapes, carrots, potatoes, onions, cabbages, and
broccoli.
Supermarkets and hypermarkets are mainly located in the major urban centers and are continuing to
grow in numbers. Foreign-owned retailers operating locally include Tesco, Carrefour, Dairy Farms
International (owns Giant), and Jaya Jusco. Supermarkets and hypermarkets will continue to see the
fastest growth over the next three years. These retail stores provide good venues for imported products
and access to the middle and high-income sophisticated consumers.
Competition among the retailers, especially hypermarkets, is intense with large international retailers
like Tesco, Giant and Carrefour frequently engaging in price wars to establish their presence as major
players in the market. Meanwhile, Giant, the largest hypermarket operator in Malaysia, is reported to
sacrifice profits in order to maintain the low-price leader status. Pressure is mounting for local retailers
such as The Store to maintain competitive prices and carry a good variety of products in order to keep
up with the international players.
A recent study conducted by a retail consultant in Malaysia showed that Malaysians are shopping more
at convenience stores and petrol marts. Increasing competition has resulted in a need for convenience
stores to become more professional. Customers are now expecting more sophisticated offers like a wider
range of better quality ready-to-eat snacks and hot-and-chilled beverages.
Key Entry Strategies for US Exporters
1. Market, distribute, and promote through the supermarkets and hypermarkets. 2. Promote food products to create consumer awareness and loyalty.
3. Appoint importers or agents that best meets the needs of the exporter.
4. Ensure that processed foods are acceptable to local taste and have appropriate packaging.
5. Acquire halal certification from recognized Islamic institution in the US.
Food Processing Sector
There are nearly 3,200 manufacturers involved in the food manufacturing industry in Malaysia and the
industry accounts for nearly 10 percent of Malaysia’s manufacturing output. Processed foods are
exported to 80 countries, with an annual export value of more than $2.6 billion. Food manufacturers
operating in Malaysia include both Malaysian and multinational companies such as Nestle, Unilever,
Cerebos, and Campbell Soup.
The Malaysian government has identified the food processing industry as a priority sector for industrial
development and increase exports. Malaysia’s Ministry of International Trade and Industries (MITI)
estimates the global market for halal foods (foods suitable for Muslim consumption) at US$560 billion
annually. Recognizing the potential of the halal food industry, the Malaysian Government aims to
become the Global Halal Hub by becoming a major producer of halal food and to be in the forefront of
marketing, certification and reference for halal food products.
With the emphasis given by the Government to promote Malaysia as an international halal hub, the
prospects for the halal food industry are promising. Malaysia also works closely with the Organization
of Islamic Conference (OIC) countries to promote the Malaysian Halal Standard (MS1500:2009) as the
benchmark for international standard for halal products. This is expected to further contribute to the
acceptance of Malaysia’s halal food products globally.
Big corporations such as Nestle and Tesco are known to work hand-in-hand with the government to
achieve the halal hub goal. Nestle has picked Malaysia as their global halal food production center and
exports halal products to more than 50 countries with export sales over $222 million in 2009.
Meanwhile, Tesco Malaysia has announced its plan to export $2.7 million worth of halal products from
Malaysia to Britain by 2011.
Changes in consumer lifestyle and government emphasis encouraging exports of processed foods from
Malaysia are the market drivers of the country’s food processing industry.
Malaysia’s rising per capita income and increasing urban population has encouraged consumers
to lead a more modern but busy lifestyle. Thus there is a trend towards meals that are convenient
to prepare or ready to eat. Consumers are also demanding more variety in their foods, becoming
accustomed to international cuisines including western foods, and also healthier foods, providing
new opportunities for food manufacturers.
An important trend affecting the local food processing industry is the establishment of new
supermarkets and hypermarkets throughout Malaysia. Shopping at these retails outlets is
becoming increasingly popular among consumers. These supermarkets and hypermarkets have
cold storage facilities to stock and display chilled and frozen foods. This provides opportunities
for food manufacturers to develop and market frozen and chilled processed foods.
Key Entry Strategies for US Exporters
1. Ensure quality of the raw food materials to instill manufacturers’ confidence. 2. Acquire halal certification to cater to the Muslim consumer market. 3. Emphasize on the competitive advantage of the exporter’s products to the food manufacturers. 4. Market and promote to increase awareness among food manufacturers. 5. Establish an efficient distribution network to maximize market penetration.
Food Service Sector
Malaysia has a sizeable and rapidly growing food service market today. Sources from the trade estimate
the food service market today is valued between $5 billion to $6 billion today. The food service market
has been growing at a rapid average rate of around 7 percent and 10 percent per annum over the next
three to five years. This positive forecast is due to growing sophistication and affluence among
consumers. Foodservice operators are constantly developing products and services to attract consumers.
Hotels and resorts, restaurants, and the institutional sub-sectors represent the best potential for US
exporters. The restaurant sub-sector accounted for 70 percent of the total food service sales in 2009.
This is followed by the hotels and resorts (8 percent) and catering services to institutions (5 percent).
Other sub-sectors include food stalls but are not a potential market for US exporters since they mainly
serve relatively cheap local dishes.
Malaysia’s tourism industry has also led towards the growth of the food service industry in Malaysia.
Tourism is an important revenue earner for the country. Currently it is the second largest foreign
exchange earner after manufacturing. The number of tourists visiting Malaysia rose 4.3 per cent to 24.6
million in 2010 from 23.6 million in 2009. Total tourism revenue generated was $18 billion. Of this,
food and beverage contributed 17.4%. For 2010, Tourism Malaysia projected tourist expenditure on
food and beverages to rise to 18.4% or $3.16 billion. With the current government’s effort to promote
Malaysia as a medical tourism hub, tourists’ arrivals are expected to grow in the coming years. The
growth in tourism is expected to fuel the growth of restaurants offering international cuisines such as
Middle Eastern and Latin American food.
High tariffs and excise taxes in alcoholic beverages are deterring the consumption of wine in the
foodservice sector. The taxes, known as sin tax, increase about 5 percent-10 percent every year.
Coupled with the high mark-ups on the wine by hotel and restaurant operators, the selling price of the
wines is exorbitant and this prohibits further consumption in foodservice outlets.
Key Entry Strategies for US Exporters
1. Conduct promotional activities to create awareness among importers and the food service
establishments. 2. Appoint local importers specialized in the food service industry to import and market the exporter’s
food products to the food service establishments. 3. Target the mid to high-end food service establishments. 4. Acquire halal certification from recognized Islamic institutions in the US. 5. Maintain a product positioning strategy for the food products.
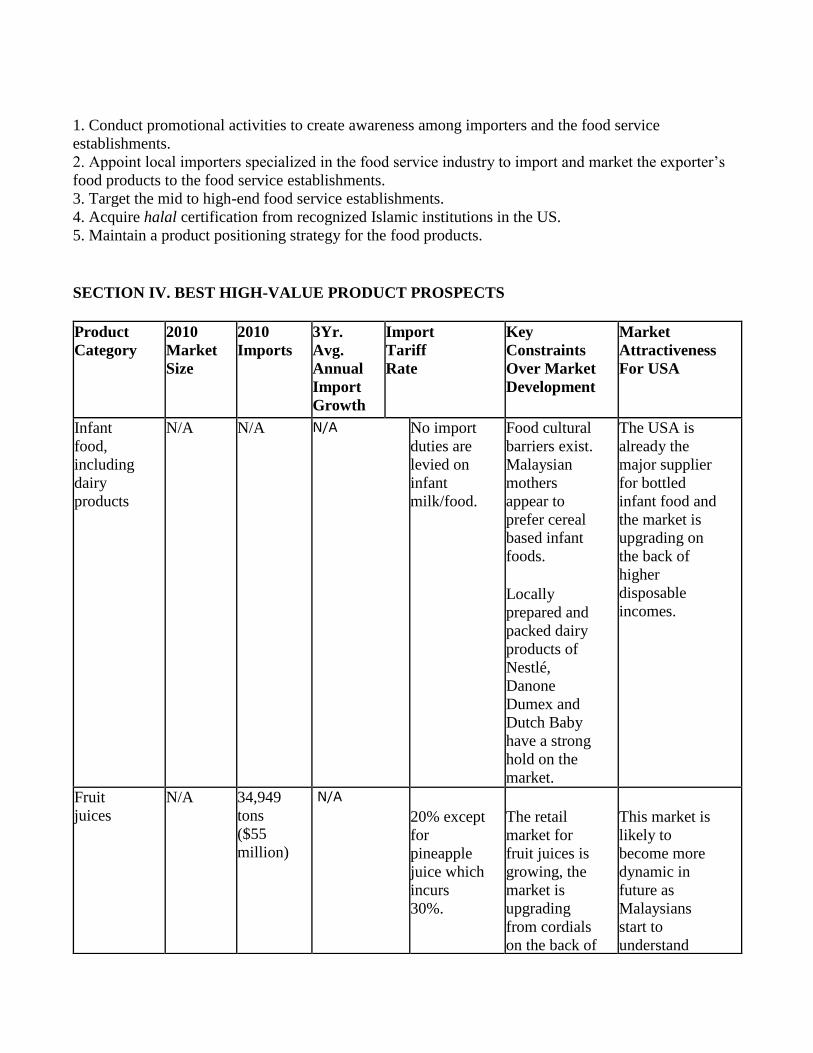
SECTION IV. BEST HIGH-VALUE PRODUCT PROSPECTS
Product
Category
2010 Market Size
2010 Imports
3Yr. Avg. Annual Import Growth
Import Tariff Rate
Key Constraints Over Market Development
Market Attractiveness For USA
Infant
food,
including
dairy
products
N/A N/A N/A No import
duties are
levied on
infant
milk/food.
Food cultural
barriers exist.
Malaysian
mothers
appear to
prefer cereal
based infant
foods.
Locally
prepared and
packed dairy
products of
Nestlé,
Danone
Dumex and
Dutch Baby
have a strong
hold on the
market.
The USA is
already the
major supplier
for bottled
infant food and
the market is
upgrading on
the back of
higher
disposable
incomes.
Fruit
juices
N/A 34,949 tons
($55
million)
N/A 20% except
for
pineapple
juice which
incurs
30%.
The retail
market for
fruit juices is
growing, the
market is
upgrading
from cordials
on the back of
This market is
likely to
become more
dynamic in
future as
Malaysians
start to
understand
higher
disposable
incomes.
these products.
Opportunities
will exist for
development by
the U.S. pure
juice suppliers.
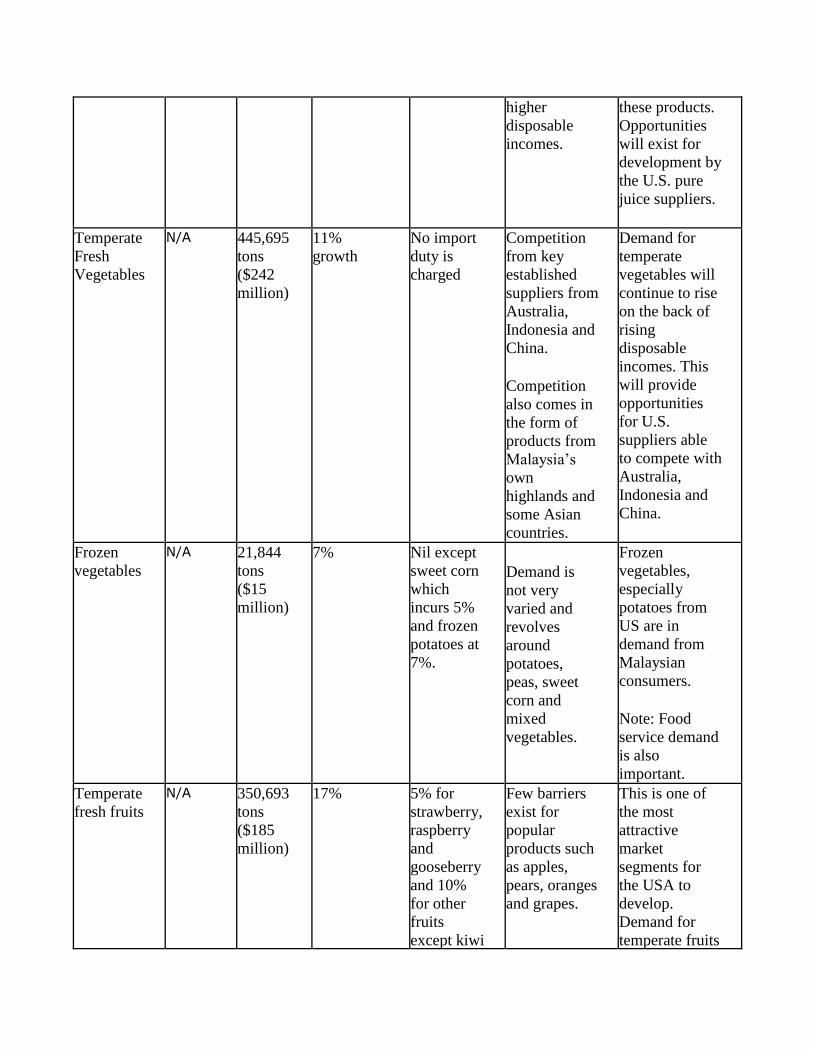
Temperate Fresh Vegetables
N/A 445,695 tons ($242 million)
11%
growth No import
duty is
charged
Competition
from key
established
suppliers from
Australia,
Indonesia and
China.
Competition
also comes in
the form of
products from
Malaysia’s
own
highlands and
some Asian
countries.
Demand for
temperate
vegetables will
continue to rise
on the back of
rising
disposable
incomes. This
will provide
opportunities
for U.S.
suppliers able
to compete with
Australia,
Indonesia and
China.
Frozen
vegetables N/A 21,844
tons
($15
million)
7% Nil except
sweet corn
which
incurs 5%
and frozen
potatoes at
7%.
Demand is
not very
varied and
revolves
around
potatoes,
peas, sweet
corn and
mixed
vegetables.
Frozen
vegetables,
especially
potatoes from
US are in
demand from
Malaysian
consumers.
Note: Food
service demand
is also
important.
Temperate
fresh fruits N/A 350,693
tons ($185 million)
17% 5% for
strawberry,
raspberry
and
gooseberry
and 10%
for other
fruits
except kiwi
Few barriers
exist for
popular
products such
as apples,
pears, oranges
and grapes.
This is one of
the most
attractive
market
segments for
the USA to
develop.
Demand for
temperate fruits
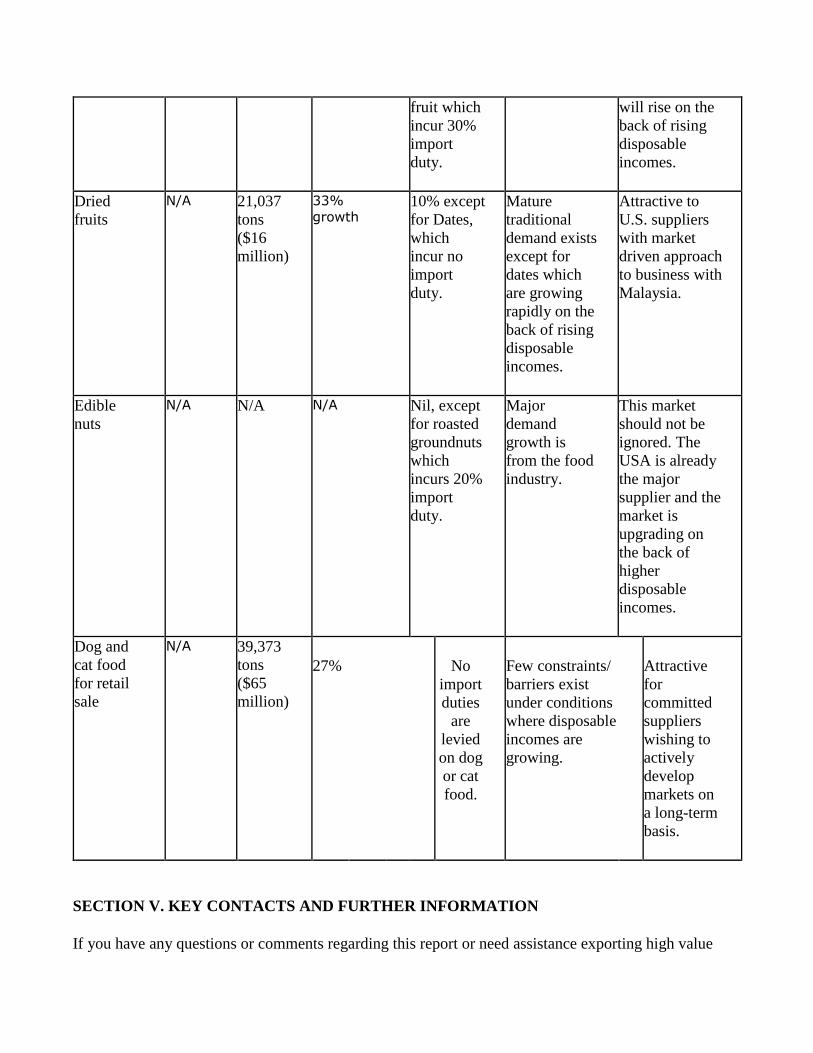
fruit which
incur 30%
import
duty.
will rise on the
back of rising
disposable
incomes.
Dried
fruits N/A 21,037
tons ($16
million)
33%
growth 10% except
for Dates,
which
incur no
import
duty.
Mature
traditional
demand exists
except for
dates which
are growing
rapidly on the
back of rising
disposable
incomes.
Attractive to
U.S. suppliers
with market
driven approach
to business with
Malaysia.
Edible
nuts N/A N/A N/A Nil, except
for roasted
groundnuts
which
incurs 20%
import
duty.
Major
demand
growth is
from the food
industry.
This market
should not be
ignored. The
USA is already
the major
supplier and the
market is
upgrading on
the back of
higher
disposable
incomes.
Dog and
cat food
for retail
sale
N/A 39,373
tons ($65
million)
27%
No
import
duties
are
levied
on dog
or cat
food.
Few constraints/
barriers exist
under conditions
where disposable
incomes are
growing.
Attractive
for
committed
suppliers
wishing to
actively
develop
markets on
a long-term
basis.
SECTION V. KEY CONTACTS AND FURTHER INFORMATION
If you have any questions or comments regarding this report or need assistance exporting high value
products to Malaysia, please contact the Office of Agricultural Affairs at the U.S. Embassy in Kuala
Lumpur at the following address:
Office of the Agricultural Affairs U.S. Embassy - Kuala Lumpur APO AP 96535-8152 Tel : (011-60-3) 2168-4985/2168-4884 Fax : (011-60-3) 2168-5023 email: [email protected]
For more information on exporting U.S. agricultural products to other countries, please visit the Foreign
Agricultural Service homepage: http://www.fas.usda.gov.
Malaysian Regulatory Agencies / Other Trade Contacts
Director Food Safety and Quality Division Ministry of Health Malaysia Level 3, Block E7, Parcel E Federal Government Administration Center Putrajaya 62518 Tel: +6-03-8883--3888 Fax: +6-03-8889-4971 http://fsis2.moh.gov.my/fosimv2/HOM/frmHOMPage.aspx
Director General of Customs Royal Customs and Excise Headquarters Malaysia Ministry of Finance Complex Precinct 2, Federal Government Administration Center 62596 Putrajaya. Tel : +(6-03) 8882 2100 Fax : +(6-03) 8889 5899 http://www.customs.gov.my
Director Veterinary Public Health Department of Veterinary Services, Wisma Tani, Podium Block, Lot 4G1, Prescinct 4, Putrajaya. Tel: +60-3 8870 2000 Fax: +60-3 8888 6051 Website: www.dvs.gov.my
APPENDIX 1. STATISTICS
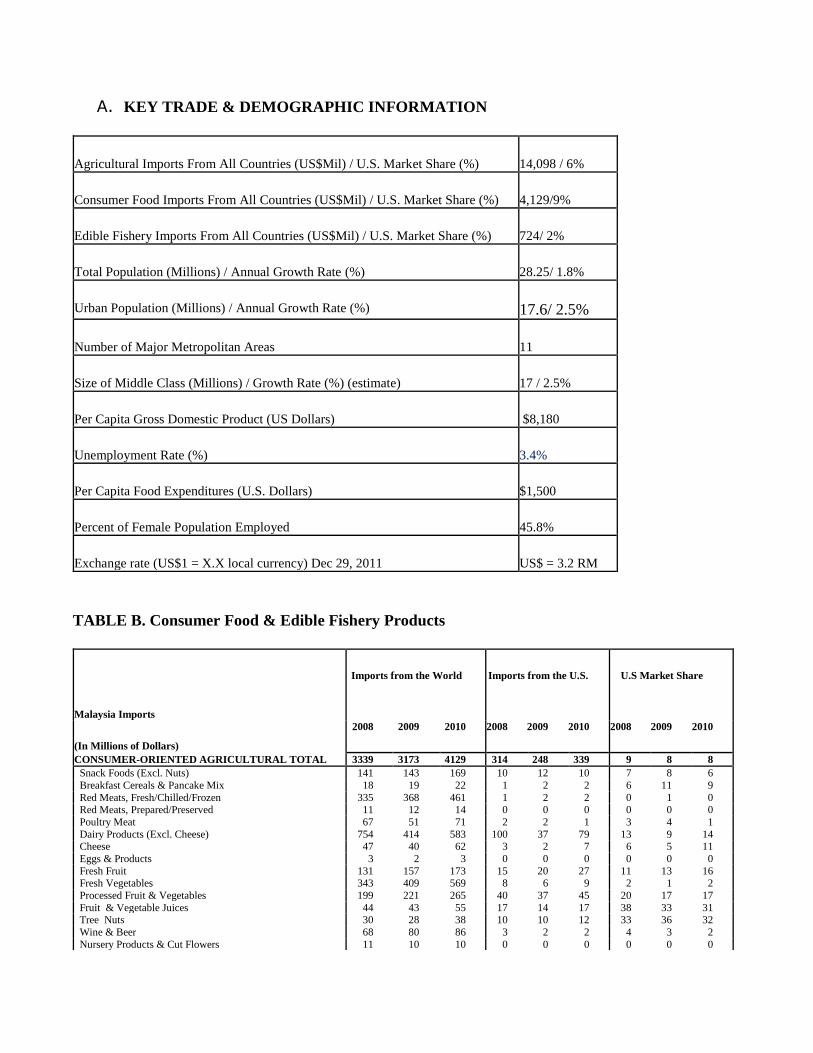
A. KEY TRADE & DEMOGRAPHIC INFORMATION
Agricultural Imports From All Countries (US$Mil) / U.S. Market Share (%)
14,098 / 6%
Consumer Food Imports From All Countries (US$Mil) / U.S. Market Share (%)
4,129/9%
Edible Fishery Imports From All Countries (US$Mil) / U.S. Market Share (%)
724/ 2%
Total Population (Millions) / Annual Growth Rate (%)
28.25/ 1.8%
Urban Population (Millions) / Annual Growth Rate (%)
17.6/ 2.5%
Number of Major Metropolitan Areas
11
Size of Middle Class (Millions) / Growth Rate (%) (estimate)
17 / 2.5%
Per Capita Gross Domestic Product (US Dollars)
$8,180
Unemployment Rate (%)
3.4%
Per Capita Food Expenditures (U.S. Dollars)
$1,500
Percent of Female Population Employed
45.8%
Exchange rate (US$1 = X.X local currency) Dec 29, 2011
US$ = 3.2 RM
TABLE B. Consumer Food & Edible Fishery Products
Malaysia Imports
Imports from the World
Imports from the U.S.
U.S Market Share
(In Millions of Dollars) 2008
2009
2010
2008
2009
2010
2008
2009
2010
CONSUMER-ORIENTED AGRICULTURAL TOTAL 3339 3173 4129 314 248 339 9 8 8 Snack Foods (Excl. Nuts) 141 143 169 10 12 10 7 8 6 Breakfast Cereals & Pancake Mix 18 19 22 1 2 2 6 11 9 Red Meats, Fresh/Chilled/Frozen 335 368 461 1 2 2 0 1 0 Red Meats, Prepared/Preserved 11 12 14 0 0 0 0 0 0 Poultry Meat 67 51 71 2 2 1 3 4 1 Dairy Products (Excl. Cheese) 754 414 583 100 37 79 13 9 14 Cheese 47 40 62 3 2 7 6 5 11 Eggs & Products 3 2 3 0 0 0 0 0 0 Fresh Fruit 131 157 173 15 20 27 11 13 16 Fresh Vegetables 343 409 569 8 6 9 2 1 2 Processed Fruit & Vegetables 199 221 265 40 37 45 20 17 17 Fruit & Vegetable Juices 44 43 55 17 14 17 38 33 31 Tree Nuts 30 28 38 10 10 12 33 36 32 Wine & Beer 68 80 86 3 2 2 4 3 2 Nursery Products & Cut Flowers 11 10 10 0 0 0 0 0 0
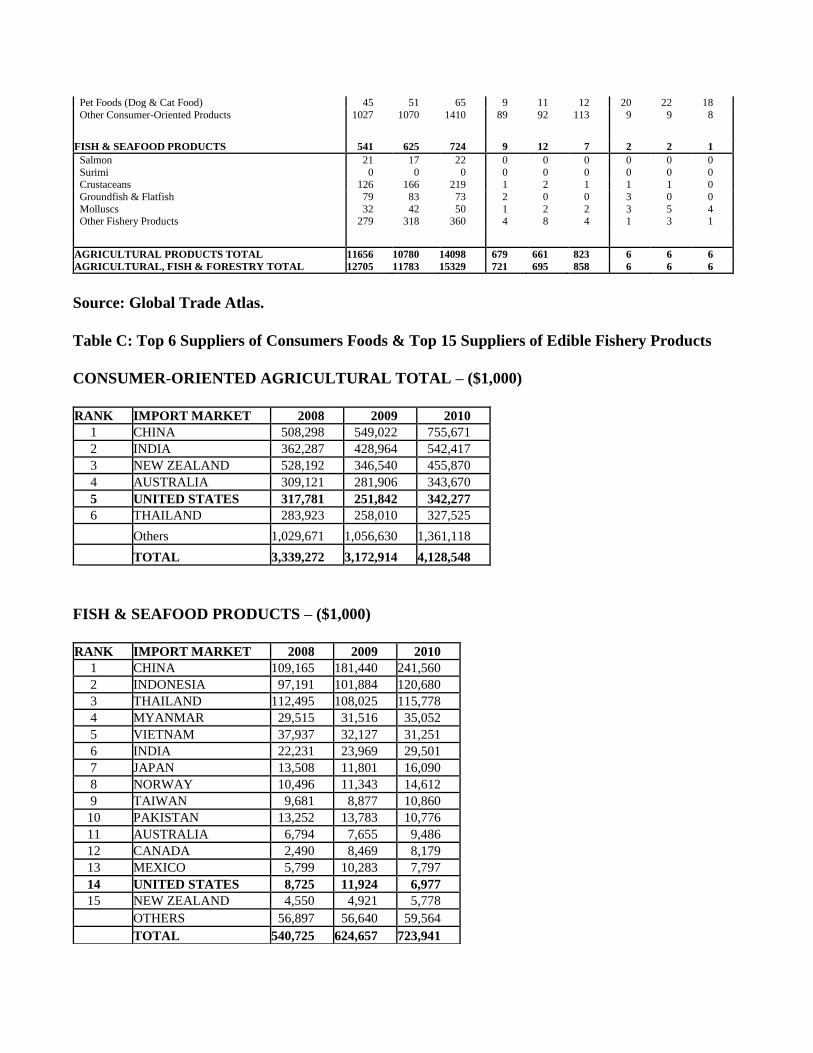
Pet Foods (Dog & Cat Food) 45 51 65 9 11 12 20 22 18 Other Consumer-Oriented Products 1027 1070 1410 89 92 113 9 9 8 FISH & SEAFOOD PRODUCTS 541 625 724 9 12 7 2 2 1 Salmon 21 17 22 0 0 0 0 0 0 Surimi 0 0 0 0 0 0 0 0 0 Crustaceans 126 166 219 1 2 1 1 1 0 Groundfish & Flatfish 79 83 73 2 0 0 3 0 0 Molluscs 32 42 50 1 2 2 3 5 4 Other Fishery Products 279 318 360 4 8 4 1 3 1 AGRICULTURAL PRODUCTS TOTAL 11656 10780 14098 679 661 823 6 6 6 AGRICULTURAL, FISH & FORESTRY TOTAL 12705 11783 15329 721 695 858 6 6 6
Source: Global Trade Atlas.
Table C: Top 6 Suppliers of Consumers Foods & Top 15 Suppliers of Edible Fishery Products
CONSUMER-ORIENTED AGRICULTURAL TOTAL – ($1,000)
RANK IMPORT MARKET 2008 2009 2010
1 CHINA 508,298 549,022 755,671 2 INDIA 362,287 428,964 542,417 3 NEW ZEALAND 528,192 346,540 455,870 4 AUSTRALIA 309,121 281,906 343,670 5 UNITED STATES 317,781 251,842 342,277 6 THAILAND 283,923 258,010 327,525
Others 1,029,671 1,056,630 1,361,118
TOTAL 3,339,272 3,172,914 4,128,548
FISH & SEAFOOD PRODUCTS – ($1,000)
RANK IMPORT MARKET 2008 2009 2010
1 CHINA 109,165 181,440 241,560 2 INDONESIA 97,191 101,884 120,680 3 THAILAND 112,495 108,025 115,778 4 MYANMAR 29,515 31,516 35,052 5 VIETNAM 37,937 32,127 31,251 6 INDIA 22,231 23,969 29,501 7 JAPAN 13,508 11,801 16,090 8 NORWAY 10,496 11,343 14,612 9 TAIWAN 9,681 8,877 10,860 10 PAKISTAN 13,252 13,783 10,776 11 AUSTRALIA 6,794 7,655 9,486 12 CANADA 2,490 8,469 8,179 13 MEXICO 5,799 10,283 7,797 14 UNITED STATES 8,725 11,924 6,977 15 NEW ZEALAND 4,550 4,921 5,778
OTHERS 56,897 56,640 59,564 TOTAL 540,725 624,657 723,941

Source: Global Trade Atlas.
END OF REPORT


