Embed Size (px)
Citation preview
THIS REPORT CONTAINS ASSESSMENTS OF COMMODITY AND TRADE ISSUES MADE BY
USDA STAFF AND NOT NECESSARILY STATEMENTS OF OFFICIAL U.S. GOVERNMENT
POLICY
Date:
GAIN Report Number:
Approved By:
Prepared By:
Report Highlights:
Russia’s economy in 2013 grew 1.3 percent compared to 3.4 percent in 2012. Nevertheless, retail sales
grew 3.9 percent in 2013 and amounted to 744 billion USD. Sales of food accounted for 47 percent of
total retail sales in Russia in 2013 versus 46.6 percent in 2012. U.S. agricultural exports to Russia in
2013 totaled 1.6 billion USD – down by 21 percent compared to 2012 due to the Russian government’s
restriction placed on U.S. beef and pork in February 2013. The United States was the eighth largest
supplier to Russia in 2013 by value of agricultural, fish and forestry products and there are opportunities
to increase exports to this market particularly of live animals, fish and seafood products, tree nuts, fresh
and dried fruits, food preparations/ingredients and pet food. The Russian middle class stands at about
100 million fueling consumer purchasing power.
ATO Moscow Staff
Erik W. Hansen
Retail Sales Grow While Russian Economy Slows
Exporter Guide
Russian Federation
RSATO015
7/31/2014
Required Report - public distribution
Post:
Author Defined:
SECTION I. MARKET OVERVIEW
The Russian consumer market is the largest in Eastern Europe by the country’s vast size and population
of 143 million people who are potential customers. Russia is the world’s 9th largest economy in terms
of nominal Gross Domestic Product (GDP). And even though Russia was not ranked as an ideal country
in which to do business (94 out of 185 in 2013), growth was strong in past years due to rising incomes
and increasing middle class. However, domestic demand weakened in 2013, disrupted by high inflation
and interest rates, and Russia’s economy has slowed after three years of robust growth.
According to official statistics, Russia’s economy in 2013 grew 1.3 percent compared to 3.4 percent in
2012 and totaled 2.1 trillion USD (2 trillion USD in 2012). A detailed breakdown shows that growth in
the consumer sector remained relatively strong, with the financial services sector up to 11.5 percent
year-on-year. However, in comparison, the construction and gas sectors saw negative year-on-year
growth in 2013. Wholesale and retail trade as a part of GDP showed 1.1 percent growth in 2013.
Experts estimate the GDP to grow by 1.5 percent to 1.8 percent in 2014.
In 2013, retail sales in Russia amounted to 744 billion USD or up 3.9 percent year-on-year, according to
the Russian Federal Statistics Service (Rosstat). Sales of food including alcohol and tobacco accounted
for 47 percent of total retail sales in Russia in 2013 versus 46.6 percent in 2012. Foodservice sales grew
by 4 percent and totaled 36 billion USD. Real disposable income was up 3.3 percent in 2013. The
average monthly wage remained strong in 2013 at 12.3 percent growth and totaled 940 USD.
Unemployment in Russia continues to decline and stood at 5.5 percent in 2013 (5.7 in 2012). The
number of people living below the poverty line in Russia decreased to 17.8 million of people in the first
nine months of 2013 (17.2 in Jan-Nov, 2012) and accounted about 12.6 percent of the total population.
Russian consumers have increased their savings levels as the economic environment has improved
alongside disposable incomes. The savings ratio more than doubled from 6.7 percent of disposable
income in 2000 to 13.4 percent in 2013, according to Euromonitor International.
The Russian middle class stands at about 100 million people fueling consumer purchasing power. This
segment of the population is projected to rise 16 percent between now and 2020, at which point it is
expected to represent 86 percent of the population and amount to 1.3 trillion USD in spending -- up to
40 percent from 2010, based on a global study of the emerging middle class and related databases by
Dr. Homi Kharas of The Brookings Institution. While the top 20 percent of income earners in Russia
represent 47 percent of the country’s total income, the middle 60 percent accounts for 48 percent,
according to state statistics from The Bank of Russia (2013). The bottom 20 percent comprise the
remaining five percent of income (Source: Nielsen research, 2013). European Russia, geographically west of the Urals, is home to over 75 percent of the total population
(143 million people). 74 percent of Russians in 2013 lived in urban areas and over 8 percent of the total
population lived in either Moscow (12 million people) or St. Petersburg (5 million people). There are
fifteen cities in Russia (e.g. Novosibirsk, Yekaterinburg, Nizhniy Novgorod, etc.) with a population of
Moscow ATO
more than one million people. More than 30 million people (22 percent) of the population live in these
cities which also represent the largest retail and Hotel/Restaurant/Institutional (HRI) markets in the
country.
Table 1. Russia – Economic Activity, 2009-2013
2009 2010 2011 2012 2013
Nominal GDP, billion dollars 1,293 1,474 1,860 2,007 2,098
Real GDP growth, % change y-o-y -7.9 4.0 4.3 3.4 1.3
GDP per capita, US$ 8,682 10,315 16,700 17,687 14,584
Population, millions 141.9 141.9 142.96 143.1 143.5
Unemployment, % 8.2 7.5 6.6 5.7 5.5
Inflation, % 8.8 8.8 6.1 6.6 6.5
Exchange rate (per $1) 31.76 30.36 29.35 31.07 31.82 Source: Federal State Statistics Service, The Central Bank of Russian Federation, 2014
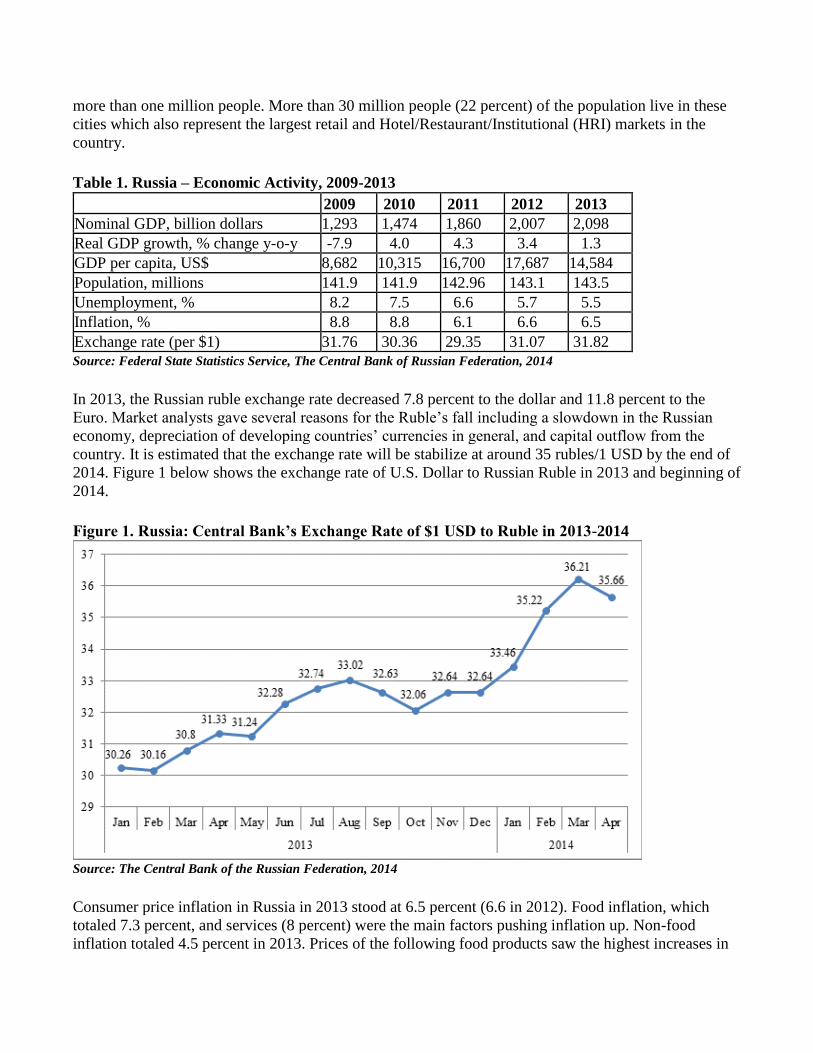
In 2013, the Russian ruble exchange rate decreased 7.8 percent to the dollar and 11.8 percent to the
Euro. Market analysts gave several reasons for the Ruble’s fall including a slowdown in the Russian
economy, depreciation of developing countries’ currencies in general, and capital outflow from the
country. It is estimated that the exchange rate will be stabilize at around 35 rubles/1 USD by the end of
2014. Figure 1 below shows the exchange rate of U.S. Dollar to Russian Ruble in 2013 and beginning of
2014.
Figure 1. Russia: Central Bank’s Exchange Rate of $1 USD to Ruble in 2013-2014
Source: The Central Bank of the Russian Federation, 2014
Consumer price inflation in Russia in 2013 stood at 6.5 percent (6.6 in 2012). Food inflation, which
totaled 7.3 percent, and services (8 percent) were the main factors pushing inflation up. Non-food
inflation totaled 4.5 percent in 2013. Prices of the following food products saw the highest increases in
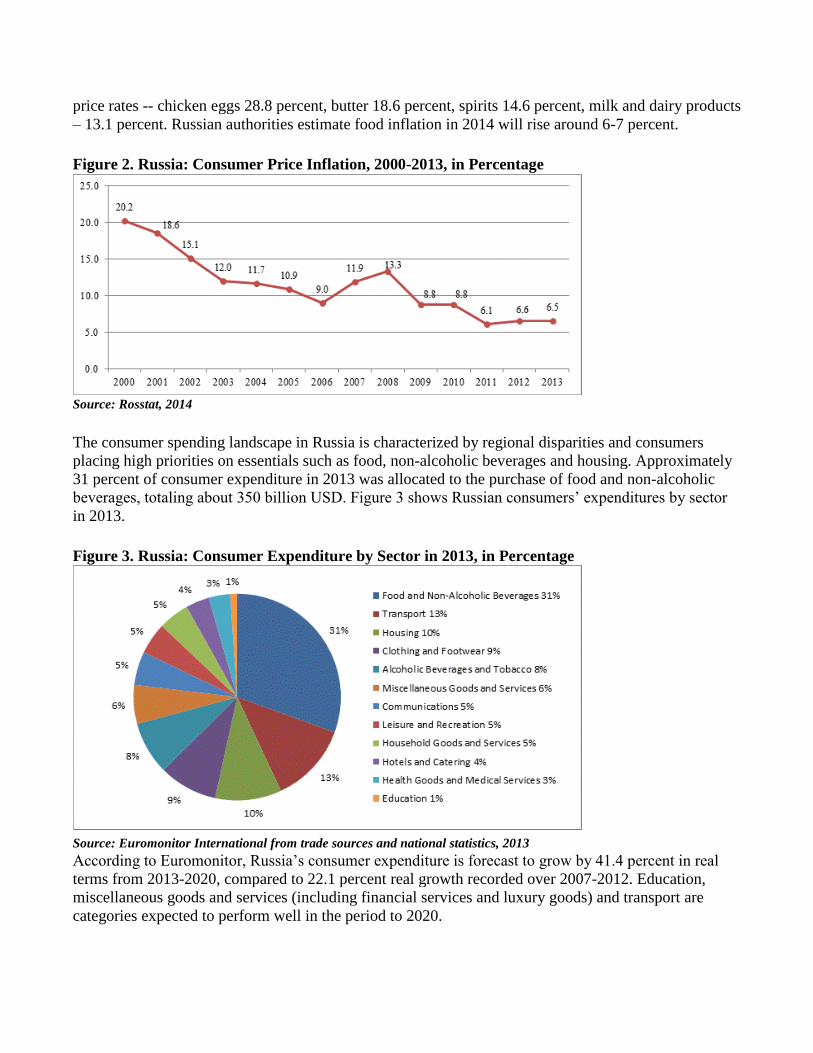
price rates -- chicken eggs 28.8 percent, butter 18.6 percent, spirits 14.6 percent, milk and dairy products
– 13.1 percent. Russian authorities estimate food inflation in 2014 will rise around 6-7 percent.
Figure 2. Russia: Consumer Price Inflation, 2000-2013, in Percentage
Source: Rosstat, 2014
The consumer spending landscape in Russia is characterized by regional disparities and consumers
placing high priorities on essentials such as food, non-alcoholic beverages and housing. Approximately
31 percent of consumer expenditure in 2013 was allocated to the purchase of food and non-alcoholic
beverages, totaling about 350 billion USD. Figure 3 shows Russian consumers’ expenditures by sector
in 2013.
Figure 3. Russia: Consumer Expenditure by Sector in 2013, in Percentage
Source: Euromonitor International from trade sources and national statistics, 2013
According to Euromonitor, Russia’s consumer expenditure is forecast to grow by 41.4 percent in real
terms from 2013-2020, compared to 22.1 percent real growth recorded over 2007-2012. Education,
miscellaneous goods and services (including financial services and luxury goods) and transport are
categories expected to perform well in the period to 2020.
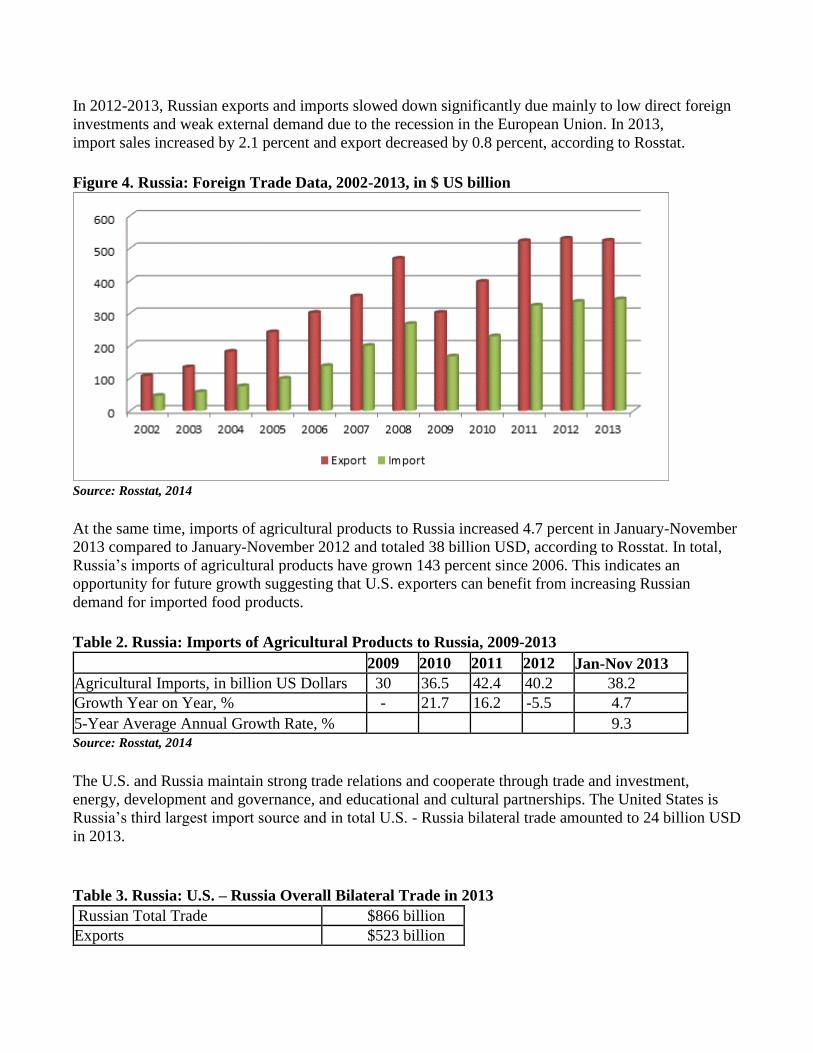
In 2012-2013, Russian exports and imports slowed down significantly due mainly to low direct foreign
investments and weak external demand due to the recession in the European Union. In 2013,
import sales increased by 2.1 percent and export decreased by 0.8 percent, according to Rosstat.
Figure 4. Russia: Foreign Trade Data, 2002-2013, in $ US billion
Source: Rosstat, 2014
At the same time, imports of agricultural products to Russia increased 4.7 percent in January-November
2013 compared to January-November 2012 and totaled 38 billion USD, according to Rosstat. In total,
Russia’s imports of agricultural products have grown 143 percent since 2006. This indicates an
opportunity for future growth suggesting that U.S. exporters can benefit from increasing Russian
demand for imported food products.
Table 2. Russia: Imports of Agricultural Products to Russia, 2009-2013
2009 2010 2011 2012 Jan-Nov 2013
Agricultural Imports, in billion US Dollars 30 36.5 42.4 40.2 38.2
Growth Year on Year, % - 21.7 16.2 -5.5 4.7
5-Year Average Annual Growth Rate, % 9.3 Source: Rosstat, 2014
The U.S. and Russia maintain strong trade relations and cooperate through trade and investment,
energy, development and governance, and educational and cultural partnerships. The United States is
Russia’s third largest import source and in total U.S. - Russia bilateral trade amounted to 24 billion USD
in 2013.
Table 3. Russia: U.S. – Russia Overall Bilateral Trade in 2013
Russian Total Trade $866 billion
Exports $523 billion
Imports $343 billion
Trade Balance Plus $180 billion
U.S.-Russia Total Bilateral Trade $24 billion
Exports from Russia to U.S. $8 billion
Imports to Russia from U.S. $16 billion
Passive Trade Balance Minus $8 billion
U.S.-Russia Ag. Bilateral Trade* $1.8 billion
Exports from Russia to U.S. $0.2 billion
Imports to Russia from U.S. $1.6 billion
Trade Balance Minus $1.4 billion Source: Rosstat, Global Trade Atlas, 2013 * Agricultural, Fish and Forestry Products
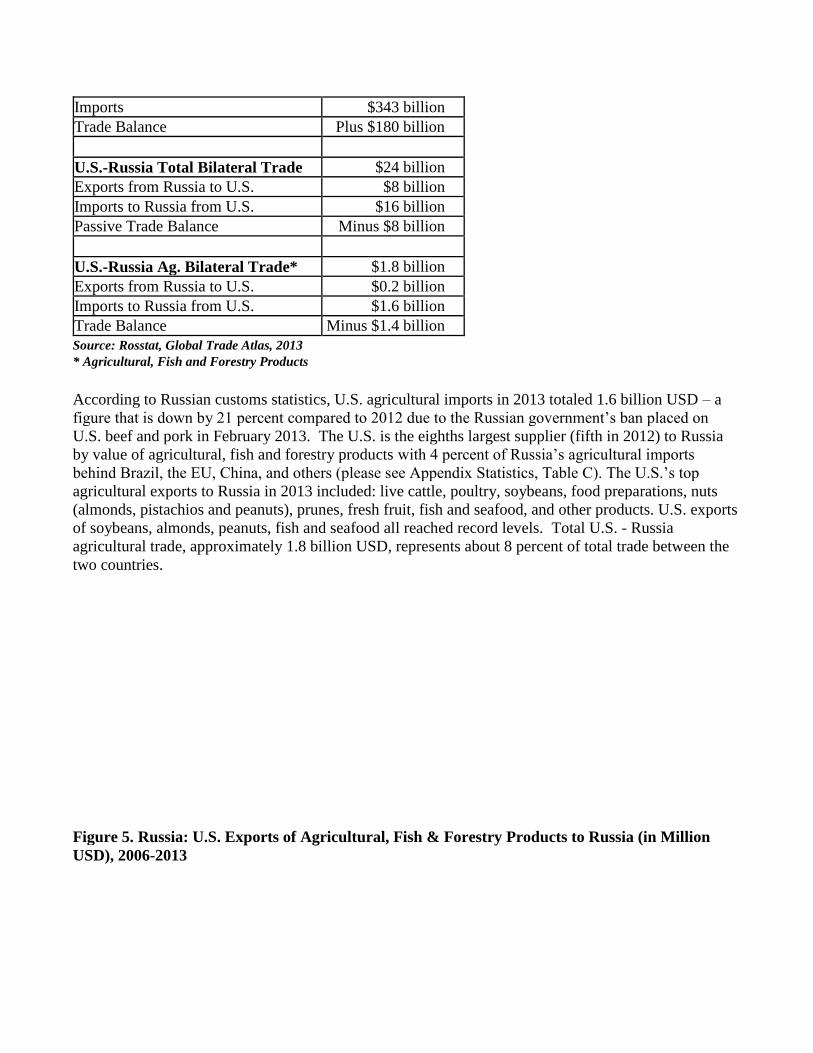
According to Russian customs statistics, U.S. agricultural imports in 2013 totaled 1.6 billion USD – a
figure that is down by 21 percent compared to 2012 due to the Russian government’s ban placed on
U.S. beef and pork in February 2013. The U.S. is the eighths largest supplier (fifth in 2012) to Russia
by value of agricultural, fish and forestry products with 4 percent of Russia’s agricultural imports
behind Brazil, the EU, China, and others (please see Appendix Statistics, Table C). The U.S.’s top
agricultural exports to Russia in 2013 included: live cattle, poultry, soybeans, food preparations, nuts
(almonds, pistachios and peanuts), prunes, fresh fruit, fish and seafood, and other products. U.S. exports
of soybeans, almonds, peanuts, fish and seafood all reached record levels. Total U.S. - Russia
agricultural trade, approximately 1.8 billion USD, represents about 8 percent of total trade between the
two countries.
Figure 5. Russia: U.S. Exports of Agricultural, Fish & Forestry Products to Russia (in Million
USD), 2006-2013
Source: Global Trade Atlas.
U.S. suppliers of a wide variety of products and services are active in the Russian market. The Russian
chapter of the American Chamber of Commerce includes more than 850 members successfully
operating in Russia. Among them are such American companies as Kraft, Mars, DuPont, Wrigley,
Cargill, PepsiCo and many others. Moscow has been ranked as the third most attractive city for
international retailers after London and Paris, according to a survey of 150 leading international retailers
in 55 countries in Europe conducted by Jones Lang LaSalle.
Russian companies are raising their game in order to compete for customers. For some staple products,
domestic production meets local demand. Certain imported food and agricultural products have
difficulty competing with domestic products due to the high cost of foreign exchange, high import
duties and/or difficult regulatory framework and generally efficient production of unsophisticated food
products. Successful imports tend to be those that add to the variety of foods available on the market
and those that are not grown in the country or for which domestic production is insufficient to meet
domestic demand. Exporters should review some of the advantages and challenges of the Russian
market (please see Table 4 below) when considering their marketing strategy.
Table 4. Russia: Advantages and Challenges for U.S. Exporters
Advantages Challenges Population of 143 million people who are potential The relatively low purchasing power of many
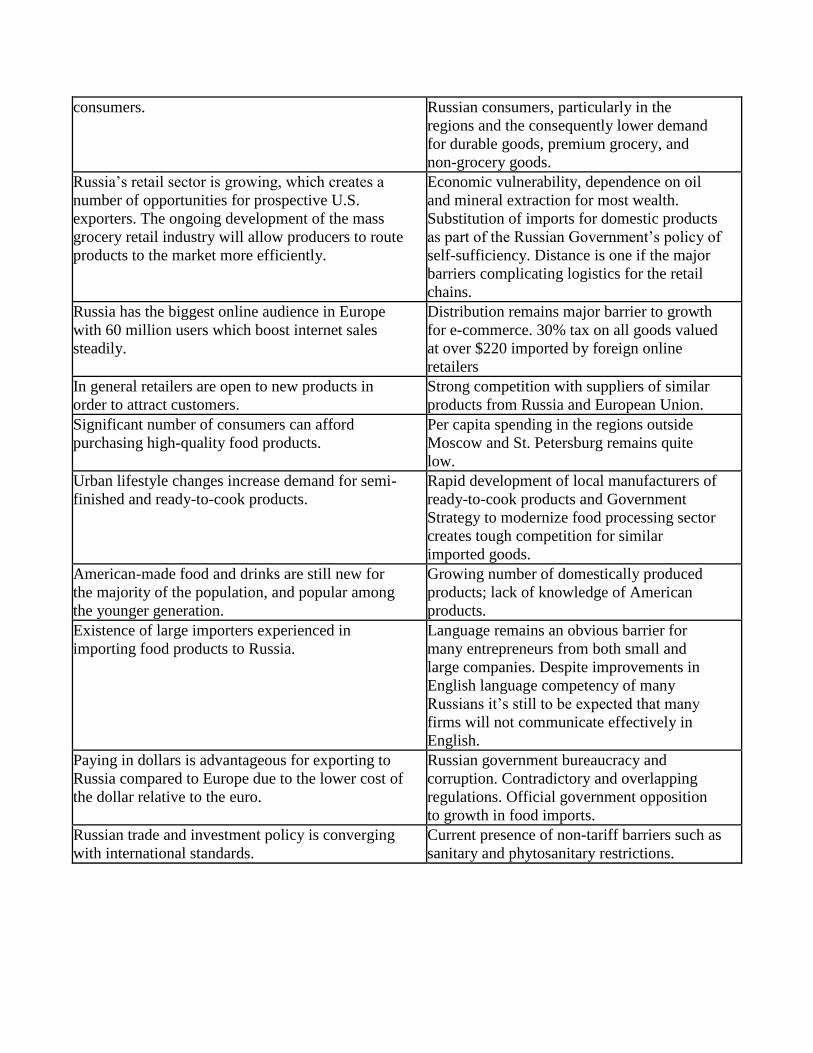
consumers. Russian consumers, particularly in the
regions and the consequently lower demand
for durable goods, premium grocery, and
non-grocery goods.
Russia’s retail sector is growing, which creates a
number of opportunities for prospective U.S.
exporters. The ongoing development of the mass
grocery retail industry will allow producers to route
products to the market more efficiently.
Economic vulnerability, dependence on oil
and mineral extraction for most wealth.
Substitution of imports for domestic products
as part of the Russian Government’s policy of
self-sufficiency. Distance is one if the major
barriers complicating logistics for the retail
chains.
Russia has the biggest online audience in Europe
with 60 million users which boost internet sales
steadily.
Distribution remains major barrier to growth
for e-commerce. 30% tax on all goods valued
at over $220 imported by foreign online
retailers
In general retailers are open to new products in
order to attract customers. Strong competition with suppliers of similar
products from Russia and European Union.
Significant number of consumers can afford
purchasing high-quality food products. Per capita spending in the regions outside
Moscow and St. Petersburg remains quite
low.
Urban lifestyle changes increase demand for semi-
finished and ready-to-cook products. Rapid development of local manufacturers of
ready-to-cook products and Government
Strategy to modernize food processing sector
creates tough competition for similar
imported goods.
American-made food and drinks are still new for
the majority of the population, and popular among
the younger generation.
Growing number of domestically produced
products; lack of knowledge of American
products.
Existence of large importers experienced in
importing food products to Russia. Language remains an obvious barrier for
many entrepreneurs from both small and
large companies. Despite improvements in
English language competency of many
Russians it’s still to be expected that many
firms will not communicate effectively in
English.
Paying in dollars is advantageous for exporting to
Russia compared to Europe due to the lower cost of
the dollar relative to the euro.
Russian government bureaucracy and
corruption. Contradictory and overlapping
regulations. Official government opposition
to growth in food imports.
Russian trade and investment policy is converging
with international standards. Current presence of non-tariff barriers such as
sanitary and phytosanitary restrictions.
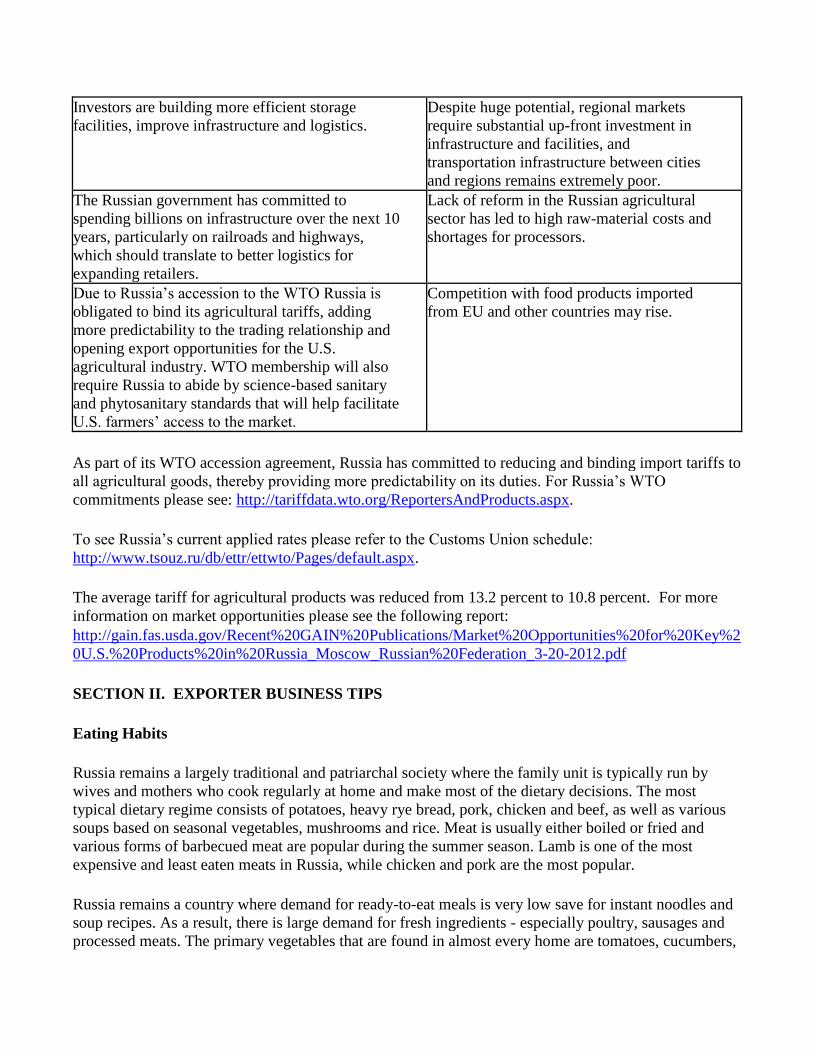
Investors are building more efficient storage
facilities, improve infrastructure and logistics. Despite huge potential, regional markets
require substantial up-front investment in
infrastructure and facilities, and
transportation infrastructure between cities
and regions remains extremely poor.
The Russian government has committed to
spending billions on infrastructure over the next 10
years, particularly on railroads and highways,
which should translate to better logistics for
expanding retailers.
Lack of reform in the Russian agricultural
sector has led to high raw-material costs and
shortages for processors.
Due to Russia’s accession to the WTO Russia is
obligated to bind its agricultural tariffs, adding
more predictability to the trading relationship and
opening export opportunities for the U.S.
agricultural industry. WTO membership will also
require Russia to abide by science-based sanitary
and phytosanitary standards that will help facilitate
U.S. farmers’ access to the market.
Competition with food products imported
from EU and other countries may rise.
As part of its WTO accession agreement, Russia has committed to reducing and binding import tariffs to
all agricultural goods, thereby providing more predictability on its duties. For Russia’s WTO
commitments please see: http://tariffdata.wto.org/ReportersAndProducts.aspx.
To see Russia’s current applied rates please refer to the Customs Union schedule:
http://www.tsouz.ru/db/ettr/ettwto/Pages/default.aspx.
The average tariff for agricultural products was reduced from 13.2 percent to 10.8 percent. For more
information on market opportunities please see the following report: http://gain.fas.usda.gov/Recent%20GAIN%20Publications/Market%20Opportunities%20for%20Key%2
0U.S.%20Products%20in%20Russia_Moscow_Russian%20Federation_3-20-2012.pdf
SECTION II. EXPORTER BUSINESS TIPS
Eating Habits
Russia remains a largely traditional and patriarchal society where the family unit is typically run by
wives and mothers who cook regularly at home and make most of the dietary decisions. The most
typical dietary regime consists of potatoes, heavy rye bread, pork, chicken and beef, as well as various
soups based on seasonal vegetables, mushrooms and rice. Meat is usually either boiled or fried and
various forms of barbecued meat are popular during the summer season. Lamb is one of the most
expensive and least eaten meats in Russia, while chicken and pork are the most popular.
Russia remains a country where demand for ready-to-eat meals is very low save for instant noodles and
soup recipes. As a result, there is large demand for fresh ingredients - especially poultry, sausages and
processed meats. The primary vegetables that are found in almost every home are tomatoes, cucumbers,
bell peppers, onions and eggplants, while others such as celery, brussel sprouts, avocadoes and chillies
remain fairly marginal.
Most Russians have a tradition of eating out at business lunches, where special-deal menus offer them
discount prices and affordable daily meals. The most common preferences are home-food style cuisine
although fast food is also becoming widely consumed. However, as opposed to Western fast food
brands, there is growing demand for traditional fast food based on authentic Russian cuisine such as
dumplings, jacket potatoes and various patties. The prevalence of sushi has also made it one of the most
popular take-away options. Research by business network RBK showed that pizza and sushi were the
most popular meals for delivery in 2013 while at work. (Sours: Euromonitor International)
General Consumer Tastes and Preferences
Consumers Look to Healthy Food
Many consumers in Russia have embraced the healthy eating trend and are consuming more fruit and
vegetables. Higher income consumers are seeking out low fat, natural and functional foods. As Russia’s
urban zones continue to expand and the quality of food on offer suffers from the industrialization of the
country side, local consumers are increasingly yearning for clean, healthy and organic goods. More
consumers turn to specialized organic retailers, either by visiting their stores or by ordering goods
online. Although the price of organic goods are certainly much higher, usually double the price, around
60 percent of urban residents in Moscow and St. Petersburg are happy to pay more for eco-friendly
produce. However, organic product sales in Russia are still limited due to lack of regulation concerning
organic production. For more information on the Russian organic market please see ATO Moscow’s
Organic Market report: http://gain.fas.usda.gov/Recent%20GAIN%20Publications/ Russian%20Organic%20Market%20Continues%20to%20Grow_Moscow%20ATO_
Russian%20Federation_2-15-2013.pdf
Another trend is a growing demand for healthier fast food products. For example, Subway has seen
rapid growth in Russia as consumers see it as a middle choice between the “perceived” unhealthy
burgers and fried chicken on offer and the healthier but unglamorous Russian diners that serve up home
cooking. Environmental awareness is expected to continue growing in Russia as a result of new
legislation and pressure from other developed markets, opening opportunities for greener, healthier and
more natural products.
Consumers Seek out Russian Brands although Imported Goods are Still Valued
Russian brands have long been something of a hallmark for poor quality and questionable origin locally
yet consumers are beginning to choose domestically produced goods believing them to be at a similar
standard to foreign imports. This trend has been most clear in food and alcoholic drinks with the usually
cheaper prices of domestic goods such as yoghurts, cheeses and pasta attracting more rubles while
premium local vodka and chocolate brands have a high regard among the populace as competitive
luxury products.
Niche foreign beers and wines are on trend among urban and middle class households that aspire to
Western drinking habits and Russian brands are taking notice of this trend by releasing similarly styled
but Russian versions of boutique beers and spirits. However, the idea of “import goods” as being better
or “trendier” is still greatly valued among Russians which makes domestic brands less suitable for gifts
and other occasions where the idea is to impress.
Baby Products are Booming
Products for infants, including baby food, steadily increase in popularity and sales. In 2013, the number
of babies and infants in Russia (aged 0-2) reached 5.3 million, an increase of 200,000 over 2012 as a
result of stronger government support programs for parents and improved economic performance. This
number is expected to continue to grow to reach 5.5 million by 2016. The convenience of home delivery
and busier lifestyles of working mothers have led to more purchases of baby products online. According
to recent surveys, most mothers search for value for money. However, in Moscow and St Petersburg
many families pay top rates for luxury baby nappies, organic baby food and other such premium goods.
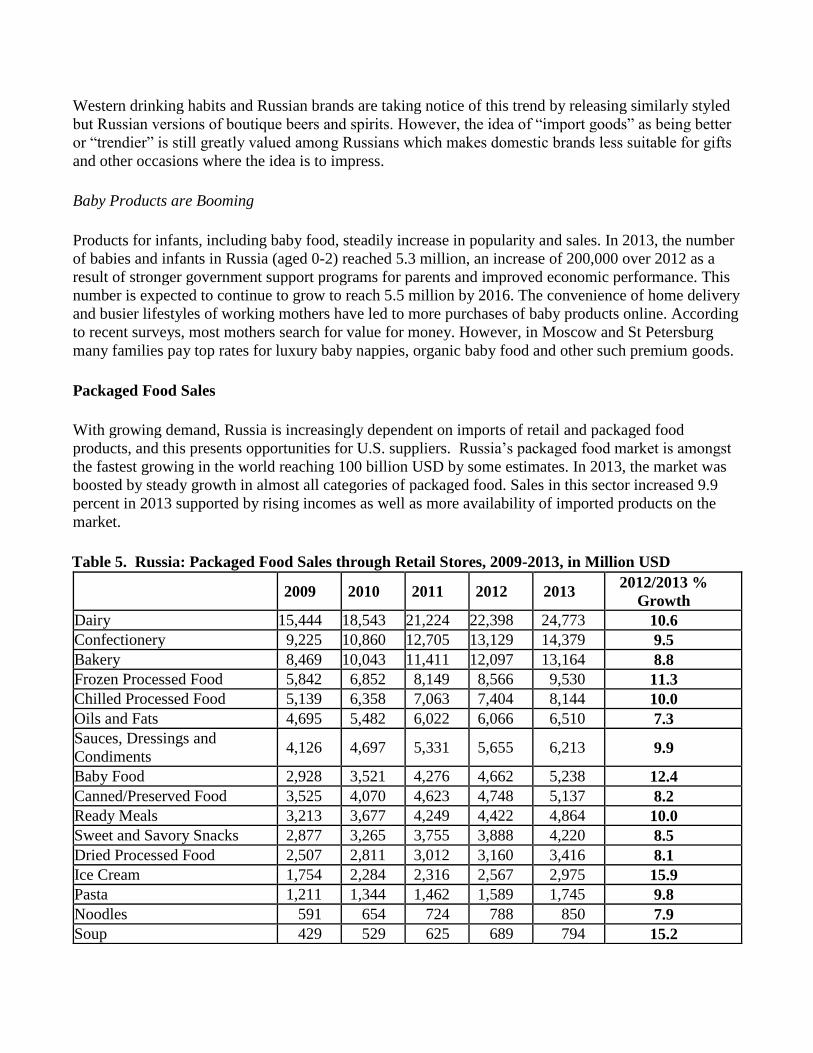
Packaged Food Sales
With growing demand, Russia is increasingly dependent on imports of retail and packaged food
products, and this presents opportunities for U.S. suppliers. Russia’s packaged food market is amongst
the fastest growing in the world reaching 100 billion USD by some estimates. In 2013, the market was
boosted by steady growth in almost all categories of packaged food. Sales in this sector increased 9.9
percent in 2013 supported by rising incomes as well as more availability of imported products on the
market.
Table 5. Russia: Packaged Food Sales through Retail Stores, 2009-2013, in Million USD
2009 2010 2011 2012 2013 2012/2013 %
Growth Dairy 15,444 18,543 21,224 22,398 24,773 10.6 Confectionery 9,225 10,860 12,705 13,129 14,379 9.5
Bakery 8,469 10,043 11,411 12,097 13,164 8.8 Frozen Processed Food 5,842 6,852 8,149 8,566 9,530 11.3 Chilled Processed Food 5,139 6,358 7,063 7,404 8,144 10.0
Oils and Fats 4,695 5,482 6,022 6,066 6,510 7.3 Sauces, Dressings and
Condiments 4,126 4,697 5,331 5,655 6,213 9.9
Baby Food 2,928 3,521 4,276 4,662 5,238 12.4
Canned/Preserved Food 3,525 4,070 4,623 4,748 5,137 8.2 Ready Meals 3,213 3,677 4,249 4,422 4,864 10.0 Sweet and Savory Snacks 2,877 3,265 3,755 3,888 4,220 8.5
Dried Processed Food 2,507 2,811 3,012 3,160 3,416 8.1 Ice Cream 1,754 2,284 2,316 2,567 2,975 15.9 Pasta 1,211 1,344 1,462 1,589 1,745 9.8
Noodles 591 654 724 788 850 7.9 Soup 429 529 625 689 794 15.2
Spreads 378. 462 557 595 662 11.2 Snack Bars 14 17 22 25 30 19.8
Packaged Food Total 66,962 79,307 90,521 95,026 104,474 9.9 Source: Euromonitor International from trade sources and national statistics, 2014
The constantly increasing pace of life in Russia resulted in strengthening demand for products suited to
on-the-go consumption. Consumer desire for convenience resulted in higher demand for packaged food.
Convenient storage and longer shelf-life made packaged food products more appealing to modern
consumers. Ready to consume solutions, such as sliced bread, sliced cheese and ready meals, were only
possible with the use of proper packaging. Well defined single portions found favor amongst consumers
more aware of their diets and calorie intake. All of these factors positively impacted demand for
packaged food in 2013.
Modern retailing developing rapidly in Russia positively impacted packaged food in 2013. The
influence of modern grocery retailers was mainly felt through the increasing variety of packaged food
products available, declining unit prices, active marketing and promotion at the point-of-sale, and the
convenience offered to consumers by modern formats. Moreover, retailers set high standards in terms of
preservation of product freshness, quality of packaging materials, long expiration dates, product related
information on the packaging and brand awareness. Modern retailers have forced packaged food
producers to provide consumers with the best solutions in terms of price and quality. Russian consumers
will continue to benefit from the ongoing development of modern retailing over the forecast period.
In terms of product variety, Moscow was the most saturated market for packaged food in Russia in
2013 with a much wider assortment of products available in comparison to other cities. Moscow
accounted for a 15 percent share of the retail value sales of packaged food in Russia in 2013. Due to
their higher disposable income levels, Muscovites were the main drivers of the “premiumization” trend
across packaged food categories in Russia. The majority of international companies entering the
packaged food sector in Russia tend to use Moscow as their starting point. As a result of this, Moscow
had a strong presence of imported packaged food products compared to other regions of the country.
The influence of Western consumption habits in Russia has led to an increasing penchant among
Russian consumers for snacking between meals, making the snacks category a growth market. Since
2000, sales of snacks have grown rapidly due to new product launches and the heavy promotion of
national brands. The chart below shows how the Snack Bars category reached record volume with 16
percent growth year-on-year. Almost all categories of packaged products also saw noticeable growth in
2013 in both volume and value terms.
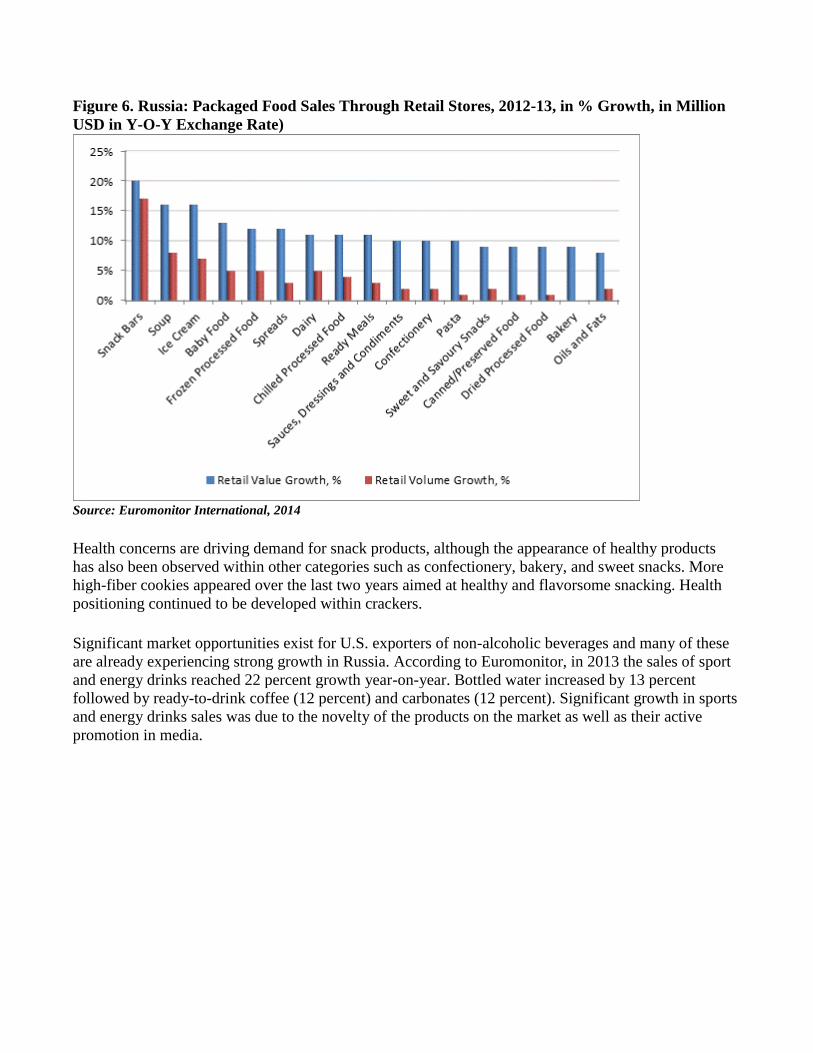
Figure 6. Russia: Packaged Food Sales Through Retail Stores, 2012-13, in % Growth, in Million
USD in Y-O-Y Exchange Rate)
Source: Euromonitor International, 2014
Health concerns are driving demand for snack products, although the appearance of healthy products
has also been observed within other categories such as confectionery, bakery, and sweet snacks. More
high-fiber cookies appeared over the last two years aimed at healthy and flavorsome snacking. Health
positioning continued to be developed within crackers.
Significant market opportunities exist for U.S. exporters of non-alcoholic beverages and many of these
are already experiencing strong growth in Russia. According to Euromonitor, in 2013 the sales of sport
and energy drinks reached 22 percent growth year-on-year. Bottled water increased by 13 percent
followed by ready-to-drink coffee (12 percent) and carbonates (12 percent). Significant growth in sports
and energy drinks sales was due to the novelty of the products on the market as well as their active
promotion in media.
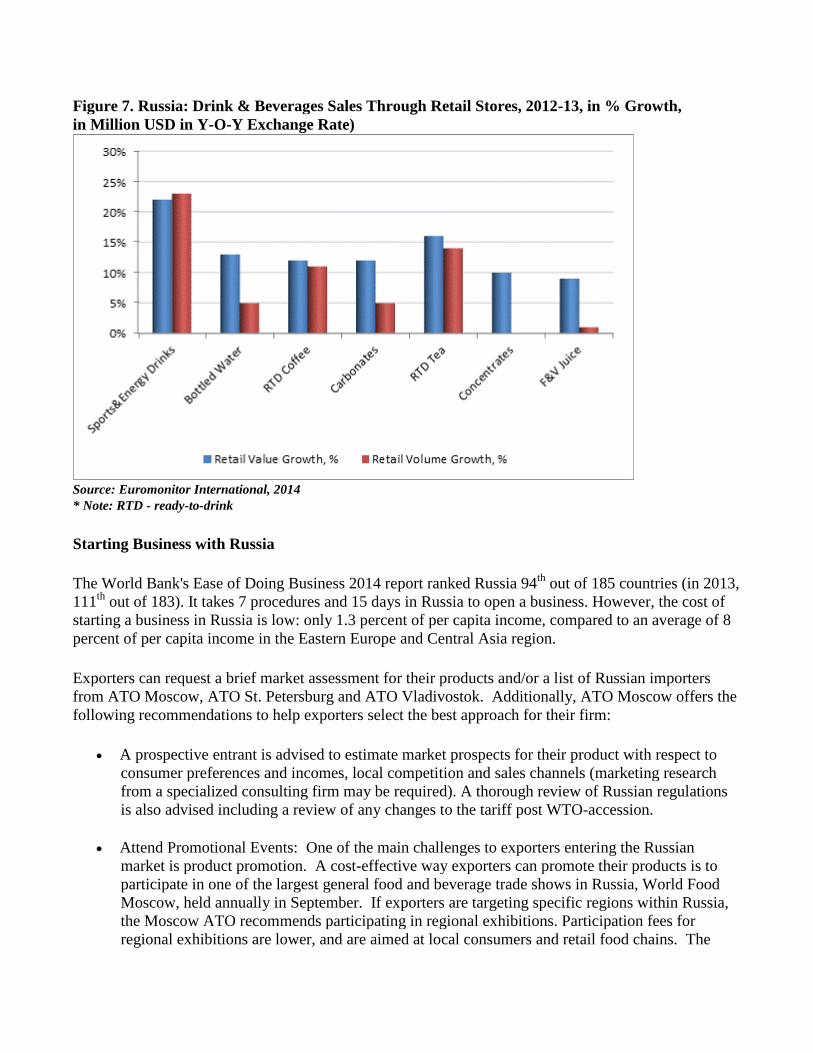
Figure 7. Russia: Drink & Beverages Sales Through Retail Stores, 2012-13, in % Growth,
in Million USD in Y-O-Y Exchange Rate)
Source: Euromonitor International, 2014 * Note: RTD - ready-to-drink
Starting Business with Russia
The World Bank's Ease of Doing Business 2014 report ranked Russia 94
th out of 185 countries (in 2013,
111th
out of 183). It takes 7 procedures and 15 days in Russia to open a business. However, the cost of
starting a business in Russia is low: only 1.3 percent of per capita income, compared to an average of 8
percent of per capita income in the Eastern Europe and Central Asia region.
Exporters can request a brief market assessment for their products and/or a list of Russian importers
from ATO Moscow, ATO St. Petersburg and ATO Vladivostok. Additionally, ATO Moscow offers the
following recommendations to help exporters select the best approach for their firm:
A prospective entrant is advised to estimate market prospects for their product with respect to
consumer preferences and incomes, local competition and sales channels (marketing research
from a specialized consulting firm may be required). A thorough review of Russian regulations
is also advised including a review of any changes to the tariff post WTO-accession.
Attend Promotional Events: One of the main challenges to exporters entering the Russian
market is product promotion. A cost-effective way exporters can promote their products is to
participate in one of the largest general food and beverage trade shows in Russia, World Food
Moscow, held annually in September. If exporters are targeting specific regions within Russia,
the Moscow ATO recommends participating in regional exhibitions. Participation fees for
regional exhibitions are lower, and are aimed at local consumers and retail food chains. The
Russian retail market is competitive; exporters should allocate time to visit Russia and earmark
funds in their sales plans for promotional support.
Work with a Russian Importer: Selecting the right trade partner is one of the most important
decisions for exporters developing their business in Russia. Working with a local partner in
Russia significantly expands business opportunities, and minimizes the need for exporters to
establish direct contact with multiple retail chains. A local Russian partner familiar with market
conditions and the regulatory environment can help exporters navigate the Russian retail market,
resolve issues, and increase the likelihood of success.
In order to make the first delivery, usually a large local import company is chosen. The company
should have a good reputation and experience in customs clearance, and must have storage facilities and
a developed distribution network. Make sure the company has experience working with Western
suppliers and has experience in arranging regular supplies of food products. Western companies that
strive to supply directly, circumventing Russian middle men, often sustain losses due to lack of local
market knowledge. A large domestic import company is usually better adjusted to local conditions,
with established trade ties and contacts in state structures.
Exporters representing U.S. companies may contact the Moscow ATO for importer lists. Performing
due diligence is critically important such as verifying banking and supplier references of potential
importers, and local and U.S.-based organizations in Russia can provide helpful information to
exporters. However, credit reporting is a relatively new practice in Russia, and credit-reporting
agencies may not have complete information on potential Russian business partners. Retail chains may
be another valuable source for exporters collecting information on importers.
Provide Sales Support: Exporters must help market the products they sell in Russia. Russian
importers and wholesalers expect exporters to participate in the sales process, either by
providing event marketing support, advertising assistance, training, packaging/handling advice,
or point of sales materials.
Establish a Representative Office: Once a company has established firm contacts and has a solid
prospect for sales, one of the best ways to conduct business in Russia is to open a representative
office. Depending on the product and target market, an office might be situated in Moscow, a
city that hosts a large concentration of retailers and representative offices; St. Petersburg, the
port city through which the largest volume of sea-borne freight passes; or Vladivostok, the
principal transpacific gateway to the Russian Far East.
Trade Shows in Russia
Participation in one of several established trade shows in Russia allows exporters to take a first-hand
look at the local market, to meet potential importers, and to gauge the competitiveness of their products
compared to similar products promoted at the show.
World Food Moscow
Moscow, Expocenter September 15-18, 2014 www.world-food.ru/eng
World Food Moscow is a USDA-supported show, and is essentially the “main event” for U.S.
exporters interested in market opportunities in Russia. ATO Moscow and the Office of Trade
Programs (in Washington) organize American pavilions in the grocery, fruit, and seafood sections
offering “turn-key” service. USDA industry organizations (aka Cooperators) typically organize a
pavilion in the meat hall. In 2013, this 4-day show drew more than 1,600 exhibitors from 70
countries and attracted more than 27,000 importers, wholesalers, retailers, and processors from all
parts of Russia and from many neighboring countries.
PIR Hospitality Industry Moscow, Crocus Expocenter October 1-4, 2014 http://www.pir.ru/
The PIR Hospitality Industry exhibition is the leading show for the hotel, restaurant, and industrial
catering sector (HRI) and is affiliated with the Restaurateurs and Hoteliers Federation of Russia. In 2013, more than 675 exhibitors from 25 countries participated in the PIR show. The PIR show
attracted approximately 50,000 visitors from the Russian hospitality industry.
Golden Autumn Moscow, All-Russian Exhibition Center (VVC) October, 8-11, 2014 http://www.goldenautumn.ru/en/
The Golden Autumn trade show is organized by the Russian Ministry of Agriculture, and is the
largest Russian trade show for production agriculture. In 2014, more than 2,500 companies and
organizations from 70 Russian regions and 50 foreign countries exhibited at the show. Golden
Autumn occupied over 60,000 meters of space, including open grounds, displaying over 700 items of
agricultural equipment, both Russian and foreign. More than 80,000 visitors attended the event, most
of who are involved in farming and livestock production, food processing, agri-business, research, or
business financing. At this annual trade show, the USDA pavilion displays animal and plant genetics,
high-grade feeds, animal nutrients, and feed additives.
Prodexpo Moscow, Expocenter February 9-13, 2015 http://prod-expo.ru/en/
Prodexpo is Moscow’s largest international trade show highlighting foodstuffs manufactured in Russia
and Eastern Europe. In 2014, Prodexpo hosted more than 2,300 exhibitors from 60 countries and
attracted more than 50,000 visitors.
Ingredients Russia Moscow, All-Russian Exhibition Center (VVC) March 17-19, 2015 http://www.ingred.ru/
Ingredients Russia is a specialized trade show for suppliers and buyers of ingredients worldwide. In
2014, more than 250 companies and organizations from 33 countries exhibited at the show. More than
6,000 specialists visited the show last year searching for new contacts and different kinds of ingredients
for food processing (e.g. confectionery, meat, fish, dairy, etc).
Logistics and Transportation
Imported products arrive in Russia via land, sea, or air freight into ports or customs warehouses for
clearance before proceeding to the next destination. Best technically equipped sea commercial ports in
Russia are: St. Petersburg, Primorsk, Murmansk, Kaliningrad, Ust’-Luga, Murmansk, Kaliningrad,
Vysotsk, Novorossiysk, Tuapse, Vostochny, Vanino, Vladivostok. The transportation system for
shipping U.S. high value food products into Russia via St. Petersburg and Moscow is well established.
Most consumer-oriented food and beverage products including those from the U.S. enter through St.
Petersburg or Moscow for customs clearance.
Most American products are delivered to the Russia in containers by sea and around 90 percent enter via
the Port in St. Petersburg. MAERSK LINE, APL, OOCL, Hapag Lloyd, Evergreen, CMA-CGM
shipping lines deliver cargos from the United States to Rotterdam, Hamburg, or Bremerhaven in
Northern Europe.
The transatlantic shipment can take from 17 to 30 days depending of the departure port and number of
ports the vessel calling on the way to Europe. In Northern European ports, the containers are reloaded
onto feeder vessels and travel an additional five days to St. Petersburg. It then takes an additional four
days shipping time for final delivery by rail or truck to Moscow.
Outside of Russia, imports are also delivered to Baltic ports and then shipped by truck or rail to St.
Petersburg or Moscow. Baltic and Finnish ports had offered greater efficiency, fewer problems with loss
or damage, and lower port fees. However, changes in Russian import requirements have largely
redirected these shipments to Russian ports: St. Petersburg, Ust-Luga, Vysotsk, Kronshtadt,
Novorossiysk and Vladivostok.
The cleared products are then shipped further into the interior via truck or rail to Moscow,
Yekaterinburg, Novosibirsk, Rostov-on-Don, Kazan, Samara, Ufa, and other major population centers
in Russia, the main markets for the high end products.
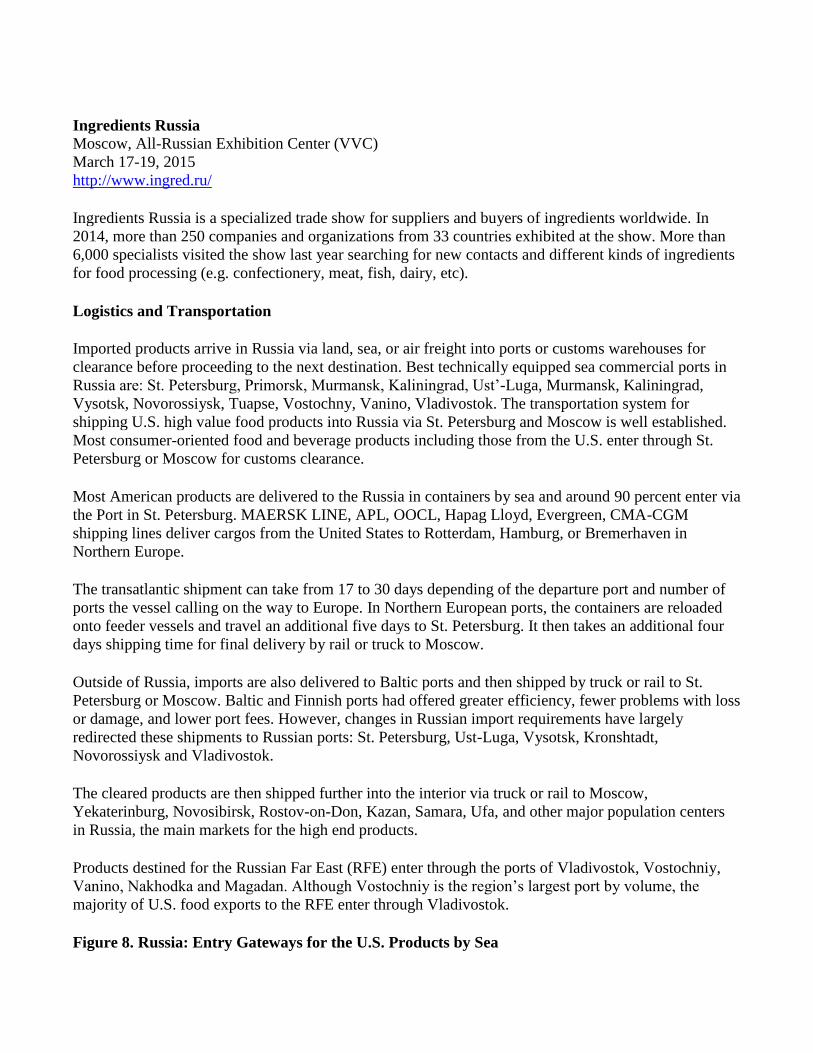
Products destined for the Russian Far East (RFE) enter through the ports of Vladivostok, Vostochniy,
Vanino, Nakhodka and Magadan. Although Vostochniy is the region’s largest port by volume, the
majority of U.S. food exports to the RFE enter through Vladivostok.
Figure 8. Russia: Entry Gateways for the U.S. Products by Sea
Source: SVT Group Currently several forwarders make shipments from the U.S. west coast to Vladivostok: Hyundai
Merchant Marine, MAERSK LINE, APL, and Hapac Loyd. Average transit time from the U.S. west
coast to Vladivostok takes 18 days: ocean vessels bring containerized goods to the Korean Port of Pusan
(it takes 9 to 13 days), then, feeders transfer them to the Port of Vladivostok (it takes 4 to 7 days).
MAERSK LINE has the longer transit time, because it goes though Japan first, and then delivers goods
to Korea (Pusan). In 2008, FESCO launched a direct line from Everett, Washington to RFE ports
(Vladivostok, Korsakov, Petropavlovsk, and Magadan). Direct voyages are scheduled approximately
once per month and the average transit time is 14 days. From Vladivostok food products are shipped to
the other cities in the RFE and Siberia by truck or rail.
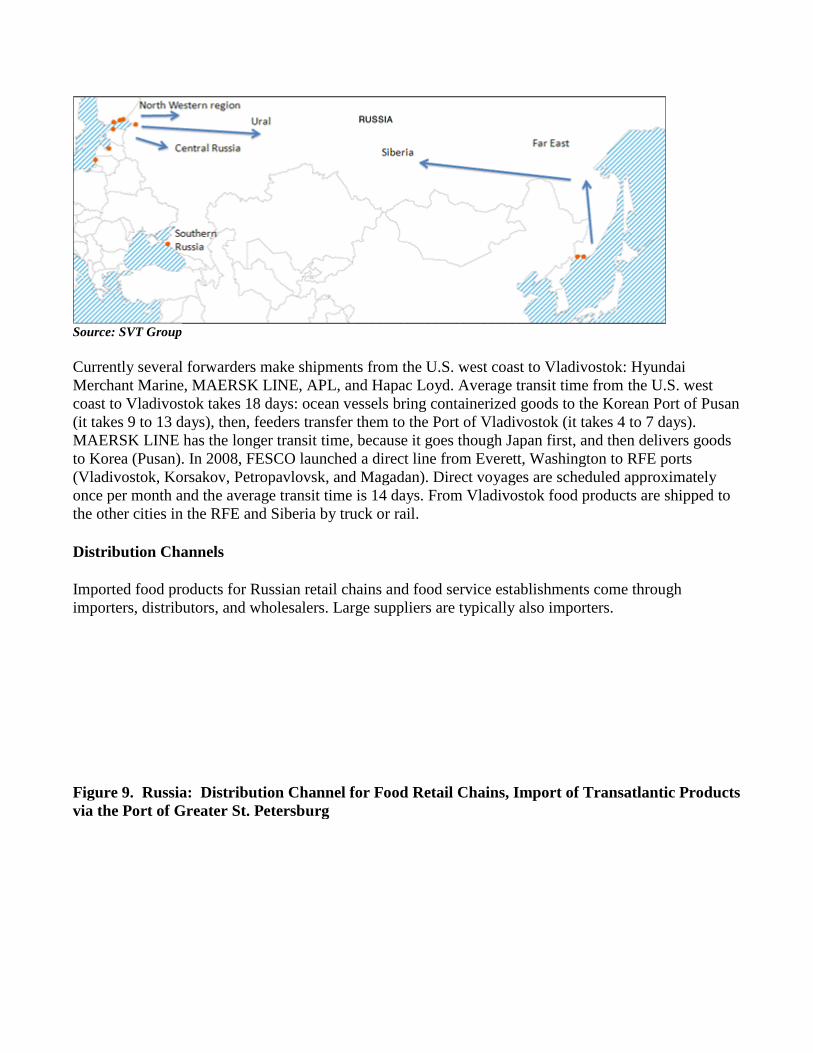
Distribution Channels
Imported food products for Russian retail chains and food service establishments come through
importers, distributors, and wholesalers. Large suppliers are typically also importers.
Figure 9. Russia: Distribution Channel for Food Retail Chains, Import of Transatlantic Products
via the Port of Greater St. Petersburg
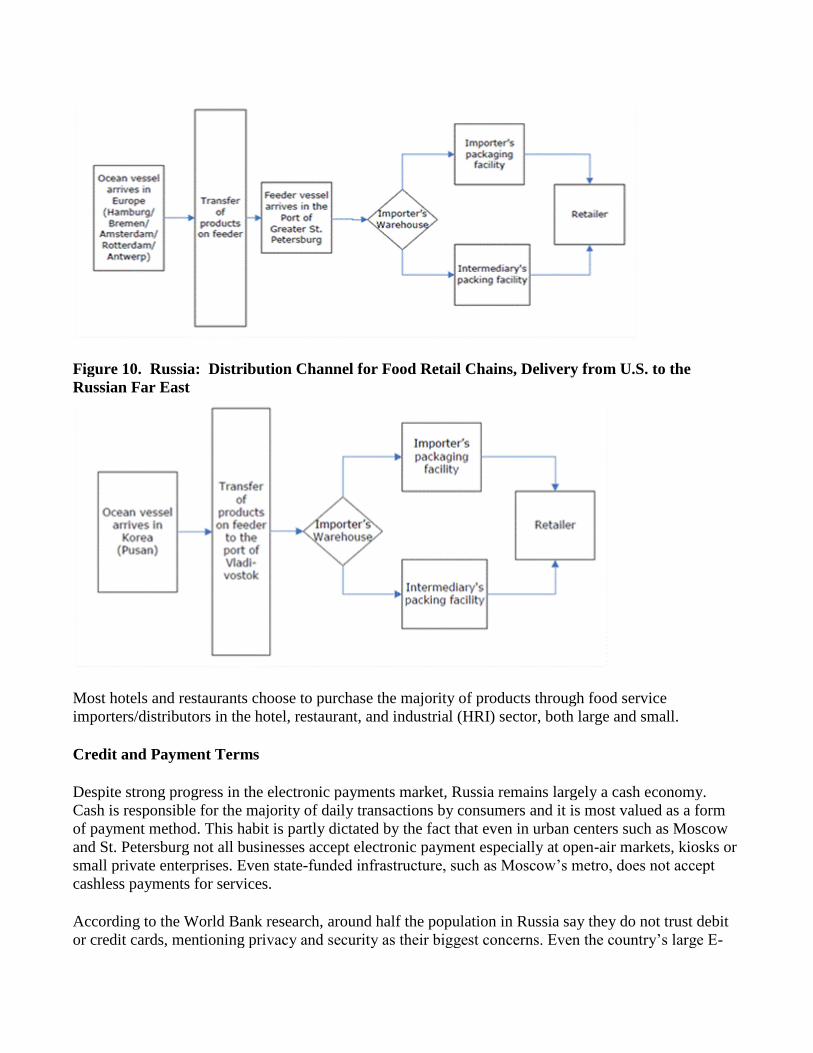
Figure 10. Russia: Distribution Channel for Food Retail Chains, Delivery from U.S. to the
Russian Far East
Most hotels and restaurants choose to purchase the majority of products through food service
importers/distributors in the hotel, restaurant, and industrial (HRI) sector, both large and small.
Credit and Payment Terms
Despite strong progress in the electronic payments market, Russia remains largely a cash economy.
Cash is responsible for the majority of daily transactions by consumers and it is most valued as a form
of payment method. This habit is partly dictated by the fact that even in urban centers such as Moscow
and St. Petersburg not all businesses accept electronic payment especially at open-air markets, kiosks or
small private enterprises. Even state-funded infrastructure, such as Moscow’s metro, does not accept
cashless payments for services.
According to the World Bank research, around half the population in Russia say they do not trust debit
or credit cards, mentioning privacy and security as their biggest concerns. Even the country’s large E-
Commerce space largely relies on cash payments upon delivery. Checks do not exist in the Russian
market at all. Nonetheless, the state is implementing measures to drive out cash trends, which it
perceives as negative. Measures implemented include a focus on stamping out cash salaries and the
banning of large cash payments for goods.
Nevertheless, Russians are consumption-hungry and shopping is a major part of the local lifestyle, with
consumers looking to aspirational goods as motivation for increasing their access to credit. A typical
loan deal, which can be obtained with just two identification documents, offered by a street bank is a
sum of 2,300 USD on a repayment scheme of six years. More consumers are turning to credit cards as
the country’s credit market is surging. The amount outstanding on all types of consumer lending grew
by nearly 98 percent over the period 2010 to 2013 and the outstanding balance on credit card loans rose
by 302 percent (in real terms) over the same period.
Both debit and credit cards are still undergoing rapid expansion. The number of debit cards in
circulation increased from 169 million in 2012 to 192 million by 2013, and this figure is set to reach 265
million by 2016. (Source: Euromonitor International)
Many banks in Russia are authorized to open foreign currency accounts and they also have general
licenses enabling them to undertake a full range of foreign currency transactions. Many of these banks
have correspondent banks in the United States. Further, several American and foreign banks such as
Citibank, Raffeissenbank, Societe Generale, and Credit Suisse are licensed to operate in Russia.
Securing credit can be costly, however, and there can be obstacles to securing credit in Russia if the
company is 100 percent foreign-owned. Russian bank fees are often high, and it can take much longer to
open letters of credit or transfer funds than is common in the United States.
In the second half of 2013, the Bank of Russia focused on strengthening the banking sector. In addition
to the policy limiting the growth of risky unsecured consumer lending, the regulator actively identified
the banks that related to money laundering and conversion-into-cash transactions. Banks-violators were
deprived of licenses. In 2013, licenses were revoked from 33 Russian banks.
However, the Russian banking industry remains unconsolidated with a large number of small banks, and
it is still considered underdeveloped with low penetration of banking services and strong growth
potential. The largest State banks play a huge role in the domestic banking sector. Sberbank and VTB
have a combined market share of over 42 percent of Russian banking sector assets. Sberbank dominates
in both retail deposits and retail loans (45 percent and 33 percent market shares respectively) with over
100 million retail clients in total. (Source: Sberbank Report, 2013)
Prospective borrowers should expect Russian banks to request a package of documents, including a
balance sheet showing profits for the last three quarters and proof of assets to mitigate the bank’s risk.
Interest rates on credit became lower in 2011-2013 after a significant rise in 2009-2010 (up to 13.9
percent) making credit more available for Russian businesses.
Figure 11. Russia: Average Interest Rates on Ruble-Denominated Credit to Nonfinancial
Institutions Up to One Year, 2013, in Percentage
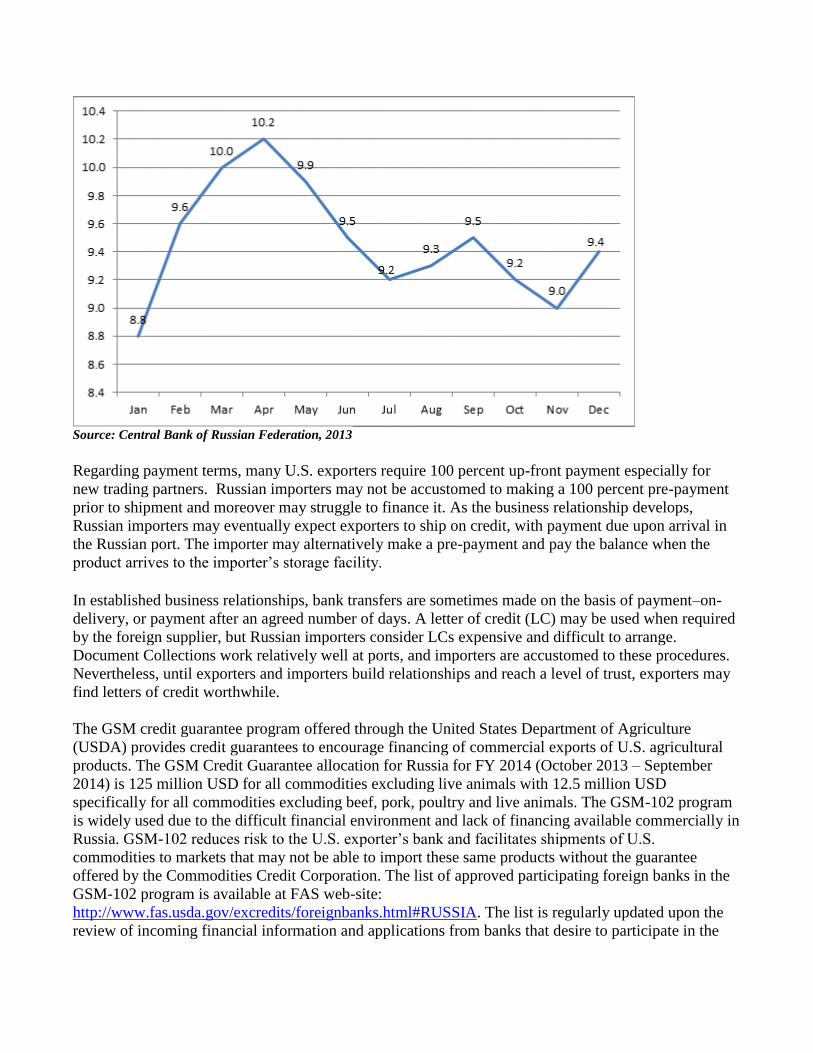
Source: Central Bank of Russian Federation, 2013 Regarding payment terms, many U.S. exporters require 100 percent up-front payment especially for
new trading partners. Russian importers may not be accustomed to making a 100 percent pre-payment
prior to shipment and moreover may struggle to finance it. As the business relationship develops,
Russian importers may eventually expect exporters to ship on credit, with payment due upon arrival in
the Russian port. The importer may alternatively make a pre-payment and pay the balance when the
product arrives to the importer’s storage facility.
In established business relationships, bank transfers are sometimes made on the basis of payment–on-
delivery, or payment after an agreed number of days. A letter of credit (LC) may be used when required
by the foreign supplier, but Russian importers consider LCs expensive and difficult to arrange.
Document Collections work relatively well at ports, and importers are accustomed to these procedures.
Nevertheless, until exporters and importers build relationships and reach a level of trust, exporters may
find letters of credit worthwhile. The GSM credit guarantee program offered through the United States Department of Agriculture
(USDA) provides credit guarantees to encourage financing of commercial exports of U.S. agricultural
products. The GSM Credit Guarantee allocation for Russia for FY 2014 (October 2013 – September
2014) is 125 million USD for all commodities excluding live animals with 12.5 million USD
specifically for all commodities excluding beef, pork, poultry and live animals. The GSM-102 program
is widely used due to the difficult financial environment and lack of financing available commercially in
Russia. GSM-102 reduces risk to the U.S. exporter’s bank and facilitates shipments of U.S.
commodities to markets that may not be able to import these same products without the guarantee
offered by the Commodities Credit Corporation. The list of approved participating foreign banks in the
GSM-102 program is available at FAS web-site:
http://www.fas.usda.gov/excredits/foreignbanks.html#RUSSIA. The list is regularly updated upon the
review of incoming financial information and applications from banks that desire to participate in the
GSM-102. For further information on these programs, please visit the FAS website:
http://www.fas.usda.gov/excredits/ecgp.asp).
Food Standards and Regulations Russia has complex food import regulations. Exporters should carefully question importers regarding
certification and documentation requirements, as well as procedures for clearance of shipments into the
Russian Federation. Many of Russia’s food and trade regulations are undergoing reform as the Russia-
Belarus-Kazakhstan Customs Union (CU) continues policy integration. Russia also continues to adjust
policies pursuant to its World Trade Organization (WTO) accession on August 22, 2012.
For more detailed information on certification, customs procedures, documentation, tariffs, and safety
and labeling requirements please see the following GAIN reports:
RS1394 Food and Agricultural Import Regulations and Standards – Certification_Moscow_Russian
Federation_12-19-2013.doc
RS1395 Food and Agricultural Import Regulations and Standards – Narrative_Moscow_Russian
Federation_12-20-2013.doc
As the unification of the CU sanitary norms and technical regulations continues, please check the
Customs Union Ag Times in the FAS GAIN system for regular updates on the Customs Union
developments. Pricing
Retail prices in Russia can vary significantly; however pricing has become more competitive as large
retail chains increase their aggregate market share. On the regulatory side, exporters should consider the
effect of the Russian tax regime when making pricing and margin decisions. Again, please continue to
monitor GOR tariffs and other duties as WTO accession moves forward. Some of the taxes assessed
include:
Import duties are applied to most goods and typically range from 5 to 20 percent of products’
customs values. However, some agricultural products are subject to specific tariffs that are
calculated by volume, weight or quantity. Excise taxes, depending on the commodity exported,
apply to goods such as alcohol and tobacco products. For checking excise taxes rates please
contact ATO Moscow.
Russia typically levies an 18 percent Value Added Tax (VAT) on imported goods; however,
some food products (e.g. sugar, salt, milk, bread, pasta, vegetables, baby food, end etc.) are
subject to a reduced rate of 10 percent
Customs clearance charges add about 1.25 percent. The wholesale mark-up is typically 12 to15
percent, while retail mark-up runs 35 percent or more, depending on the product and the retailer;
and,
A 39 percent profit tax is assessed on gross margin.
SECTION III. MARKET SECTOR STRUCTURE AND TRENDS
Retail Food Sector
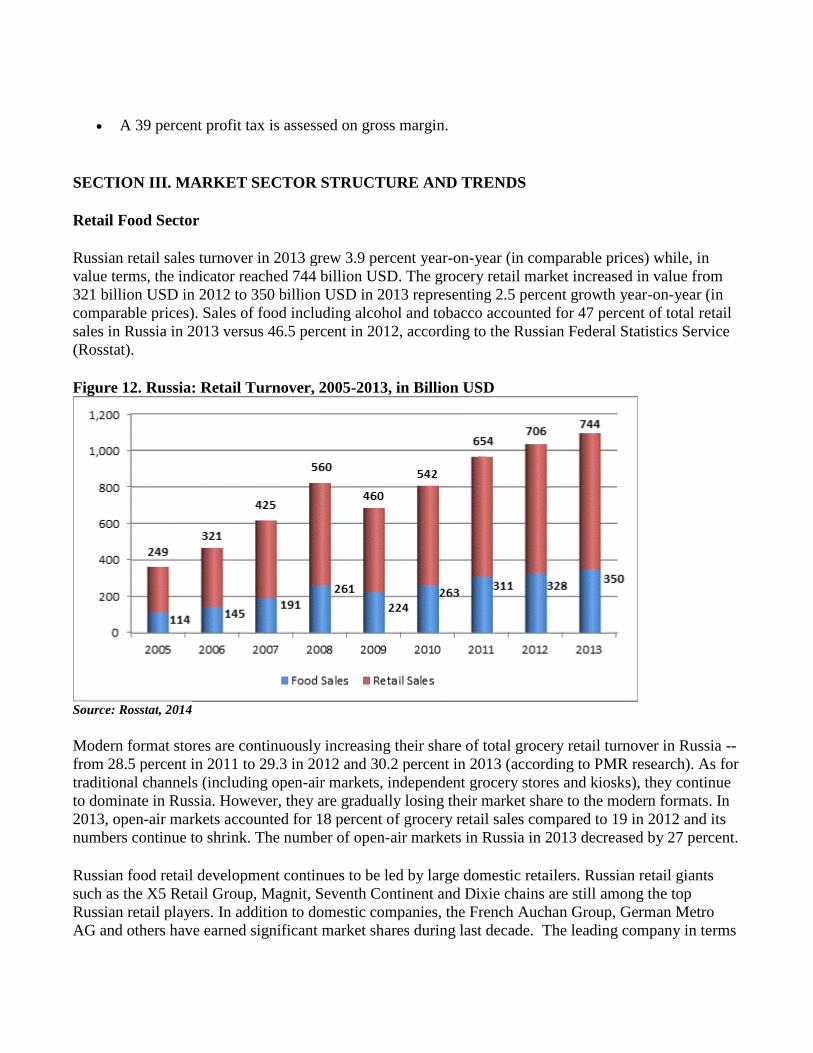
Russian retail sales turnover in 2013 grew 3.9 percent year-on-year (in comparable prices) while, in
value terms, the indicator reached 744 billion USD. The grocery retail market increased in value from
321 billion USD in 2012 to 350 billion USD in 2013 representing 2.5 percent growth year-on-year (in
comparable prices). Sales of food including alcohol and tobacco accounted for 47 percent of total retail
sales in Russia in 2013 versus 46.5 percent in 2012, according to the Russian Federal Statistics Service
(Rosstat).
Figure 12. Russia: Retail Turnover, 2005-2013, in Billion USD
Source: Rosstat, 2014 Modern format stores are continuously increasing their share of total grocery retail turnover in Russia --
from 28.5 percent in 2011 to 29.3 in 2012 and 30.2 percent in 2013 (according to PMR research). As for
traditional channels (including open-air markets, independent grocery stores and kiosks), they continue
to dominate in Russia. However, they are gradually losing their market share to the modern formats. In
2013, open-air markets accounted for 18 percent of grocery retail sales compared to 19 in 2012 and its
numbers continue to shrink. The number of open-air markets in Russia in 2013 decreased by 27 percent.
Russian food retail development continues to be led by large domestic retailers. Russian retail giants
such as the X5 Retail Group, Magnit, Seventh Continent and Dixie chains are still among the top
Russian retail players. In addition to domestic companies, the French Auchan Group, German Metro
AG and others have earned significant market shares during last decade. The leading company in terms
of revenue in 2013 was Magnit that operates grocery and cosmetics stores in Russia. Magnit overtook
the previous leader the X5 Group by achieving a 29 percent growth rate in 2013, compared to the 8.7
percent annual growth rate of the X5 Group. The Auchan Group was the third-ranked retailer in 2013.
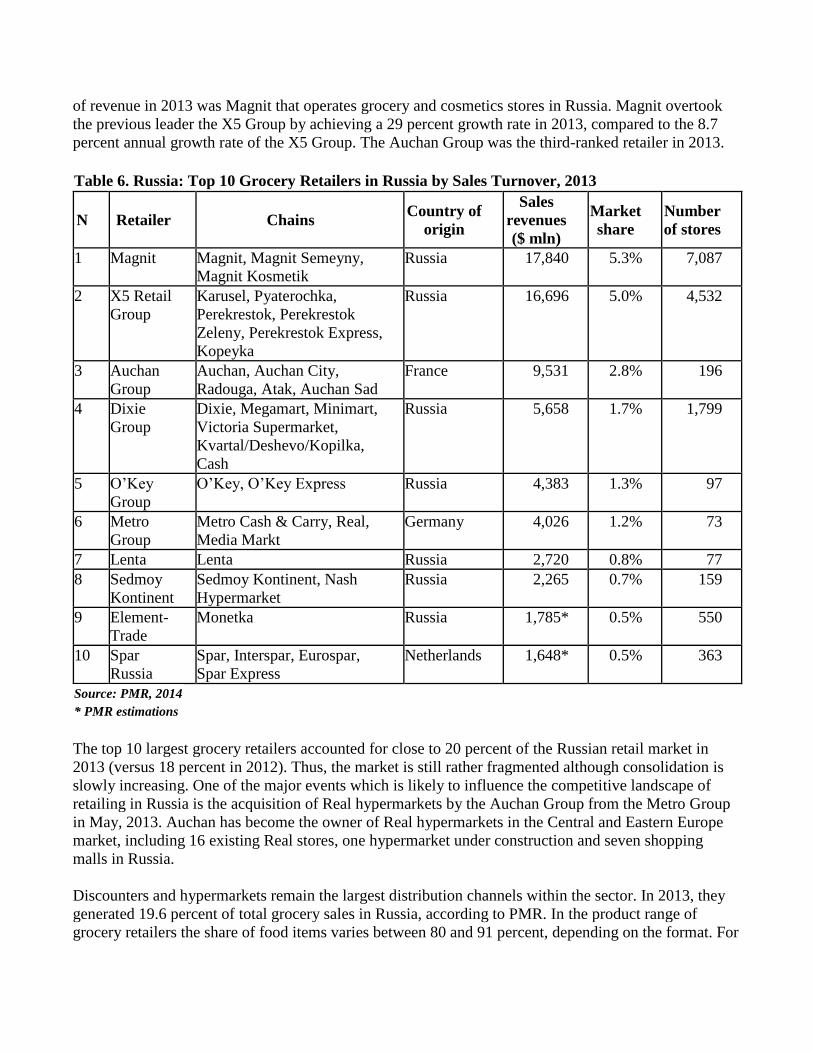
Table 6. Russia: Top 10 Grocery Retailers in Russia by Sales Turnover, 2013
N Retailer Chains Country of
origin
Sales
revenues
($ mln)
Market
share Number
of stores
1 Magnit Magnit, Magnit Semeyny,
Magnit Kosmetik Russia 17,840 5.3% 7,087
2 X5 Retail
Group Karusel, Pyaterochka,
Perekrestok, Perekrestok
Zeleny, Perekrestok Express,
Kopeyka
Russia 16,696 5.0% 4,532
3 Auchan
Group Auchan, Auchan City,
Radouga, Atak, Auchan Sad France 9,531 2.8% 196
4 Dixie
Group Dixie, Megamart, Minimart,
Victoria Supermarket,
Kvartal/Deshevo/Kopilka,
Cash
Russia 5,658 1.7% 1,799
5 O’Key
Group O’Key, O’Key Express Russia 4,383 1.3% 97
6 Metro
Group Metro Cash & Carry, Real,
Media Markt Germany 4,026 1.2% 73
7 Lenta Lenta Russia 2,720 0.8% 77
8 Sedmoy
Kontinent Sedmoy Kontinent, Nash
Hypermarket Russia 2,265 0.7% 159
9 Element-
Trade Monetka Russia 1,785* 0.5% 550
10 Spar
Russia Spar, Interspar, Eurospar,
Spar Express Netherlands 1,648* 0.5% 363
Source: PMR, 2014 * PMR estimations
The top 10 largest grocery retailers accounted for close to 20 percent of the Russian retail market in
2013 (versus 18 percent in 2012). Thus, the market is still rather fragmented although consolidation is
slowly increasing. One of the major events which is likely to influence the competitive landscape of
retailing in Russia is the acquisition of Real hypermarkets by the Auchan Group from the Metro Group
in May, 2013. Auchan has become the owner of Real hypermarkets in the Central and Eastern Europe
market, including 16 existing Real stores, one hypermarket under construction and seven shopping
malls in Russia.
Discounters and hypermarkets remain the largest distribution channels within the sector. In 2013, they
generated 19.6 percent of total grocery sales in Russia, according to PMR. In the product range of
grocery retailers the share of food items varies between 80 and 91 percent, depending on the format. For
example, the X5 Retail Group reported that food goods accounted for 90.9 percent of the company’s
total sales in 2013. For Magnit, the share of food was 80 percent in the hypermarket format and 88.5
percent in the convenience format. (Source: PMR)
Private label packaged food products saw increasing popularity in Russia in 2013. Consumers became
more price-sensitive and rational in their purchasing decisions. This led to the strong development of
private label in the country. In addition, the ongoing expansion and development of retail chains lent
momentum to the introduction and promotion of private label lines. In 2013, private label packaged
food saw sales growth of 19 percent to reach 2.5 billion USD. (Source: Euromonitor) Retailers demand
consistent quality and adherence to contract specifications and penalize suppliers for failure to meet
requirements. As a result, foreign suppliers continue to be competitive in the Russian market as they are
more accustomed to meeting such strict specifications than Russian agricultural producers. Please see
the “Retail Foods Annual 2013” report for more information on the retail sector in Russia: http://gain.fas.usda.gov/Recent%20GAIN%20Publications/Retail%20Foods_Moscow%20 ATO_Russian%20Federation_9-3-2013.pdf
The next updated Retail Report will be available in July-August, 2014. For search engine please visit
http://gain.fas.usda.gov/Lists/Advanced%20Search/AllItems.aspx
For information on legislation regulating Russian retail trade please see the report: http://gain.fas.usda.gov/Recent%20GAIN%20Publications/The%20Russian%20Federal%20Law%20on
%20Trade%20_Moscow%20ATO_Russian%20Federation_8-30-2010.pdf
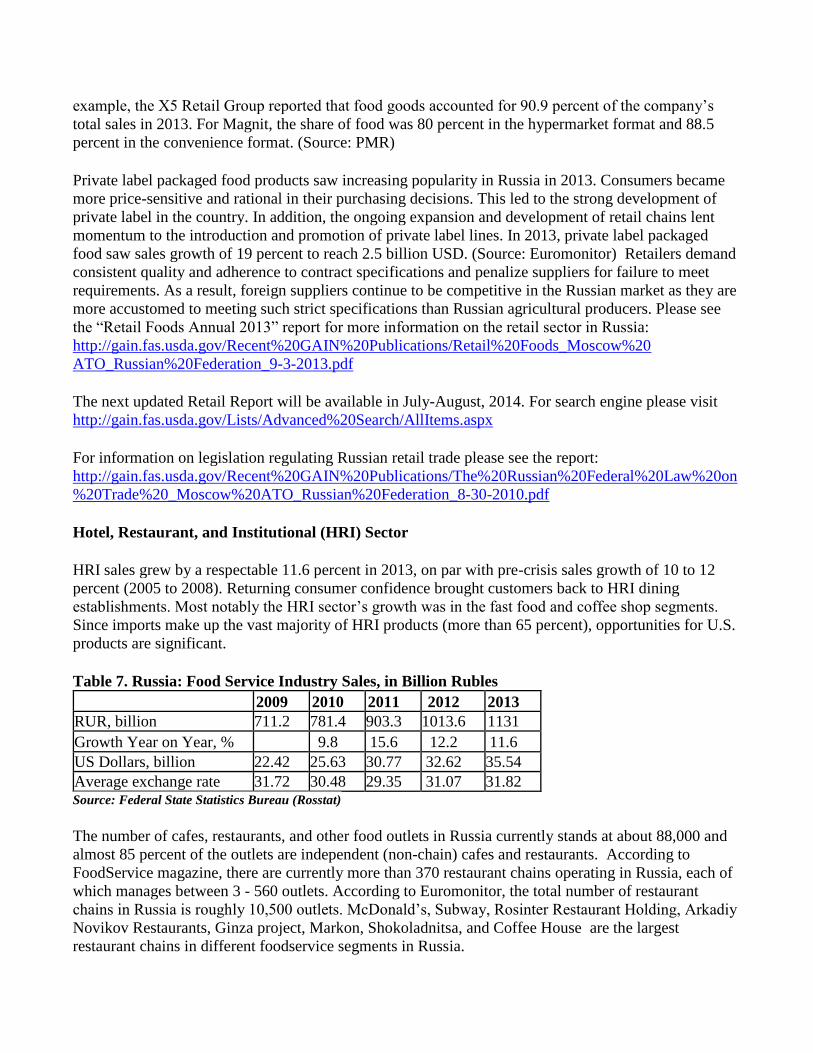
Hotel, Restaurant, and Institutional (HRI) Sector
HRI sales grew by a respectable 11.6 percent in 2013, on par with pre-crisis sales growth of 10 to 12
percent (2005 to 2008). Returning consumer confidence brought customers back to HRI dining
establishments. Most notably the HRI sector’s growth was in the fast food and coffee shop segments.
Since imports make up the vast majority of HRI products (more than 65 percent), opportunities for U.S.
products are significant.
Table 7. Russia: Food Service Industry Sales, in Billion Rubles
2009 2010 2011 2012 2013 RUR, billion 711.2 781.4 903.3 1013.6 1131
Growth Year on Year, % 9.8 15.6 12.2 11.6
US Dollars, billion 22.42 25.63 30.77 32.62 35.54
Average exchange rate 31.72 30.48 29.35 31.07 31.82 Source: Federal State Statistics Bureau (Rosstat)
The number of cafes, restaurants, and other food outlets in Russia currently stands at about 88,000 and
almost 85 percent of the outlets are independent (non-chain) cafes and restaurants. According to
FoodService magazine, there are currently more than 370 restaurant chains operating in Russia, each of
which manages between 3 - 560 outlets. According to Euromonitor, the total number of restaurant
chains in Russia is roughly 10,500 outlets. McDonald’s, Subway, Rosinter Restaurant Holding, Arkadiy
Novikov Restaurants, Ginza project, Markon, Shokoladnitsa, and Coffee House are the largest
restaurant chains in different foodservice segments in Russia.
The consumer markets are flourishing in Moscow and St. Petersburg as the incomes of their residents
grow. As a result, Moscow and St. Petersburg are Russia’s largest restaurant cities with market shares of
15 percent in Moscow and 5.6 percent in St. Petersburg in 2013. After some consolidation in the
industry during the crisis years (2008-2010), in 2011-2014 more and more local as well as international
chains are active in the Russian foodservice market and are planning further regional expansion into
other wealthy cities. Currently the largest cities in Russia, Moscow and St. Petersburg, account for 41
percent and 15 percent respectively in terms of chain outlets on the overall consumer foodservice
market. According to Russian Business Consulting, more than 55 international restaurant chains
currently are operating in Russia.
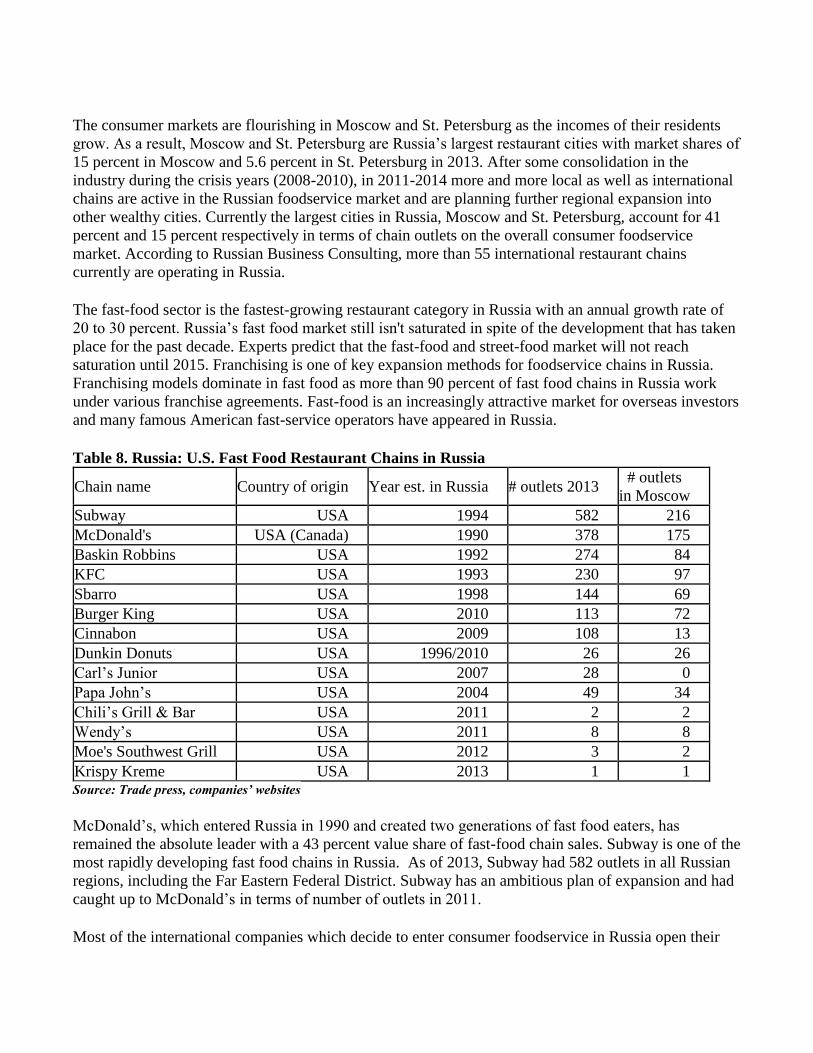
The fast-food sector is the fastest-growing restaurant category in Russia with an annual growth rate of
20 to 30 percent. Russia’s fast food market still isn't saturated in spite of the development that has taken
place for the past decade. Experts predict that the fast-food and street-food market will not reach
saturation until 2015. Franchising is one of key expansion methods for foodservice chains in Russia.
Franchising models dominate in fast food as more than 90 percent of fast food chains in Russia work
under various franchise agreements. Fast-food is an increasingly attractive market for overseas investors
and many famous American fast-service operators have appeared in Russia.
Table 8. Russia: U.S. Fast Food Restaurant Chains in Russia
Chain name Country of origin Year est. in Russia # outlets 2013 # outlets
in Moscow
Subway USA 1994 582 216
McDonald's USA (Canada) 1990 378 175
Baskin Robbins USA 1992 274 84
KFC USA 1993 230 97
Sbarro USA 1998 144 69
Burger King USA 2010 113 72
Cinnabon USA 2009 108 13
Dunkin Donuts USA 1996/2010 26 26
Carl’s Junior USA 2007 28 0
Papa John’s USA 2004 49 34
Chili’s Grill & Bar USA 2011 2 2
Wendy’s USA 2011 8 8
Moe's Southwest Grill USA 2012 3 2
Krispy Kreme USA 2013 1 1 Source: Trade press, companies’ websites McDonald’s, which entered Russia in 1990 and created two generations of fast food eaters, has
remained the absolute leader with a 43 percent value share of fast-food chain sales. Subway is one of the
most rapidly developing fast food chains in Russia. As of 2013, Subway had 582 outlets in all Russian
regions, including the Far Eastern Federal District. Subway has an ambitious plan of expansion and had
caught up to McDonald’s in terms of number of outlets in 2011.
Most of the international companies which decide to enter consumer foodservice in Russia open their
first outlets in Moscow. Only two foodservice players launched their restaurants from St. Petersburg:
Subway and Carl’s Jr.
Burger King, one of the largest fast food corporations in the world, established a presence in Russia by
opening its first restaurant in Moscow on January 2010. Currently, Burger King’s franchisees operate
more than 120 restaurants and intend to open several hundred Burger King outlets in Russia over the
next few years. Dunkin' Donuts, the U.S. doughnut eatery chain that left Russia after a three-year stint in
1999, returned to Moscow in 2010 with big plans for rapid expansion.
The coffeehouse business in Russia boomed in the early 2000s. Today, there is an increasingly high
concentration of the leading chains, including Shokoladnitsa, Coffee House, McCafé, Starbucks, and
Coffeeshop Company, in Moscow and St. Petersburg, so in the short term many coffeehouse chains plan
to expand to the Russian provinces. The world leader, Starbucks Coffee Company, opened its first outlet
in Moscow in September 2007 and currently is number three by coffee sales after Shokoladnitsa and
Coffee House. Currently Starbucks operates about 70 coffee shops in Russia.
Baskin Robbins, the world's largest chain of ice cream specialty shops, entered Russia in 1990. Currently Baskin-Robbins' network in Russia has 300 ice cream salons and kiosks in 115 cities, most of
them franchises.
Many restaurants import the vast majority of their ingredients, creating opportunities for U.S. exporters
of meat, seafood, wine, rice, spirits and specialty foods.
Please see the “HRI Sector Growing at Double Digit Rate Each Year ” 2013 report for further
information on the HRI sector in Russia
http://gain.fas.usda.gov/Recent%20GAIN%20Publications/Food%20Service%20-
%20Hotel%20Restaurant%20Institutional_Moscow%20ATO_Russian%20Federation_12-27-2013.pdf
Food Processing Sector
Russian food processing has been expanding since 2005 in average by 15 percent annually. According
to Rosstat, in 2013, Russian food industry production increased by 4.5 percent and valued at 4.2 trillion
Rubles (119.7 billion USD [1]). The food processing sector is expected to grow in 2014 and 2015 albeit
at a slower pace following the general trend in in Russian economy. Over the last two years, output of
the following processed foods has increased steadily: meat and offals; meat products; dry milk and
cream; butter; canned milk; pasta; sugar; confectionery; frozen fruits and vegetables; and mineral water.
The food processing industry in Russia is recognized by the government as a strategic sector which
could potentially supply the entire 143 million Russian population with quality food products. It
numbers over 30 sub-sectors contributing more than 16.2 percent of Russia’s economic production [2]
and employing 1.4 million people. Russia is the largest processed food market in Europe and one of the
world's largest importers of ingredients for food processing, for example Russia is the world’s largest
importer of dairy products. Currently, the food processing industry is made up of foreign and domestic
manufacturers with the latter dominating number wise. Among the biggest Russian food manufacturers
are: Baltika Brewery Company, Yug Rusi Group, “United Confectionaries”, “Cherkizovo”, “Efko”
Group, RusAgro and Miratorg. Among the most well-known foreign food manufacturers in Russia are
Kraft Foods and PepsiCo which have invested heavily in Russia. The foreign investors and Russian
manufacturers compete and invest in modernization and expansion in order to strengthen their position
in the market. These lead to the growing demand in innovative technologies and high quality
ingredients.
The majority of raw materials and ingredients used by Russian food processors/manufacturers are
imported. Demand for higher-quality ingredients is increasing as more local food processors strive to
meet international quality standards. That demand will lead to increased imports given that around 86
percent of the products used by the Russian food industry are imported, including meat, dry milk, nuts,
dried fruits, frozen vegetables, frozen berries and fruits, juice concentrates, etc. More than a half of the
meat and milk products in large Russian cities are provided by import suppliers. 100 percent of nuts and
dried fruits, 80 percent of frozen vegetables and mushrooms for frozen semi products packing, 70
percent of the raw materials in meat processing plants are imported.
The food ingredients and additives are also largely imported to Russia. According to the RBC research,
the Russian market accounts for about 9 -10 percent of the 28.3 billion USD world market of food
ingredients. So, Russian market is estimated at around 2.8 billion USD in 2013. The food experts
characterize ingredients and additives market in Russia as developing and non-saturated with good room
for growth.
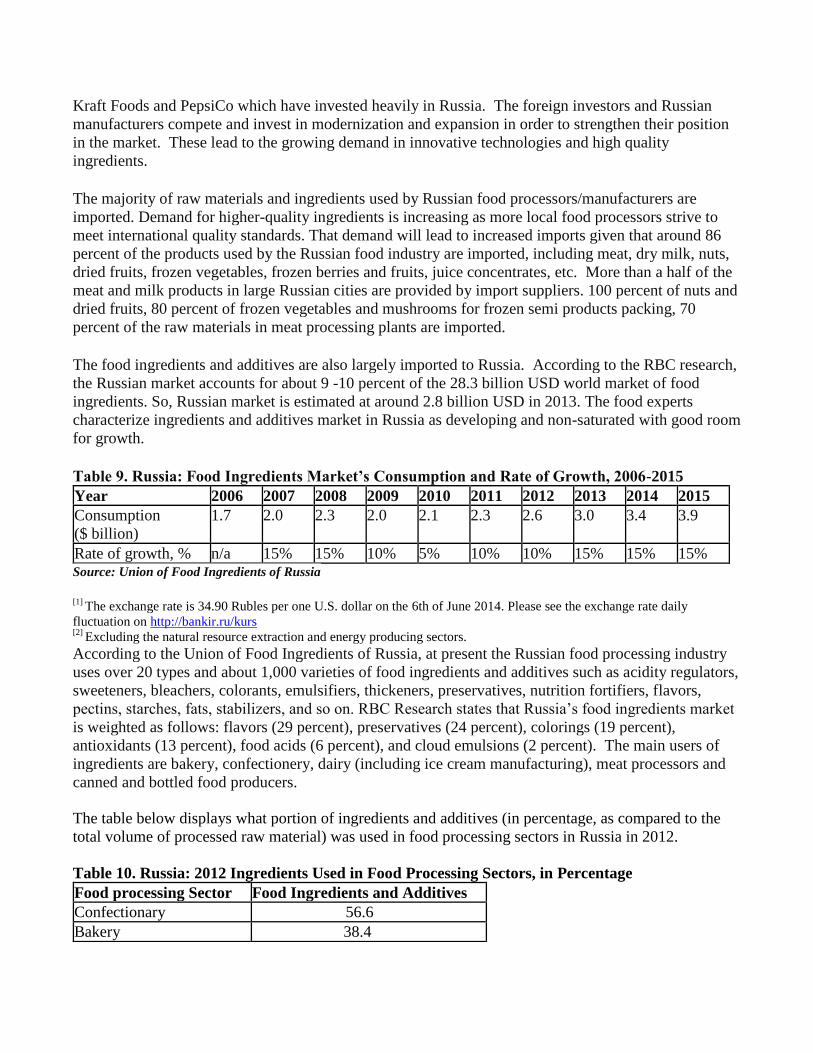
Table 9. Russia: Food Ingredients Market’s Consumption and Rate of Growth, 2006-2015
Year 2006 2007 2008 2009 2010 2011 2012 2013 2014 2015 Consumption ($ billion)
1.7 2.0 2.3 2.0 2.1 2.3 2.6 3.0 3.4 3.9
Rate of growth, % n/a 15% 15% 10% 5% 10% 10% 15% 15% 15% Source: Union of Food Ingredients of Russia [1]
The exchange rate is 34.90 Rubles per one U.S. dollar on the 6th of June 2014. Please see the exchange rate daily
fluctuation on http://bankir.ru/kurs [2]
Excluding the natural resource extraction and energy producing sectors.
According to the Union of Food Ingredients of Russia, at present the Russian food processing industry
uses over 20 types and about 1,000 varieties of food ingredients and additives such as acidity regulators,
sweeteners, bleachers, colorants, emulsifiers, thickeners, preservatives, nutrition fortifiers, flavors,
pectins, starches, fats, stabilizers, and so on. RBC Research states that Russia’s food ingredients market
is weighted as follows: flavors (29 percent), preservatives (24 percent), colorings (19 percent),
antioxidants (13 percent), food acids (6 percent), and cloud emulsions (2 percent). The main users of
ingredients are bakery, confectionery, dairy (including ice cream manufacturing), meat processors and
canned and bottled food producers. The table below displays what portion of ingredients and additives (in percentage, as compared to the
total volume of processed raw material) was used in food processing sectors in Russia in 2012.
Table 10. Russia: 2012 Ingredients Used in Food Processing Sectors, in Percentage
Food processing Sector Food Ingredients and Additives
Confectionary 56.6
Bakery 38.4
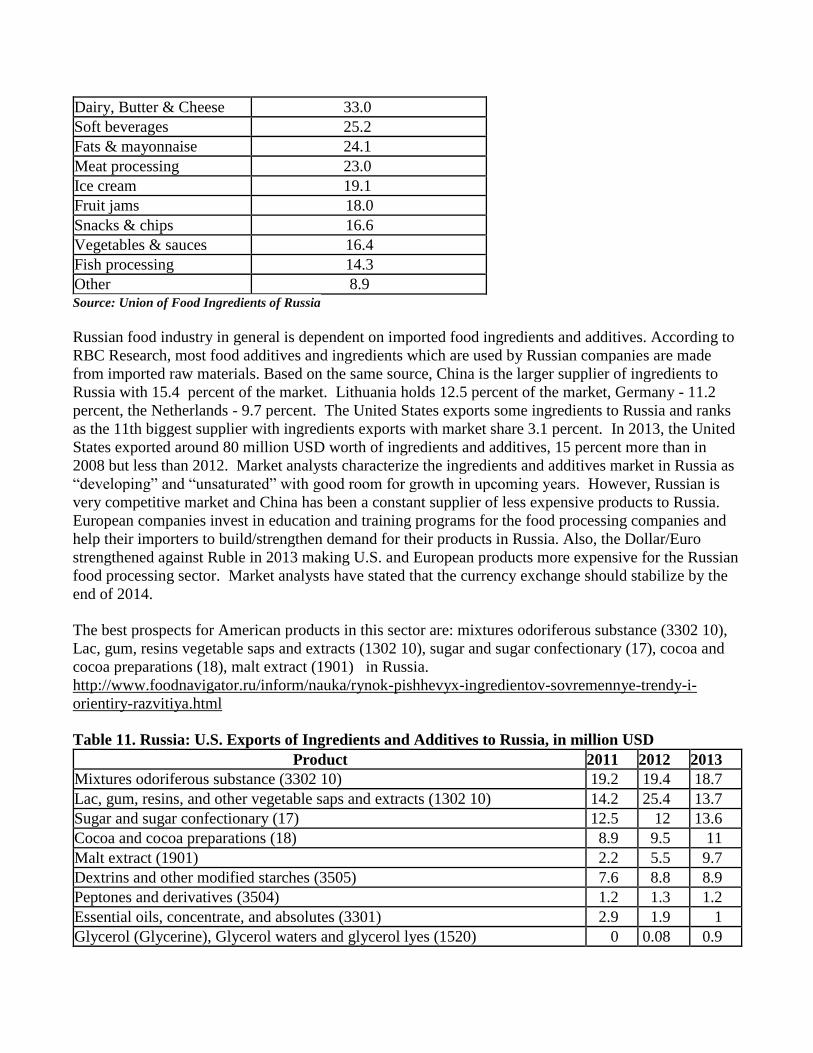
Dairy, Butter & Cheese 33.0
Soft beverages 25.2
Fats & mayonnaise 24.1
Meat processing 23.0
Ice cream 19.1
Fruit jams 18.0
Snacks & chips 16.6
Vegetables & sauces 16.4
Fish processing 14.3
Other 8.9 Source: Union of Food Ingredients of Russia Russian food industry in general is dependent on imported food ingredients and additives. According to
RBC Research, most food additives and ingredients which are used by Russian companies are made
from imported raw materials. Based on the same source, China is the larger supplier of ingredients to
Russia with 15.4 percent of the market. Lithuania holds 12.5 percent of the market, Germany - 11.2
percent, the Netherlands - 9.7 percent. The United States exports some ingredients to Russia and ranks
as the 11th biggest supplier with ingredients exports with market share 3.1 percent. In 2013, the United
States exported around 80 million USD worth of ingredients and additives, 15 percent more than in
2008 but less than 2012. Market analysts characterize the ingredients and additives market in Russia as
“developing” and “unsaturated” with good room for growth in upcoming years. However, Russian is
very competitive market and China has been a constant supplier of less expensive products to Russia.
European companies invest in education and training programs for the food processing companies and
help their importers to build/strengthen demand for their products in Russia. Also, the Dollar/Euro
strengthened against Ruble in 2013 making U.S. and European products more expensive for the Russian
food processing sector. Market analysts have stated that the currency exchange should stabilize by the
end of 2014.
The best prospects for American products in this sector are: mixtures odoriferous substance (3302 10),
Lac, gum, resins vegetable saps and extracts (1302 10), sugar and sugar confectionary (17), cocoa and
cocoa preparations (18), malt extract (1901) in Russia.
http://www.foodnavigator.ru/inform/nauka/rynok-pishhevyx-ingredientov-sovremennye-trendy-i-
orientiry-razvitiya.html
Table 11. Russia: U.S. Exports of Ingredients and Additives to Russia, in million USD
Product 2011 2012 2013 Mixtures odoriferous substance (3302 10) 19.2 19.4 18.7
Lac, gum, resins, and other vegetable saps and extracts (1302 10) 14.2 25.4 13.7
Sugar and sugar confectionary (17) 12.5 12 13.6
Cocoa and cocoa preparations (18) 8.9 9.5 11
Malt extract (1901) 2.2 5.5 9.7
Dextrins and other modified starches (3505) 7.6 8.8 8.9
Peptones and derivatives (3504) 1.2 1.3 1.2
Essential oils, concentrate, and absolutes (3301) 2.9 1.9 1
Glycerol (Glycerine), Glycerol waters and glycerol lyes (1520) 0 0.08 0.9
Vegetable fats and oils and their fractions (1516 20) 0.7 0.6 0.6
Margarine; Edible Mixtures or preparations of animal or vegetable fats or
oils (1517) 0.3 0.3 0.5
Source: Union of Food Ingredients of Russia The best way to learn more about market trends and meet in person with potential buyers is exhibiting
in Ingredients Russia Expo (Moscow, March 17-19, 2015), a key meeting point for all those involved in
the Russian ingredients industry. In 2014, the Expo attracted 4,900 attendees of which 92 percent were
key decision makers including food technologists and management of the food processing companies
and importers. Please contact ATO Moscow for more information about this event and to learn more
about how the ATO can provide assistance.
In 2015, Ingredients Russia 2015 will focus on organic and health ingredients. Manufacturers, suppliers
and distributors will present natural extracts, dietary supplements, flavors and natural ingredients for the
production of health food and drink products.
Please learn about the show here: http://www.ingred.ru/en-GB
The organizers’ contacts are below:
ITE Moscow +7 (495) 935-73-50 +7 (495) 788-55-85 [email protected] www.ite-expo.ru
Please find more information about food processing sector in FAS report:
http://gain.fas.usda.gov/Recent%20GAIN%20Publications/Food%20Processing%20Ingredients_Mosco
w%20ATO_Russian%20Federation_07.05.2013.pdf
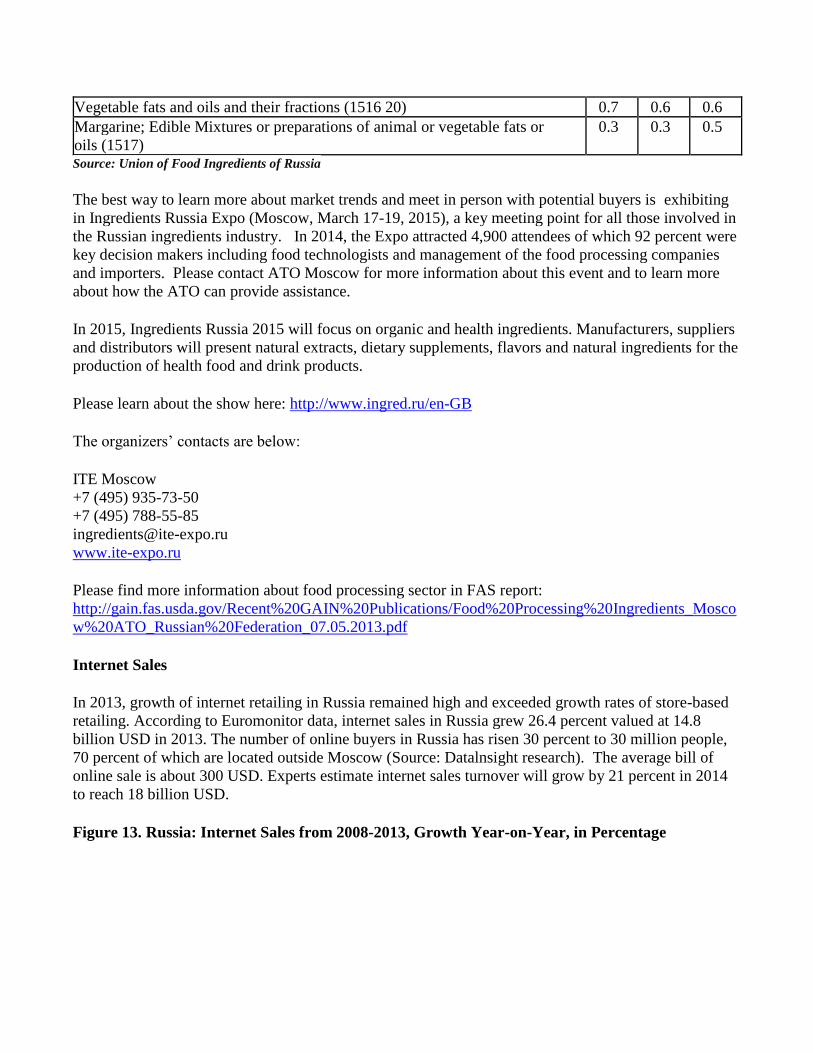
Internet Sales
In 2013, growth of internet retailing in Russia remained high and exceeded growth rates of store-based
retailing. According to Euromonitor data, internet sales in Russia grew 26.4 percent valued at 14.8
billion USD in 2013. The number of online buyers in Russia has risen 30 percent to 30 million people,
70 percent of which are located outside Moscow (Source: Datalnsight research). The average bill of
online sale is about 300 USD. Experts estimate internet sales turnover will grow by 21 percent in 2014
to reach 18 billion USD.
Figure 13. Russia: Internet Sales from 2008-2013, Growth Year-on-Year, in Percentage
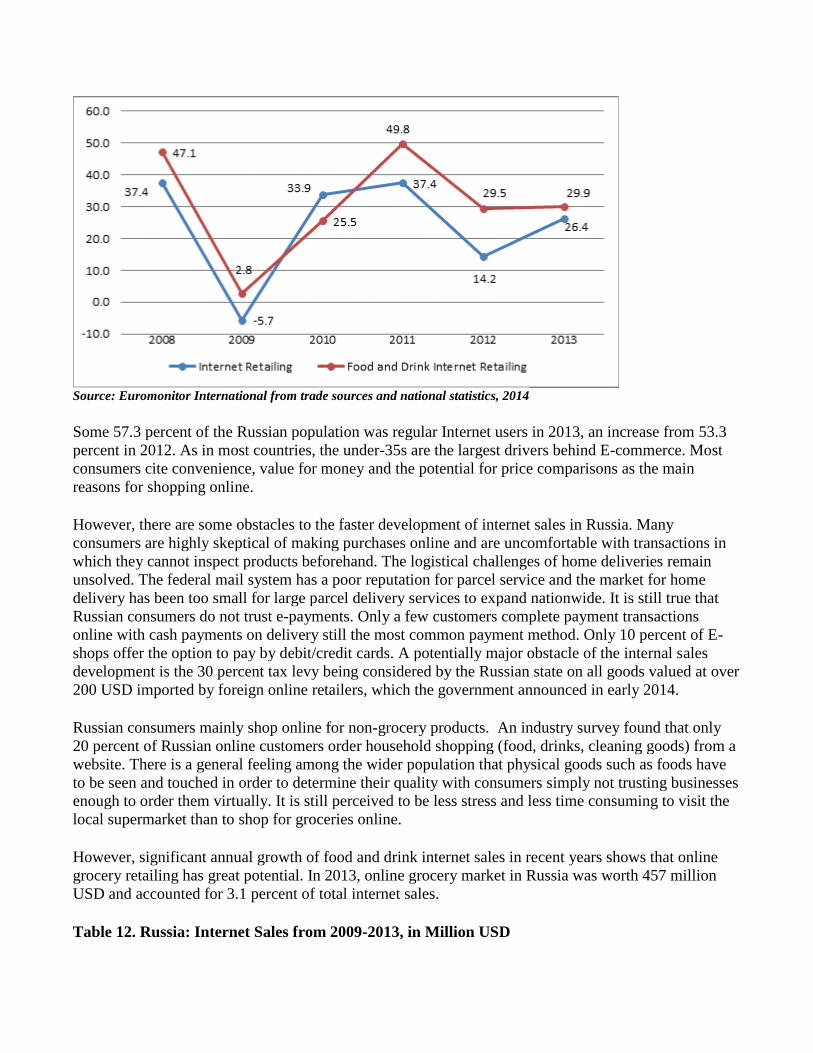
Source: Euromonitor International from trade sources and national statistics, 2014 Some 57.3 percent of the Russian population was regular Internet users in 2013, an increase from 53.3
percent in 2012. As in most countries, the under-35s are the largest drivers behind E-commerce. Most
consumers cite convenience, value for money and the potential for price comparisons as the main
reasons for shopping online.
However, there are some obstacles to the faster development of internet sales in Russia. Many
consumers are highly skeptical of making purchases online and are uncomfortable with transactions in
which they cannot inspect products beforehand. The logistical challenges of home deliveries remain
unsolved. The federal mail system has a poor reputation for parcel service and the market for home
delivery has been too small for large parcel delivery services to expand nationwide. It is still true that
Russian consumers do not trust e-payments. Only a few customers complete payment transactions
online with cash payments on delivery still the most common payment method. Only 10 percent of E-
shops offer the option to pay by debit/credit cards. A potentially major obstacle of the internal sales
development is the 30 percent tax levy being considered by the Russian state on all goods valued at over
200 USD imported by foreign online retailers, which the government announced in early 2014.
Russian consumers mainly shop online for non-grocery products. An industry survey found that only
20 percent of Russian online customers order household shopping (food, drinks, cleaning goods) from a
website. There is a general feeling among the wider population that physical goods such as foods have
to be seen and touched in order to determine their quality with consumers simply not trusting businesses
enough to order them virtually. It is still perceived to be less stress and less time consuming to visit the
local supermarket than to shop for groceries online.
However, significant annual growth of food and drink internet sales in recent years shows that online
grocery retailing has great potential. In 2013, online grocery market in Russia was worth 457 million
USD and accounted for 3.1 percent of total internet sales.
Table 12. Russia: Internet Sales from 2009-2013, in Million USD
Category 2009 2010 2011 2012 2013 Growth, %
2011/2012
Internet Retailing 4,947 6,640 9,125 11,737 14,839 26.4
Food and Drink Internet
Retailing 136.8 172.2 258.0 351.5 456.7 29.9
Source: Euromonitor International from trade sources and national statistics, 2014 Tourism Sales
The strong growth in household disposable incomes has driven a travel boom in Russia with access to
budget trips through a growing number of travel agents meaning more frequent holidays. A typical
Russian family is likely to go abroad once a year while more mobile couples and young professionals
will vacation at least twice. Locations such as Egypt, Turkey and Thailand are the most widely visited
due to the large number of budget options available there while more upmarket locations include
countries in Western Europe, the Caribbean and Mexico. Spring, summer and winter months are the
most popular times for holidays. Ten days to two weeks is the most common period of time spent
abroad on vacation, according to numerous travel agencies in Moscow. Turkey is the leader in the
number of tours sold in Russia. Package holidays have certainly registered the greatest rise in demand
among consumers with per capita expenditure on package holidays rising from 73 USD in 2005 to 116
USD in 2013, with this figure expected to continue increasing to 140 USD by 2016.
Currently, internal tourism in Russia is relatively underdeveloped with the possible exception of the city
of St. Petersburg. Therefore, Russia has unique opportunities both for the development of internal
tourism and for reception of foreign travelers. A variety of landscapes (mountains, sea, rivers, woods,
tundra) allows forth development of different kinds of tourism, e.g. beach vacation, ecotourism, ski
vacation, etc. In 2011, Russian President Vladimir Putin announced a government initiative called
“Development of domestic tourism in Russia” with 7 billion Rubles (233 million USD) allocated from
the federal budget in order to realize enhance tourism in Russia from 2011-2016 (source: Rossiyskaya
Gazeta).
The hotel market, which has been traditionally underserved in Russia, is growing quickly and growth in
the tourism sector will spur further development of Russia’s hotels and restaurants. This is expected to
lead to better quality services and offer new opportunities for U.S. exporters of food and beverages to
Russia. Russian consumers have started to do more domestic tourism, which was largely unfashionable
in Russia until recently. The country’s Black Sea beach resorts are extremely congested during the peak
summer months even though it is more economical to go abroad. Few visitors can afford to stay in
hotels in elite Russian beach resorts.
However, niche tourism has developed rapidly in the country catering to specific Russian tastes for non-
family tourism, which includes adventure travelling, health tourism and skiing. Hunting in the
country’s wild interior is especially popular among males, both old and young, while off-roading in both
cars and snowmobiles is a popular form of adventure travel. Holy sites and places associated with
natural healing are also popular among older populations.
Table 13. Russia: Tourism in Russia (USD per capita, at Constant Prices)
Category 2005 2011 2012 2013 2016
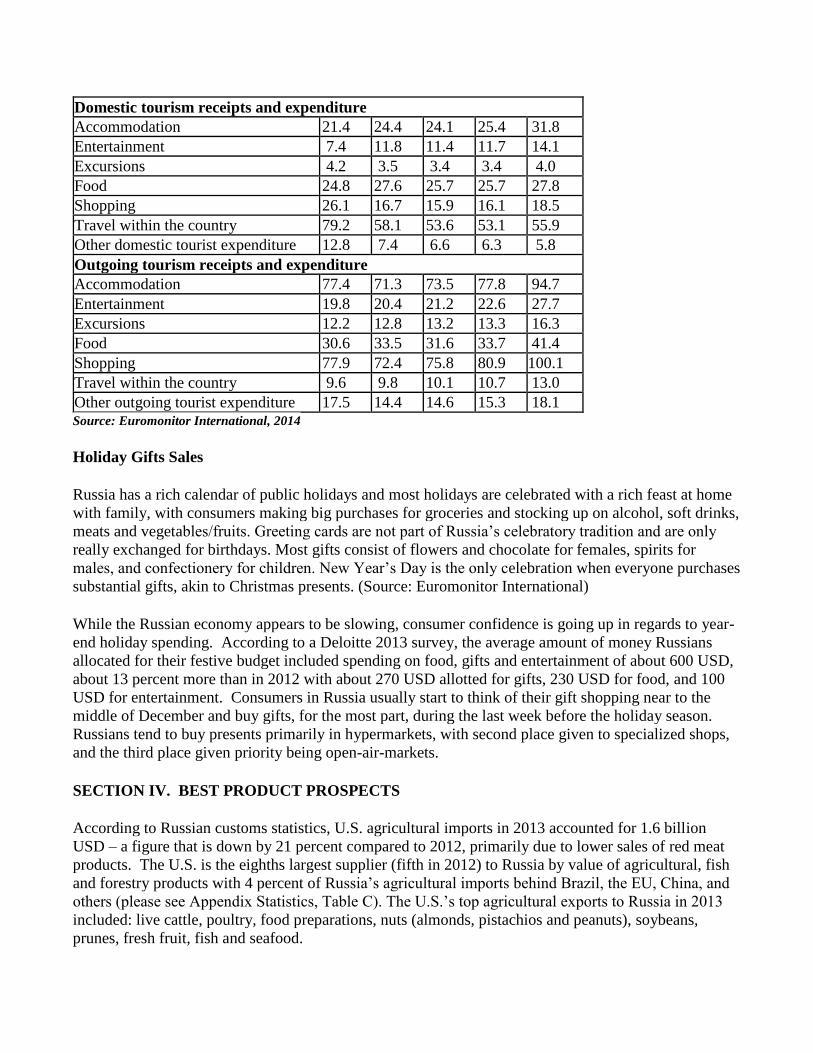
Domestic tourism receipts and expenditure Accommodation 21.4 24.4 24.1 25.4 31.8
Entertainment 7.4 11.8 11.4 11.7 14.1
Excursions 4.2 3.5 3.4 3.4 4.0
Food 24.8 27.6 25.7 25.7 27.8
Shopping 26.1 16.7 15.9 16.1 18.5
Travel within the country 79.2 58.1 53.6 53.1 55.9
Other domestic tourist expenditure 12.8 7.4 6.6 6.3 5.8
Outgoing tourism receipts and expenditure Accommodation 77.4 71.3 73.5 77.8 94.7
Entertainment 19.8 20.4 21.2 22.6 27.7
Excursions 12.2 12.8 13.2 13.3 16.3
Food 30.6 33.5 31.6 33.7 41.4
Shopping 77.9 72.4 75.8 80.9 100.1
Travel within the country 9.6 9.8 10.1 10.7 13.0
Other outgoing tourist expenditure 17.5 14.4 14.6 15.3 18.1 Source: Euromonitor International, 2014 Holiday Gifts Sales
Russia has a rich calendar of public holidays and most holidays are celebrated with a rich feast at home
with family, with consumers making big purchases for groceries and stocking up on alcohol, soft drinks,
meats and vegetables/fruits. Greeting cards are not part of Russia’s celebratory tradition and are only
really exchanged for birthdays. Most gifts consist of flowers and chocolate for females, spirits for
males, and confectionery for children. New Year’s Day is the only celebration when everyone purchases
substantial gifts, akin to Christmas presents. (Source: Euromonitor International)
While the Russian economy appears to be slowing, consumer confidence is going up in regards to year-
end holiday spending. According to a Deloitte 2013 survey, the average amount of money Russians
allocated for their festive budget included spending on food, gifts and entertainment of about 600 USD,
about 13 percent more than in 2012 with about 270 USD allotted for gifts, 230 USD for food, and 100
USD for entertainment. Consumers in Russia usually start to think of their gift shopping near to the
middle of December and buy gifts, for the most part, during the last week before the holiday season.
Russians tend to buy presents primarily in hypermarkets, with second place given to specialized shops,
and the third place given priority being open-air-markets.
SECTION IV. BEST PRODUCT PROSPECTS
According to Russian customs statistics, U.S. agricultural imports in 2013 accounted for 1.6 billion
USD – a figure that is down by 21 percent compared to 2012, primarily due to lower sales of red meat
products. The U.S. is the eighths largest supplier (fifth in 2012) to Russia by value of agricultural, fish
and forestry products with 4 percent of Russia’s agricultural imports behind Brazil, the EU, China, and
others (please see Appendix Statistics, Table C). The U.S.’s top agricultural exports to Russia in 2013
included: live cattle, poultry, food preparations, nuts (almonds, pistachios and peanuts), soybeans,
prunes, fresh fruit, fish and seafood.
Russia’s accession to the World Trade Organization (WTO) has helped to bring some of the country’s
legal and regulatory regimes closer in line with internationally accepted practices. Also, while Russia’s
stated goal to be self-sufficient in categories such as meat and dairy products may, to some extent, limit
U.S. exports of those products, these goals may also create new opportunities for U.S. exporters to
supply high protein feeds and animal genetics.
Sub-Sector Best Prospects Includes:
Animal Genetics While Russia’s stated goal to be self-sufficient in categories such as meat and dairy products may, to
some extent, limit U.S. exports of those products, these goals may also create new market opportunities
for U.S. exporters to supply high protein feeds and animal genetics. The Russian government has
adopted several plans to stimulate development of the dairy, poultry, pork, and beef sectors. As market
access for meat and poultry continues to be limited through quotas and/or the imposition of trade
restrictive SPS measures, the demand and opportunity for higher quality animal genetics is expected to
continue to grow. Demand exists for both dairy cattle, specifically registered Holsteins, as well as beef
cattle, particularly Angus.
For example, Russian government subsidies and current development projects facilitated the import of
37,725 head of cattle in 2010, 94,468 in 2011,137,613 in 2012, and 96,826 in 2013, from around the
world. The United States is well-positioned to be a major supplier into the future, especially for
producers seeking the best genetics in the global market. The United States was the largest exporter of
live bovine animals to Russia in 2013 and the market also continues to grow for semen and embryos.
In addition, hatching eggs and chick exports to Russia remain important for the expanding Russian
poultry and egg sector, and, as a result, most import tariffs are set at zero. Swine genetics also remain
an area of opportunity.
Edible Tree Nuts Russia’s commercial nut production is limited to pine nuts and, therefore, Russia is entirely dependent
on imports for all other tree nuts. In 2013, imports of tree nuts reached 73,081 metric tons (MT) valued
at 384.4 million USD – down 18 percent in volume and down 10 percent in value compared with 2012.
The overall drop in 2013 resulted from a bad harvest of pistachios in Iran – a major supplier to Russia.
The Russian tree nut market is far from saturated and has good potential for further expansion. Per
capita tree nut consumption is only around 0.69 kilograms (kg) including imported sweetened nuts and
seeds, which is significantly lower than consumption levels in European countries, the United States,
Japan, and China. According import statistics, the most popular nut in Russia is the almond (25 percent
of the market in volume terms), followed by pistachio (20 percent), hazelnut (14.5 percent), coconut (12
percent), walnut and cashew (10 percent each).
The major suppliers of tree nuts to Russia are the United States (almonds), Iran (pistachios), Indonesia
(coconuts), Turkey (hazelnuts), Ukraine (walnuts), and Vietnam (cashews). In 2013, the United States
was the largest supplier of tree nuts to Russia with a 40 percent market share of which the U.S. had 90
percent share of almonds and 16 percent of pistachios. U.S. sales in calendar year (CY) 2013 grew by
28 percent to a new record of 184 million USD. The best prospects for American tree nuts exports to
Russia are as follows:
Almonds: Russia imports roughly 90 percent of all its almonds from the United States on any given
year. In CY 2013, U.S. almond sales exceeded 125 million USD setting a new record. The trend is
expected to continue driven by growing demand from the confectionary, bakery, and other food
processing industries (consuming 65 percent of shelled almonds) and growing consumption of nuts as a
healthy snack leading to sales of high grades of shelled and in-shell almonds.
Pistachios: Russia is one of the largest importers of pistachios in the world in 2013, with market
volume at 12,474 MT valued at 107 million USD. 95 percent of imported pistachios are in shell, most of
which goes to snack packing or sold “loose” via retail. The popularity of pistachios as a snack product,
along with rising incomes, in Russia are driving the demand for quality pistachios and offers a great
opportunity for U.S. pistachio exporters. Iran is the main supplier of pistachios with roughly 75 percent
market share followed by the United States. In 2013, U.S. sales grew by over 46 percent reaching 5,528
MT valued at more than 55.5 million USD – a new record. Growth in this market is expected to
continue as Russia’s confectionary and food processing sectors continue to develop. However,
American pistachios sales are directly affected by the crop situation in Iran, the main supplier of
pistachios to Russia.
Pecans: In 2013, Russian imported 534 MT of pecans valued at 4.7 million USD, up 288 percent
compared to the previous year – a new record. Mexico and the United States are the main suppliers with
close to 50 percent share. Due to high prices for pecans compared to other nuts as well as insufficient
knowledge about nutrition and application options for pecans in the confectionary industry, demand is
somewhat unstable. However, taking into account growing interest in high quality natural ingredients in
Russia, increased pecan exports are expected especially with greater informational outreach to the
confectionary industry and consumers.
Fish and Seafood During CY 2013, Russia’s imports of fish and fish products reached almost 3 billion USD, a 16 percent
increase from 2012. Fish and seafood exports from the United States to Russia rebounded significantly
in 2013 and reached a record 77 million USD, double the level of 2012. The increase in imports from
the United States is mostly attributed to higher imports of salmon roe due to better than expected harvest
of salmon in Alaska. Salmon roe imports from the United States reached 33.4 million USD in 2013,
accounting for a market share of 43 percent share of all fish and seafood imports from the United
States. In addition to salmon roe, the other major fish species imported from the United States to Russia
include: Alaska Pollock, Frozen (HS30494), with a market share of 16 percent or 12.5 million USD,
frozen hake (HTS 030366), equating to 11.5 percent of U.S. fish and seafood trade to Russia, followed
by Fish meat, Frozen (HS030499) with 4.6 percent share. The U.S. still currently supplies only about 2
percent of total fish and seafood products to Russia, which indicates that there is massive room for
growth. . Because of this growing market, U.S. fish and seafood producers will continue to be able to
find new market opportunities in Russia as consumers’ incomes rise, demand continues to boom, and
consumer habits continue to change.
The importation of high value seafood, such as cold-water shrimps and prawns, live lobsters and cuttle
fish has also significantly increased, due to consumer preference and rising incomes. Fish consumption patterns will continue to depend heavily on household income, prices, and
preferences within the population. Russian consumers tend to prefer the following: herring, pollock,
mackerel, salmon and trout. Frozen fish is also traditionally popular in Russia.
Fresh Fruit (Apples, Pears, Grapes, Citrus) Russia is the world’s 2
rd largest importer of fresh fruits and is the largest import market for apples and
pears. In 2013, Russian imports reached 5.63 billion USD - a 1.8 percent increase compared with 2012.
The United States exported 22,788 MT of fresh fruits to Russia valued at 33.7 million USD, up 43
percent in volume and up 47 percent in value compared to 2012. Apples, pears, grapes, and
pomegranates are the major fruits varieties that traditionally come from the United States, and, if priced
appropriately for the market, have opportunities for expansion.
Fruit sales in general are on a long term steady increase in Russia. In 2013, per capita fruit consumption
in Russia increased 4.7 percent reaching 74.4 kilograms. Russians are still hesitant, however, to go back
to their pre-2008 crisis high spending levels despite signs that purchasing power is increasing due to the
higher income and lower unemployment. Consumers remain cautious and their purchasing behavior
reflects a calculated balance between price and quality. In 2014, fruit consumption is expected to grow
supported by the growing “healthy eating” trend in Russia. Russians mainly buy apples, bananas, pears,
and citrus.
Imports have grown from 3.8 million MT in 2005 to 5.9 MT in 2013, while the value during this time
nearly tripled to 5.63 billion USD in 2013. The largest overall fruit suppliers to Russia are Ecuador
(bananas), Poland (apples), Turkey (citrus, grapes, and stone fruits), China (apples, citrus, stone fruits),
Argentina (apples, pears, and citrus), and Chile (grapes). Russia is the priority export market for many
former Soviet republic countries, European countries, Turkey, and Northern African producers due to
the close proximity to Russia and long term relations with Russian buyers.
Apples: Apples are, without questions, the favorite fruit in Russia. In 2013, Russia was the largest
importer of apples in the world having purchased 1.28 million MT valued at 759.1 million USD. The
United States’ market share in Russia is very low - around 1 percent as U.S. apples are typically more
expensive and compete with Italy, Belgium, Germany, and the Netherlands in the higher-cost and
quality segment. The total share of these higher-quality apples in Russia is around 20 percent. With
decreasing tariffs as a result of World Trade Organization (WTO) accession, these quality apples will be
somewhat more affordable in Russia. U.S. apples have the potential for increased sales to Russia
especially considering that Russian consumers like large, richly colored apples - characteristics that U.S.
suppliers can normally provide.
Pears: Pears are one of the most popular fruits in Russia following apples, citrus, and bananas and
consumption is growing. Russia doesn’t produce this fruit commercially and is the world’s largest
importer of pears. In 2013, pear imports decreased by 14 percent compared to 2012 valued at 375
million USD. While most of Russia’s main pear suppliers lost market share in 2013, U.S. sales of pears
increased 42 percent compared to the previous year. American pears have seen remarkable growth in
recent years, rising from just over 1 million USD worth in 2004 to over 12 million USD worth in 2013.
Market share of U.S. pears remains low in Russia at only 3 percent of the total pear market. U.S. pears
will always face strong competition from European pears but the huge Russian market allows for ample
opportunity for expansion. In order to diversify product offerings, importers have strong interest in U.S.
Anjou pears, which are not a typical European grown variety.
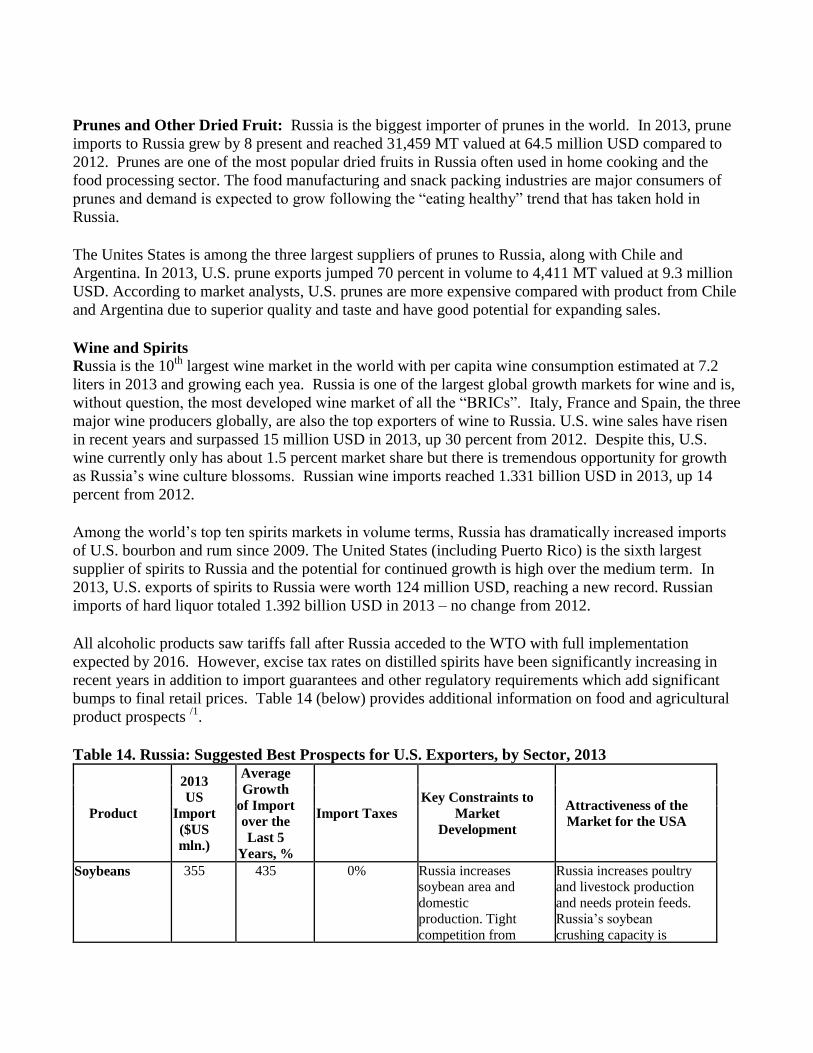
Prunes and Other Dried Fruit: Russia is the biggest importer of prunes in the world. In 2013, prune
imports to Russia grew by 8 present and reached 31,459 MT valued at 64.5 million USD compared to
2012. Prunes are one of the most popular dried fruits in Russia often used in home cooking and the
food processing sector. The food manufacturing and snack packing industries are major consumers of
prunes and demand is expected to grow following the “eating healthy” trend that has taken hold in
Russia.
The Unites States is among the three largest suppliers of prunes to Russia, along with Chile and
Argentina. In 2013, U.S. prune exports jumped 70 percent in volume to 4,411 MT valued at 9.3 million
USD. According to market analysts, U.S. prunes are more expensive compared with product from Chile
and Argentina due to superior quality and taste and have good potential for expanding sales.
Wine and Spirits Russia is the 10
th largest wine market in the world with per capita wine consumption estimated at 7.2
liters in 2013 and growing each yea. Russia is one of the largest global growth markets for wine and is,
without question, the most developed wine market of all the “BRICs”. Italy, France and Spain, the three
major wine producers globally, are also the top exporters of wine to Russia. U.S. wine sales have risen
in recent years and surpassed 15 million USD in 2013, up 30 percent from 2012. Despite this, U.S.
wine currently only has about 1.5 percent market share but there is tremendous opportunity for growth
as Russia’s wine culture blossoms. Russian wine imports reached 1.331 billion USD in 2013, up 14
percent from 2012.
Among the world’s top ten spirits markets in volume terms, Russia has dramatically increased imports
of U.S. bourbon and rum since 2009. The United States (including Puerto Rico) is the sixth largest
supplier of spirits to Russia and the potential for continued growth is high over the medium term. In
2013, U.S. exports of spirits to Russia were worth 124 million USD, reaching a new record. Russian
imports of hard liquor totaled 1.392 billion USD in 2013 – no change from 2012.
All alcoholic products saw tariffs fall after Russia acceded to the WTO with full implementation
expected by 2016. However, excise tax rates on distilled spirits have been significantly increasing in
recent years in addition to import guarantees and other regulatory requirements which add significant
bumps to final retail prices. Table 14 (below) provides additional information on food and agricultural
product prospects /1
.
Table 14. Russia: Suggested Best Prospects for U.S. Exporters, by Sector, 2013
Product
2013
US
Import ($US
mln.)
Average
Growth
of Import
over the
Last 5
Years, %
Import Taxes Key Constraints to
Market
Development
Attractiveness of the
Market for the USA
Soybeans 355 435 0% Russia increases
soybean area and
domestic production. Tight
competition from
Russia increases poultry
and livestock production
and needs protein feeds. Russia’s soybean
crushing capacity is
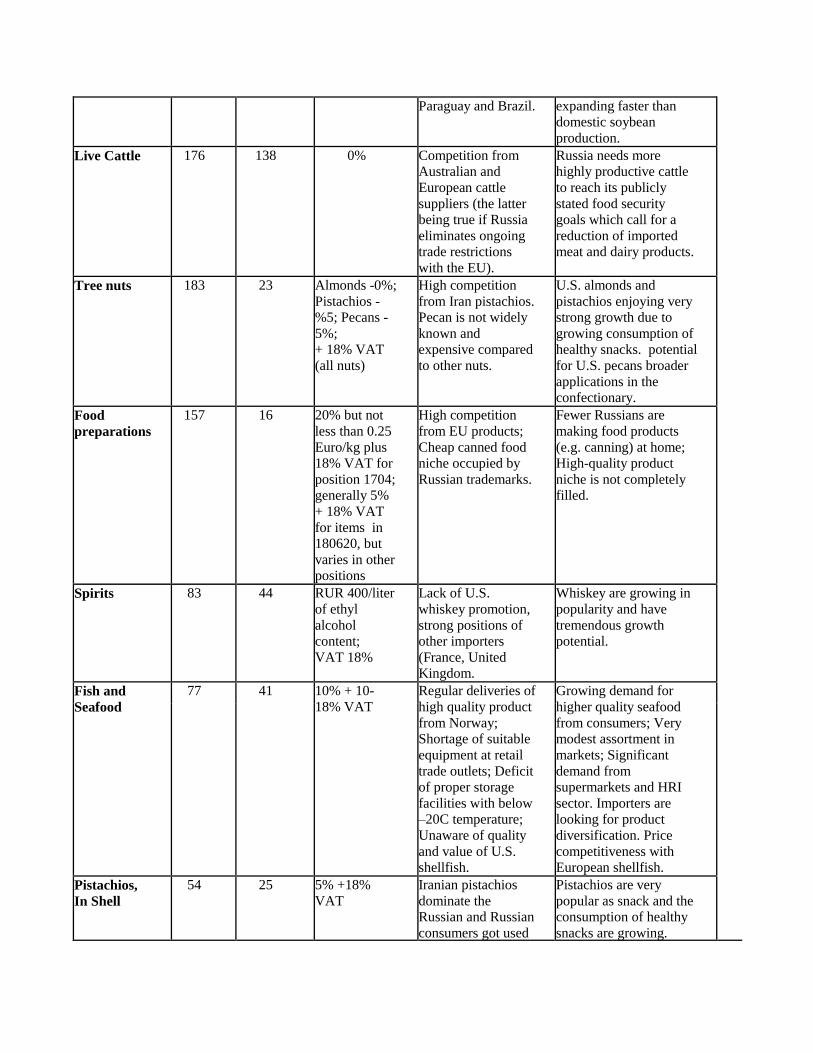
Paraguay and Brazil. expanding faster than
domestic soybean
production. Live Cattle 176 138 0% Competition from
Australian and
European cattle
suppliers (the latter
being true if Russia
eliminates ongoing
trade restrictions
with the EU).
Russia needs more
highly productive cattle
to reach its publicly
stated food security
goals which call for a
reduction of imported
meat and dairy products.
Tree nuts 183 23 Almonds -0%; Pistachios -
%5; Pecans -
5%; + 18% VAT
(all nuts)
High competition
from Iran pistachios.
Pecan is not widely
known and
expensive compared
to other nuts.
U.S. almonds and
pistachios enjoying very
strong growth due to
growing consumption of
healthy snacks. potential
for U.S. pecans broader
applications in the
confectionary.
Food
preparations 157 16 20% but not
less than 0.25
Euro/kg plus
18% VAT for
position 1704;
generally 5%
+ 18% VAT
for items in
180620, but
varies in other
positions
High competition
from EU products;
Cheap canned food
niche occupied by
Russian trademarks.
Fewer Russians are
making food products
(e.g. canning) at home;
High-quality product
niche is not completely
filled.
Spirits 83 44 RUR 400/liter
of ethyl
alcohol
content; VAT 18%
Lack of U.S.
whiskey promotion,
strong positions of
other importers
(France, United
Kingdom.
Whiskey are growing in
popularity and have
tremendous growth
potential.
Fish and
Seafood 77 41 10% + 10-
18% VAT Regular deliveries of
high quality product
from Norway;
Shortage of suitable
equipment at retail
trade outlets; Deficit
of proper storage
facilities with below
–20C temperature;
Unaware of quality
and value of U.S.
shellfish.
Growing demand for
higher quality seafood
from consumers; Very
modest assortment in
markets; Significant
demand from
supermarkets and HRI
sector. Importers are
looking for product
diversification. Price
competitiveness with
European shellfish.
Pistachios,
In Shell 54 25 5% +18%
VAT Iranian pistachios
dominate the Russian and Russian
consumers got used
Pistachios are very
popular as snack and the consumption of healthy
snacks are growing.
to them. American
pistachios are more
expensive and differ
in taste.
Russians are now
developing a taste for
California pistachios and
like the taste and big size
of U.S. pistachios. Fresh Fruit 34 17 Apples: 0.052-
0.17 per kg
depending on
the season;
Pears: 8.3%; + 18% VAT
Strong competition
from Poland, China,
Chile, New Zealand,
Moldova for apples;
Argentina and China
for pears.
U.S. apples and pears is
recognized for good
quality and long shelf
life. In the Russian Far
East America is the
second biggest supplier
of fresh produce after
China. Western Russia
has good sales when
American fruits can
compete in price with
EU especially during
February- April period.
Wine 16 26 RUR 7-
24/liter of
ethyl alcohol
content; VAT 18%
Lack of U.S. wine
promotion, strong
positions of other
importers (France,
Italy, Spain, and
Argentina).
California wine is
growing in popularity
and has good potential
for growth.
Prunes 9 31 5% +18%
VAT Strong Competition
from Chile and
Argentina. American prunes are
very often more
expensive.
Russia is the largest
importer on prunes in the
world. American prunes
are well known for
quality. Low crops in
South America increase
demand for California
prunes drastically.
Pet food 7 18 20%, but not
less than 0.16
Euros/kg +
18% VAT
Strong tradition of
feeding pets with
table scraps; Strong
local production
with foreign
investments - Mars
has two plants that
produce pet food.
Traditionally large
number of home pets;
Increased population
incomes followed by
growing demand for
ready to use pet food.
Snack Foods 8 46 5% - 15%, but
not less than
0.15 – 0.075
Euro/kg (duty
depends on
product, size
of package,
sugar content,
etc.) + 10% -
18% VAT
Strong competition
from local
producers, including
some foreign brands
such as Lay’s
(PepsiCo) and
Estrella (Kraft) –
Pringles from
Europe.
Good potential for high
quality U.S. snacks:
popcorn, nuts, and dried
fruits mixes.
Source: Global Trade Atlas, U.S. Trade Database, Russian Tariff Database * Growth available for 2012/2013 1/
Food products listed in Table 13 are based on market intelligence, including discussions with retailers and data analysis
efforts, and should not be considered an official endorsement by the United States Department of Agriculture or any
affiliated agencies. SECTION V. KEY CONTACTS AND FURTHER INFORMATION
Contact Information for FAS Offices in Russia and in the United States
U.S. Agricultural Trade Office Headquarters, Moscow
Email: [email protected]
Erik Hansen, ATO Director
E-mail: [email protected]
Alla Putiy, Marketing Specialist
E-mail: [email protected]
Olga Ivanova, Marketing Specialist
E-mail: [email protected]
Tatyana Kashtanova, Administrative Assistant
E-mail: [email protected]
Street address (for express parcels):
U.S. Agricultural Trade Office
American Embassy
Bolshoy Devyatinskiy pereulok, 8
121099 Moscow, Russia
Tel: 7 (495) 728-5560
www.usda.ru
For mail coming from the U.S. (delivery may take 2 to 4 weeks):
Director, Agricultural Trade Office
5430 Moscow Place, Box 355
Washington, DC 20521-5430
Covering Northwest Russia (St. Petersburg):
Svetlana Ilyina, ATO Marketing Specialist
American Consulate General
Furshtatskaya Street 15
191028, St. Petersburg, Russia
Tel: 7 (812) 331-2880
E-mail: [email protected]
Covering the Russian Far East (Vladivostok):
Temporarily Vacant
American Consulate General
Pushkinskaya street, 32
690001 Vladivostok, Russia
Tel: 7 (4232) 300-089
For General Information on FAS/USDA Market Promotion Programs and Activities:
Office of Trade Programs
U.S. Department of Agriculture
Foreign Agricultural Service
1400 Independence Ave., S.W.
Washington, DC 20250
http://www.fas.usda.gov/OTP_contacts.asp
FAS Website: www.fas.usda.gov
For Trade Policy/Market Access Issues, General Information on the Russian Agricultural Sector, etc:
Holly Higgins , Agricultural Minister-Counselor
Robin Gray, Senior Agricultural Attaché
Christopher Riker, Agricultural Attaché
Office of Agricultural Affairs
American Embassy
5430 Moscow Place
Dulles, VA 20189
Fax: 7 (495) 728-5133 or 728 5102
Tel: 7 (495) 728-5222
E-mail: [email protected]
Other Useful Contacts
The Agricultural Trade office works with a large number of U.S. industry organizations, several of
which are resident in Russia. These cooperators share the view that Russia is a promising market for
food products.
Alaska Seafood Marketing Institute
Ksenia Gorovaya (St. Petersburg)
Address: 194223, St. Petersburg, Russia, Orbeli str., 25/3, office 7
Tel: 7 (921) 637-4199
E-mail: [email protected]
www.alaskaseafood.ru
Almond Board of California
Irina Koziy
29/1 Generala Tyuleneva Str., 117465, Moscow, Russia
Tel: 7 (495) 729-3080
E-mail: [email protected]
http://www.Almonds.ru
California Prune Board
Mark Dorman
Suite 18, Harborough Innovation Centre
Airfield Business Par, Leicester Road
Market Harborough, Leicestershire
LE16 7QX
UK
Tel: +44 (0) 1858 414218
E-mail: [email protected]
California Table Grape Commission
Ksenia Gorovaya (St. Petersburg)
Address: 194223, St. Petersburg, Russia, Orbeli str., 25/3, office 7
Tel: 7 (921) 637-4199
E-mail: [email protected]
http://crispconsulting.ru/
Katerina Akulenko (Vladivostok)
Address: 690090 Vladivostok, Russia, Svetlanskaya str., 37, Office 2
Tel.: 7 (4232) 56-5536
E-mail: [email protected]
Cranberry Marketing Committee
Ksenia Gorovaya (St. Petersburg)
Address: 194223, St. Petersburg, Russia, Orbeli str., 25/3, office 7 Tel.: 7 (921) 637-4199 E-mail: [email protected] Web : www.uscranberries.com
Pear Bureau Northwest
Katerina Akulenko (Vladivostok)
Address: 690090 Vladivostok, Russia, Svetlanskaya str., 37, Office 2
Tel.: 7 (4232) 56-5536
E-mail: [email protected]
http://www.usapears.ru
Ksenia Gorovaya (St. Petersburg)
Address: 194223, St. Petersburg, Russia, Orbeli str., 25/3, office 7
Tel: +7 (921) 637-4199
E-mail: [email protected]
http://crispconsulting.ru/
USA Poultry and Egg Export Council (USAPEEC)
Albert Davleyev
Address: 123592 Moscow, Russia, Kulakova str., 20, Building 1A
Tel: 7 (495) 781-9200
E-mail: [email protected], [email protected]
http://www.usapeec.ru
U.S. Meat Export Federation (USMEF)
Galina Kochubeyeva (Moscow)
Address: 119049 Moscow, Russia, Leninsky Prospekt, 2, 9th Floor, Business Center
Tel.: 7 (495) 544-9387
E-mail: [email protected], [email protected]
Yuriy Barutkin (St. Petersburg)
Address: 190031 St. Petersburg, Russia, Yefimova str., 4a, office 303
Tel.: 7 (812) 309-1101
E-mail: [email protected]
USA Dry Pea and Lentil Irina Koziy Address: 117465, Moscow, Russia, Generala Tuleneva str., 29/1 Tel: 7 (495) 729-3080 Fax: 7 (495) 989-2670 Email: [email protected]
U.S. Wheat Associates Valentina Shustova Address: 129090 Moscow, Russia, Gilyarovskogo Str., 4, Stroyeniye 5, Office 101 Fax: 7 (495) 207-4203 Tel.: 7 (495) 956-9081; 7 (495) 208-8124 E-mail: [email protected] www.uswheat.ru
Washington Apple Commission
Ksenia Gorovaya (St. Petersburg)
Address: 194223, St. Petersburg, Russia, Orbeli str., 25/3, office 7
Tel: 7 (921) 637-4199
E-mail: [email protected]
www.bestapples.ru
Katerina Akulenko (Vladivostok)
Address: 690090 Vladivostok, Russia, Svetlanskaya str., 37, Office 2
Tel.: 7 (4232) 56-5536
E-mail: [email protected]
Wine Institute of California
Olga Tuzmukhamedova
Address: 127521 Moscow, Russia, Staromarinskoe shosse, 14-77
Tel: +7 926-389-5745
E-mail: [email protected]
http://www.discovercaliforniawines.com/
The American Chamber of Commerce is another good source for information on doing business in
Russia. The Chamber has offices in Moscow and St. Petersburg.
American Chamber of Commerce in Russia (AmCham)
Ul. Dolgorukovskaya, Building 7, 14th floor
127006 Moscow, Russia
Tel: 7 (495) 961-2141
Email: [email protected]
http://amcham.ru/
American Chamber of Commerce in St. Petersburg
Ulitsa Yakubovicha 24, left wing, 3rd
Floor
190000 St. Petersburg, Russia
Tel: 7 (812) 448-1646
Email: [email protected]
http://amcham.ru/spb/
The U.S Commercial Service has offices in Moscow, St. Petersburg, and Vladivostok. For questions
regarding agricultural machinery, food processing and packaging equipment or materials, refrigeration
equipment, and other industrial products, please contact:
U.S. Commercial Service
Bolshoy Devyatinskiy pereulok, 8
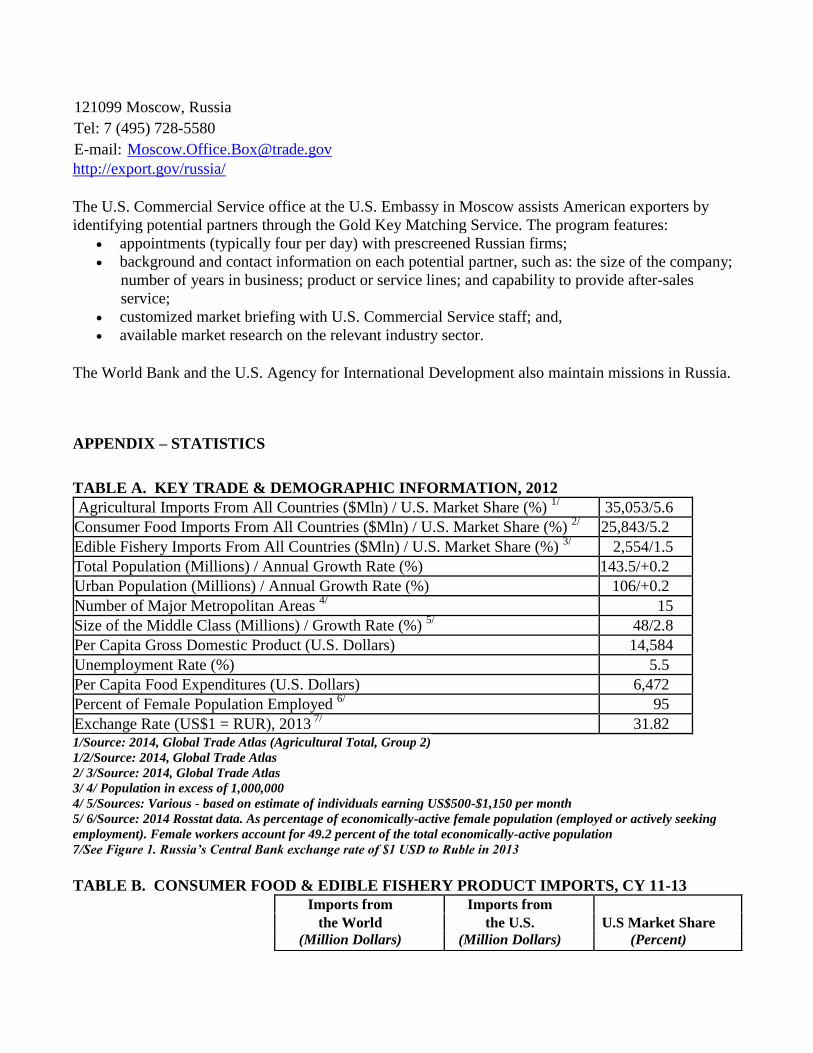
121099 Moscow, Russia
Tel: 7 (495) 728-5580
E-mail: [email protected]
http://export.gov/russia/
The U.S. Commercial Service office at the U.S. Embassy in Moscow assists American exporters by
identifying potential partners through the Gold Key Matching Service. The program features: appointments (typically four per day) with prescreened Russian firms; background and contact information on each potential partner, such as: the size of the company;
number of years in business; product or service lines; and capability to provide after-sales
service; customized market briefing with U.S. Commercial Service staff; and, available market research on the relevant industry sector.
The World Bank and the U.S. Agency for International Development also maintain missions in Russia.
APPENDIX – STATISTICS TABLE A. KEY TRADE & DEMOGRAPHIC INFORMATION, 2012 Agricultural Imports From All Countries ($Mln) / U.S. Market Share (%)
1/ 35,053/5.6
Consumer Food Imports From All Countries ($Mln) / U.S. Market Share (%) 2/ 25,843/5.2
Edible Fishery Imports From All Countries ($Mln) / U.S. Market Share (%) 3/ 2,554/1.5
Total Population (Millions) / Annual Growth Rate (%) 143.5/+0.2
Urban Population (Millions) / Annual Growth Rate (%) 106/+0.2
Number of Major Metropolitan Areas 4/
15
Size of the Middle Class (Millions) / Growth Rate (%) 5/ 48/2.8
Per Capita Gross Domestic Product (U.S. Dollars) 14,584
Unemployment Rate (%) 5.5
Per Capita Food Expenditures (U.S. Dollars) 6,472
Percent of Female Population Employed 6/ 95
Exchange Rate (US$1 = RUR), 2013 7/ 31.82
1/Source: 2014, Global Trade Atlas (Agricultural Total, Group 2) 1/2/Source: 2014, Global Trade Atlas 2/ 3/Source: 2014, Global Trade Atlas 3/ 4/ Population in excess of 1,000,000 4/ 5/Sources: Various - based on estimate of individuals earning US$500-$1,150 per month 5/ 6/Source: 2014 Rosstat data. As percentage of economically-active female population (employed or actively seeking
employment). Female workers account for 49.2 percent of the total economically-active population 7/See Figure 1. Russia’s Central Bank exchange rate of $1 USD to Ruble in 2013
TABLE B. CONSUMER FOOD & EDIBLE FISHERY PRODUCT IMPORTS, CY 11-13
Imports from Imports from U.S Market Share the World the U.S.
(Million Dollars) (Million Dollars) (Percent)
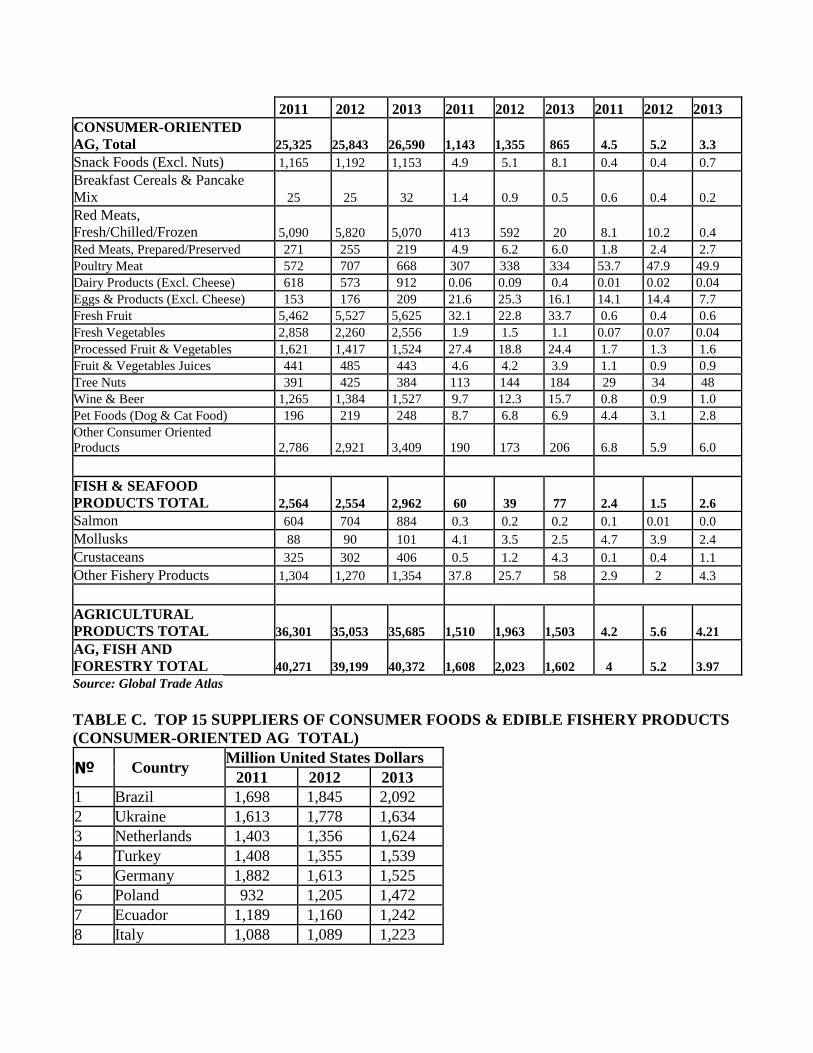
2011 2012 2013 2011 2012 2013 2011 2012 2013 CONSUMER-ORIENTED
AG, Total 25,325 25,843 26,590 1,143 1,355 865 4.5 5.2 3.3 Snack Foods (Excl. Nuts) 1,165 1,192 1,153 4.9 5.1 8.1 0.4 0.4 0.7 Breakfast Cereals & Pancake
Mix 25 25 32 1.4 0.9 0.5 0.6 0.4 0.2 Red Meats,
Fresh/Chilled/Frozen 5,090 5,820 5,070 413 592 20 8.1 10.2 0.4 Red Meats, Prepared/Preserved 271 255 219 4.9 6.2 6.0 1.8 2.4 2.7 Poultry Meat 572 707 668 307 338 334 53.7 47.9 49.9 Dairy Products (Excl. Cheese) 618 573 912 0.06 0.09 0.4 0.01 0.02 0.04 Eggs & Products (Excl. Cheese) 153 176 209 21.6 25.3 16.1 14.1 14.4 7.7 Fresh Fruit 5,462 5,527 5,625 32.1 22.8 33.7 0.6 0.4 0.6 Fresh Vegetables 2,858 2,260 2,556 1.9 1.5 1.1 0.07 0.07 0.04 Processed Fruit & Vegetables 1,621 1,417 1,524 27.4 18.8 24.4 1.7 1.3 1.6 Fruit & Vegetables Juices 441 485 443 4.6 4.2 3.9 1.1 0.9 0.9 Tree Nuts 391 425 384 113 144 184 29 34 48 Wine & Beer 1,265 1,384 1,527 9.7 12.3 15.7 0.8 0.9 1.0 Pet Foods (Dog & Cat Food) 196 219 248 8.7 6.8 6.9 4.4 3.1 2.8 Other Consumer Oriented
Products 2,786 2,921 3,409 190 173 206 6.8 5.9 6.0
FISH & SEAFOOD
PRODUCTS TOTAL 2,564 2,554 2,962 60 39 77 2.4 1.5 2.6 Salmon 604 704 884 0.3 0.2 0.2 0.1 0.01 0.0 Mollusks 88 90 101 4.1 3.5 2.5 4.7 3.9 2.4 Crustaceans 325 302 406 0.5 1.2 4.3 0.1 0.4 1.1 Other Fishery Products 1,304 1,270 1,354 37.8 25.7 58 2.9 2 4.3
AGRICULTURAL
PRODUCTS TOTAL 36,301 35,053 35,685 1,510 1,963 1,503 4.2 5.6 4.21 AG, FISH AND
FORESTRY TOTAL 40,271 39,199 40,372 1,608 2,023 1,602 4 5.2 3.97 Source: Global Trade Atlas TABLE C. TOP 15 SUPPLIERS OF CONSUMER FOODS & EDIBLE FISHERY PRODUCTS
(CONSUMER-ORIENTED AG TOTAL)
№ Country Million United States Dollars
2011 2012 2013 1 Brazil 1,698 1,845 2,092
2 Ukraine 1,613 1,778 1,634
3 Netherlands 1,403 1,356 1,624
4 Turkey 1,408 1,355 1,539
5 Germany 1,882 1,613 1,525
6 Poland 932 1,205 1,472
7 Ecuador 1,189 1,160 1,242
8 Italy 1,088 1,089 1,223
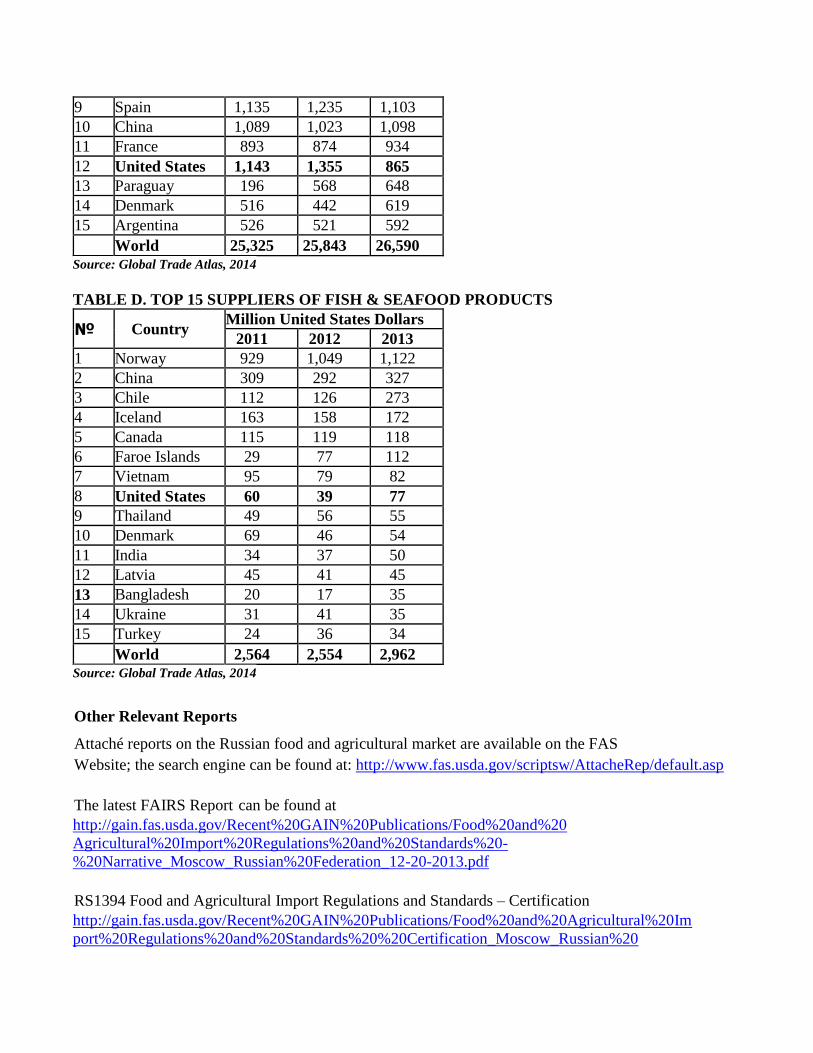
9 Spain 1,135 1,235 1,103
10 China 1,089 1,023 1,098
11 France 893 874 934
12 United States 1,143 1,355 865 13 Paraguay 196 568 648
14 Denmark 516 442 619
15 Argentina 526 521 592
World 25,325 25,843 26,590 Source: Global Trade Atlas, 2014 TABLE D. TOP 15 SUPPLIERS OF FISH & SEAFOOD PRODUCTS
№ Country Million United States Dollars
2011 2012 2013
1 Norway 929 1,049 1,122
2 China 309 292 327
3 Chile 112 126 273
4 Iceland 163 158 172
5 Canada 115 119 118
6 Faroe Islands 29 77 112
7 Vietnam 95 79 82
8 United States 60 39 77 9 Thailand 49 56 55
10 Denmark 69 46 54
11 India 34 37 50
12 Latvia 45 41 45
13 Bangladesh 20 17 35
14 Ukraine 31 41 35
15 Turkey 24 36 34
World 2,564 2,554 2,962 Source: Global Trade Atlas, 2014
Other Relevant Reports Attaché reports on the Russian food and agricultural market are available on the FAS
Website; the search engine can be found at: http://www.fas.usda.gov/scriptsw/AttacheRep/default.asp
The latest FAIRS Report can be found at
http://gain.fas.usda.gov/Recent%20GAIN%20Publications/Food%20and%20 Agricultural%20Import%20Regulations%20and%20Standards%20- %20Narrative_Moscow_Russian%20Federation_12-20-2013.pdf
RS1394 Food and Agricultural Import Regulations and Standards – Certification
http://gain.fas.usda.gov/Recent%20GAIN%20Publications/Food%20and%20Agricultural%20Im port%20Regulations%20and%20Standards%20%20Certification_Moscow_Russian%20
Federation_12-19-2013.pdf
RSATO 1312 Retail Report / Annual http://gain.fas.usda.gov/Recent%20GAIN%20Publications/Retail%20Foods_Moscow%20 ATO_Russian%20Federation_9-3-2013.pdf
RSATO1002 Trade Law Report http://gain.fas.usda.gov/Recent%20GAIN%20Publications/The%20Russian%20Federal% 20Law%20on%20Trade%20_Moscow%20ATO_Russian%20Federation_8-30-2010.pdf
RSATO1305 Russian Food Processing Sector http://gain.fas.usda.gov/Recent%20GAIN%20Publications/Food%20Processing%20 Ingredients_Moscow%20ATO_Russian%20Federation_07.05.2013.pdf
RSATO1320 Russian HRI Sector http://gain.fas.usda.gov/Recent%20GAIN%20Publications/Food%20Service%20- %20Hotel%20Restaurant%20Institutional_Moscow%20ATO_Russian%20Federation _12-27-2013.pdf
RSATO1319 Fresh Deciduous Fruit / Annual http://gain.fas.usda.gov/Recent%20GAIN%20Publications/Fresh%20Deciduous%20Fruit %20Annual_Moscow%20ATO_Russian%20Federation_12-2-2013.pdf
RSATO1109 Russian Organic Market http://gain.fas.usda.gov/Recent%20GAIN%20Publications/Russian%20Organic%20 Market%20Continues%20to%20Grow_Moscow%20ATO_Russian%20Federation _2-15-2013.pdf
RSATO1301 Development of a National Standard for Organic Products in Russia http://gain.fas.usda.gov/Recent%20GAIN%20Publications/Development%20of%20a%20 National%20Standard%20for%20Organic%20Products%20in%20Russia_Moscow%20ATO _Russian%20Federation_2-8-2013.pdf
RSATO1208 Customs Union Technical Regulations on Food Products Labeling http://gain.fas.usda.gov/Recent%20GAIN%20Publications/Customs%20Union%20 Technical%20Regulations%20on%20Food%20Products%20Labeling_Moscow%20 ATO_Russian%20Federation_7-18-2012.pdf
RS1416 Livestock and Products Semi-Annual Report http://gain.fas.usda.gov/Recent%20GAIN%20Publications/Livestock%20and%20 Products%20Semi-annual_Moscow_Russian%20Federation_3-14-2014.pdf
RS1419 Fish and Seafood Production and Trade Update http://gain.fas.usda.gov/Recent%20GAIN%20Publications/Fish%20and%20Seafood%20 Production%20and%20Trade%20Update_Moscow_Russian%20Federation_3-18-2014.pdf
RSATO 1205 Strategy of the Russian Food Industry Development until 2020 http://gain.fas.usda.gov/Recent%20GAIN%20Publications/Strategy%20of%20the% 20Russian%20Food%20Industry%20Development%20until%202020_Vladivostok _Russian%20Federation_6-7-2012.pdf
RSATO1318 Dairy and Products Annual Report http://gain.fas.usda.gov/Recent%20GAIN%20Publications/Dairy%20and%20Products%20 Annual%20Report_Moscow%20ATO_Russian%20Federation_11-14-2013.pdf


