Embed Size (px)
Citation preview

2010 Annual Report
Stillaguamish River
Smolt Trapping Project
Jason Griffith, Charlotte Scofield
February 2012
Stillaguamish Tribe of Indians
Natural Resource Department
Arlington, Washington 98223

2
Table of Contents
Acknowledgments _____________________________________________________________ 4
Introduction ___________________________________________________________________ 5
Study Site __________________________________________________________________ 6
Smolt Trap Description _______________________________________________________ 7
Methods _______________________________________________________________________ 9
Sampling Design _____________________________________________________________ 9
Trap Operation ______________________________________________________________ 9
Environmental Variables _____________________________________________________ 10
Catch Processing ___________________________________________________________ 10
Estimation of Smolt Trap Capture Efficiency______________________________________ 10
Estimation of Chinook Smolt Outmigration. ______________________________________ 12 The Efficiency Trials ______________________________________________________ 13
Estimation of out migrations of smolts. __________________________________________ 15
Egg to Migrant Survival ______________________________________________________ 16
Genetic Analysis ____________________________________________________________ 17
Results ______________________________________________________________________ 17
Smolt trap effort and trapping season ___________________________________________ 17
Wild Chinook Catches _______________________________________________________ 17
Hatchery & Wild Chinook- Migration Timing and Size ______________________________ 18 Outmigration Estimates for NOR and HOR smolts- ______________________________ 20 Genetic Results of Smolt Tissue Samples ______________________________________ 23
Discussion ___________________________________________________________________ 23
References ___________________________________________________________________ 26
3
Index of Tables & Figures Figure 1. Location of the Stillaguamish Smolt Trap. T. 32N R 6E, Sect. 2 .................................................................... 7 Figure 2. Photo of the Stillaguamish Smolt Trap. .......................................................................................................... 8 Figure 3. Map of the lower mainstem Stillaguamish, with locations of calibration releases. ...................................... 12 Figure 4. Estimates of trap efficiency as a percentage of release (recovered/released * 100) by trial, year, and
channel of release for Stillaguamish Chinook salmon. Error bars represent 95% confidence intervals surrounding the
estimate. ........................................................................................................................................................................ 13 Figure 5. Regression relating capture efficiency of the Stillaguamish Smolt Trap to secchi depth measurements taken
off the trap itself. Data depicted were collected in the 2002-2010 trapping seasons. .................................................. 14 Figure 6. Wild Chinook and Hatchery CPUE over the 2010 trapping season along with average daily discharge
(cfs). ............................................................................................................................................................................... 18 Figure 7. Weekly mean size (mm) of hatchery and wild fish. Error bars depict the 95% confidence interval
surrounding the mean; some are small and difficult to see. .......................................................................................... 19 Figure 8. Hatchery and wild cumulative catches of Chinook salmon on the smolt trap 2010. 50% migration dates
were 5/20/10 for wild and 5/21/10 for hatchery Chinook smolts. ................................................................................. 20 Table 1. Estimated average daily out migration of smolts from Stillaguamish for 2010 and total out migration for the
season. Pooled Standard Error: PSE = 100Estimate
Variance ............................................................................................ 20
Figure 9. Estimated daily migration for natural origin (NOR) and hatchery origin (HOR) Chinook smolts. Flow
(cfs) as measured at the USGS North Fork Gauge is added on a secondary axis. ........................................................ 21 Figure 10. Mean wild Chinook CPUE (boxes) along with 95% confidence intervals (bars) by fishing shift for the
Stillaguamish smolt trap in 2010. .................................................................................................................................. 22 Figure 11. Mean hatchery Chinook CPUE (boxes) along with 95% confidence intervals (bars) by fishing shift for the
Stillaguamish smolt trap in 2010. .................................................................................................................................. 22 Table 2. 2010 summary of genetics results. .................................................................................................................. 23 Figure 12. Egg-Migrant Survival by Brood Year for Stillaguamish Chinook. ............................................................. 24
4
Acknowledgments
Funding to build the Stillaguamish smolt trap was provided through a Salmon Recovery Funding
Board Early Action Grant. Funding to operate the trap during the 2010 season was provided
through a combination of Hatchery Reform and Pacific Coastal Salmon grants.
The Tribe also wishes to thank the landowners at our field site: Stanwood Redi-Mix and the Orr
family for allowing us to anchor the trap from their property. Mr. Ken Christoferson and all the
employees at Stanwood Redi-Mix were especially helpful in providing ecology blocks,
equipment, and access to the concrete plant 24 hours a day, seven days a week.
The 2010 trapping season was the result of much hard work by Stillaguamish Tribe Natural
Resources Staff including Kevin Graybill, Kate Konoski, Jody Pope, Robbie Hutton, Jen Sevigny,
Jody Brown, Rick Rogers, Kip Killebrew, and Kevin Gladsjo. Since the project’s inception,
helpful advice on study design, and modifications to trapping equipment were provided by
Marianna Alexsandersdottir of the Northwest Indian Fisheries Commission (NWIFC), Mike
MacKay of the Lummi Tribe, and Dave Seiler (retired) of WDFW.

5
Stillaguamish River Smolt Trapping Project - 2010
Introduction
Chinook returns to the Stillaguamish today are much reduced from the historic escapements of the
mid to late 19th
century. It is estimated that before European settlement of the watershed, the
Chinook population ranged from 9,700-13,321 returning adults as compared with an average of
1080 seen within recent years (includes hatchery fish, 1996-2003, SIRC 2005). In the last few
decades, the 12-year moving average for adult returns has been below the 900 wild fish upper
management threshold agreed to by Washington Department of Fish and Wildlife, the Tulalip
Tribes and the Stillaguamish Tribe (PSIT & WDFW 2010). During years when escapements are
predicted to fall below this threshold, directed fisheries are not allowed on Stillaguamish
Chinook.
Stillaguamish Chinook populations are part of the greater Puget Sound evolutionary significant
unit (ESU) and were listed as threatened by the National Marine Fisheries Service (NMFS) in
March 1999 under the Endangered Species Act (ESA). Researchers in the Stillaguamish basin
have focused on documenting the status of the Chinook stocks and have attempted to identify the
factors contributing to their low abundance. Current and past research/monitoring projects
include: redd mapping, adult carcass surveys, adult and juvenile snorkel surveys, estuary
mapping, and analysis of the effects of scour and fine sediment on survival to emergence.
A key project in these ongoing research/monitoring efforts has been the operation of a rotary
screw smolt trap in the lower mainstem Stillaguamish River by the Stillaguamish Tribe Natural
Resource Department. Two thousand and ten marked the completion of the tenth year of a long
term monitoring project directed at measuring trends in the year-to-year production of Chinook
smolts in the Stillaguamish. This is not the first time a smolt trap has operated on the
Stillaguamish; the Washington Department of Fisheries operated an inclined plane trap near
Haller Park in Arlington 1981-1983. However, no smolt data was collected between 1983 and the
start of this effort in 2001. Measuring and understanding the interannual variation in run size of
these various species is critical for managing harvest and prioritizing habitat restoration.
Quantifying the number of smolts leaving the watershed is one of the few methods available that
provides a direct measure of the year-to-year changes in freshwater survival and growth, free
from the confounding influences of marine conditions. Smolt production data from this project
can also be combined with adult escapement numbers to develop natural production potential
estimates for the watershed, stock/ recruit functions for each species of interest, and to better
understand the major density-independent sources of interannual variation in freshwater survival.
The smolt trapping program is also used to evaluate the effectiveness of the Stillaguamish Tribe’s
hatchery program in meeting its goals. The tribal hatchery has undertaken a wild stock
supplementation program since 1980, with the intent of rebuilding the North Fork Chinook
population. This broodstocking program captures Chinook from the spawning grounds, spawns
and rears the progeny, and releases the sub yearling smolts back into the upper North Fork
Stillaguamish. One of the goals of the Stillaguamish hatchery is to produce juvenile Chinook that

6
are indistinguishable from their wild spawned cousins in both timing and size at migration.
Before release, all hatchery produced Chinook smolts are Coded Wire Tagged (CWT), meaning
hatchery and wild spawned Chinook can be differentiated and compared in a variety of ways.
One of the concerns raised by NMFS after the Chinook salmon listing was the potential long-term
genetic impact of the Stillaguamish hatchery program on the wild Chinook populations in the
Stillaguamish. Staff at the NMFS questioned whether taking a small percentage of the Chinook
escapement and producing two hundred thousand hatchery smolts could affect the survival rates
of wild smolts through competition and genetic drift. The data collected by the Stillaguamish
Smolt Trapping Project generates yearly estimates of the hatchery contribution to the Chinook
smolt out-migration, along with monitoring timing and size at migration. Combining this
monitoring with adult escapement estimates (broken into hatchery and wild components),
differences in marine survival may become apparent, perhaps indicative of competition in the
river, estuary, or nearshore.
Previous genetic analysis has determined that the Stillaguamish watershed supports two
genetically distinct stocks: a summer and fall run. The fall population has hovered near 200 fish
in recent years (WDFW, Peter Verhey, unpublished data), and the Stillaguamish Tribe is in the
process of developing an integrated recovery hatchery program similar to the one focused on the
summer population as described earlier. As the fall stock spawns later, when survey conditions
are often difficult, the tribe is looking for a more reliable way of measuring the health of this
stock. Using microstatellite GAPS analysis (see Small et al. 2010), we are now able to
differentiate the smolts intercepted on the smolt trap each spring.
The primary purpose of the Stillaguamish smolt trapping project is to develop a yearly production
estimate for the Chinook salmon populations in the watershed and use this estimate to track egg-
migrant survival. Two thousand and ten marked the eighth year where the trap fished seven days
a week and, consequently, the eighth season that provided sufficient data to estimate the total
annual Chinook smolt production. While the primary purpose of the Stillaguamish smolt trapping
project won’t change, the newly added (2008) genetic analyses will allow the co-managers to
monitor the populations separately.
Study Site
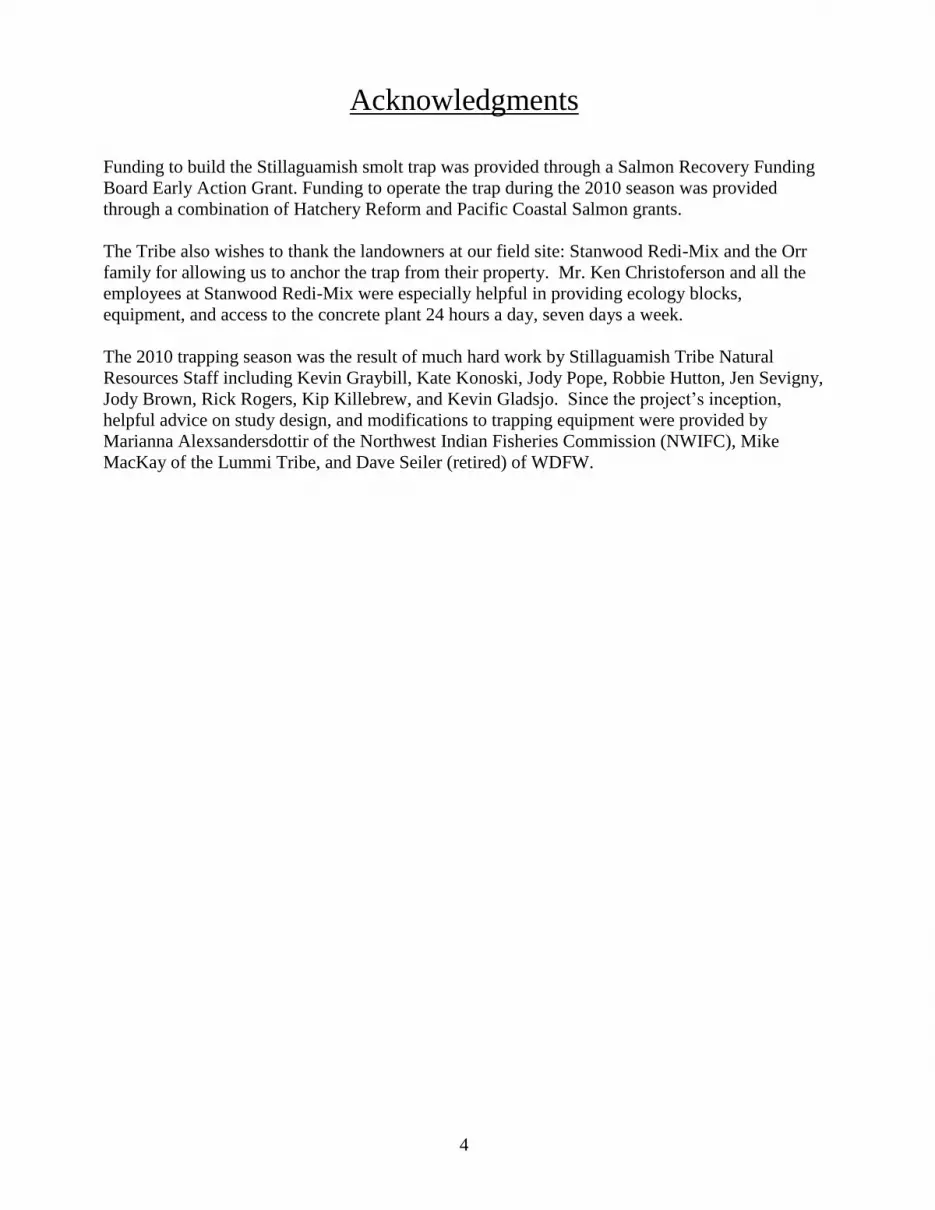
The Stillaguamish Smolt Trap is located in the lower Mainstem at approximately river mile 6, just
downstream I-5 where the South Slough rejoins the main channel (Figure 1). This is an ideal
location for a number of reasons: both sides of the river at the anchor locations are privately
owned and limit public access (i.e. vandalism), the river constricts and increases velocity (the
cone spins quickly enough at most flows), there is a wide sandbar on the left bank to facilitate
easy set up and tear down of the trap, and the location is low enough in the watershed to intercept
most of the salmon emigrating from the various tributaries. The channel at this location is
approximately 45 meters wide and 6.5 meters (maximum) deep under average flow conditions.
As this site is located at a large bend in the river, the thalweg (area of fastest current) flows tight
against the right bank. From work on other river systems (D. Seiler, WDFW retired, pers.
comm.) catch per unit effort (CPUE, fish/hour) is maximized when the trap in positioned directly
in the thalweg. As the area of fastest current varies with flow, we position the trap accordingly,
depending on river stage.
7
Figure 1. Location of the Stillaguamish Smolt Trap. T. 32N R 6E, Sect. 2
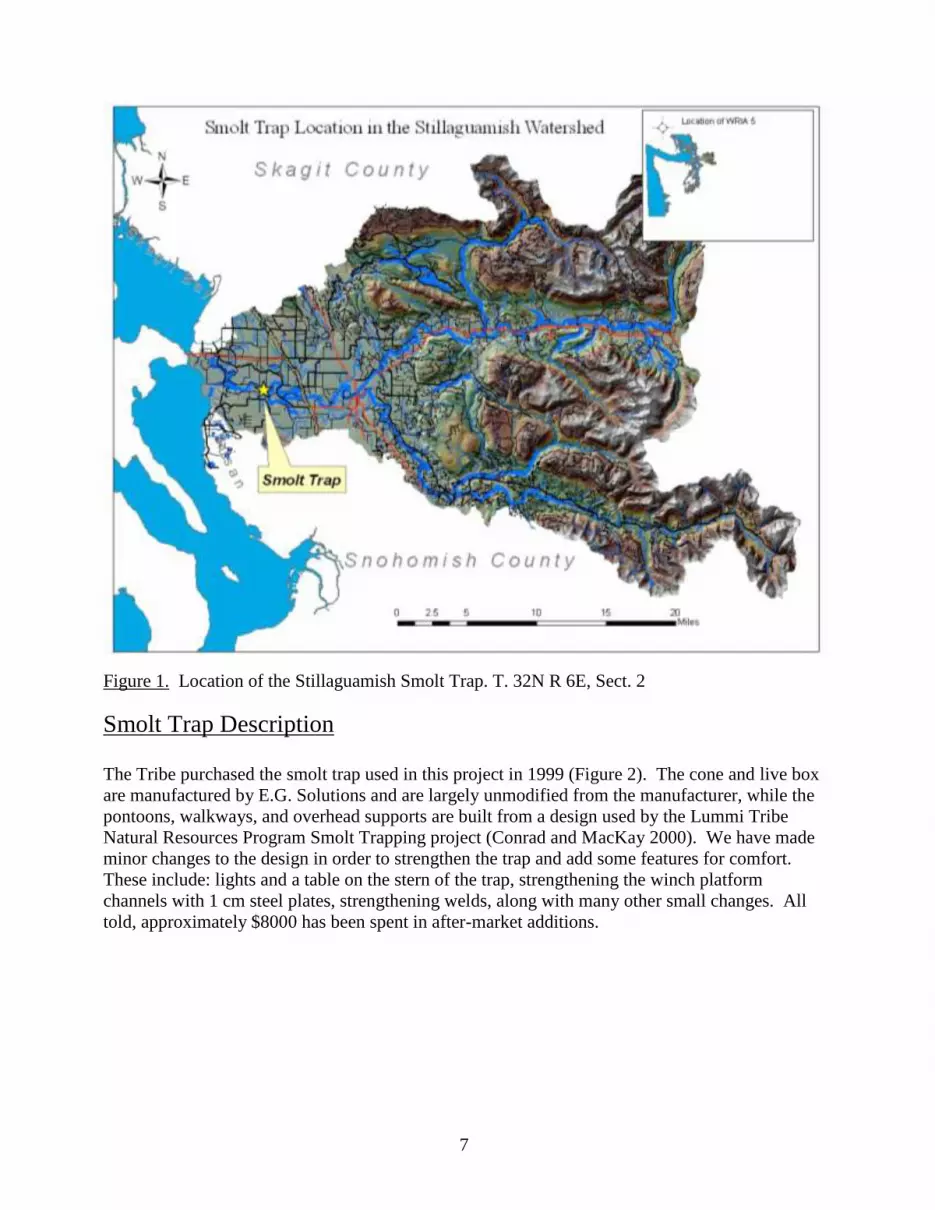
Smolt Trap Description
The Tribe purchased the smolt trap used in this project in 1999 (Figure 2). The cone and live box
are manufactured by E.G. Solutions and are largely unmodified from the manufacturer, while the
pontoons, walkways, and overhead supports are built from a design used by the Lummi Tribe
Natural Resources Program Smolt Trapping project (Conrad and MacKay 2000). We have made
minor changes to the design in order to strengthen the trap and add some features for comfort.
These include: lights and a table on the stern of the trap, strengthening the winch platform
channels with 1 cm steel plates, strengthening welds, along with many other small changes. All
told, approximately $8000 has been spent in after-market additions.

8
Figure 2. Photo of the Stillaguamish Smolt Trap.
At the sampling location, a 1.6 cm Spectra line (hereafter referred to as the highline) is strung
across the width of the channel (~130 m). On the right bank, it is anchored to a large western red
cedar approximately 4-5 meters off the ground, and is backed up to two large cottonwoods
located further from the river. On the left bank, the highline is attached to four concrete ecology
blocks. The trap is positioned in the river using hand winches (spooled with 1 cm Spectra Line)
located on either side of the trap. The Spectra line used on the winches and on the highline have
an advantage over steel cable in that while having a similar working load per diameter, it is
significantly lighter. This reduces the amount of sag in the span over the river and decreases the
likelihood of injuring unsuspecting boaters. A small shed/cabin is located on site to serve as a
crew base when the trap is fishing, and a skiff (3 m) is used for accessing the trap once it is
positioned in the thalweg.
The opening of the cone is 2.43 m (8 ft.) in diameter giving a sampling depth of 1.2 meters when
lowered into the water for fishing. The cone and live box are connected together by a steel frame
that allows the entire assembly to be winched easily into and out of the water. This steel frame is
suspended from overhead supports that span the two pontoons and is raised and lowered using
two hand winches mounted on the supports. The cone works like an Archimedes screw, with
vanes in the interior of the trap forcing the cone to spin in the current, funneling fish to the live
box located aft of the cone. The live box has a trash drum mounted on the stern on the box that
removes a portion of the small debris that enters the live box.

9
Methods
Sampling Design
The sampling design utilized in 2010 was the same one used since the 2003 season; the primary
objective is to fish seven days a week through the entire season (February to July). Each day the
trap was fished for a six-hour shift (0000-0600, 0600-1200, 1200-1800, 1800-2400), with the shift
rotating based on the day of the week. Thursday through Monday, the shifts were varied but the
same week to week (i.e., every Friday was 0000-0600, every Saturday 0600-1200, etc.), with
Tuesday and Wednesday’s shifts rotated to evenly distribute the effort over the four different time
slots (this is an artifact of attempting to fish 4 shifts twice during a seven-day week). Traps
operated on less turbid systems (Skagit, Snohomish) fish mostly at night, as catches of Chinook
during daylight hours are sparse. In the Stillaguamish however, Chinook CPUE does not differ
significantly between day and night periods (Figures 7 & 8). Outmigration appears mostly
influenced by flow and water clarity, variables randomized by nature (Griffith et al. 2001, 2005).
The start and end dates of trapping operations are based on the estimated timing of the Chinook
out-migration in the Stillaguamish watershed. During the last ten years, we have installed the trap
in the river in the beginning of February, began fishing mid-February, and ceased fishing in late
June/early July. From the number and timing of the Chinook catches, this seems to be an
adequate window of operation to intercept a large majority of the Chinook out-migration. In
2010, we started fishing on February 8th
and finished for the season on June 25th
. Since Chinook
emigrate over such a broad time frame, this trapping season is also sufficient to capture the entire
coho out-migration along with a significant portion of the chum and pink salmon smolt
emigration. There were rare deviations from this sampling schedule, mainly for efficiency trials
(more about these in following sections), and occasionally when the river was too high or full of
debris to fish safely.
Trap Operation
Each sampling shift is termed a “set” and is the sum of all the time the cone is in the water
fishing. Before the start of each set, the smolt trap is positioned in the thalweg of the river using
the hand winches mounted to each pontoon. The live box assembly is lowered into the river and
when the cone shaft touches the water, the “start time” is noted on our data sheets. Similarly, the
“stop time” is noted on the data sheet when the cone shaft leaves the surface of the water. The
cone and live box are raised from the water, and the frame is raised in such a way as to lift the
cone out of the water while still leaving a small amount of water in the live box. The live box is
completely raised from the water after the last of the fish are cleared from the box.
After deploying the trap and recording this starting data, typically the crew will leave the trap and
check in on it on a regular basis (usually every 1-2 hours) throughout the set. However, when
catches are large or debris abundant, the crew may have to stay on the trap for the duration of the

10
set and work continuously. Occasionally a log or stick will stop the cone from rotating and it will
have to be raised for cleaning. During these instances, the time lost from fishing is noted on the
data sheet.
Environmental Variables
At the start of every set, a visibility measurement is taken off the bow of the trap using a secchi
disc attached to a long steel pole. This involves lowering the 21cm black and white disc into the
water until it is no longer visible, and recording the depth. During the hours of darkness, the
measurement is taken with the aid of a powerful flashlight. In addition, a water sample is
collected to measure the turbidity of the waters passing through the trap. Further data collected at
the start of the set included: the rotational speed of the cone (how many seconds per rotation),
water color, water temperature, type and amount of river and live box debris, and weather
conditions (cloud cover, wind speed and direction, and any precipitation). At the end of the set,
another secchi measurement is taken along with weather observations and a turbidity sample.
Catch Processing
Fish are dip netted out of the live box, and transferred to a small anesthetizing tank set into the
table on the stern of the trap. Instead of the common anesthetizing agent, tricane
methanesulfonate (MS-222), we use clove oil to sedate the fish. Clove oil has several advantages
over MS-222 including much lower cost (1/40th
the cost per dose) and no toxicity for humans.
From research on coho and Chinook salmon, the optimal dosage is 25 mg/l, resulting in fast
knockout and recovery times and no mortalities (Taylor and Roberts 1999).
Once the fish are anesthetized, they are identified to species, individually counted, and a sub
sample measured. The first twenty of all salmonid species (other than Chinook) are measured
(for length, nearest mm), and the rest enumerated. Every Chinook is examined for adipose fin
clip and wanded to determine if it is of hatchery origin. The first twenty of hatchery Chinook are
measured and the rest enumerated. After the first 20 wild Chinook are measured, and DNA
sampled, every third Chinook is measured and a DNA sample collected. Non-salmonid species
are simply enumerated.
Processed fish are allowed to fully recover in a tank of clean river water for 5-10 minutes before
they are released back into the river to resume their seaward journey.
Estimation of Smolt Trap Capture Efficiency
Capture efficiency is defined at the instantaneous percentage of smolts passing the trap that are
captured by the gear. The capture efficiency of the smolt trap is the most important variable to
quantify because it is needed to expand the catches at the smolt trap and estimate Chinook
outmigration for the entire river on a given day. It is also important to be able to relate capture
efficiency to some environmental parameter in order to create a relationship that predicts
efficiency over the broad range of conditions experienced over the course of the trapping season.
Other trapping operations around the state have shown that capture efficiency can be affected by:
water velocity, time of day (daylight or nighttime), species and life stage, river stage, origin of
fish (hatchery or wild), trap placement within the channel, and water clarity (Conrad and MacKay
11
2000, Seiler et al. 2001). For a turbid river system (the Nooksack), the Lummi trapping operation
has found secchi depth to be the best predictor of trap efficiency (Conrad and MacKay 2000).
Capture efficiency experiments were performed by releasing a known number of marked,
hatchery reared Chinook smolts upstream of the trap and then enumerating the number of marked
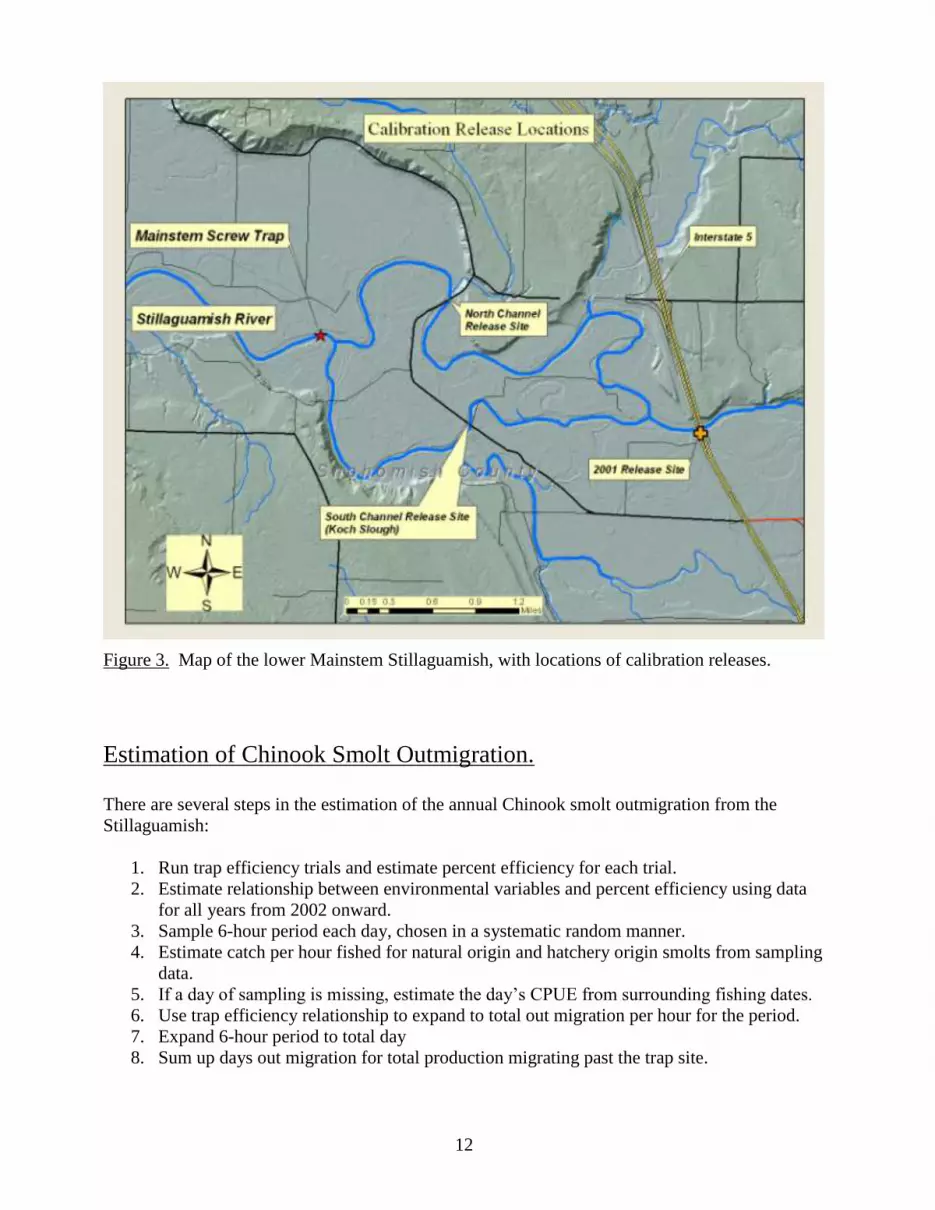
fish recaptured on the trap. In 2010, the two groups were released about 2.5 kilometers upstream
of the smolt trap, one group into each fork of the Stillaguamish below the I-5 bridge (Figure 3).
Both release groups were marked with Bismark Brown dye and ad-clipped, with one group
doubly clipped with an upper caudal fin clip (for one efficiency trial only). These are the same
release locations used since 2002; releases above where the river forks (2001) did not produce
efficiencies in line with what has been reported from others using similar gear in neighboring
rivers (Seiler et. al. 2002, Nelson et. al 2003). It is not known what percentage of juvenile
salmonids travel down each of the channels immediately above the smolt trap, however previous
calibration experiments (where the fish released into each fork were marked differently) did not
find significantly different recapture rates (Figure 4).
All fish used in our capture efficiency trials were from the Stillaguamish Tribal hatchery. Catches
of wild Chinook were not high enough to create an adequate sample size for paired releases (less
than 2500 wild Chinook were captured during the entire season). The hatchery fish used in the
efficiency trials were counted a few weeks prior to the first release and portioned into raceways
by their mark. Just before release, two groups of approximately (the exact numbers varied from
trial to trial) 2500-3000 fish were loaded into both tanks of a large hatchery truck. Bismark
brown dye was added to the tanks at the manufactures recommendation of one gram for every 57
liters of water and was kept oxygenated using bottled O2 and an air stone. From the time the fish
were loaded into the tanks to release was usually one hour. In our experience, this was a
sufficient amount of time for the stain to take effect and dye the Chinook an obvious gold color.
The fish were driven to the two bridges indicated in Figure 3 and given a quick release. A 10cm
hose was attached to the drain of the tank and all dyed fish were spread across the thalweg in the
span of about a minute. The fish reached terminal velocity quickly, splashed into the river and
swam away immediately, appearing unharmed. This release procedure was repeated soon after at
the other fork of the river so both groups were always released within one half hour of each other.
During the release process the smolt trap was either in operation, or in the process of being
deployed. The release site was far enough upstream so that fish never reached the trap until it had
been fishing for close to one hour. During the efficiency trials, secchi measurements were taken
every 2-3 hours and a water sample was taken for turbidity every 6 hours. The trap was fished
continuously for at least 24 hours after marked fish were released, and usually until three hours
elapsed without catching any marked fish.
12
Figure 3. Map of the lower Mainstem Stillaguamish, with locations of calibration releases.
Estimation of Chinook Smolt Outmigration.
There are several steps in the estimation of the annual Chinook smolt outmigration from the
Stillaguamish:
1. Run trap efficiency trials and estimate percent efficiency for each trial.
2. Estimate relationship between environmental variables and percent efficiency using data
for all years from 2002 onward.
3. Sample 6-hour period each day, chosen in a systematic random manner.
4. Estimate catch per hour fished for natural origin and hatchery origin smolts from sampling
data.
5. If a day of sampling is missing, estimate the day’s CPUE from surrounding fishing dates.
6. Use trap efficiency relationship to expand to total out migration per hour for the period.
7. Expand 6-hour period to total day
8. Sum up days out migration for total production migrating past the trap site.

13
The Efficiency Trials
Smolts are marked and released above the trap in two channels, the north and the south (the
channels rejoin a couple of hundred meters above the smolt trap). Trap efficiency is estimated as
the number recaptured in the trap over the number released above the trap. At the same time,
several environmental variables are measured and are available for analysis: secchi disk reading,
turbidity and flow.
Four releases were made in 2010, adding to the 33 trials run between 2002 and 2009. During
2010, estimates of efficiency ranged from 0.16%-2.16% (Figure 4). While there were individual
trials (in 2004, 2006, 2008) where recapture rates have been significantly different between the
forks, there has not been a consistent significant difference (α=0.05, p>0.05) in recapture rates or
timing between the forks when looking at an entire season or combining seasons (Figure 4).
Therefore, differential marks were not used in 2010 (with the exception of one trail), and the
efficiency data has been pooled for both forks in generating a regression relating capture
efficiency to an environmental variable. For further discussion of our methods of testing
differences in timing and rate of recovery for efficiency groups please see the 2004 Stillaguamish
River Smolt Trapping Project Report (Griffith et al. 2005).
Figure 4. Estimates of trap efficiency as a percentage of release (recovered/released * 100) by
trial, year, and channel of release for Stillaguamish Chinook salmon. Error bars represent 95%
confidence intervals surrounding the estimate.
0.0%
0.5%
1.0%
1.5%
2.0%
2.5%
3.0%
3.5%
4.0%
4.5%
No
rth
South
No
rth
South
No
rth
South
No
rth
South
No
rth
South
No
rth
South
No
rth
South
No
rth
South
No
rth
South
No
rth
South
No
rth
South
Com
bin
ed
Com
bin
ed
Com
bin
ed
Com
bin
ed
No
rth
South
Com
bin
ed
Com
bin
ed
Com
bin
ed
1 2 3 4 1 2 3 4 1 2 3 1 2 3 4 1 2 3 4
2006 2007 2008 2009 2010
Eff
icie
nc
y
Year and Trial
Stillaguamish Chinook Salmon Efficiency Trials

14
There are several choices for using the efficiency estimates for expanding catch per hour at the
trap to total out migration per hour past the trap for any single day. These would include,
estimating a mean efficiency over all trials, or estimating a relationship between the efficiencies
and environmental variables that can be measured on a daily basis. The average secchi disk
reading has been the best predictor of trapping efficiency for all of the years the Stillaguamish
Trap has operated (Figure 5); an exponential function provides an estimate of the relationship:
iSDR
i eE Equation 1
where Ei is the efficiency for period i and SDRi is the average secchi disk reading for period i.
Figure 5. Regression relating capture efficiency of the Stillaguamish Smolt Trap to secchi depth
measurements taken off the trap itself. Data depicted were collected in the 2002-2010 trapping
seasons.
There is quite a bit of variability surrounding the relationship in Figure 5, and the production
estimates derived using it, in some years, do not appear to be realistic. For example, if the
estimated hatchery production greatly exceeds the known number that were released upstream of
the trap, it is certain that the trap was more efficient at capturing smolts than the secchi-efficiency
relationship indicates (Figure 5). During these anomalous years, the number of hatchery fish
counted out of the release site is multiplied by the average survival to the smolt trapping location
(67% as averaged from 2003,04,06 hatchery production estimates, similar to the 1% mortality rate
per river mile observed on the Skagit- D. Seiler pers. comm.). This corrected production number
is divided into the raw hatchery production produced by equations 2-10 below. That factor is then
added into the constant detailed above (Equation 1) to “correct” the efficiency equation to
y = 0.073e-0.753x R² = 0.5962
0.0%
2.0%
4.0%
6.0%
8.0%
10.0%
12.0%
14.0%
- 2.00 4.00 6.00 8.00
Eff
icie
ncy
Secchi
Secchi Readings vs. Trap Efficiency 2002-2010
15
bring it in line with what could be considered a reasonable estimate, based on a given visibility
(secchi). In 2010, this technique was used, as the “raw” hatchery production estimate was more
than three times the number that was released upstream.
Estimation of out migrations of smolts.
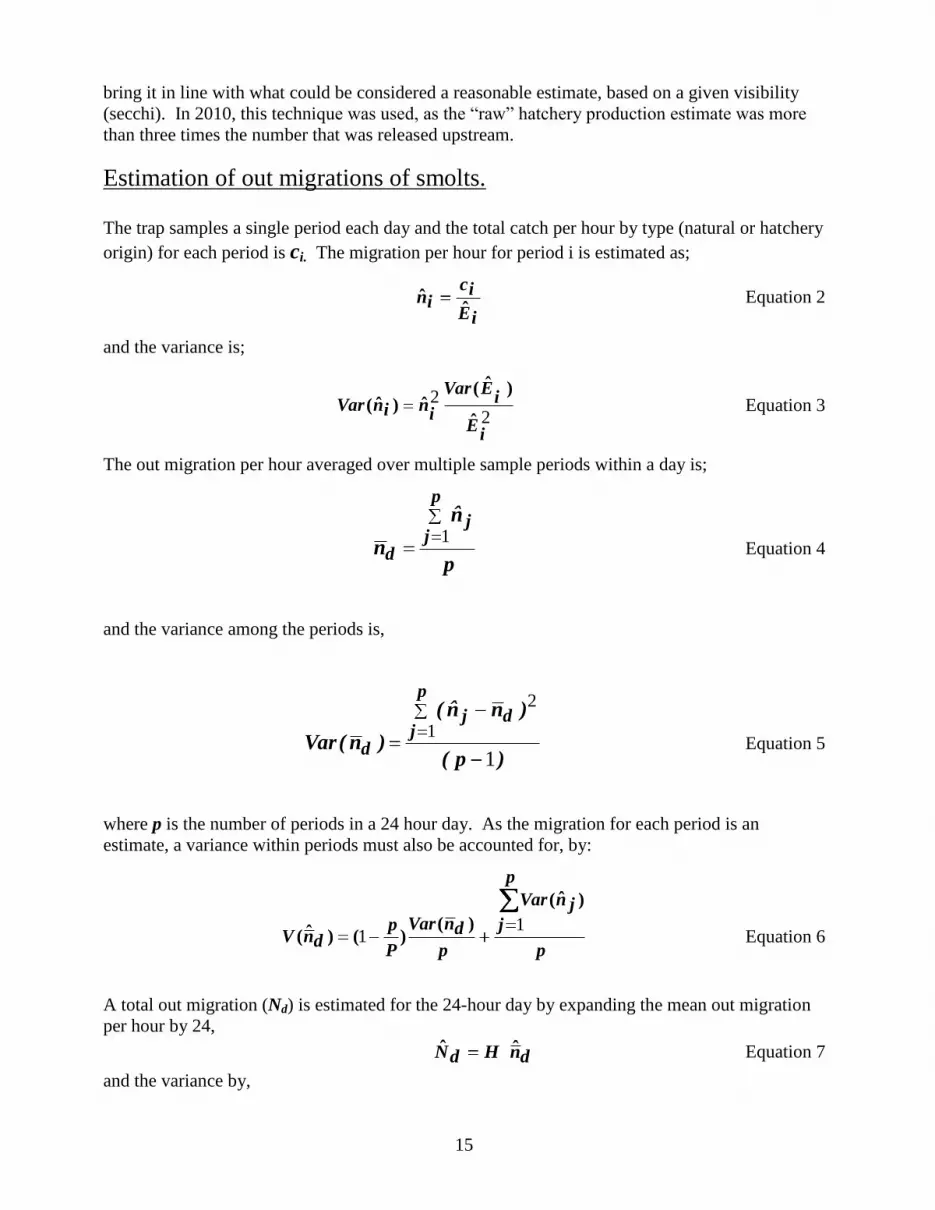
The trap samples a single period each day and the total catch per hour by type (natural or hatchery
origin) for each period is ci. The migration per hour for period i is estimated as;
iE
icin
ˆˆ Equation 2
and the variance is;
22
iE
iEVar
ininVar
ˆ
)ˆ(ˆ)ˆ( Equation 3
The out migration per hour averaged over multiple sample periods within a day is;
p
n̂
n
p
jj
d1
Equation 4
and the variance among the periods is,
)p(
)nn̂(
)n(Var
p
jdj
d1
1
2
Equation 5
where p is the number of periods in a 24 hour day. As the migration for each period is an
estimate, a variance within periods must also be accounted for, by:
p
p
j
jnVar
p
dnVar
P
pdnV
11
)ˆ(
)()()ˆ( Equation 6
A total out migration (Nd) is estimated for the 24-hour day by expanding the mean out migration
per hour by 24,
dnHdN ˆˆ Equation 7
and the variance by,
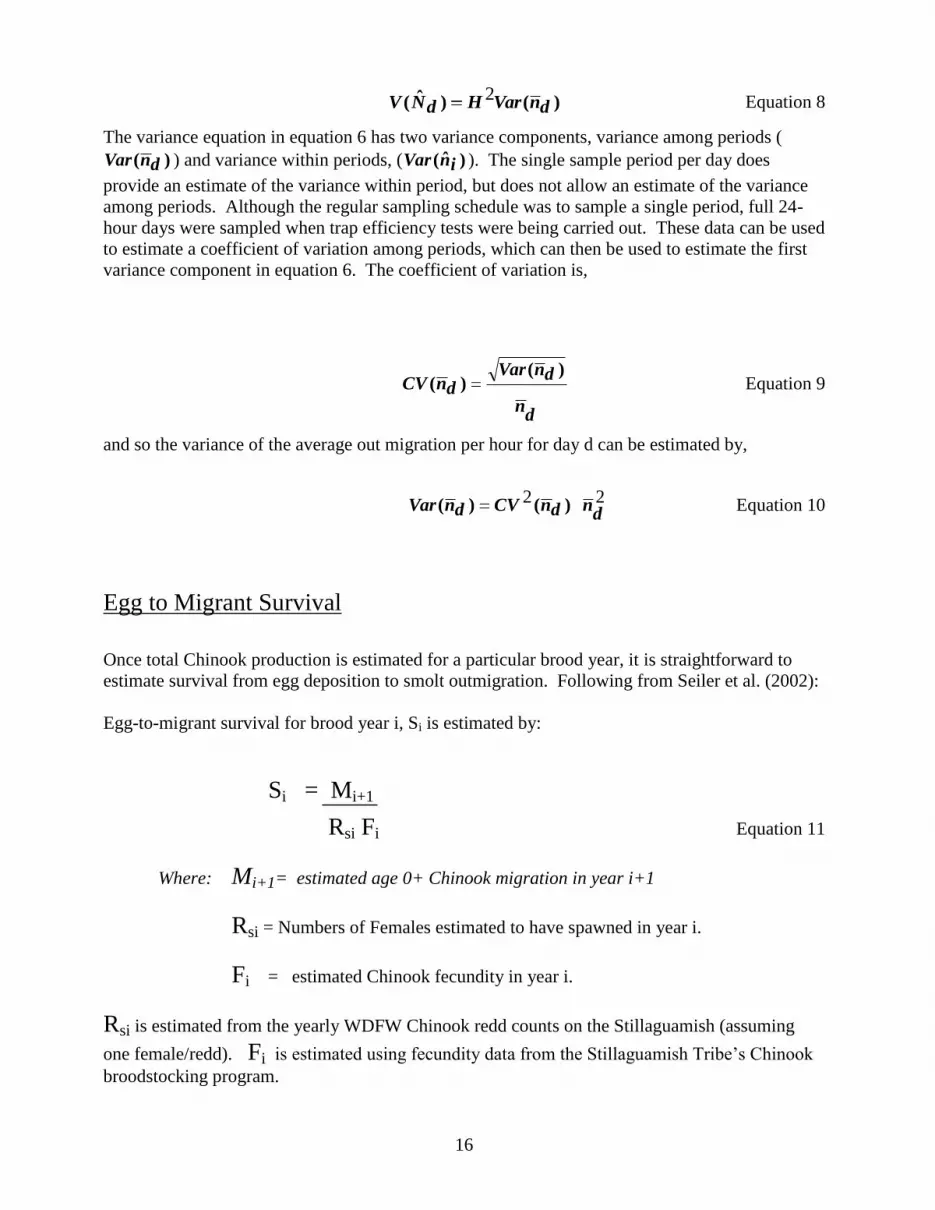
16
)()ˆ( dnVarHdNV2 Equation 8
The variance equation in equation 6 has two variance components, variance among periods (
)( dnVar ) and variance within periods, ( )ˆ( inVar ). The single sample period per day does
provide an estimate of the variance within period, but does not allow an estimate of the variance
among periods. Although the regular sampling schedule was to sample a single period, full 24-
hour days were sampled when trap efficiency tests were being carried out. These data can be used
to estimate a coefficient of variation among periods, which can then be used to estimate the first
variance component in equation 6. The coefficient of variation is,
dn
dnVardnCV
)()( Equation 9
and so the variance of the average out migration per hour for day d can be estimated by,
22d
ndnCVdnVar )()( Equation 10
Egg to Migrant Survival
Once total Chinook production is estimated for a particular brood year, it is straightforward to
estimate survival from egg deposition to smolt outmigration. Following from Seiler et al. (2002):
Egg-to-migrant survival for brood year i, Si is estimated by:
Si = Mi+1
Rsi Fi Equation 11
Where: Mi+1= estimated age 0+ Chinook migration in year i+1
Rsi = Numbers of Females estimated to have spawned in year i.
Fi = estimated Chinook fecundity in year i.
Rsi is estimated from the yearly WDFW Chinook redd counts on the Stillaguamish (assuming
one female/redd). Fi is estimated using fecundity data from the Stillaguamish Tribe’s Chinook
broodstocking program.
17
Genetic Analysis
Tissue samples collected from smolts were classified into either summer or fall Stillaguamish
populations by genotyping samples at the 13 GAPS microsatellite loci and one additional locus,
Ssa197 (Small et al. 2010). The genetic processing was performed by the WDFW’s genetics lab
in Olympia, while genetic data analysis was performed by Adrian Spidle of the NW Indian
Fisheries Commission, and Maureen Small at WDFW. For more details, a report summarizing
the genetics sampling and analysis is available (Small et al. 2010).
Results
Smolt trap effort and trapping season
In 2010, the Stillaguamish Smolt Trap fished on 138 days for a total of 863 hours. The trap was
fished on a systematic random sampling design, seven days a week, from February 8th
to June
25th
. Most sets were six hours, except during the four efficiency trials. During efficiency trials,
the trap was fished varying amounts depending on the number of recaptures of marked fish (shifts
ranged from 23-28 hours). Two thousand and ten was fairly benign year, flow wise, no days were
completely lost to high flows however, two shifts were cut short due to unsafe fishing conditions.
During flood events, the speed of the river and the volume of debris (logs, sticks, car tires, etc.)
make trap operation unsafe for both crew and fish. There were no days lost to mechanical or
staffing problems.
Wild Chinook Catches
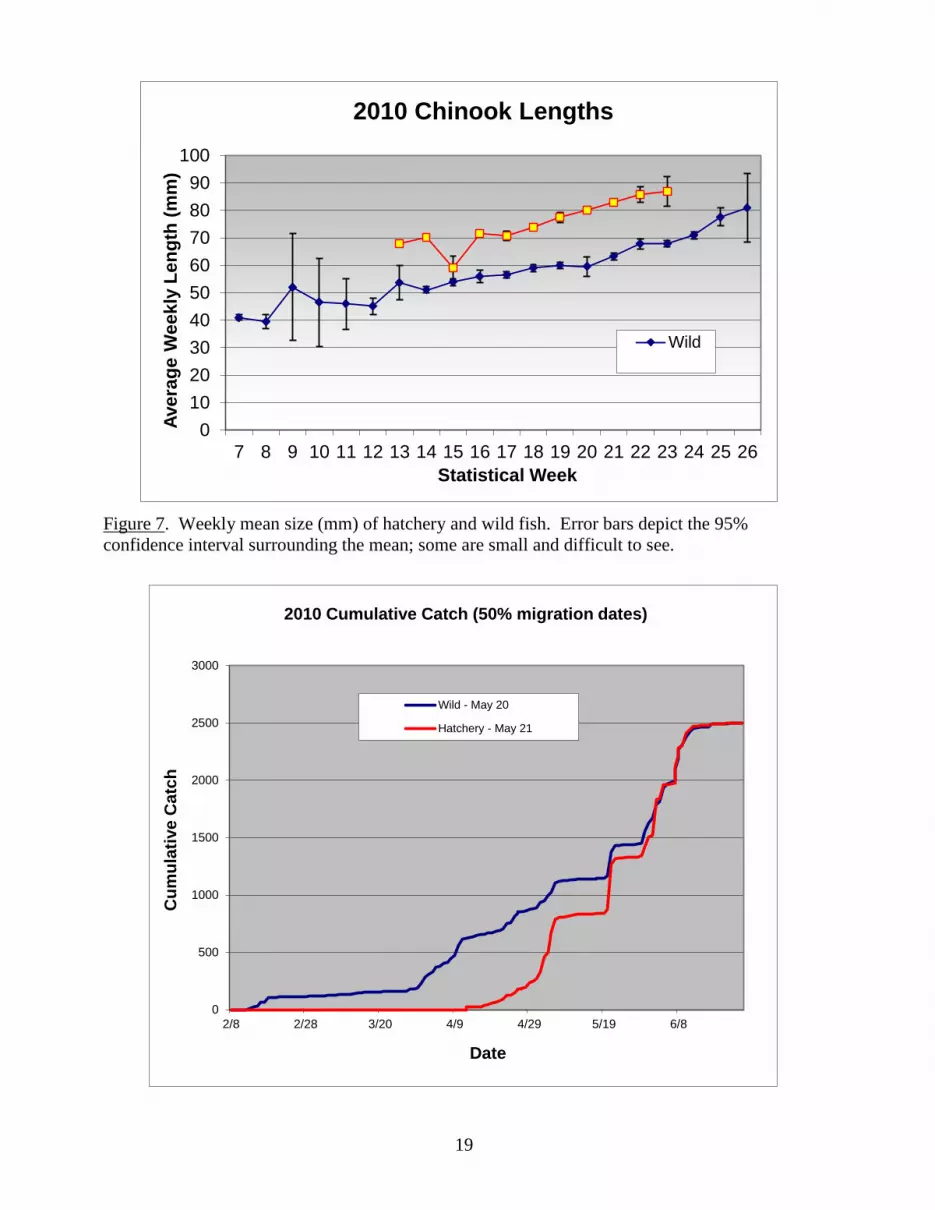
Over the entire season, 2,498 wild smolts were captured and released, including 41 mortalities
(1.6%). Most wild Chinook captured were in the 40-70 mm range, most likely 0+ smolts. A few
large (>90 mm, presumable 1+ smolts) Chinook are captured early in the year, 14 fish fitting this
life history profile were captured during the 2010 sampling season. Roughly 2,996 coho
(averaging >90 mm) were captured during the season, in addition to 800 larger (>150mm)
steelhead and cutthroat trout. Wild Chinook were captured a few days after the trap started
fishing (February 12th
), with a 50% migration date of May 20th
for wild Chinook (Figure 8).
Catch per unit effort (CPUE, hours) for wild Chinook exhibited a weak bi-modal distribution with
the peaks in April and May-early June. The mean daily discharge at the USGS North Fork gauge
has been added on a second axis (log scale), illustrating that most peaks in CPUE are related to
spikes in the hydrograph (Figure 6).

18
Figure 6. Wild Chinook and Hatchery CPUE over the 2010 trapping season along with average
daily discharge (cfs).
Hatchery & Wild Chinook- Migration Timing and Size
During the 2010 season, 2,500 hatchery Chinook were captured and released from the trap. All
hatchery Chinook are doubly marked with coded wire tags (CWTs) and adipose clips, allowing
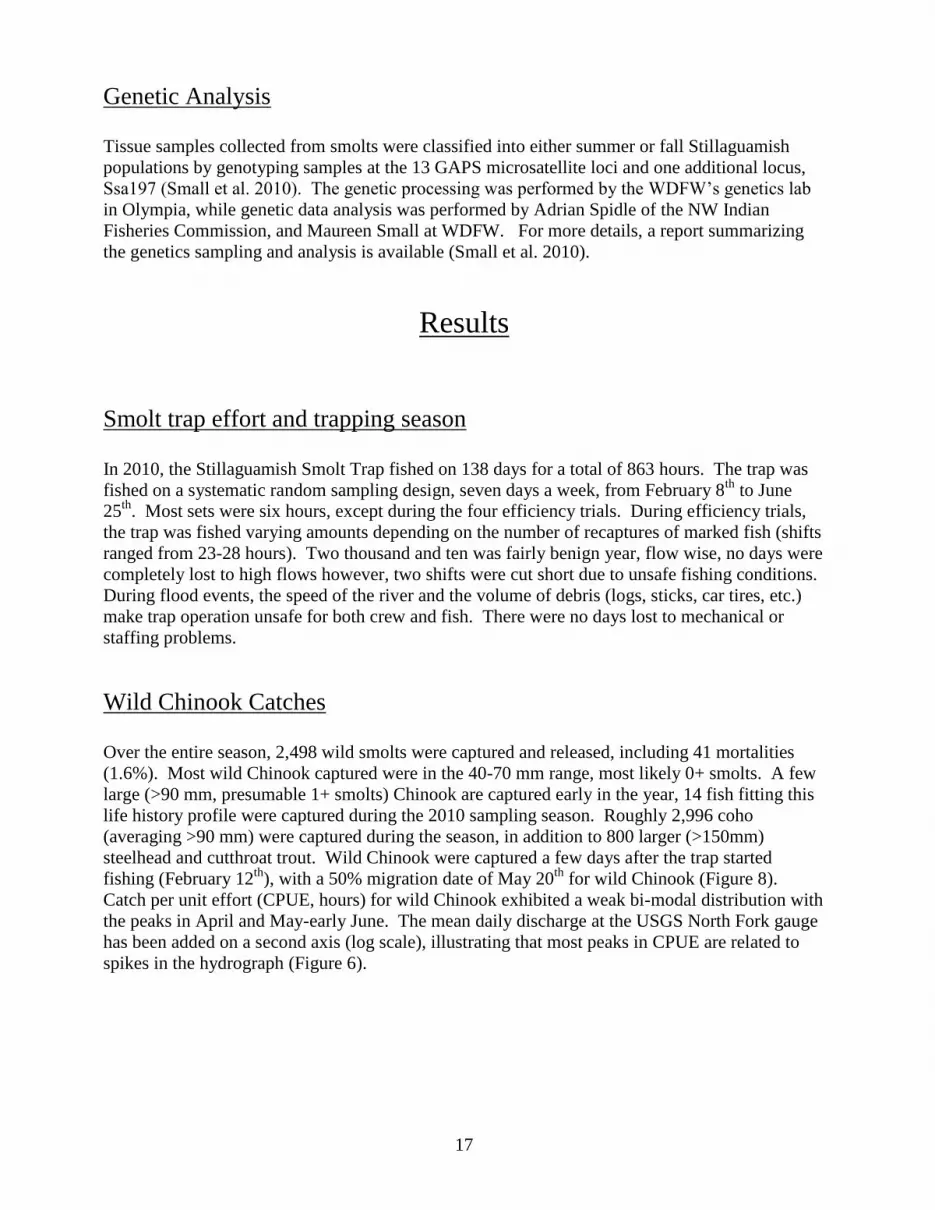
hatchery fish to be differentiated from wild spawned smolts. Hatchery fish were significantly
(p<.01) larger during all weeks sampled (usually ~15-20 mm) as compared with wild Chinook
(Figure 7). While exhibiting similar timing of migration in relation to rain events (Figure 6),
hatchery fish migrated predominately during the latter half of the wild outmigration.
19
Figure 7. Weekly mean size (mm) of hatchery and wild fish. Error bars depict the 95%
confidence interval surrounding the mean; some are small and difficult to see.
0
10
20
30
40
50
60
70
80
90
100
7 8 9 10 11 12 13 14 15 16 17 18 19 20 21 22 23 24 25 26
Ave
rag
e W
ee
kly
Le
ng
th (
mm
)
Statistical Week
2010 Chinook Lengths
Wild
0
500
1000
1500
2000
2500
3000
2/8 2/28 3/20 4/9 4/29 5/19 6/8
Cu
mu
lati
ve
Ca
tch
Date
2010 Cumulative Catch (50% migration dates)
Wild - May 20
Hatchery - May 21
20
Figure 8. Hatchery and wild cumulative catches of Chinook salmon on the smolt trap 2010. 50%
migration dates were 5/20/10 for wild and 5/21/10 for hatchery Chinook smolts.
Outmigration Estimates for NOR and HOR smolts-
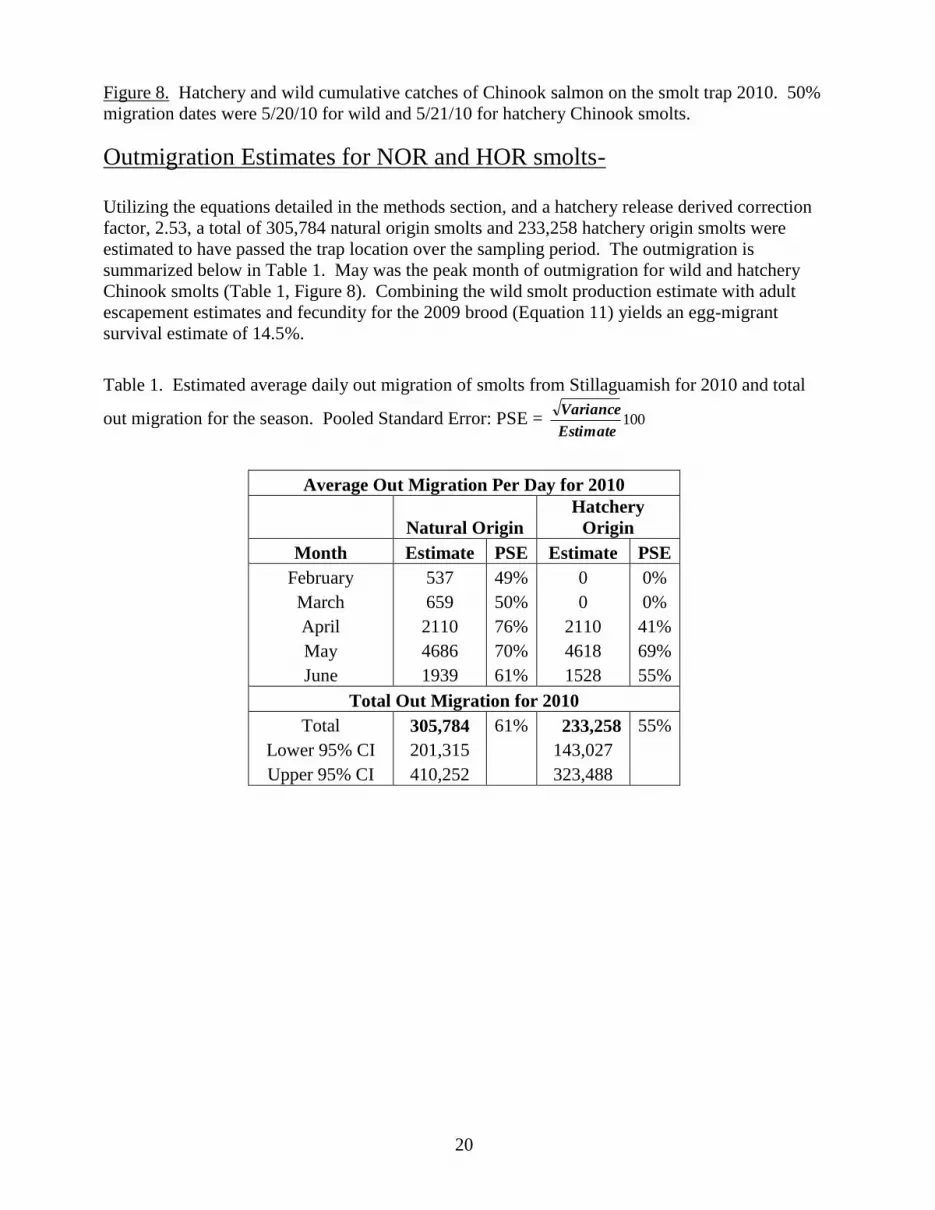
Utilizing the equations detailed in the methods section, and a hatchery release derived correction
factor, 2.53, a total of 305,784 natural origin smolts and 233,258 hatchery origin smolts were
estimated to have passed the trap location over the sampling period. The outmigration is
summarized below in Table 1. May was the peak month of outmigration for wild and hatchery
Chinook smolts (Table 1, Figure 8). Combining the wild smolt production estimate with adult
escapement estimates and fecundity for the 2009 brood (Equation 11) yields an egg-migrant
survival estimate of 14.5%.
Table 1. Estimated average daily out migration of smolts from Stillaguamish for 2010 and total
out migration for the season. Pooled Standard Error: PSE = 100Estimate
Variance
Average Out Migration Per Day for 2010
Natural Origin
Hatchery
Origin
Month Estimate PSE Estimate PSE
February 537 49% 0 0%
March 659 50% 0 0%
April 2110 76% 2110 41%
May 4686 70% 4618 69%
June 1939 61% 1528 55%
Total Out Migration for 2010
Total 305,784 61% 233,258 55%
Lower 95% CI 201,315 143,027
Upper 95% CI 410,252 323,488
21
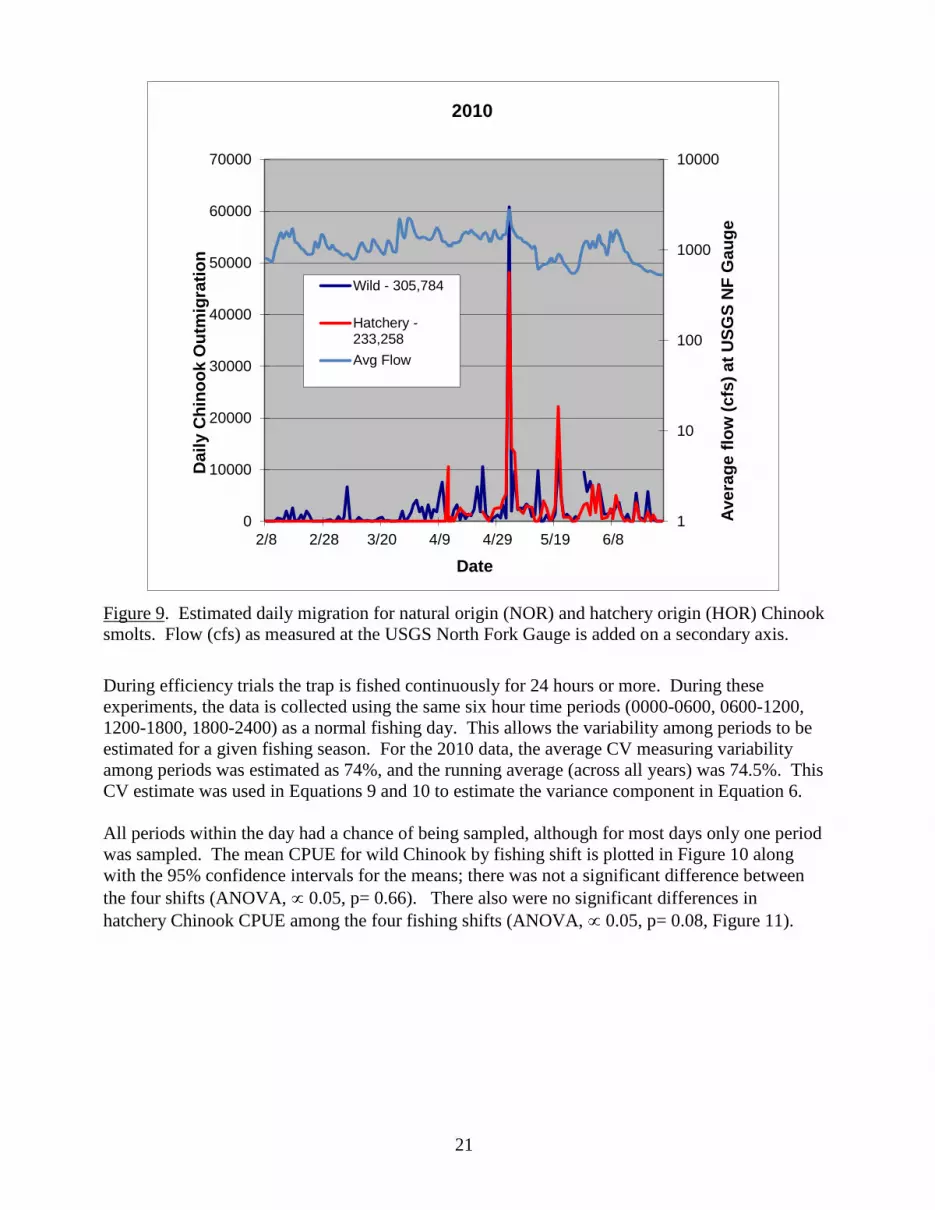
Figure 9. Estimated daily migration for natural origin (NOR) and hatchery origin (HOR) Chinook
smolts. Flow (cfs) as measured at the USGS North Fork Gauge is added on a secondary axis.
During efficiency trials the trap is fished continuously for 24 hours or more. During these
experiments, the data is collected using the same six hour time periods (0000-0600, 0600-1200,
1200-1800, 1800-2400) as a normal fishing day. This allows the variability among periods to be
estimated for a given fishing season. For the 2010 data, the average CV measuring variability
among periods was estimated as 74%, and the running average (across all years) was 74.5%. This
CV estimate was used in Equations 9 and 10 to estimate the variance component in Equation 6.
All periods within the day had a chance of being sampled, although for most days only one period
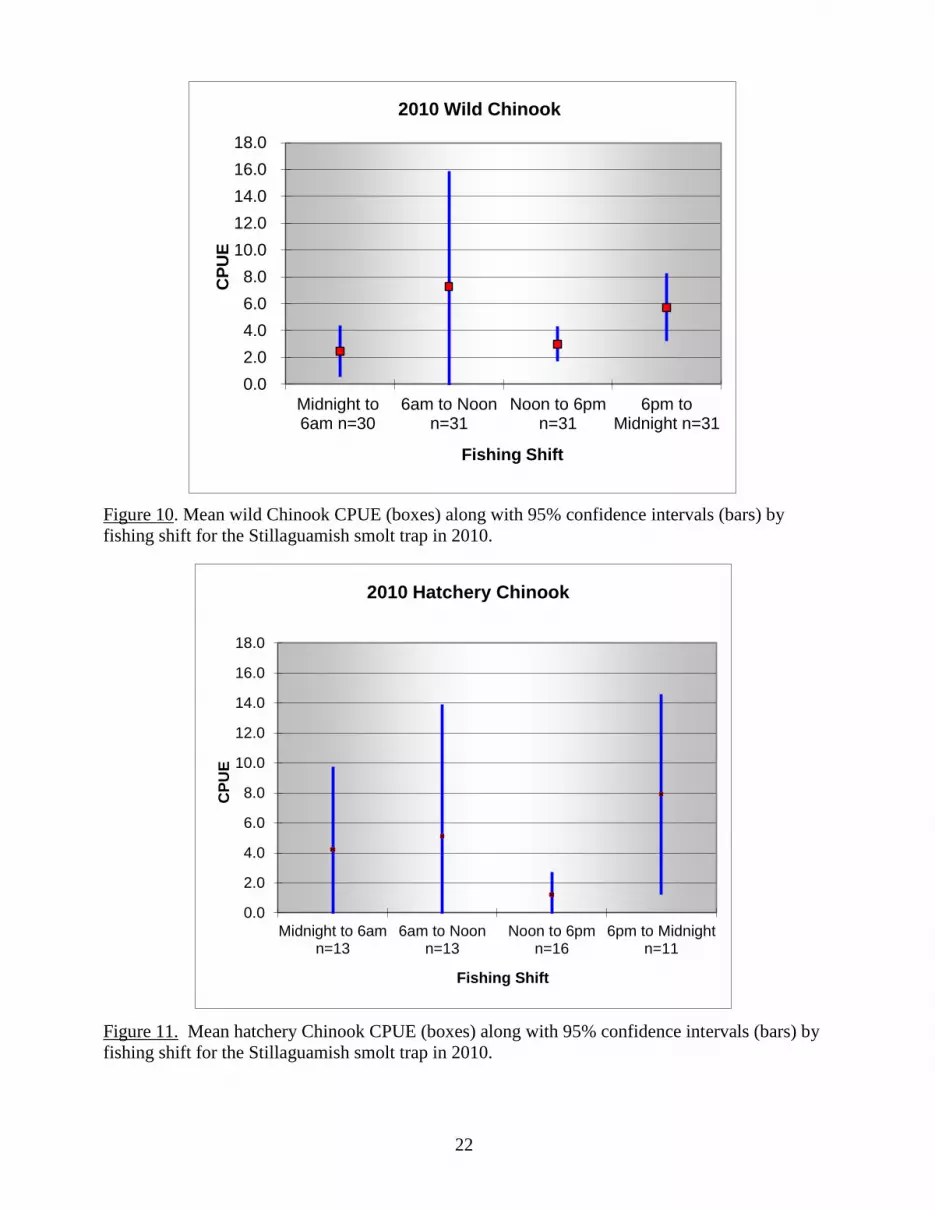
was sampled. The mean CPUE for wild Chinook by fishing shift is plotted in Figure 10 along
with the 95% confidence intervals for the means; there was not a significant difference between
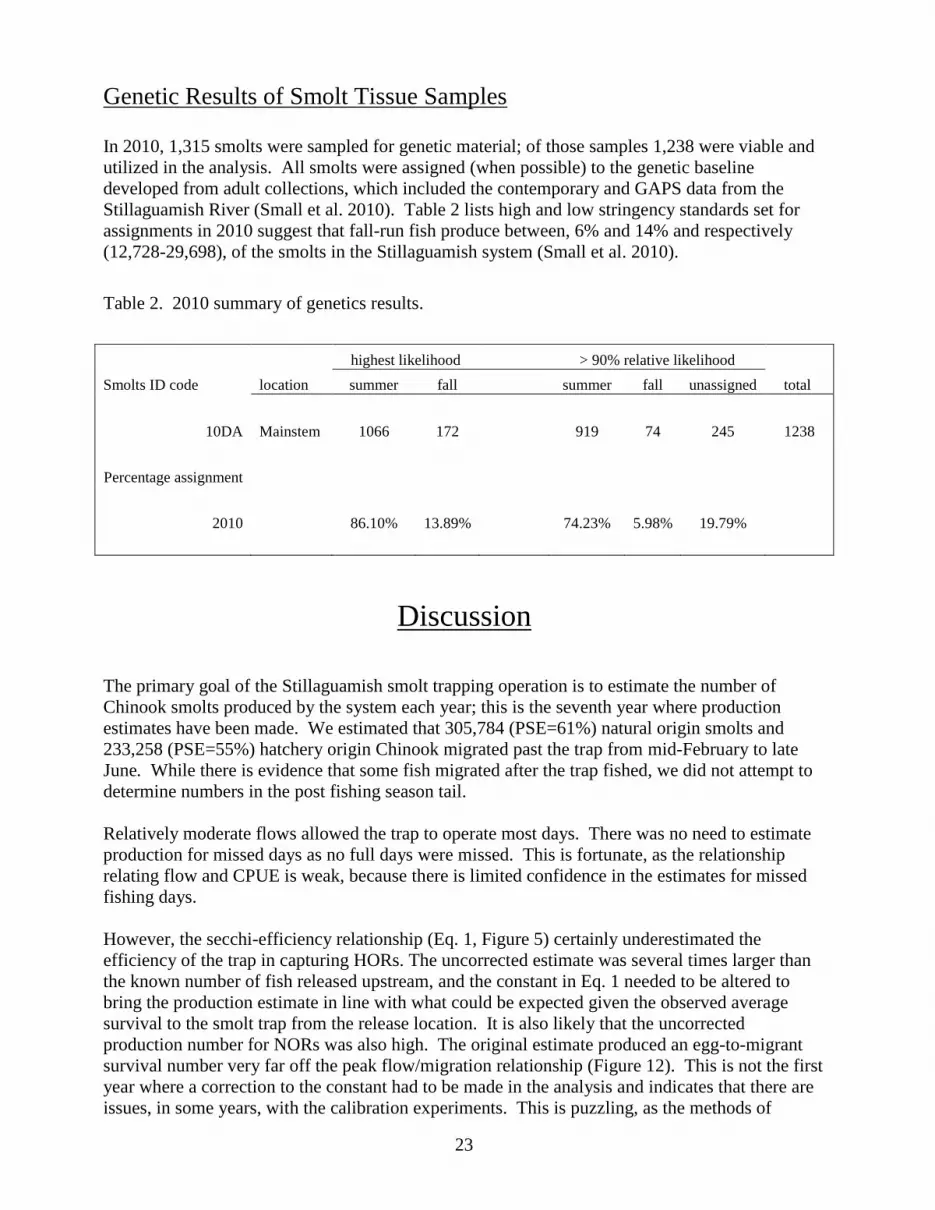
the four shifts (ANOVA, 0.05, p= 0.66). There also were no significant differences in
hatchery Chinook CPUE among the four fishing shifts (ANOVA, 0.05, p= 0.08, Figure 11).
1
10
100
1000
10000
0
10000
20000
30000
40000
50000
60000
70000
2/8 2/28 3/20 4/9 4/29 5/19 6/8
Ave
rag
e f
low
(c
fs)
at
US
GS
NF
Ga
ug
e
Dail
y C
hin
oo
k O
utm
igra
tio
n
Date
2010
Wild - 305,784
Hatchery -233,258
Avg Flow
22
Figure 10. Mean wild Chinook CPUE (boxes) along with 95% confidence intervals (bars) by
fishing shift for the Stillaguamish smolt trap in 2010.
Figure 11. Mean hatchery Chinook CPUE (boxes) along with 95% confidence intervals (bars) by
fishing shift for the Stillaguamish smolt trap in 2010.
0.0
2.0
4.0
6.0
8.0
10.0
12.0
14.0
16.0
18.0
Midnight to6am n=30
6am to Noonn=31
Noon to 6pmn=31
6pm toMidnight n=31
CP
UE
Fishing Shift
2010 Wild Chinook
0.0
2.0
4.0
6.0
8.0
10.0
12.0
14.0
16.0
18.0
Midnight to 6amn=13
6am to Noonn=13
Noon to 6pmn=16
6pm to Midnightn=11
CP
UE
Fishing Shift
2010 Hatchery Chinook
23
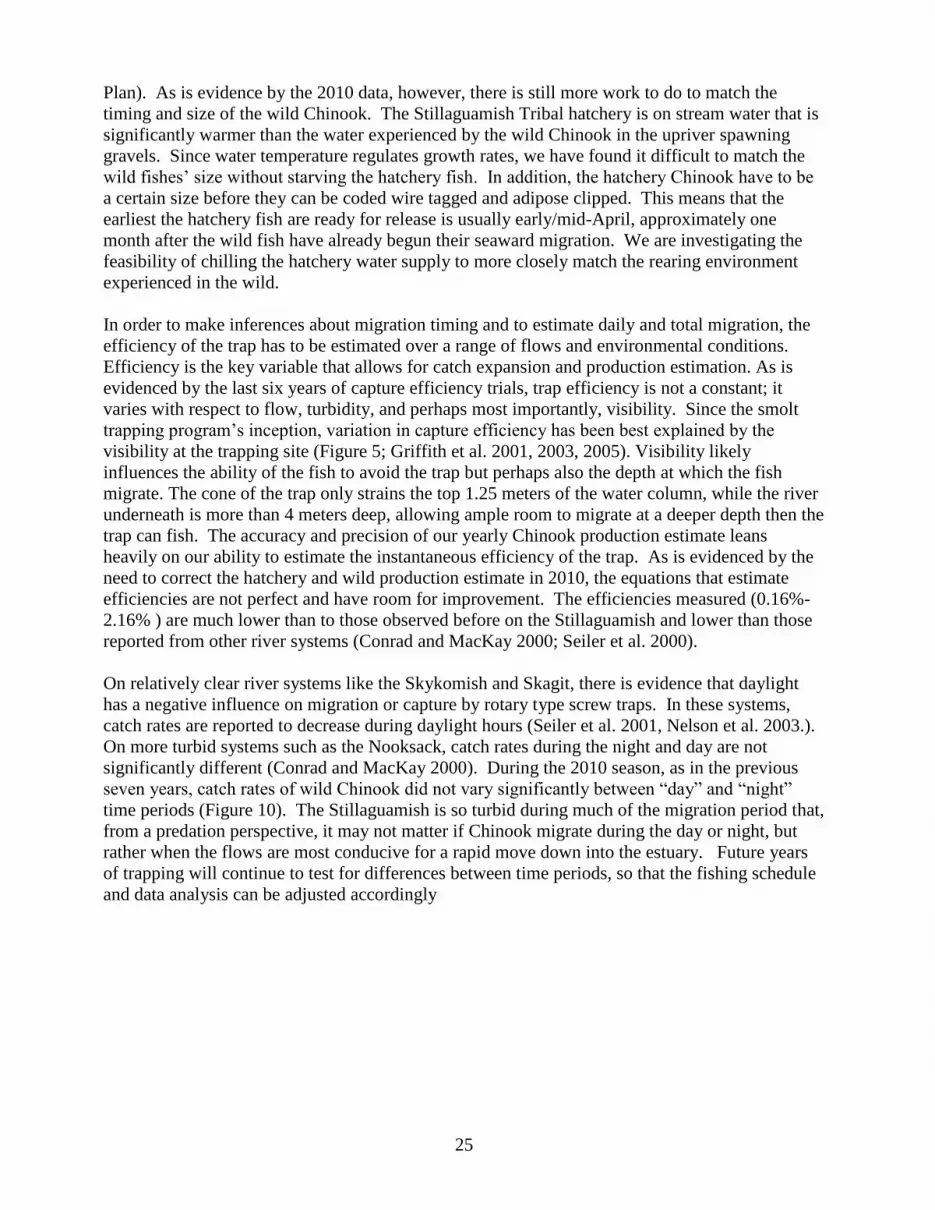
Genetic Results of Smolt Tissue Samples
In 2010, 1,315 smolts were sampled for genetic material; of those samples 1,238 were viable and
utilized in the analysis. All smolts were assigned (when possible) to the genetic baseline
developed from adult collections, which included the contemporary and GAPS data from the
Stillaguamish River (Small et al. 2010). Table 2 lists high and low stringency standards set for
assignments in 2010 suggest that fall-run fish produce between, 6% and 14% and respectively
(12,728-29,698), of the smolts in the Stillaguamish system (Small et al. 2010).
Table 2. 2010 summary of genetics results.
highest likelihood > 90% relative likelihood
Smolts ID code location summer fall
summer fall unassigned total
10DA Mainstem 1066 172
919 74 245 1238
Percentage assignment
2010
86.10% 13.89%
74.23% 5.98% 19.79%
Discussion
The primary goal of the Stillaguamish smolt trapping operation is to estimate the number of
Chinook smolts produced by the system each year; this is the seventh year where production
estimates have been made. We estimated that 305,784 (PSE=61%) natural origin smolts and
233,258 (PSE=55%) hatchery origin Chinook migrated past the trap from mid-February to late
June. While there is evidence that some fish migrated after the trap fished, we did not attempt to
determine numbers in the post fishing season tail.
Relatively moderate flows allowed the trap to operate most days. There was no need to estimate
production for missed days as no full days were missed. This is fortunate, as the relationship
relating flow and CPUE is weak, because there is limited confidence in the estimates for missed
fishing days.
However, the secchi-efficiency relationship (Eq. 1, Figure 5) certainly underestimated the
efficiency of the trap in capturing HORs. The uncorrected estimate was several times larger than
the known number of fish released upstream, and the constant in Eq. 1 needed to be altered to
bring the production estimate in line with what could be expected given the observed average
survival to the smolt trap from the release location. It is also likely that the uncorrected
production number for NORs was also high. The original estimate produced an egg-to-migrant
survival number very far off the peak flow/migration relationship (Figure 12). This is not the first
year where a correction to the constant had to be made in the analysis and indicates that there are
issues, in some years, with the calibration experiments. This is puzzling, as the methods of

24
transport, dye, and release do not change from year to year. We will continue to monitor our
methods and adjust in coming years to better measure the true efficiency of the smolt trap.
Combining the 2010 wild smolt production estimate with 2009 adult escapement estimates yields
an estimate of the egg-migrant survival rate of 14.5%. This estimate is one of the higher survival
rates produced and is a reflection of the incubation conditions observed in the watershed. Peak
flows typically result in gravel scour and sediment deposition, processes that (depending on the
severity of event-Figure 12) can kill a large number of the eggs deposited, either by suffocation or
displacement from the gravel (Healy 1991). The fall-winter of 2009-2010 was relatively benign,
no major flood events occurred, the highest being 25,000cfs in late November. Refining the
relationship between egg-migrant survival and environmental variables continues to be an
important component in understanding the limiting factors affecting Chinook populations. A
clear understanding of the limiting factors is important for prioritizing limited restoration funds,
and implementing the Stillaguamish chapter of the Puget Sound Chinook Recovery Plan (SIRC
2005).
Figure 12. Egg-Migrant Survival by Brood Year for Stillaguamish Chinook.
One of the advantages of this project is that the catches can be used to compare migration timing
and size at migration between hatchery and wild spawned Chinook. In all the years of trapping
thus far (including 2010), wild origin Chinook were smaller and migrated earlier than hatchery
origin Chinook smolts (Figures 7 & 8). Because the Stillaguamish hatchery program is an
integrated recovery type operation (designed to help recover the endangered Chinook populations
on the Stillaguamish), it is important that hatchery releases as closely as possible mimic their wild
counterparts in size and timing of migration. The goal is to produce hatchery fish that are subject
to the same selective pressures as their wild cousins, thereby minimizing genetic differences over
generations. In response to data collected on the smolt trap over the past several years, hatchery
feeding rates/release timing has been adjusted to better produce smolts that more closely resemble
their wild spawned cousins (one of the goals of the Stillaguamish Hatchery Genetic Management
y = -0.0006x + 23.448 R² = 0.8368
0
5
10
15
20
25
0 5,000 10,000 15,000 20,000 25,000 30,000 35,000 40,000 45,000
Egg t
o M
igra
nt
Su
rviv
al (%
)
Highest Mean Daily Flow (cfs) on the NF Stillaguamish during incubation (Oct 1-Jan 31).
Egg-to-Migrant Survival by Brood Year
2000
2001
2003
2004
2005
2006
2007
2008
2009 2002
25
Plan). As is evidence by the 2010 data, however, there is still more work to do to match the
timing and size of the wild Chinook. The Stillaguamish Tribal hatchery is on stream water that is
significantly warmer than the water experienced by the wild Chinook in the upriver spawning
gravels. Since water temperature regulates growth rates, we have found it difficult to match the
wild fishes’ size without starving the hatchery fish. In addition, the hatchery Chinook have to be
a certain size before they can be coded wire tagged and adipose clipped. This means that the
earliest the hatchery fish are ready for release is usually early/mid-April, approximately one
month after the wild fish have already begun their seaward migration. We are investigating the
feasibility of chilling the hatchery water supply to more closely match the rearing environment
experienced in the wild.
In order to make inferences about migration timing and to estimate daily and total migration, the
efficiency of the trap has to be estimated over a range of flows and environmental conditions.
Efficiency is the key variable that allows for catch expansion and production estimation. As is
evidenced by the last six years of capture efficiency trials, trap efficiency is not a constant; it
varies with respect to flow, turbidity, and perhaps most importantly, visibility. Since the smolt
trapping program’s inception, variation in capture efficiency has been best explained by the
visibility at the trapping site (Figure 5; Griffith et al. 2001, 2003, 2005). Visibility likely
influences the ability of the fish to avoid the trap but perhaps also the depth at which the fish
migrate. The cone of the trap only strains the top 1.25 meters of the water column, while the river
underneath is more than 4 meters deep, allowing ample room to migrate at a deeper depth then the
trap can fish. The accuracy and precision of our yearly Chinook production estimate leans
heavily on our ability to estimate the instantaneous efficiency of the trap. As is evidenced by the
need to correct the hatchery and wild production estimate in 2010, the equations that estimate
efficiencies are not perfect and have room for improvement. The efficiencies measured (0.16%-
2.16% ) are much lower than to those observed before on the Stillaguamish and lower than those
reported from other river systems (Conrad and MacKay 2000; Seiler et al. 2000).
On relatively clear river systems like the Skykomish and Skagit, there is evidence that daylight
has a negative influence on migration or capture by rotary type screw traps. In these systems,
catch rates are reported to decrease during daylight hours (Seiler et al. 2001, Nelson et al. 2003.).
On more turbid systems such as the Nooksack, catch rates during the night and day are not
significantly different (Conrad and MacKay 2000). During the 2010 season, as in the previous
seven years, catch rates of wild Chinook did not vary significantly between “day” and “night”
time periods (Figure 10). The Stillaguamish is so turbid during much of the migration period that,
from a predation perspective, it may not matter if Chinook migrate during the day or night, but
rather when the flows are most conducive for a rapid move down into the estuary. Future years
of trapping will continue to test for differences between time periods, so that the fishing schedule
and data analysis can be adjusted accordingly

26
References
Conrad, R. H., and M.T. MacKay. 2000. Use of a Rotary Screwtrap to Monitor the Out-
migration of Chinook Salmon Smolts from the Nooksack River 1994-1998. Northwest
Fishery Resource Bulletin. Project Report Series No. 10. May 2000.
Griffith, J., R. Rogers, J. Drotts, and P. Stevenson. December 2001. Annual Report 2001,
Stillaguamish River Smolt Trapping Project. Stillaguamish Tribe of Indians. Arlington,
WA.
Griffith, J., R. Rogers, J. Drotts, and P. Stevenson. March 2003. Annual Report 2002,
Stillaguamish River Smolt Trapping Project. Stillaguamish Tribe of Indians. Arlington,
WA.
Griffith, J., M. Alexsanderdottir, R. VanArman, and J. Drotts. June 2005. Annual Report 2004,
Stillaguamish River Smolt Trapping Project. Stillaguamish Tribe of Indians. Arlington,
WA.
Healy, M.C. 1991. Life history of Chinook salmon, (Oncorhynchus tshawytscha). Pages 313-393
in C. Groot and L. Margolis, (eds). Pacific Salmon Life Histories. UBC Press, University
of British Columbia, Vancouver, Canada.
Nelson, K., B. Kelder, and K. Rawson. 2003. 2001 Skykomish River Chinook and Coho Out-
migration Study. Tulalip Tribes, Tulalip Natural Resources Division. Tulalip, WA.
Puget Sound Indian Tribes and Washington Department of Fish and Wildlife. April 12, 2010.
Comprehensive Management Plan for Puget Sound Chinook: Harvest Management
Component. http://wdfw.wa.gov/publications/pub.php?id=00854
Seiler, D., S. Neuhauser, and L. Kishimoto. 2002. 2001 Skagit River Wild 0+ Chinook
Production Evaluation Annual Report. Washington State Department of Fish and
Wildlife. May 2002.
Seiler, D., S. Neuhauser, and L. Kishimoto. 2001. Annual Project Report. 2000 Skagit River
Wild 0+ Chinook Production Evaluation. Washington State Department of Fish and
Wildlife. April 2001.
Seiler, D., S. Neuhauser, and L. Kishimoto. 2000. Annual Report. 1999 Skagit River
Wild 0+ Chinook Production Evaluation. Washington State Department of Fish and
Wildlife. April 2000.
Small, M. P., A. Spidle, C. Scofield, J. Griffith, E. Martinez, and J. Von Bargen. 2010. Summary
report of genetic analyses of summer and fall run Chinook salmon in the North and South
Fork Stillaguamish River. December 2010.
27
Stillaguamish Implementation Review Committee (SIRC). 2005. Stillaguamish Watershed
Chinook Recovery Plan. Published by Snohomish County Department of Public Works,
Surface Water Management Division. Everett, WA.
Stillaguamish Tribe 2009. Stillaguamish Estuary Use by Juvenile Chinook
Final Report. FY 2005 Pacific Coastal Salmon Recovery Funding. Stillaguamish Tribe of
Indians. Arlington, WA. www.stillaguamish.nsn.us
Taylor, P.W., and S.D. Roberts. 1999. Clove Oil: An Alternative Anesthetic for Aquaculture.
North American Journal of Aquaculture. 61: 150-155.