Embed Size (px)
Citation preview
'H MR Spectroscopy in Patients with Metastatic Brain Tumors: A Multicenter Study Paul E. Sijens, Michael V. Knopp, Arturo Brunetti, Karsten Wicklow, Bruno Alfano, Peter Bachert, John A. Sanders, Arthur E. Stillman, Hans Kett, Rolf Sauter, Matthijs Oudkerk
In a cooperative study involving six clinical MR centers, local- ized 'H MR spectroscopy was used to characterize untreated metastatic brain tumors (40 cases, 45 lesions). Cubic volumes (3.4 or 8 cm? filled for more than 50% by metastatic brain tissue were examined by single-voxel double spin echo MRS, by using chemical shift selective imaging (CHESS) pulses for water suppression and T f = 135 ms. Choline (Cho), creatine (Cr) and N-acetyl aspartate (NAA) levels in brain metastases of mammary carcinoma (n = 13), lung cancer (n = 11) and mel- anoma (n = 10) were similar. Metastasis NAA/Cho signal in- tensity ratio varied between 0.00 and 1.17, compared with 2.68 2 0.56 (SD) in lobus occipitalis and 1.94 k 0.63 in corpus nuclei caudati region (f c O.OOO1, both). 'H MR spectroscopy, al- though not suited to recognize the primary tumor of metas- tases, could serve as a clinical test for excluding (metastatic) tumor as cause of solitary focal brain disorders that are hard to diagnose with current imaging methods. Key words: brain metastases; MRI; MR spectroscopy.
INTRODUCTION
Localized 'H MR spectra measured with suppression of the water signal have shown that primary brain tumors (1-11) and metastases (12) generally have high choline (Cho) levels and reduced N-acetyl aspartate (NAA) levels compared with normal brain tissue. Ratios of creatine (Cr)/Cho and NAA/Cho were reported to be significantly reduced in the spectra of large primary brain tumors compared with control spectra (7). Cr/Cho and NAA/Cho ratios were reported to decrease with increasing tumor grade (5, 6), although necrotic high-grade lesions may actually have reduced Cho levels (5). Previous studies indicated that lactate (Lact), often detected in high-grade primary brain tumors (1-11) and in large brain metasta- ses (12), is a marker of tissue decay and the formation of
MRM 33:818-826 (1995) From the Dr. Daniel den Hoed Cancer Center (DDHCC), Department of Radiology, University Hospital Rotterdam, Rotterdam, The Netherlands (P.E.S., M.O.); German Cancer Research Center (dkfz), Department of Ra- diological Diagnostics and Therapy, Heidelberg, Germany (M.V.K., P.B.); University "Federico 11'' and lnstituto Nazionale Tumori, "Pascale", Napoli, Italy (A.B., B.A.); Siemens AG, Erlangen, Germany (K.W., R.S.); UNMNA Medical Center, Radiology, Albuquerque, New Mexico (J.A.S.); University of Minnesota, Department of Radiology, Minneapolis, Minnesota (A.E.S.); Pro- fessor Dr. Breit lnstitut fur MR-Tomographie, Passau, Germany (H.K.). Address correspondence to: P. E. Sijens, Ph.D., Dr. Daniel den Hoed Cancer Center (DDHCC), Department of Radiology, University Hospital Rotterdam, Groene Hilledijk 301, P.O. Box 5201, 3008 AE Rotterdam, The Netherlands. Received October 24, 1994; revised January 23, 1995; accepted March 3, 1995.
Copyright 0 1995 by Williams & Wilkins All rights of reproduction in any form reserved.
0740-3194/95 $3.00
necrosis rather than a normal tumor metabolite (1, 5, 6, 10, 12).
Metabolic heterogeneity, such as the distribution of Cho and Lact in large primary brain tumors, can be stud- ied by using spectroscopic imaging methods (5, 8, 11). With the exception of one recent investigation limited to brain metastases of mammary carcinoma (12), 'H MRS studies published to date contain few data on metastatic brain tumors, probably because they are generally small. Because in small lesions spectroscopic imaging with a volume resolution of 1 cm" will not yield significant information regarding tumor heterogeneity, single vol- ume 'H MRS was used in this multicenter study of un- treated brain metastases intended to: 1) correlate the results of the peak area algorithm provided by the Si- emens Magnetom SP63/84 spectroscopy software pack- age with the results obtained at a central site with Mar- quardt fit (13) and Wigner distribution fit (14), 2) assess possible differences between the obtained integrated sig- nal intensities or signal intensity ratios in metastases of mammary carcinoma (n = 13) and metastases of lung cancer (n = 111, melanoma (n = 10) or other primary tumors (n = 111, and 3) evaluate the potential of 'H MR spectroscopy, if not suited to identify the primary tumor of metastases, in discriminating metastatic brain tissue from normal brain tissue.
MATERIALS AND METHODS
Forty patients with untreated brain metastases (45 le- sions) were examined successfully by 'H MRS (Table 1). Only metastases filling more than 50% of MRS voxel volume, by using contrast enhanced MRI or CT for as- sessment of lesion volume, were included in the study. MR examinations were performed at six different clinical centers by using Magnetom sP63/84 whole-body MR scanners operating at 1.5 T (Siemens AG, Erlangen, Ger- many). In preceding 'H MRS studies on healthy volun- teers, it had been established that the brain spectra ob- tained at each of the participating MR centers met standardized quality criteria. The standard circular po- larized transmitheceive head coil and 10 mT/m gradient system were used for both MRI and MRS.
Localized 'H MR Spectroscopy
The use of stimulated echo (STEAM) spectroscopy to select a VOI reliably as well as to suppress the unwanted water signal in a single experimental step has been de- scribed in detail (15). In this study the double spin echo (DSE) sequence rather than the STEAM sequence was used, because in our experience the DSE method gives
818
' H MR Spectroscopy in Patients with Metastatic Brain Tumors 819
Table 1 Clinical and Pathological Features of Patients; Results of MRS
Patient No. AgelSex Primary tumor MRS voxel size (cm3)
0201 0202
0203 0205 0208 021 1
0212 021 3 021 4 0216 0221 0222
0225 0226 0228 0231 0232 0233 0234 0235 0236 0237 0238 0239
0240 0241 0245 0401
0402 0405 0407 2703 3801 3802 3805 3808 3809 381 6
381 7 6214
54 I F 46lM
53lM 70lM 58 IF 57lM
63 IF 35lM 44 IF 45lM 69lM 63lM
63lM 69lM 39lM 58lM 71 IF 53 IF 61 IM 65lM 43 IF 65 I F 40 I F 73 IF
62lM 63 I F 63 IF 22lM
54lM 43lM 58lM 46lM 52lM 41 IF 57 IF 64lM 24 IF 71 I F
59IM 36lM
Mammary carcinoma Adenocarcinoma
2nd Metastasis Acute myeloid leukemia non-Hodgkin lymphoma Mammary carcinoma Lung cancer
2nd Metastasis Renal cell carcinoma Melanoma Mammary carcinoma Melanoma Lung cancer Soft tissue sarcoma
2nd Metastasis Melanoma Penis carcinoma Rectum carcinoma Lung cancer Mammary carcinoma Lung cancer Lung cancer Lung cancer Mammary carcinoma Mammary carcinoma Mammary carcinoma Mammary carcinoma
2nd Metastasis Melanoma Mammary carcinoma Mammary carcinoma Melanoma
2nd Metastasis Adenocarcinoma Melanoma Lung cancer Melanoma Lung cancer Mammary carcinoma Mammary carcinoma Lung cancer Melanoma Carcinoma
Lung cancer Melanoma
endometrium
8 8 8 8
27 8 8 8 8 8 8 8 8 8 8 8 8 8 8 8 3.4 8 3.4 3.4 3.4 3.4 3.4 8 8 8 8 3.4 3.4 3.4 3.4 3.4 8 8 8 8 8 8 8
8 8
Cho 2403 2744 1993 21 99 732
2306 2498 3321 1715 2473 1156 1910 4623 2326 2471 550
3117 1381 1058 1449 3115 2225 1864 3729 2934 7393 2654 3766 1813 2746 3752 1231 647
1927 1487 506
2781 1633 1595 732
21 60 3950 61 6
1118 995
Peak areas'
Cr NAA Lactllipidb
1536 1432 964
1917 42
1438 1989 1528 1194 1811 1035 1851 1614 785 932 267
1391 529 663 350 351
1610 798
1273 1842 2035
946 41 68
49 746 108 856 41 6 139 871 115 830 503 143 157
1860 943
77
182 627
2777 1892 1274 2256
1 04 1976 21 99 1633 201 0 2404 1234 479
2431 892
1401 111
1719 51 4 634 309 41 2
2432 0
1296 2602 1473 974
1967 342
1209 131 741 200 334 875 504 254 494
0 121 190 167 102
240 730
L Lact LL L L L LL L
L LL
L L LL Lact, L L LL Lact Lact
LL LL L L LL L L
Lact L L L
Lact, L L L
L
L L
a Absolute values obtained with manual integration by using standard SP63/84 software package, corrected for differences in the MRS voxel volume (a.u.). L, minor lipid signal: LL, intense lipid signal.
close to the reported 190% of the signal of STEAM (16). The slice profiles of the 180° RF pulses, sinc-pulses mul- tiplied with a hanning function, used in the DSE se- quence are slightly degraded at the top compared with the 90° pulses (16). It was found, however, that in phan- tom experiments artifacts due to acetate or Lact signals from outside the VOI were not larger than expected from the calculated chemical shift artifacts of 0.074 cm/ppm at the slice selection gradients of 2 mT/m used for selecting volumes of 3.4 or 8 cm3 (in one case 27 cm')). Care was taken to ensure proper positioning of lesion MRS voxels
in regions in which metastatic tissue is found in Con- trast-enhanced MRI and CT studies. All patients had multiple brain lesions.
Because in lateral voxels signal contributions from subcutaneous fat and bone marrow were often significant and quantitative discrimination between the Lact (dou- blet centered at chemical shift of 1.32 ppm) and lipid signals (0.9 and 1.3 ppm) was not always possible, quan- titative analysis of 'H MR spectra of brain metastases was confined to Cho (chemical shift 3.21 ppm), Cr (3.02 ppm) and NAA (2.01 ppm) peaks. Lesion spectra and control
820 Sijens et al.
c f
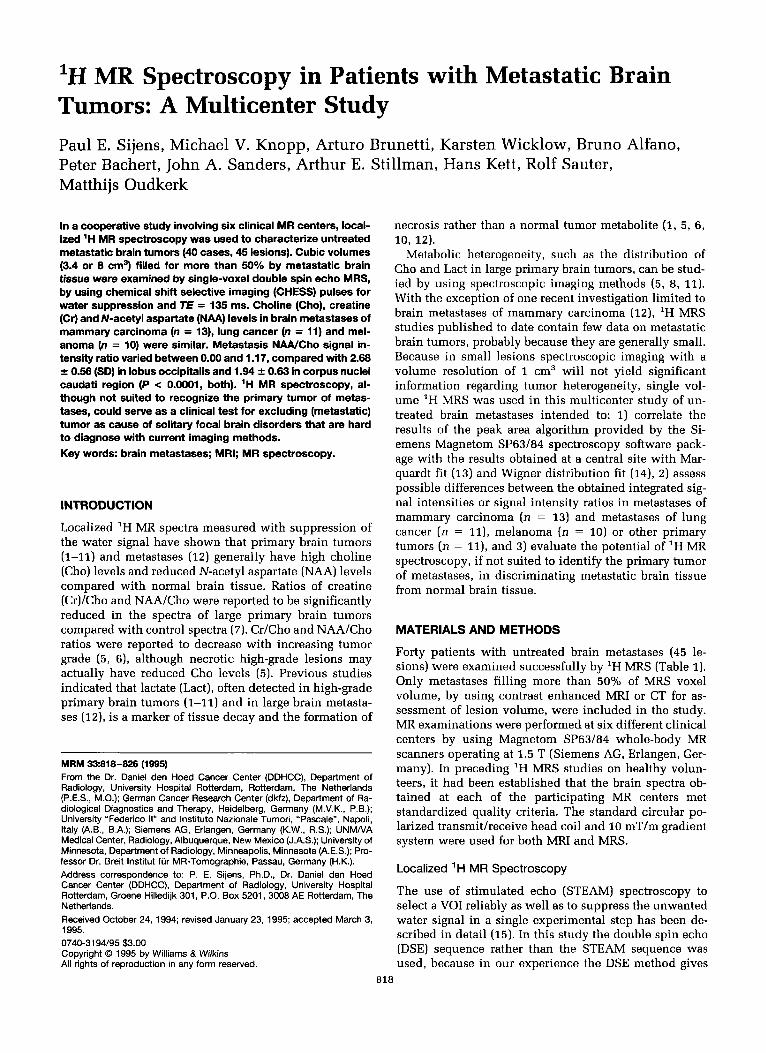
FIG. 1. 'H MR spectrum of meta- static brain tumor, (case 0221; left side), scaled relative to the spectrum of occipital control voxel (right side). The transverse MRI shows the 8 cm3 MRS voxel centered on the L-pari- eta1 lesion. Spectral assignments: Cho 3.21, Cr 3.02 and 3.91, and NAA 2.01 parts per million relative to tet- ramethylsilane.
, . . . , l . . , , ~ , ~ , , l , . . , , . . . , l . , , , l , ~ I " " I " " I " ' ~ I " ' ' I " " 1 ~ " ~ l 4 . 0 3.5 3.0 2.5 2.0 1.5 l.Oppm 3 . 5 3 . 0 2 . 5 2 .0 1 . 5 1.0ppm
spectra (centered at the level of corpus nuclei caudati or in the occipital lobe of the brain) were acquired with TE = 135 ms which implies that due to J-modulation, the doublet signal of Lact is inverted (180O out of phase) relative to the singlets of Cho, Cr and NAA (17). The whole procedure including sagittal and transverse MRI, global shimming, volume selection, local shimming, wa- ter suppression optimization, and the measurement of two voxels took approximately 60 min. The acquisition of a sagittal localizer was followed by a T, weighted multiple slice MRI sequence in the transverse plane (MRI protocols were used as is common practice in the corre- sponding institution). The field homogeneity achieved in global and local shimming resulted in water peak line widths of typically 20 and 6 Hz, respectively (16 of 61
lesions with, for whatever reason, water line widths larger than 8 Hz resulting in poor spectra, were excluded from the study). DSE MR spectra were collected with 2.56 ms sinc-shaped RF pulses, i.e., sinc-pulses multi- plied with a Hanning function, preceded by 25.6-ms Gaussian-shaped RF pulses for CHESS and subsequent spoiling of the resultant water signal. The second half of the spin echo was collected by using 1024 data points and a spectral width of 500 Hz. All single voxel DSE measurements were the sum of 256 acquisitions with four prescans and TR = 1600 ms (acquisition time 6.57 min). Time domain data were multiplied with a Gaussian function (center 0 ms, half-width 256 ms), Fourier trans- formed, phase corrected and quantitated by individual sites by using the peak area algorithm provided by the
’ H MH Spectroscopy in Patients with Metastatic Brain Tumors 82 1
0
N
i
0
n
--T-T-r--Tr-+-- 3.5 3.0 2 . 5 2.0 1.5 1 . 0 p p m
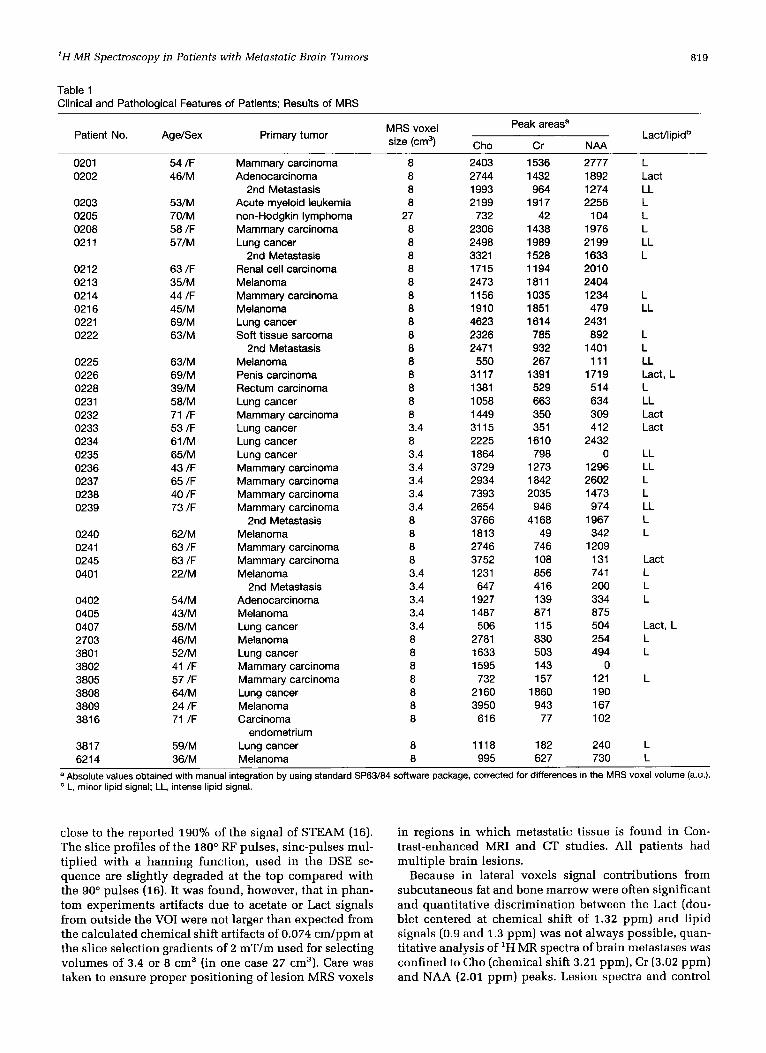
FIG. 2. ’H MR spectrum of meta- static brain tumor (case 0232; left side) illustrative of the minority of cases (six of 45) showing a Lact dou- blet (1.27 and 1.36 ppm) in addition to comparatively small amounts of Cho, Cr and NAA. Right side spec- trum: occipital control voxel. The transverse MRI shows the 8 cm3 MRS voxel centered on the L-occip- ital lesion.
standard Siemens Magnetom SP63/84 spectroscopy soft- ware package. In this method, peaks are defined “manu- ally” by placement of two cursors in the Fourier trans- formed and phase-corrected spectra after which the peak area is displayed for visual inspection. The entire data set was evaluated by means of two alternative methods, Mar- quardt fit (15), and Wigner distribution fit (16) based on frequency domain and time domain curve fitting, respec- tively. At those clinical sites in which gradient-induced artifacts in amplitude and phase of the acquired time domain signals were significant, a deconvolution method was used for correcting the spectra for the effects of eddy currents. This correction is performed in the time-do- main by using a reference spectrum obtained without
water suppression but under identical steady-state con- ditions (18). Data have not been corrected for saturation and relaxation effects. The Cho, Cr and NAA peak areas presented in Table 1 are further influenced by inter- patient variations in transmitter reference voltage (small- er than 10%; not corrected for) and by variations in the magnitude of the signal strength achieved after local shimming (not corrected for).
Statistics
Student’s t tests for paired and unpaired data were used in the assessment of statistical significance of linear cor- relations and differences in group means, respectively.
822 Sijens et al.
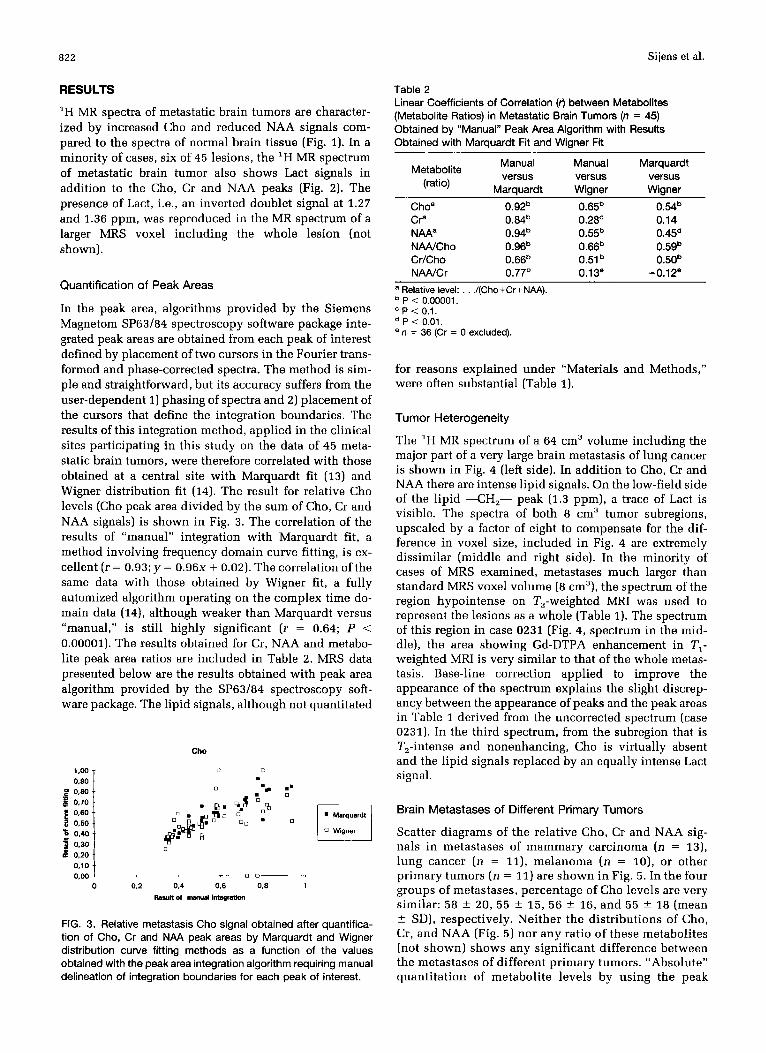
RESULTS
‘H MR spectra of metastatic brain tumors are character- ized by increased Cho and reduced NAA signals com- pared to the spectra of normal brain tissue (Fig. 1). In a minority of cases, six of 45 lesions, the ‘H MR spectrum of metastatic brain tumor also shows Lact signals in addition to the Cho, Cr and NAA peaks (Fig. 2). The presence of Lact, i.e., an inverted doublet signal at 1.27 and 1.36 ppm, was reproduced in the MR spectrum of a larger MRS voxel including the whole lesion (not shown).
Quantification of Peak Areas
In the peak area, algorithms provided by the Siemens Magnetom SP63184 spectroscopy software package inte- grated peak areas are obtained from each peak of interest defined by placement of two cursors in the Fourier trans- formed and phase-corrected spectra. The method is sim- ple and straightforward, but its accuracy suffers from the user-dependent 1) phasing of spectra and 2) placement of the cursors that define the integration boundaries. The results of this integration method, applied in the clinical sites participating in this study on the data of 45 meta- static brain tumors, were therefore correlated with those obtained at a central site with Marquardt fit (13) and Wigner distribution fit (14). The result for relative Cho levels (Cho peak area divided by the sum of Cho, Cr and NAA signals) is shown in Fig. 3. The correlation of the results of “manual” integration with Marquardt fit, a method involving frequency domain curve fitting, is ex- cellent (r = 0.93; y = 0 . 9 6 ~ + 0.02). The correlation of the same data with those obtained by Wigner fit, a fully automized algorithm operating on the complex time do- main data (14), although weaker than Marquardt versus “manual,” is still highly significant ( r = 0.64; P < 0.00001). The results obtained for Cr, NAA and metabo- lite peak area ratios are included in Table 2. MRS data presented below are the results obtained with peak area algorithm provided by the SP63/84 spectroscopy soft- ware package. The lipid signals, although not quantitated
i 0.60
P 0.40
I: 0.20 2 0.30
0.10 0.00
0
Cho
0 0 . .9 0
0 1 Marquardt Ll
I,
0.2 0.4 0,B 0.6 Retun of m m a l mtegrati i
- 1
FIG. 3. Relative metastasis Cho signal obtained after quantifica- tion of Cho, Cr and NAA peak areas by Marquardt and Wigner distribution curve fitting methods as a function of the values obtained with the peak area integration algorithm requiring manual delineation of integration boundaries for each peak of interest.
Table 2 Linear Coefficients of Correlation (rj between Metabolites (Metabolite Ratios) in Metastatic Brain Tumors (n = 45) Obtained by “Manual” Peak Area Algorithm with Results Obtained with Marquardt Fit and Wigner Fit
Manual Manual Marquardt versus versus versus
Marauardt Wianer Wianer
Metabolite (ratio)
Cho” 0.92b 0.65b 0.54b C P 0.84b 0.28” 0.14 NAAa 0.94b 0.55b 0.45‘ NWCho 0.96b 0.66b 0.5gb Cr/Cho 0.66b 0.51 0.50b N W C r 0.77b 0.13” -0.12”
a Relative level: . . ./(Cho+Cr+NAA). P < 0.00001. P < 0.1. P < 0.01.
e n = 36 (Cr = 0 excluded).
for reasons explained under “Materials and Methods,” were often substantial (Table 1).
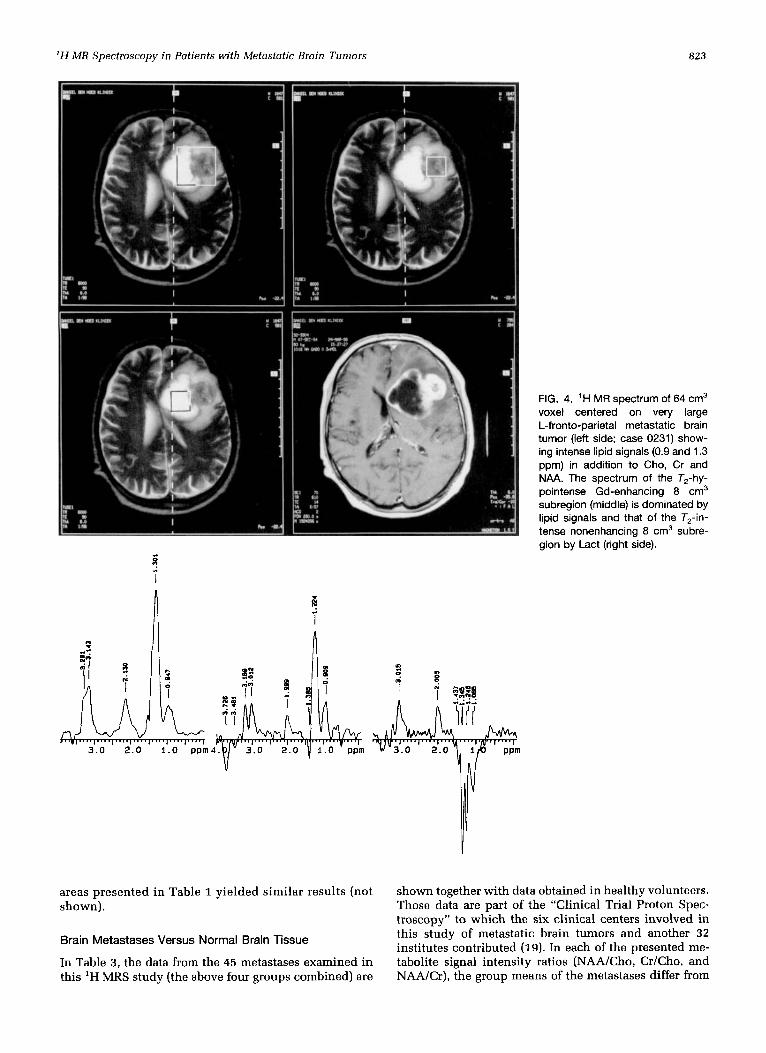
Tumor Heterogeneity
The ‘H MR spectrum of a 64 cm3 volume including the major part of a very large brain metastasis of lung cancer is shown in Fig. 4 (left side). In addition to Cho, Cr and NAA there are intense lipid signals. On the low-field side of the lipid -CH2- peak (1.3 ppm), a trace of Lact is visible. The spectra of both 8 cm3 tumor subregions, upscaled by a factor of eight to compensate for the dif- ference in voxel size, included in Fig. 4 are extremely dissimilar (middle and right side). In the minority of cases of MRS examined, metastases much larger than standard MRS voxel volume (8 cm3), the spectrum of the region hypointense on T,-weighted MRI was used to represent the lesions as a whole (Table 1). The spectrum of this region in case 0231 (Fig. 4, spectrum in the mid- dle), the area showing Gd-DTPA enhancement in Tl- weighted MRI is very similar to that of the whole metas- tasis. Base-line correction applied to improve the appearance of the spectrum explains the slight discrep- ancy between the appearance of peaks and the peak areas in Table 1 derived from the uncorrected spectrum (case 0231). In the third spectrum, from the subregion that is T,-intense and nonenhancing, Cho is virtually absent and the lipid signals replaced by an equally intense Lact signal.
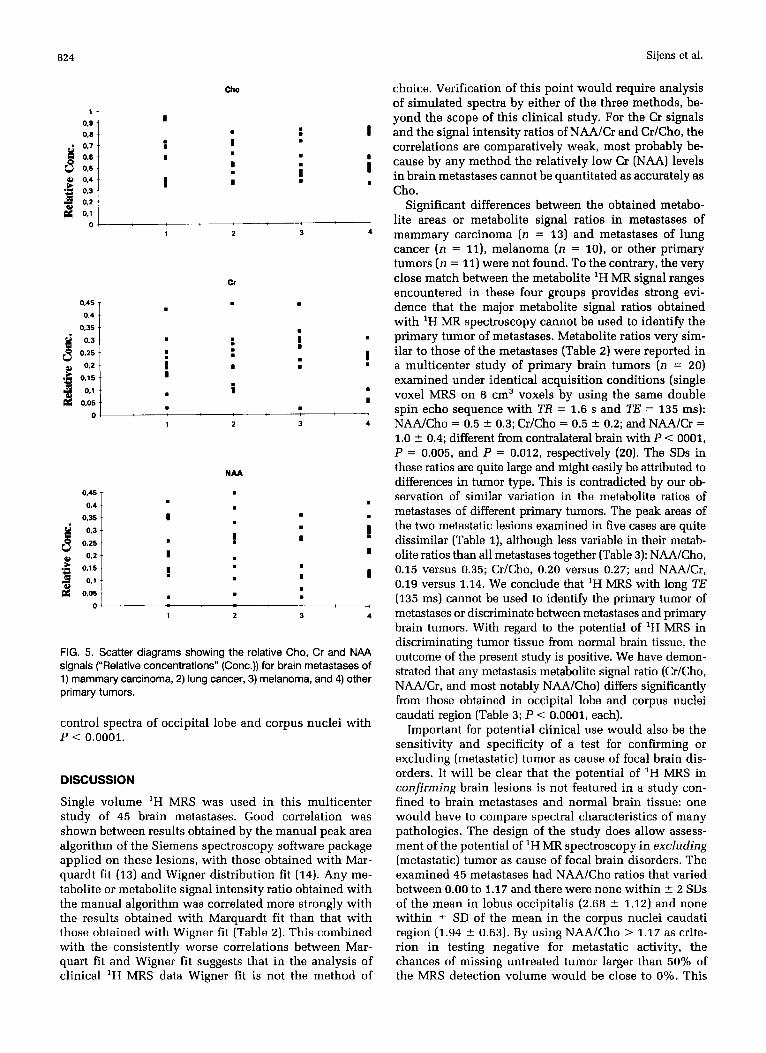
Brain Metastases of Different Primary Tumors
Scatter diagrams of the relative Cho, Cr and NAA sig- nals in metastases of mammary carcinoma (n = 13), lung cancer (n = 11), melanoma (n = lo) , or other primary tumors (n = 11) are shown in Fig. 5. In the four groups of metastases, percentage of Cho levels are very similar: 58 2 20, 55 2 15, 56 t 16, and 55 5 18 (mean 5 SD), respectively. Neither the distributions of Cho, Cr, and NAA (Fig. 5) nor any ratio of these metabolites (not shown) shows any significant difference between the metastases of different primary tumors. “Absolute” quantitation of metabolite levels by using the peak
‘ H MR Spectroscopy in Patients with Metastatic Brain Tumors 823
FIG. 4. ’H MR spectrum of 64 cm3 voxel centered on very large L-fronto-parietal metastatic brain tumor (left side: case 0231) show- ing intense lipid signals (0.9 and 1.3 ppm) in addition to Cho, Cr and NAA. The spectrum of the T,-hy- pointense Gd-enhancing 8 cm3 subregion (middle) is dominated by lipid signals and that of the T,-in- tense nonenhancing 8 cm3 subre- gion by Lact (right side).
CI
3.0 2.0 1.0 ppm
N C I D ’ i .h I\ iiii
areas presented in Table 1 yielded similar results (not shown).
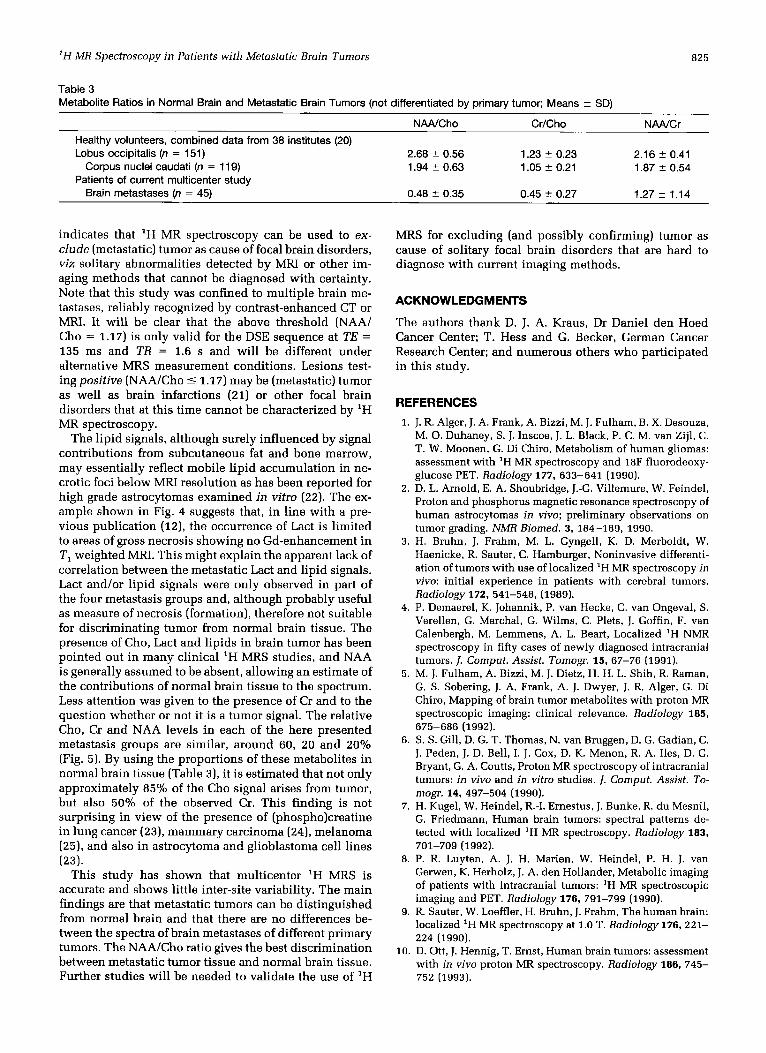
Brain Metastases Versus Normal Brain Tissue
In Table 3, the data from the 45 metastases examined in this ‘H MRS study (the above four groups combined) are
shown together with data obtained in healthy volunteers. Those data are part of the “Clinical Trial Proton Spec- troscopy” to which the six clinical centers involved in this study of metastatic brain tumors and another 32 institutes contributed (19). In each of the presented me- tabolite signal intensity ratios (NAAKho, Cr/Cho, and NAA/Cr), the group means of the metastases differ from
824
0.46 -
0.4 ..
0.36 .. d 0.3 -.
8 0.25 ~.
.j o;:: a 0.05
01
Sijens et al.
.
. . I . ! . I . . : I I I . . i
.’ I . .
0 , q 0.8
0 CJ 0.6
I
. I
I
I
t_t
1
ChO
. . . . I
. I
I
I
I . I
. . . I
I
2 3 4
NAA
0,45 . 0,4 1 . . .
0.35 I . . I . I I ! . . .
1 2 3 4
FIG. 5. Scatter diagrams showing the relative Cho, Cr and NAA signals (“Relative concentrations” (Conc.)) for brain metastases of 1) mammary carcinoma, 2) lung cancer, 3) melanoma, and 4) other primary tumors.
control spectra of occipital lobe and corpus nuclei with P < 0.0001.
DISCUSSION
Single volume ‘H MRS was used in this multicenter study of 45 brain metastases. Good correlation was shown between results obtained by the manual peak area algorithm of the Siemens spectroscopy software package applied on these lesions, with those obtained with Mar- quardt fit (13) and Wigner distribution fit (14). Any me- tabolite or metabolite signal intensity ratio obtained with the manual algorithm was correlated more strongly with the results obtained with Marquardt fit than that with those obtained with Wigner fit (Table 2). This combined with the consistently worse correlations between Mar- quart fit and Wigner fit suggests that in the analysis of clinical ‘H MRS data Wigner fit is not the method of
choice. Verification of this point would require analysis of simulated spectra by either of the three methods, be- yond the scope of this clinical study. For the Cr signals and the signal intensity ratios of NAA/Cr and Cr/Cho, the correlations are comparatively weak, most probably be- cause by any method the relatively low Cr (NAA) levels in brain metastases cannot be quantitated as accurately as Cho.
Significant differences between the obtained metabo- lite areas or metabolite signal ratios in metastases of mammary carcinoma (n = 13) and metastases of lung cancer (n = 11), melanoma (n = lo), or other primary tumors (n = 11) were not found. To the contrary, the very close match between the metabolite ‘H MR signal ranges encountered in these four groups provides strong evi- dence that the major metabolite signal ratios obtained with ‘H MR spectroscopy cannot be used to identify the primary tumor of metastases. Metabolite ratios very sim- ilar to those of the metastases (Table 2) were reported in a multicenter study of primary brain tumors (n = 20) examined under identical acquisition conditions (single voxel MRS on 8 cm3 voxels by using the same double spin echo sequence with TR = 1.6 s and TE = 135 ms): NAA/Cho = 0.5 ? 0.3; Cr/Cho = 0.5 ? 0.2; and NAA/Cr = 1.0 ? 0.4; different from contralateral brain with P < 0001, P = 0.005, and P = 0.012, respectively (20). The SDs in these ratios are quite large and might easily be attributed to differences in tumor type. This is contradicted by our ob- servation of similar variation in the metabolite ratios of metastases of different primary tumors. The peak areas of the two metastatic lesions examined in five cases are quite dissimilar (Table I), although less variable in their metab- olite ratios than all metastases together (Table 3): NAA/Cho, 0.15 versus 0.35; Cr/Cho, 0.20 versus 0.27; and NAA/Cr, 0.19 versus 1.14. We conclude that ‘H M R S with long TE (135 ms) cannot be used to identify the primary tumor of metastases or discriminate between metastases and primary brain tumors. With regard to the potential of ‘H M R S in discriminating tumor tissue from normal brain tissue, the outcome of the present study is positive. We have demon- strated that any metastasis metabolite signal ratio (Cr/Cho, NAA/Cr, and most notably NAA/Cho) differs significantly from those obtained in occipital lobe and corpus nuclei caudati region (Table 3; P < 0.0001, each).
Important for potential clinical use would also be the sensitivity and specificity of a test for confirming or excluding (metastatic) tumor as cause of focal brain dis- orders. It will be clear that the potential of ‘H MRS in confirming brain lesions is not featured in a study con- fined to brain metastases and normal brain tissue: one would have to compare spectral characteristics of many pathologies. The design of the study does allow assess- ment of the potential of ‘H MR spectroscopy in excluding (metastatic) tumor as cause of focal brain disorders. The examined 45 metastases had NAA/Cho ratios that varied between 0.00 to 1.17 and there were none within ? 2 SDs of the mean in lobus occipitalis (2.68 ? 1.12) and none within -+ SD of the mean in the corpus nuclei caudati region (1.94 ? 0.63). By using NAA/Cho > 1.17 as crite- rion in testing negative for metastatic activity, the chances of missing untreated tumor larger than 50% of the MRS detection volume would be close to 0%. This
' H MR Spectroscopy in Patients with Metastatic Brain Tumors 825
Table 3 Metabolite Ratios in Normal Brain and Metastatic Brain Tumors (not differentiated by primary tumor; Means ? SD)
NWCho CrfCho N M C r Healthy volunteers, combined data from 38 institutes (20) Lobus-occipitalis (n = 151)
Corpus nuclei caudati (n = 11 9) Patients of current multicenter study
Brain metastases (n = 45)
2.68 ? 0.56 1.23 ? 0.23 2.16 ? 0.41 1.94 t- 0.63 1.05 t 0.21 1.87 2 0.54
0.48 & 0.35 0.45 ? 0.27 1.27 ? 1.14
indicates that 'H MR spectroscopy can be used to ex- clude (metastatic) tumor as cause of focal brain disorders, viz solitary abnormalities detected by MIU or other im- aging methods that cannot be diagnosed with certainty. Note that this study was confined to multiple brain me- tastases, reliably recognized by contrast-enhanced CT or MRI. It will be clear that the above threshold (NAA/ Cho = 1.17) is only valid for the DSE sequence at TE = 135 ms and TR = 1.6 s and will be different under alternative MRS measurement conditions. Lesions test- ing positive (NAA/Cho 5 1.17) may be (metastatic) tumor as well as brain infarctions (21) or other focal brain disorders that at this time cannot be characterized by 'H MR spectroscopy.
The lipid signals, although surely influenced by signal contributions from subcutaneous fat and bone marrow, may essentially reflect mobile lipid accumulation in ne- crotic foci below MRI resolution as has been reported for high grade astrocytomas examined in vitro (22). The ex- ample shown in Fig. 4 suggests that, in line with a pre- vious publication (12), the occurrence of Lact is limited to areas of gross necrosis showing no Gd-enhancement in T, weighted MIU. This might explain the apparent lack of correlation between the metastatic Lact and lipid signals. Lact and/or lipid signals were only observed in part of the four metastasis groups and, although probably useful as measure of necrosis (formation), therefore not suitable for discriminating tumor from normal brain tissue. The presence of Cho, Lact and lipids in brain tumor has been pointed out in many clinical 'H MRS studies, and NAA is generally assumed to be absent, allowing an estimate of the contributions of normal brain tissue to the spectrum. Less attention was given to the presence of Cr and to the question whether or not it is a tumor signal. The relative Cho, Cr and NAA levels in each of the here presented metastasis groups are similar, around 60, 20 and 20% (Fig. 5). By using the proportions of these metabolites in normal brain tissue (Table 3), it is estimated that not only approximately 85% of the Cho signal arises from tumor, but also 50% of the observed Cr. This finding is not surprising in view of the presence of (phospho)creatine in lung cancer (23), mammary carcinoma (24), melanoma (25), and also in astrocytoma and glioblastoma cell lines (23).
This study has shown that multicenter 'H MRS is accurate and shows little inter-site variability. The main findings are that metastatic tumors can be distinguished from normal brain and that there are no differences be- tween the spectra of brain metastases of different primary tumors. The NAA/Cho ratio gives the best discrimination between metastatic tumor tissue and normal brain tissue. Further studies will be needed to validate the use of 'H
MRS for excluding (and possibly confirming) tumor as cause of solitary focal brain disorders that are hard to diagnose with current imaging methods.
ACKNOWLEDGMENTS
The authors thank D. J. A. Kraus, Dr Daniel den Hoed Cancer Center; T. Hess and G. Becker, German Cancer Research Center; and numerous others who participated in this study.
REFERENCES 1. J. R. Alger, J. A. Frank, A. Bizzi, M. J. Fulham, B. X. Desouza,
M. 0. Duhaney, S. J. Inscoe, J. L. Black, P. C. M. van Zijl, C. T. W. Moonen, G. Di Chiro, Metabolism of human gliomas: assessment with 'H MR spectroscopy and 18F fluorodeoxy- glucose PET. Radiology 177, 633-641 (1990).
2. D. L. Arnold, E. A. Shoubridge, J.-G. Villemure, W. Feindel, Proton and phosphorus magnetic resonance spectroscopy of human astrocytomas in vivo; preliminary observations on tumor grading. NMR Biomed. 3, 184-189, 1990.
3. H. Bruhn, J. Frahm, M. L. Gyngell, K. D. Merboldt, W. Haenicke, R. Sauter, C. Hamburger, Noninvasive differenti- ation of tumors with use of localized 'H MR spectroscopy in vivo: initial experience in patients with cerebral tumors. Radiology 172, 541-548, (1989).
4. P. Demaerel, K. Johannik, P. van Hecke, C. van Ongeval, S. Verellen, G. Marchal, G. Wilms, C. Plets, J. Goffin, F. van Calenbergh, M. Lemmens, A. L. Beart, Localized 'H NMR spectroscopy in fifty cases of newly diagnosed intracranial tumors. I. Comput. Assist. Tomogr. 15, 67-76 (1991).
5. M. J. Fulham, A. Bizzi, M. J. Dietz, H. H. L. Shih, R. Raman, G. S. Sobering, J. A. Frank, A. J. Dwyer, J. R. Alger, G. Di Chiro, Mapping of brain tumor metabolites with proton MR spectroscopic imaging: clinical relevance. Radiology 185,
6. S. S. Gill, D. G. T. Thomas, N. van Bruggen, D. G. Gadian, C. J. Peden, J. D. Bell, I. J. Cox, D. K. Menon, R. A. Iles, D. G. Bryant, G. A. Coutts, Proton MR spectroscopy of intracranial tumors: in vivo and in vitro studies. J. Comput. Assist. To- mogr. 14, 497-504 (1990).
7. H. Kugel, W. Heindel, R.-I. Ernestus, J. Bunke, R. du Mesnil, G. Friedmann, Human brain tumors: spectral patterns de- tected with localized 'H MR spectroscopy. Radiology 183,
8. P. R. Luyten, A. J. H. Marien, W. Heindel, P. H. J. van Gerwen, K. Herholz, J. A. den Hollander, Metabolic imaging of patients with intracranial tumors: 'H MR spectroscopic imaging and PET. Radiology 176, 791-799 (1990).
9. R. Sauter, W. Loeffler, H. Bruhn, J. Frahm, The human brain: localized 'H MR spectroscopy at 1.0 T. Radiology 176,221- 224 (1990).
10. D. Ott, J. Hennig, T. Ernst, Human brain tumors: assessment with in vivo proton MR spectroscopy. Radiology 186, 745- 752 (1993).
675-686 (1992).
701-709 (1992).
826
11. C. M. Segebarth, D. F. Baleriaux, P. R. Luyten, J. A. den Hollander, Detection of metabolic heterogeneity of human intracranial tumors in vivo by ‘H NMR spectroscopic imag- ing. Magn. Reson. Med. 13, 62-76 (1990).
12. P. E. Sijens, P. van Dijk, M. Oudkerk, Correlation between choline level and Gd-DTPA enhancement in patients with brain metastases of brain carcinoma. Magn. Reson. Med. 32,
13. D. W. Marquardt, An algorithm for least-squares estimation of nonlinear parameters. I. SOC. Indust. Appl. Math. 11,
14. J. H. J. Leclerc, Time frequency representation of damped sinus-oids. 1. Magn. Reson. 95, 10-31 (1991).
15. J. Frahm, K.-D. Merboldt, W. Haenicke, Localized proton spectroscopy using stimulated echoes. J. Magn. Reson. 72,
16. D. Hentschel, R. Ladebeck, In vivo localized ’H spectros- copy with spin echos and stimulated echos: a quantitative comparison. Appl. Magn. Reson. 1, 41-46 (1990).
17. C. H. Sotak, D. M. Freeman, A method for volume-localized
549-555 (1994).
431-441 (1963).
502-508 (1987).
18.
lactate editing using zero-quantum coherence created in a stimulated-echo pulse sequence. I . Magn. Reson. 77, 382- 388 (1988). R. J. Ordidge, I. D. Cresshull, The correction of transient B, field shifts following the application of pulsed gradients by phase correction in the time domain. J. M a p . Reson. 69, 151-155 (1986).
19.
20.
21.
22.
23.
24.
25.
Sijens et al.
R. Sauter, Cerebral single volume proton spectroscopy on healthy volunteers; a multicenter pilot study, in “Proc., SMRM, 12th Annual Meeting, New York, 1993,” p. 1531. W. Negendank, R. Zimmerman, E. Gotsis, A. Falini, T. Vogl, E. Moser, J. Evelhoch, T. Spraggins, B. Terwey, B. Lee, K. Kamada, R. Sauter, A cooperative group study of ‘H MRS of primary brain tumors, in “Proc., SMRM, 12th Annual Meet- ing, New York, 1993,” p. 1521. J. H. Duijn, G. B. Matson, A. A. Maudsley, J. W. Hugg, M. W. Weiner, Human brain infarction: proton MR spectroscopy. Radiology 183, 711-718 (1992). A. C. Kuesel, G. R. Sutherland, W. Halliday, I.C.P. Smith, ‘H MRS of high grade astrocytomas: mobile lipid accumulation in necrotic tissue. NMR Biomed. 7, 149-155 (1994). K. Kotitschke, H. Jung, S. Nekolla, A. Haase, A. Bauer, U. Bogdahn, High-resolution one- and two-dimensional ‘H MRS of human brain tumor and normal glial cells. NMR Biomed. 7, 111-120 (1994). P. E. Sijens, W. M. M. J. Bovee, D. Seijkens, G. Los, D. Rutgers, In vivo ‘lP NMR study of the response of a murine mammary tumor to different doses of gamma-radiation. Cancer Res. 46, 1427-1432 (1986). R. H. Knop, D. N. Carney, C. W. Chen, J. S. Cohen, J. D. Minna, Levels of high energy phosphates in human lung cancer lines by 31P nuclear magnetic resonance spectros- copy. Cancer Res. 47, 3357-3359, 1987.


