Embed Size (px)
Citation preview
1—3
ABSTRACT Studies of the accuracy of questionnaire measurements of habitual dietary intakes of individuals are generallybased on a comparison with replicate weighed-food consumptionrecords or 24-h recalls used as reference measurements. The conrelation between the questionnaire measurements (Q) and thesubjects' true long-term intake (T) of foods or nutrients (PQT) isthen estimated from the observed correlation with mean referencemeasurements, with correction for attenuating effects due to random errors in the reference measurements themselves. For thisapproach to be valid, it is crucial that these random errors areuncorrelated between questionnaire and reference measurementsand between replicate reference measurements. In practice, howeven, these two criteria are not always fulfilled and PQT may be
systematically overestimated or underestimated. The advantage ofusing biochemical markers in dietary assessments is that there isoften little reason to doubt that their random errors are trulyindependent of those of both questionnaire measurements and
food-consumption records. Thus, the inclusion of such markers indietary validity studies can make it more likely that the criteria of
independent errors, crucial in validity studies, are met. Am JClin Nutr 1997;65(suppl): 1232S—9S.
KEY WORDS Validity study, dietary assessment method,biochemical marker, latent variable method, questionnaire, random error, systematic error, validity coefficient, weighed-foodrecord, 24-h recall
INTRODUCTION
A major impediment to epidemiologic research on diet andthe risk of chronic disease is the relative inaccuracy with whichindividuals' habitual long-term intake of foods or nutrients canbe measured by structured dietary questionnaires. Randomerrors, which by definition are unassociated with the truedietary intakes being measured, cause estimates of relative riskor other measures of diet-disease associations to be weakened(an effect usually referred to as attenuation bias) and reduce thestatistical power of epidemiologic studies (1). In addition, atendency to overestimate or underestimate dietary intakes systematically at a group level can lead to distortions of the scaleon which differences in intakes of foods or nutrients are measured. Both types of measurement error—random and systematic—can thus compromise the interpretation of relative riskestimates with respect to recommended daily intakes and may
complicate comparisons of relative risk estimates from different studies (2).
Estimation of the magnitude of effects caused by dietaryassessment errors is usually done by means of a validitystudy—in a representative sample of the study population—toevaluate the accuracy of the dietary questionnaire measurements. Of primary interest is the coefficient of correlationbetween questionnaire measurements (Q) and true intake (7)(PQT) as a measure of the reliability with which individuals are
ranked according to their habitual intake of specific foodgroups or nutrients. In mathematical terms, the magnitude ofattenuation bias and the loss of statistical power due to randomdietary assessment errors depend on this coefficient, which isalso known as the validity coefficient of the measurements (3).
In operational terms, validation can also be defined as theestimation of a number of unknown factors in a hypotheticalmeasurement model that is assumed to describe correctly therelation between questionnaire measurements and true intake.Usually, the analysis of dietary validity studies is based on the(often only implicit) assumption of a linear measurementmodel:
Q= OLQ+ @3QT+ (1)
In this model, aQ and /3@can be referred to as constant andproportional scaling biases, respectively. The unknown modelfactors to be estimated are those that define the distribution oftrue exposure (ie, the mean j@ and the variance a@.)as well asthe magnitude of scaling biases a@ and f3@and variance ofrandom errors ((Y@Q)in the questionnaire measurements. Thecorrelation PQT can then be calculated from the estimatedparameters (T@.,(T@Q,and@ as
PQT @Jl/[l + (2)
(assuming that both true and measured intakes are normallydistributed).
Ideally, PQT and the magnitude of a@ and /3Q would beestimated by comparison with perfect measurements of the
@ From the International Agency for Research on Cancer, Lyon, France.2 Supported by the Europe Against Cancer Programme of the European
Union.3 Address reprint requests to R Kaaks, International Agency for Re
search on Cancer, 150 Cours Albert-Thomas, 69372 Lyon Cedex 08,France. E-mail: [email protected].
1232S Am J Clin Nutr l997;65(suppl):l232S—9S. Printed in USA. 0 1997 American Society for Clinical Nutrition
Biochemicalmarkersas additionalmeasurementsinstudiesof the accuracyof dietaryquestionnairemeasurements:conceptualissuesRudolffKaaks
Dow
nloaded from https://academ
ic.oup.com/ajcn/article/65/4/1232S/4655748 by guest on 18 January 2022
1233SBIOCHEMICAL MARKERS IN DIETARY STUDIES
subjects' true intake (7). In practice, however, such perfectmeasurements of T are generally not available. True intakemust therefore be considered as values of a variable that existsbut cannot be observed without error. We recently reviewedsome common approaches for estimating PQT' aQ, and@ andshowed how these methods can be described in terms of “¿�latentvariable― models (4). We concluded that, in general, estimationof PQT requires a comparison with at least two additionalmeasurements, under the assumption that any observed associations between the three measurements being compared are
due entirely to their relations with the same true intake variableand that their random errors are uncorrelated. If the objective isalso to obtain estimates of a@,and f3@in addition to PQT' at leastone of the additional measurements (a reference measurementR) must be unbiased on a group level, ie:
with
Violation of one of these assumptions will tend to result inbiased estimates of the validity coefficient PQT and the scalingfactors a@ and@ In particular, a positive covaniance betweenerrors of questionnaire and reference measurements will lead toan overestimation of PQT•On the other hand, a positive covariance between the random errors of replicate reference measunements will produce an underestimation of the attenuationfactor PRT and therefore an underestimation of the corrected(deattenuated) correlation coefficient PQT•
It is usually considered that the first assumption, Cov(€R,€¿�Q)= 0, will be at least approximately true, especially when the
reference measurements are based on weighed-food records.Questionnaire measurements and weighed-food records, however, share some potential sources of error. For instance, bothmay be biased in the same direction and to a similar degree bya subject's lack of motivation to record precisely all foodsactually consumed during 1 d, on to fill out completely adietary questionnaire about long-term habitual food consumption. Inaccuracies in a food-composition table used for conversion of food-consumption amounts into nutrient intakes mayalso translate into similar errors in both types of measurements.When 24-h recalls are used as reference measurements (insteadof weighed-food records), it is even more likely that there willbe some degree of correlation between random errors (€QandCR) because both methods rely on a subject's capacity for
recalling and describing food consumption accurately.The second assumption, Cov(€R,,ERJ)= 0, is often based on
the supposition that when a recording method is used to assesslong-term habitual intake of a given food or nutrient, randomerrors result mainly from day-to-day variations in true intake.However, comparisons of weighed-food consumption recordswith measurements of energy expenditure based on the doublylabeled water method have shown variations in the tendency tounderreport actual food intake systematically on a given day(9). This has been explained by either a failure to record foodsthat have actually been consumed or a tendency to changedietary habits on days on which records are being kept. Whateven the explanation, the doubly labeled water studies suggestthat there may be a positive covariance between the randomerrors of replicate weighed-food records, so that the average ofeven a large number of replicate records may fail to provide afully accurate ranking of individuals according to their truehabitual intakes. Again, the covaniance between the errors ofreplicate measurements may be even higher when 24-h recallsare used because subjects may vary systematically in theircapacity to recall what foods were consumed the previous dayor to describe portion sizes.
Thus, doubt remains about whether random errors of reference measurements based on a recording method are fullyindependent of those of questionnaire measurements. It is alsouncertain whether errors are independent between replicatereference measurements obtained with the same method in thesame subjects. As mentioned earlier, a positive covariancebetween the errors EQ and ER would lead to an overestimationof the correlation PQT' whereas a positive covariance betweenthe errors CR1 and CR2 would result in an underestimation.Without additional information, it is impossible to evaluate themagnitude of each of these two possible biases or predict whichof the two will predominate.
R = T + CR
E(CRIfl = 0
(3)
The usual approach to collecting the two (or more) additionalmeasurements needed for a validity study is to obtain measure
ments of the actual daily food consumption at different periodsthroughout the year with use of weighed-food records on 24-hrecalls. In this paper, I first discuss the potential limitations ofvalidity studies that are based only on a comparison withreplicate measurements of daily intake. I then evaluate theextent to which these limitations can be overcome by includinga third type of measurement—one based on biochemicalmarkers.
COMPARISONS BETWEEN QUESTIONNAIRE ANDRECORDING METHODS
Both weighed-food records and 24-h recalls are generallythought to be relatively unbiased at a group level, conditionalon true intake; in other words, these measurements are assumed, on average, to have no, or relatively small, constant onproportional scaling biases and are thus considered to providea valid reference scale of measurement. On the other hand,studies of the day-to-day variation in dietary intake have shownthat food-consumption records can contain important amountsof random error, even when averaged over as many as 14—21 d(5, 6). The observed correlation coefficients between question
name and reference measurements would thus generally underestimate the validity coefficients of the questionnaire measurements (PQT) by a factor equal to the correlation betweenreference measurements and true intake (PRT); in this context,PRT @5also called the attenuation coefficient. Methods have
been proposed to adjust for this underestimation by estimatingPRT from the reproducibility of the reference measurements (5,
7). Likewise, Freedman et al (8) discussed the use of regression
methods to estimate scaling biases aQ and@ in questionnairemeasurements, with corrections for attenuating effects due torandom errors in the reference measurements. As mentionedearlier, the validity of these approaches depends on two crucialassumptions: random errors are independent between questionname and reference measurements, ie, Cov(€R,€¿�Q) 0, andrandom errors are independent between replicate referencemeasurements, ie, Cov(ER,, €¿�RJ)= 0 for i j.
Dow
nloaded from https://academ
ic.oup.com/ajcn/article/65/4/1232S/4655748 by guest on 18 January 2022
l234S KAAKS
COMPARISONS BETWEEN QUESTIONNAIRE ANDBIOCHEMICAL MARKERS
The chief advantage of using biochemical markers of dietaryintake in dietary assessments is that the potential sources ofrandom error occurring with markers are different from thoseof questionnaire measurements of habitual intake; therefore, itis fair to assume that the errors are independent between thetwo measurements. Moreover, the errors are likely to be trulyuncorrelated with those of daily-intake measurements obtainedby weighed-food records or 24-h recalls, provided there is asufficient interval between the collection of biological specimens and the collection of food-consumption records.
“¿�Ideal―markers of diet
A few biochemical markers have a precisely known quantitative relation to absolute daily intake and can thus provide avalid reference of measurement. For instance, for any givenperson, 24-h urinary nitrogen excretion represents an approximately constant proportion of “¿�-80%of the total daily nitrogeningested in the form of protein (10). Another example is themeasurement of energy expenditure with the doubly labeledwater method, which is identical to total daily energy intake ifit is assumed that, on average, subjects are in energy balance
over the study period (I 1).With respect to 24-h urinary nitrogen excretion, it is also
reasonable to assume that errors are uncorrelated betweenreplicate urine samples obtained on randomly chosen days witha sufficient interval between those days, provided an objectivemethod such as the p-aminobenzoic acid check (12) is used toevaluate whether the collection of 24-h samples has not beensystematically less complete for some subjects than for others.Thus, the use of replicate marker measurements (M) will provide sufficient information to estimate the correlation PMTin areproducibility study, which then allows the correlation tObe estimated with full correction for the attenuating effects ofrandom day-to-day variations in the marker itself. Twentyfour—hoururinary nitrogen excretion thus appears to be an idealmarker in that it provides measurements with a known reference scale, while the assumptions Cov(€M, €¿�Q)= 0 andCov(€M,,€¿�Mj)0 may also be approximately valid.
Markers as additional correlates
Unfortunately, few biochemical markers of diet have theideal characteristics of 24-h urinary nitrogen excretion. Manymarkers currently in use are based on blood or tissue concentrations of vitamins, fatty acids, or other compounds in foods.The quantitative relation of these markers to absolute dailyintake may vary substantially between populations; thus, if therelation between intake level and marker is assumed to beapproximately linear, as follows
M = aM + PMT + SM
Unfortunately, for many markers, the observed correlationwith questionnaire measurements of intake is relatively weak,with values < 0.40 [for examples, see Willett (13) and van'tVeer et al (14)1. The weak correlations result from factorsrelated to the absorption, postabsorptive metabolism, or physiologic regulation of nutrient levels, which can be importantsources of random variations in the marker, unrelated to truedietary intake. The effects of these factors may vary systematically in magnitude between subjects, and the random errors(EM) will thus tend to be correlated positively between replicate
blood or tissue samples obtained on different occasions fromthe same person. For example, plasma concentrations of n-carotene depend not only on the intake of f3-carotene itself but alsoon the concomitant intake of fat, which enhances the intestinalabsorption of carotenoids and other fat-soluble compounds.Other factors predictive of carotene concentrations are thedegree of obesity (body mass index), blood concentrations oflow-density-lipoprotein cholesterol, and smoking habits (15).Because these and possibly other factors can differ systematically between subjects, there may be a relatively high covariance between the random errors of replicate marker assessments. The observed correlation between marker andquestionnaire measurements can therefore be interpreted onlyas a lower limit for the true correlation PQT' even if adjustmentsare made for the attenuating effects due to variations in themarker oven time. Consequently, it remains uncertain whethera lack of correlation between questionnaire measurements andmarker is mainly the result of random errors in the first type ofmeasurement, the second, or both.
TRIANGULAR COMPARISONS BETWEENQUESTIONNAIRE, RECORDING METHOD, ANDMARKER
Analysis by structural equations model
The problem of correlated errors between replicate measurements obtained by an identical method can be circumvented bymaking a triangular comparison between the questionnairemeasurements, the reference measurements based on a recording method, and the biochemical marker (2). It must still beassumed, however, that between the three different types ofmeasurements, the random errors €¿�@,5R' and CMare independent, whereas each measurement has a linear relation with trueintake T, as in equations 1, 2, and 4. Under this assumption, astructural equations model approach (16, 17) can then be usedto estimate the model parameters@ a@, aM@aQ, o@, o@,13Q' and f3M. which define the theoretical relations between Q,
M, R, and T. If the distributions of measurements are approximately normal, the estimation can be based on fitting thetheoretical moments (ie, means, variances, and covariances) forthe measurements Q, R, and M (which can be expressed interms of the model parameters to be estimated) to the samplemoments actually observed. In the case of precisely threemeasurements, the number of different moments is equal to thenumber of unknown model parameters. These can therefore beestimated simply by equating the theoretical means and covariance matrix to the means and covariance matrix actually observed and resolving the nine resulting estimating equations[see Kaaks et al (4) for more detail]. The correlations PQT' PRT'and PMTbetween the three types of measurement and the true
(4)
the values of the scaling factors aM and PM are generally notknown beforehand. As a result, markers based on blood ortissue concentrations of specific dietary constituents usuallycannot provide a valid reference scale of measurement but theycan supply evidence for the accuracy of questionnaire measunements only in the form of an additional, linear correlation.
Dow
nloaded from https://academ
ic.oup.com/ajcn/article/65/4/1232S/4655748 by guest on 18 January 2022

CovaniancematrixMeansRQMTheoreticalR
Q
M ,Observedr@+@R
I 1@Q@L @l3@°@
+ ffQ1@Q1@M@J@TPM@+@1
IG@M]I.Lr
@ + 13Q1.LT
aM +PMP@TR
QMro.l49
I 0.073Lo.o7l0.206 0.0640.13(@1
I) J—
R=4.382 4.67M = —¿�0.067
(5)
The validity coefficients for the reference measurement and themarker can be calculated in the same manner, and are estimatedto be equal to PRT 0.74 and PMT 0.69, respectively.
An elementary factor analysis model and the method oftriads
Investigators often may be interested in estimating only thecorrelation PQT of the questionnaire measurements and the trueintake values, without evaluating the magnitude of the systematic scaling biases ct@and@ In such situations, a more directestimation approach can be used. The measurements Q, R, andM are still assumed to be linearly related to a common trueintake factor (IT)' which is now, however, scaled arbitrarily tohave a mean of 0 and a variance of 1. The distributions of Q,R, and M are also standardized—by subtracting the estimated
TABLE 1Theoretical and observed means and covaniance matrices and estimatedstructural equations model parameters for reference (R), questionnaire(Q),andbiochemicalmarker(M) measurementsofvitaminC intake'
1235SBIOCHEMICAL MARKERS IN DIETARY STUDIES
intake levels (ie, the validity coefficients of the three types ofmeasurements) are then calculated from the various estimatedmodel parameters.
An example of the structural equations model approach isgiven in Table 1, which shows the theoretical and observed
covariance matrices for a study of the validity of questionnairemeasurements of vitamin C intake in 57 women. In this investigation, which was conducted during the pilot phase of theEuropean Prospective Investigation into Cancer and Nutrition(EPIC) (1 8), the reference measurements consisted of an average of twelve 24-h recalls obtained at monthly intervals during1 y. The biochemical marker used was the concentration ofvitamin C in serum. The parameters of the structural equationsmodel defined by equations 1—4were estimated with the CALIS procedure of SAS (SAS Institute mc, Cary, NC) (19). Allmeasurements were log-transformed to obtain approximatenormality of their population distributions. The analysisshowed that the questionnaire measurements have some degreeof constant (&Q _ 0.730) and proportional scaling bias (13Q =0.899). From the estimated values for the parameters o-@,o@,and@ the validity coefficient of the questionnaire measurements can be calculated as
PQT \/[1 + 0.141/(0.8992 x 0.081)] = 0.56
population means and dividing by their observed SDs to yieldscore values ZQ, ZR, and ZM, with a mean of 0 and a varianceof 1. This standardization method is equivalent to using thesample correlation matrix of Q, R, and M instead of the originalcovariance matrix (of the nonstandardized measurements) asdata input for a structural equations model. The model can thenbe writtenas:
ZQ A@fT+
ZM AlT + 7@M
ZR A,,fT+ 77R
(6)
(7)
(8)
The intercepts have disappeared from these equations becauseboth the latent intake factonf@ and the observed measurementshave been standardized to have a population mean of 0. Theslope coefficients AQ, AM,and ARin the model are now equal tothe validity coefficients PQT' PMT' and PRT' respectively. Thesquares of the coefficients (A) are also referred to as “¿�communalities― because they indicate the proportion of variation ineach type of measurement that is associated with the latentfactor and therefore with variation in the other two measurements. The variances of the errors (i@)in equations 6-8 are alsocalled the “¿�uniquenesses―of the measurements. For each typeof measurement, the sum of the communality and the uniqueness is by definition equal to I [ie, A2Van(f@) + o-@,= I .0].Therefore, only three independent parameters (eg, AQ, AM, andAR) can be identified in this model [for a more detailed discussion of this basic factor analysis model, see Dunn ( 16) or Fuller
(20)].In practice, AQ, AM,and ARcan be estimated by equating the
theoretical to the observed moments of measurements, exactlyas in the structural equations model approach discussed earlier.The estimating equations obtained are
AQ PQT @rQRrMdrRM
AR PRT = \/rQRrRM/rMQ
£M PMT = \/rMQrRM/rQR
(9)
(10)
(11)
where rQR, rQM, and rMR are the three covariances between thestandardized measurements Q, R, and M (which are identical tothe correlations between the three measurements) observed inthe validity study. The estimating approach based on equations9—11is known as the “¿�methodof triads,―a basic estimatingtechnique in factor and path analysis (17). The method is baseddirectly on the fact that under the given model assumptions,the observed correlations between the measurements can bewritten as products of the measurements' correlations withthe true intake factor f,. (Figure 1). To illustrate the estimation of A, Table 2 shows the theoretical and observed moments for the standardized measurements of vitamin C intake,together with the estimated validity coefficients PQ7' PRT'and PMT Apart from rounding errors, the estimated validitycoefficients are identical to those in Table I , which wereobtained from the structural equations analysis of nonstandardized measurements.
‘¿�Estimated model parameters are as follows: fi7 = 4.38, &@. = 0.08 1,
@R 0.069, aQ = 0.730, 1k) = 0.899, @r;Q 0.141, &M @3.75, PM
0.875, and &@M 0.068. T, true intake.2 Measurements were log-transformed to improve normality of their
distributions.
Dow
nloaded from https://academ
ic.oup.com/ajcn/article/65/4/1232S/4655748 by guest on 18 January 2022

RQMTheoreticalR@—
1.00QI
AQAR1.00MObservedLAMARAMAQ1.00R
QMI L1(X)
rQR=O.42
rRM 0.511.00 rMQ 0.391.00
1236S KAAKS
Q
E[rMQ] PMT PQT
M
E[rQR] PQTPRT
R
T
PMT PRT
E[r,@M] PRTPMTFIGURE 1. Triangularcomparisonbetweenquestionnaire(Q), referencemethod(R), and biochemicalmarker(M)—themethodof triads.The model
assumes that measurements Q, R, and M are linearly related to the true intake T and that their random errors are uncorrelated. The correlations betweenthe measurements can then each be expressed as products of the measurements' correlations with the latent true intake factor, which allows the lattercorrelations to be estimated as
PQT \/rMQrQ,@/rRM
PRT \/rQRrRM/rMQ
PAcT \f@@MdrQR
A potential violation of model assumptions
If all required model assumptions are met (ie, linear interrelations and independence of errors between questionnaire measurements, reference measurements, and biochemical marken), the structural equation model parameters, as well as thevalidity coefficients PQT' PRT' and PMT' should be estimated
TABLE 2Theoretical and observed covariance matrices for reference (R),questionnaire (Q), and biochemical marker (M) measurements of vitaminC intakestandardizedto unit variance,andestimatedcorrelationsPQT'PRT' and PM,@
without bias from the triangular comparison between thethree different types of measurements. On the other hand,biases will occur if one on more model assumptions areviolated. Again, the advantage of using a biochemicalmarker is that random errors occurring with the marker canbe assumed to be independent of those of questionnaire andreference measurements. However, the presence of a positive covaniance between the random errors of questionnairemeasurements and food records on 24-h recalls should not beruled out a priori in all instances. If it is assumed that this isthe only important violation of model assumptions thatcould occur [ie, Cov(€Q, @R) 0], then it can be easily seenthat PQT and PRT will both tend to be overestimated (seeAppendix A). Therefore, these estimates are generally mostsafely interpreted as upper limits of PQT and PRT It is alsoclear that PMT wilIthen be underestimated.
DISCUSSION
Random errors occurring with the use of biochemicalmarkers in studies of the accuracy of dietary assessmentmethods are likely to be truly independent of those of eithera questionnaire or a recording method. In practice, however,the observed correlations between questionnaire measurements and marker are often low. In addition, there may be arelatively high covaniance between the random errors of
, Estimated model parameters are as follows: A@, = @QT= 057. AR =
PRT 0.74, and AM PMT = 0.69. T, true intake.
2 Before standardization. measurements were log-transformed to im
prove normality of their distributions.
Dow
nloaded from https://academ
ic.oup.com/ajcn/article/65/4/1232S/4655748 by guest on 18 January 2022
BIOCHEMICAL MARKERS IN DIETARY STUDIES l237S
replicate marker assessments in the same person, so that thevalidity of the marker itself as a measure of dietary intake
cannot be estimated from its reproducibility. As a result,many markers can be usefully applied in dietary validity
studies only in combination with additional reference mea
surements obtained by weighed-food records or 24-h recalls.In particular, a triangular comparison between questionnairemeasurements, food-consumption records, and biochemicalmarker can be used to estimate the correlations betweeneach type of measurement and the subjects' true habitualintake. This approach avoids the often problematic assumption of independence between the errors of replicate reference measurements obtained by an identical method (recording method or marker) from the same individuals, ie,
random errors are assumed to be independent only betweendifferent types of measurements.
Several computer programs are available for the analysis ofstructural equation models, including the CALlS procedure ofthe SAS package for statistical analysis (19) [for examples ofSAS-CALIS programs used to analyze dietary validity studies,see Kaaks et al (4)], EQS (BMDP Statistical Software Inc, LosAngeles), and LISREL (Scientific Software Inc, Mooresville,IN) (21). Programs such as CALlS, LISREL, and EQS can also
be used to fit a structural equations model to an observedcorrelation matrix—rather than the original covariance matrix—to produce estimates of PQT' PRT' and PMT directly. Toobtain unbiased estimates of model parameters, particularly oftheir SEs, the estimation procedures used by most such programs require all measurements to be normally distributed. A
few computer programs, such as EQS (22), include proceduresto obtain valid estimates of model parameters and their SEswhen the distributions of measurements are not normal. Theestimation can then no longer be based on the equation of thetheoretical to the observed first and second moments of themeasurements only and the program will require the input ofindividual-level data.
When computer programs such as SAS-CALIS, LISREL,or EQS are used to apply a structural model to the observedmeans and covaniance matrix of (nonstandardized) measurements in validity studies, SEs are given for the parameters of
the structural equations model but not for the validity coefficients that can be derived from them. Direct estimates of
the validity coefficients PQT' PRT' and PMT and their SEs canbe obtained only by fitting a structural model to the samplecorrelation matrix. The SEs of the latter estimates are,however, generally incorrect. The reason for this inaccuracyis that the scaling factors used to standardize the variances
of the measurements to I .0 will be assumed implicitly to beknown with absolute precision, although, in reality, thesefactors are stochastic values that must be estimated as the
SDs of the observed measurements. Cudeck (23) showedthat if a structural equations model is applied to a samplecorrelation matrix with use of SE formulas that assume thata covaniance matrix has been analyzed, the values of theestimated SEs will be correct only when applied to parameter estimates from scale-invariant models and only whenthe parameter itself is “¿�scale-free.―Although the structuralequations model defined by equations 1—4can indeed beshown to be scale-invariant, the slope parameters (denotedby /3 in the structural equations model and by A in thecorresponding factor analysis model) are not scale-free.
Lawley and Maxwell (24) showed how to correct the estimated SEs of scale-dependent parameters, when these areestimated, by applying a structural model to a correlationmatrix rather than to a covariance matrix of measurements inthe original scale. Fuller (20) described formulas for a moredirect calculation of CIs for validity coefficients derived fromestimated structural equation model parameters. However,none of these methods are included in the computer programsmentioned above.
A pragmatic approach to obtaining CIs without using complex mathematics or manual calculations is to use a resamplingmethod such as the jackknife or bootstrap method (16, 25).Such techniques do not presume specific knowledge about thesampling distributions of the estimated validity coefficients andmay thus have the advantage of being independent of the formof distribution of the raw measurements (16). The EQS program contains a subroutine for these two resampling methods.Similar routines can be easily programmed in a general computer language or by using the logical operators of a statisticalprogram such as GLIM (26, 27).
A word of caution is needed about a type of complication thancan arise frequently during analysis of the triangular relationsbetween questionnaire measurements, reference measurements,and biochemical marker with use of the type of latent variablemodels described in this paper. In structural equations analysis, itis possible for one on more variance estimates (of random errors onof the true latent intake variable) to be negative; these situationsare usually called Heywood cases (16, 17). In these situations, ifa factor analysis is used and a maximum-likelihood algorithm isused to fit the theoretical to the observed correlation matrix, one ofthe estimated validity coefficients (PQT' PRT'or PMT)will be largerthan 1.0. If the method of triads is used, a numerical solution maynot be possible if one of the three observed correlations (rQR, rRM,on rMQ) is negative (27).
Interestingly, in the triangular comparison between Q, R, andM, the biochemical marker is used only as an additional correlate:the quantitative relation between the marker and daily levels of agiven food or nutrient does not need to be known (4). Thisconsideration leads to the question of the required specificity ofbiochemical markers in dietary validity studies. Validation isfrequently defined as the evaluation of whether an instrumentactually measures what it is intended to (28). This paper hasdefined validation of dietary questionnaire measurements in operational terms and for a univariate measurement error model asthe estimation of the correlation between true and measured intakes (PQT) and of scaling biases. The estimated correlation coefficient shows which part of the variation in the questionnairemeasurements is associated with true between-person differencesin intake of a given food on nutrient (signal) and which part is dueto random error (noise). This univaniate approach does not, howeven, address the question of the extent to which the signalrepresents differences in true intake specifically of the food ornutrient supposedly being measured.
In reality, there are many intencorrelations between thetrue intakes of different foods and nutrients, partly because,depending on body size and physical activity, some peopleconsume more food than do others. Therefore, intakes ofmost dietary constituents (nutrients) usually correlate positively with total energy intake (29). An additional explanation is that even at a fixed energy intake, people adhere todifferent food-consumption patterns, while different nutni
Dow
nloaded from https://academ
ic.oup.com/ajcn/article/65/4/1232S/4655748 by guest on 18 January 2022
1238S KAAKS
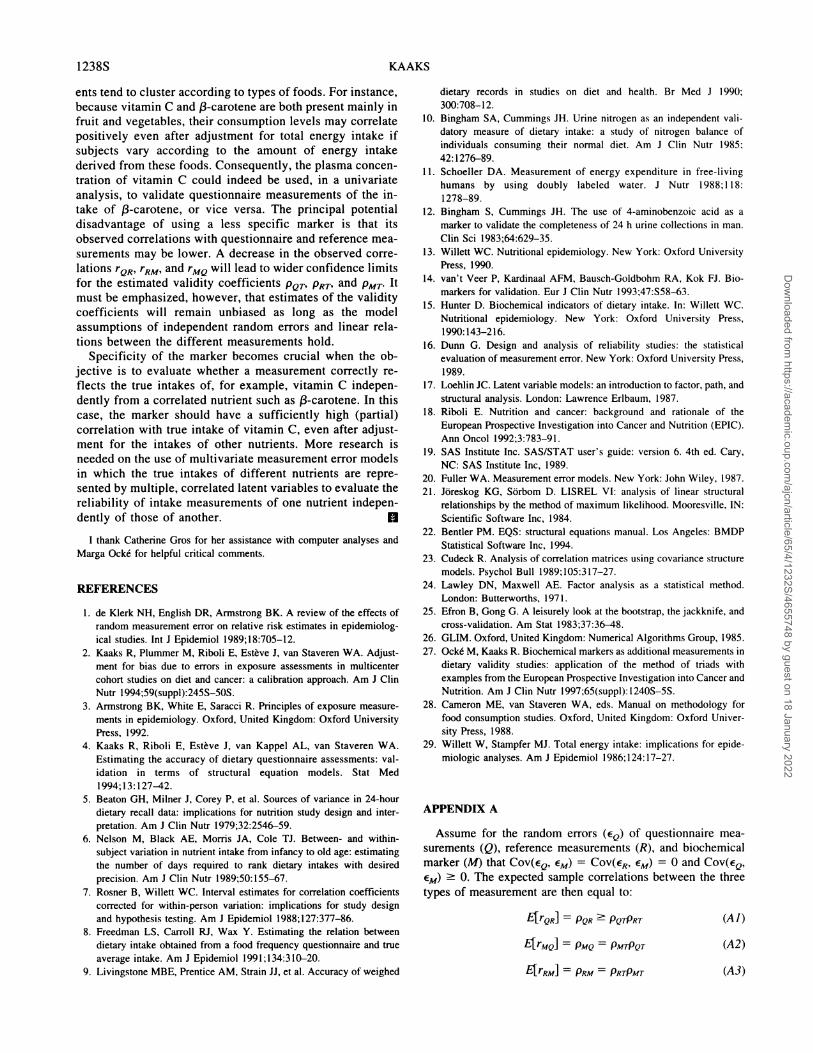
ents tend to cluster according to types of foods. For instance,because vitamin C and /3-carotene are both present mainly infruit and vegetables, their consumption levels may correlatepositively even after adjustment for total energy intake ifsubjects vary according to the amount of energy intakederived from these foods. Consequently, the plasma concentration of vitamin C could indeed be used, in a univariateanalysis, to validate questionnaire measurements of the intake of @3-carotene, or vice versa. The principal potentialdisadvantage of using a less specific marker is that itsobserved correlations with questionnaire and reference measurements may be lower. A decrease in the observed correlations rQR, rRM, and rMQ will lead to wider confidence limitsfor the estimated validity coefficients PQT' PRT' and PMT. Itmust be emphasized, however, that estimates of the validitycoefficients will remain unbiased as long as the modelassumptions of independent random errors and linear relations between the different measurements hold.
Specificity of the marker becomes crucial when the objective is to evaluate whether a measurement correctly reflects the true intakes of, for example, vitamin C independently from a correlated nutrient such as a-carotene. In thiscase, the marker should have a sufficiently high (partial)correlation with true intake of vitamin C, even after adjustment for the intakes of other nutrients. More research isneeded on the use of multivariate measurement error modelsin which the true intakes of different nutrients are represented by multiple, correlated latent variables to evaluate thereliability of intake measurements of one nutrient independently of those of another. N
I thank Catherine Gros for her assistance with computer analyses andMarga Ockéfor helpful critical comments.
REFERENCES
1. de Klerk NH, English DR. Armstrong BK. A review of the effects ofrandom measurement error on relative risk estimates in epidemiological studies. Int J Epidemiol l989;18:705—12.
2. Kaaks R, Plummer M, Riboli E, EstèveJ, van Staveren WA. Adjustment for bias due to errors in exposure assessments in multicentercohort studies on diet and cancer: a calibration approach. Am J ClinNutr 1994;59(suppl):245S—50S.
3. Armstrong BK, White E, Saracci R. Principles of exposure measurements in epidemiology. Oxford, United Kingdom: Oxford UniversityPress,1992.
4. Kaaks R, Riboli E, Estève J, van Kappel AL, van Staveren WA.Estimating the accuracy of dietary questionnaire assessments: validation in terms of structural equation models. Stat Medl994;l3:127—42.
5. Beaton GH, Milner J, Corey P, et al. Sources of variance in 24-hourdietary recall data: implications for nutrition study design and interpretation. Am J Clin Nutr 1979;32:2546—59.
6. Nelson M, Black AE, Morris JA, Cole Ti. Between- and withinsubject variation in nutrient intake from infancy to old age: estimatingthe number of days required to rank dietary intakes with desiredprecision. Am i Clin Nutr 1989;50:155—67.
7. Rosner B, Willett WC. Interval estimates for correlation coefficientscorrected for within-person variation: implications for study designand hypothesis testing. Am J Epidemiol 1988:127:377—86.
8. Freedman LS, Carroll Ri, Wax Y. Estimating the relation betweendietary intake obtained from a food frequency questionnaire and trueaverage intake. Am I Epidemiol 1991:134:310-20.
9. Livingstone MBE, Prentice AM, Strain ii, et al. Accuracy of weighed
dietary records in studies on diet and health. Br Med J 1990:300:708—12.
10. Bingham SA, Cummings iH. Urine nitrogen as an independent validatory measure of dietary intake: a study of nitrogen balance ofindividuals consuming their normal diet. Am J Clin Nutr 1985:42:1276-89.
11. Schoeller DA. Measurement of energy expenditure in free-livinghumans by using doubly labeled water. J Nutr 1988:1 18:1278—89.
12. Bingham 5, Cummings iH. The use of 4-aminobenzoic acid as amarker to validate the completeness of 24 h urine collections in man.Clin Sci 1983;64:629—35.
13. Willett WC. Nutritional epidemiology. New York: Oxford UniversityPress,1990.
14. van't Veer P, Kardinaal AFM, Bausch-Goldbohm RA, Kok Fi. Biomarkers for validation. Eur I Clin Nutr 1993:47:558—63.
15. HunterD. Biochemical indicatorsof dietary intake. In: Willett WC.Nutritional epidemiology. New York: Oxford University Press,1990:143—216.
16. Dunn G. Design and analysis of reliability studies: the statisticalevaluation of measurement error. New York: Oxford University Press,1989.
17. Loehlin JC. Latent variable models: an introduction to factor, path, andstructural analysis. London: Lawrence Erlbaum, 1987.
18. Riboli E. Nutrition and cancer: background and rationale of theEuropean Prospective Investigation into Cancer and Nutrition (EPIC).Ann Oncol 1992;3:783—91.
19. SAS Institute Inc. SAS/STAT user's guide: version 6. 4th ed. Cary,NC: SAS Institute Inc, 1989.
20. Fuller WA. Measurement error models. New York: iohn Wiley, 1987.21. Joreskog KG, Sdrbom D. LISREL VI: analysis of linear structural
relationships by the method of maximum likelihood. Mooresville. IN:Scientific Software Inc, 1984.
22. Bentler PM. EQS: structural equations manual. Los Angeles: BMDPStatistical Software Inc. 1994.
23. Cudeck R. Analysis of correlation matrices using covariance structuremodels. Psychol Bull 1989:105:317—27.
24. Lawley DN, Maxwell AE. Factor analysis as a statistical method.London: Butterworths, 1971.
25. Efron B, Gong G. A leisurely look at the bootstrap, the jackknife, andcross-validation. Am Stat 1983;37:36—48.
26. GLIM. Oxford, United Kingdom: Numerical Algorithms Group, 1985.27. OckéM, Kaaks R. Biochemical markers as additional measurements in
dietary validity studies: application of the method of triads withexamples from the European Prospective Investigation into Cancer andNutrition. Am I Clin Nutr 1997:65(suppl):1240S—5S.
28. Cameron ME, van Staveren WA, eds. Manual on methodology forfood consumption studies. Oxford, United Kingdom: Oxford University Press, 1988.
29. Willett W, Stampfer Mi. Total energy intake: implications for epidemiologic analyses. Am I Epidemiol 1986; 124:17—27.
APPENDIX A
Assume for the random errors (€Q)of questionnaire measurements (Q), reference measurements (R), and biochemicalmarker (M) that Cov(€Q,EM) = Cov(ER, @M)= 0 and Cov(€Q,CM) 0. The expected sample correlations between the three
types of measurement are then equal to:
E[rQR] PQR@ PQTPRT
E[rMQ] PMQ PMTPQT
(Al)
(A2)
E[rRMI PRM= PRTPMT (A3)
Dow
nloaded from https://academ
ic.oup.com/ajcn/article/65/4/1232S/4655748 by guest on 18 January 2022
BIOCHEMICAL MARKERS IN DIETARY STUDIES l239S
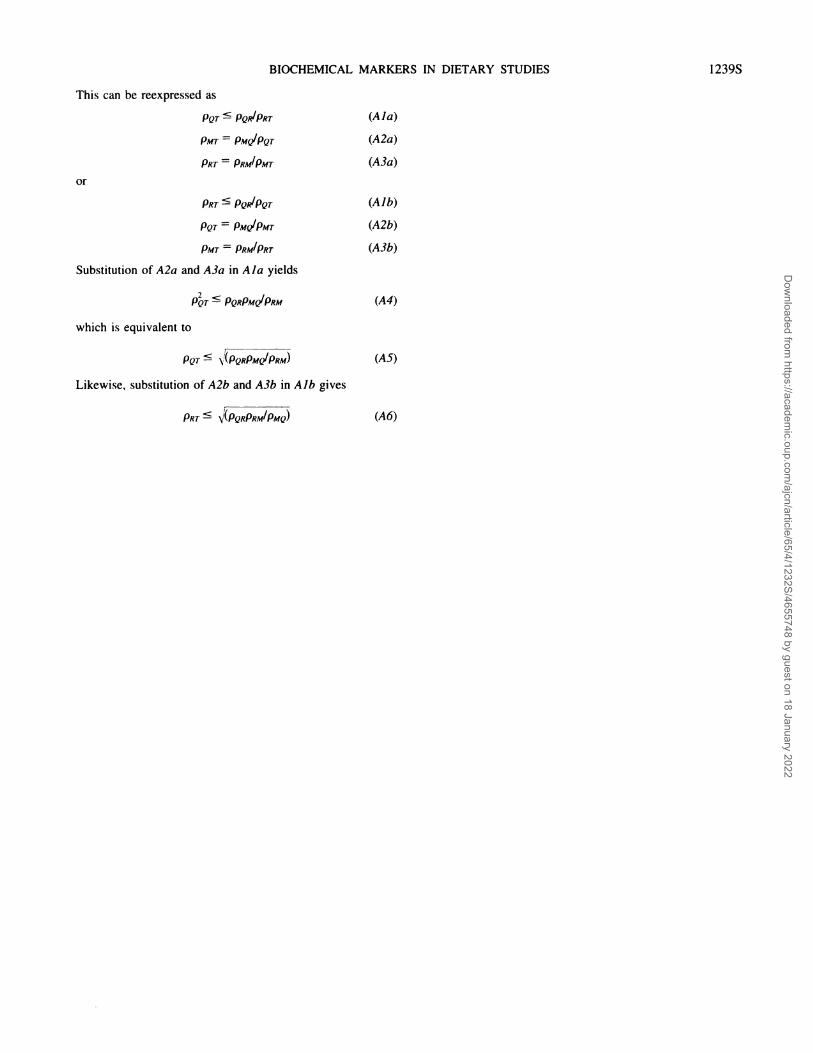
This can be reexpressed as
PQT@ PQR/PRT (Ala)
PMT PMdPQT (A2a)
PRT PRM'PMT (A3a)
or
PRT@ PQR/PQT (Aib)
PQT PMc/PMT (A2b)
PMT PRM'PRT (A3b)
Substitution of A2a and A3a in Ala yields
P@ir@ PQRPMdPRM (A4)
which is equivalent to
PQT@ \!(PQRPMQJPRM) (AS)
Likewise, substitution of A2b and A3b in Aib gives
PRT@ \/(PQRPRM/PMQ) (A6)
Dow
nloaded from https://academ
ic.oup.com/ajcn/article/65/4/1232S/4655748 by guest on 18 January 2022


