Embed Size (px)
Citation preview

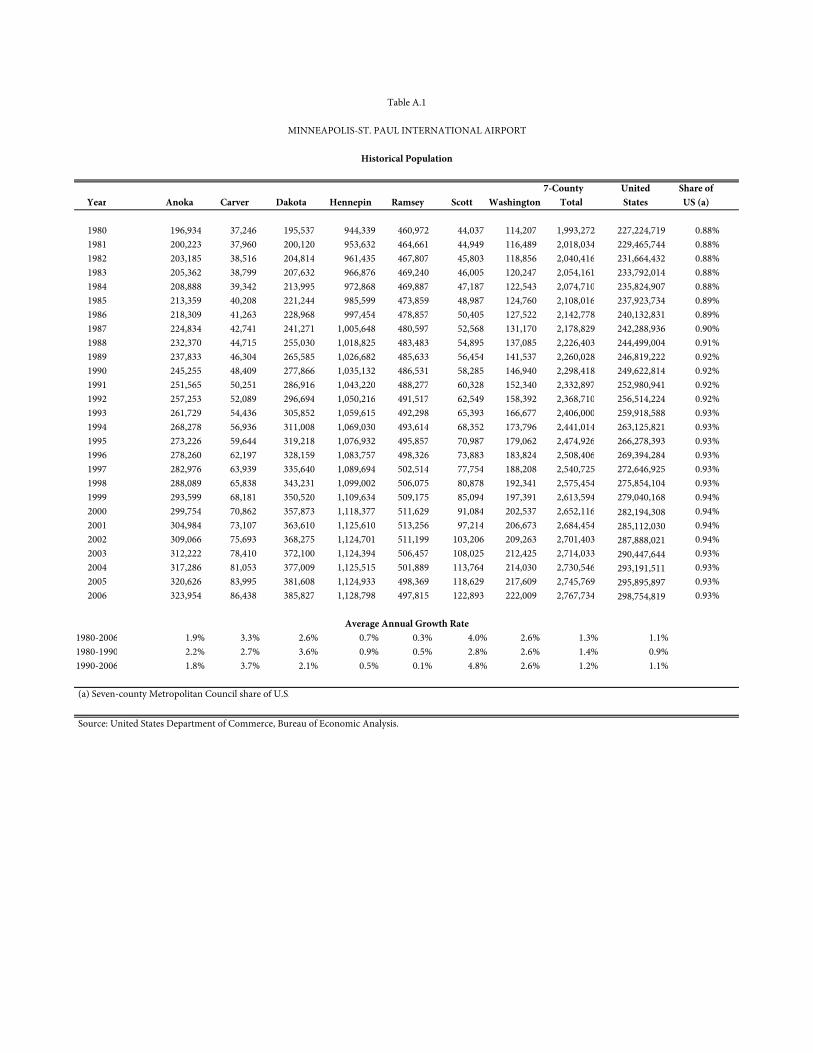
APPENDIX A: ADDITIONAL FORECAST TABLES

7-County United Share ofYear Anoka Carver Dakota Hennepin Ramsey Scott Washington Total States US (a)
1980 196,934 37,246 195,537 944,339 460,972 44,037 114,207 1,993,272 227,224,719 0.88%1981 200,223 37,960 200,120 953,632 464,661 44,949 116,489 2,018,034 229,465,744 0.88%1982 203,185 38,516 204,814 961,435 467,807 45,803 118,856 2,040,416 231,664,432 0.88%1983 205,362 38,799 207,632 966,876 469,240 46,005 120,247 2,054,161 233,792,014 0.88%1984 208,888 39,342 213,995 972,868 469,887 47,187 122,543 2,074,710 235,824,907 0.88%1985 213,359 40,208 221,244 985,599 473,859 48,987 124,760 2,108,016 237,923,734 0.89%1986 218,309 41,263 228,968 997,454 478,857 50,405 127,522 2,142,778 240,132,831 0.89%1987 224,834 42,741 241,271 1,005,648 480,597 52,568 131,170 2,178,829 242,288,936 0.90%1988 232,370 44,715 255,030 1,018,825 483,483 54,895 137,085 2,226,403 244,499,004 0.91%1989 237,833 46,304 265,585 1,026,682 485,633 56,454 141,537 2,260,028 246,819,222 0.92%1990 245,255 48,409 277,866 1,035,132 486,531 58,285 146,940 2,298,418 249,622,814 0.92%1991 251,565 50,251 286,916 1,043,220 488,277 60,328 152,340 2,332,897 252,980,941 0.92%1992 257,253 52,089 296,694 1,050,216 491,517 62,549 158,392 2,368,710 256,514,224 0.92%1993 261,729 54,436 305,852 1,059,615 492,298 65,393 166,677 2,406,000 259,918,588 0.93%1994 268,278 56,936 311,008 1,069,030 493,614 68,352 173,796 2,441,014 263,125,821 0.93%1995 273,226 59,644 319,218 1,076,932 495,857 70,987 179,062 2,474,926 266,278,393 0.93%1996 278,260 62,197 328,159 1,083,757 498,326 73,883 183,824 2,508,406 269,394,284 0.93%1997 282,976 63,939 335,640 1,089,694 502,514 77,754 188,208 2,540,725 272,646,925 0.93%1998 288,089 65,838 343,231 1,099,002 506,075 80,878 192,341 2,575,454 275,854,104 0.93%1999 293,599 68,181 350,520 1,109,634 509,175 85,094 197,391 2,613,594 279,040,168 0.94%2000 299,754 70,862 357,873 1,118,377 511,629 91,084 202,537 2,652,116 282,194,308 0.94%2001 304,984 73,107 363,610 1,125,610 513,256 97,214 206,673 2,684,454 285,112,030 0.94%2002 309,066 75,693 368,275 1,124,701 511,199 103,206 209,263 2,701,403 287,888,021 0.94%2003 312,222 78,410 372,100 1,124,394 506,457 108,025 212,425 2,714,033 290,447,644 0.93%2004 317,286 81,053 377,009 1,125,515 501,889 113,764 214,030 2,730,546 293,191,511 0.93%2005 320,626 83,995 381,608 1,124,933 498,369 118,629 217,609 2,745,769 295,895,897 0.93%2006 323,954 86,438 385,827 1,128,798 497,815 122,893 222,009 2,767,734 298,754,819 0.93%
1980-2006 1.9% 3.3% 2.6% 0.7% 0.3% 4.0% 2.6% 1.3% 1.1%1980-1990 2.2% 2.7% 3.6% 0.9% 0.5% 2.8% 2.6% 1.4% 0.9%1990-2006 1.8% 3.7% 2.1% 0.5% 0.1% 4.8% 2.6% 1.2% 1.1%
(a) Seven-county Metropolitan Council share of U.S.
Source: United States Department of Commerce, Bureau of Economic Analysis.
Table A.1
MINNEAPOLIS-ST. PAUL INTERNATIONAL AIRPORT
Historical Population
Average Annual Growth Rate
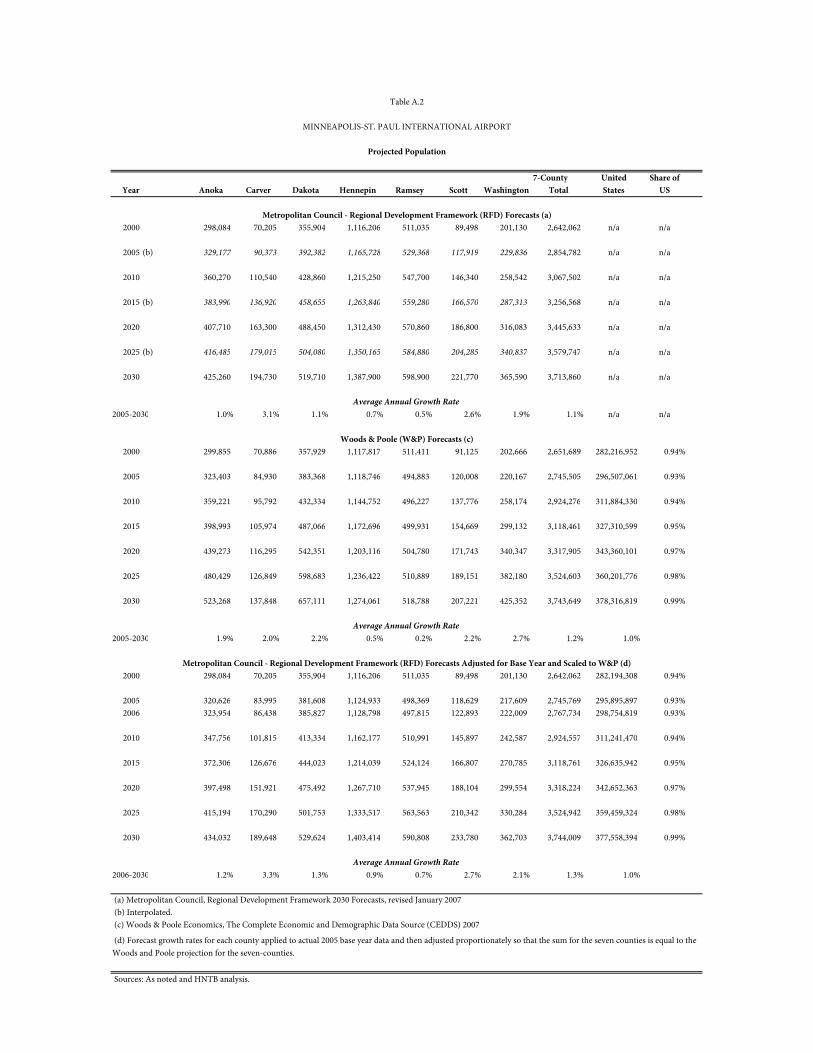
7-County United Share ofYear Anoka Carver Dakota Hennepin Ramsey Scott Washington Total States US
2000 298,084 70,205 355,904 1,116,206 511,035 89,498 201,130 2,642,062 n/a n/a
2005 (b) 329,177 90,373 392,382 1,165,728 529,368 117,919 229,836 2,854,782 n/a n/a
2010 360,270 110,540 428,860 1,215,250 547,700 146,340 258,542 3,067,502 n/a n/a
2015 (b) 383,990 136,920 458,655 1,263,840 559,280 166,570 287,313 3,256,568 n/a n/a
2020 407,710 163,300 488,450 1,312,430 570,860 186,800 316,083 3,445,633 n/a n/a
2025 (b) 416,485 179,015 504,080 1,350,165 584,880 204,285 340,837 3,579,747 n/a n/a
2030 425,260 194,730 519,710 1,387,900 598,900 221,770 365,590 3,713,860 n/a n/a
2005-2030 1.0% 3.1% 1.1% 0.7% 0.5% 2.6% 1.9% 1.1% n/a n/a
2000 299,855 70,886 357,929 1,117,817 511,411 91,125 202,666 2,651,689 282,216,952 0.94%
2005 323,403 84,930 383,368 1,118,746 494,883 120,008 220,167 2,745,505 296,507,061 0.93%
2010 359,221 95,792 432,334 1,144,752 496,227 137,776 258,174 2,924,276 311,884,330 0.94%
2015 398,993 105,974 487,066 1,172,696 499,931 154,669 299,132 3,118,461 327,310,599 0.95%
2020 439,273 116,295 542,351 1,203,116 504,780 171,743 340,347 3,317,905 343,360,101 0.97%
2025 480,429 126,849 598,683 1,236,422 510,889 189,151 382,180 3,524,603 360,201,776 0.98%
2030 523,268 137,848 657,111 1,274,061 518,788 207,221 425,352 3,743,649 378,316,819 0.99%
2005-2030 1.9% 2.0% 2.2% 0.5% 0.2% 2.2% 2.7% 1.2% 1.0%
2000 298,084 70,205 355,904 1,116,206 511,035 89,498 201,130 2,642,062 282,194,308 0.94%
2005 320,626 83,995 381,608 1,124,933 498,369 118,629 217,609 2,745,769 295,895,897 0.93%2006 323,954 86,438 385,827 1,128,798 497,815 122,893 222,009 2,767,734 298,754,819 0.93%
2010 347,756 101,815 413,334 1,162,177 510,991 145,897 242,587 2,924,557 311,241,470 0.94%
2015 372,306 126,676 444,023 1,214,039 524,124 166,807 270,785 3,118,761 326,635,942 0.95%
2020 397,498 151,921 475,492 1,267,710 537,945 188,104 299,554 3,318,224 342,652,363 0.97%
2025 415,194 170,290 501,753 1,333,517 563,563 210,342 330,284 3,524,942 359,459,324 0.98%
2030 434,032 189,648 529,624 1,403,414 590,808 233,780 362,703 3,744,009 377,558,394 0.99%
2006-2030 1.2% 3.3% 1.3% 0.9% 0.7% 2.7% 2.1% 1.3% 1.0%
(a) Metropolitan Council, Regional Development Framework 2030 Forecasts, revised January 2007 (b) Interpolated. (c) Woods & Poole Economics, The Complete Economic and Demographic Data Source (CEDDS) 2007
Sources: As noted and HNTB analysis.
Table A.2
MINNEAPOLIS-ST. PAUL INTERNATIONAL AIRPORT
Projected Population
Average Annual Growth Rate
Metropolitan Council - Regional Development Framework (RFD) Forecasts (a)
Woods & Poole (W&P) Forecasts (c)
Average Annual Growth Rate
Metropolitan Council - Regional Development Framework (RFD) Forecasts Adjusted for Base Year and Scaled to W&P (d)
Average Annual Growth Rate
(d) Forecast growth rates for each county applied to actual 2005 base year data and then adjusted proportionately so that the sum for the seven counties is equal to the Woods and Poole projection for the seven-counties.
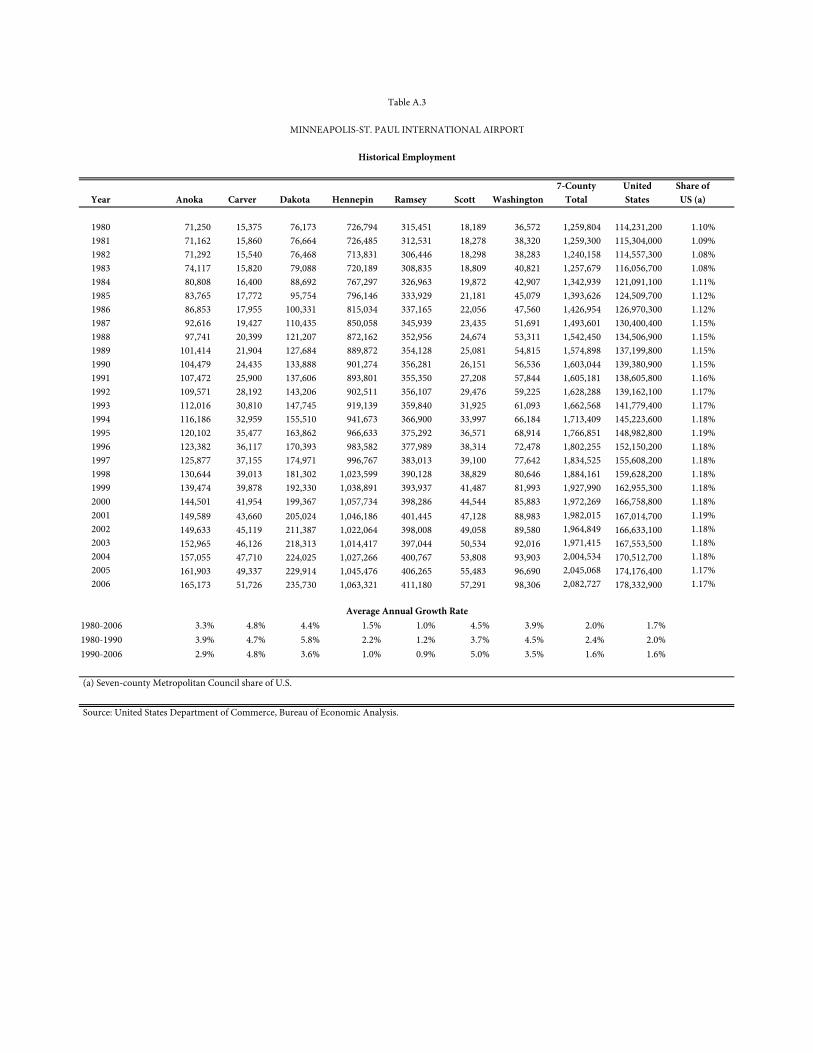
7-County United Share ofYear Anoka Carver Dakota Hennepin Ramsey Scott Washington Total States US (a)
1980 71,250 15,375 76,173 726,794 315,451 18,189 36,572 1,259,804 114,231,200 1.10%1981 71,162 15,860 76,664 726,485 312,531 18,278 38,320 1,259,300 115,304,000 1.09%1982 71,292 15,540 76,468 713,831 306,446 18,298 38,283 1,240,158 114,557,300 1.08%1983 74,117 15,820 79,088 720,189 308,835 18,809 40,821 1,257,679 116,056,700 1.08%1984 80,808 16,400 88,692 767,297 326,963 19,872 42,907 1,342,939 121,091,100 1.11%1985 83,765 17,772 95,754 796,146 333,929 21,181 45,079 1,393,626 124,509,700 1.12%1986 86,853 17,955 100,331 815,034 337,165 22,056 47,560 1,426,954 126,970,300 1.12%1987 92,616 19,427 110,435 850,058 345,939 23,435 51,691 1,493,601 130,400,400 1.15%1988 97,741 20,399 121,207 872,162 352,956 24,674 53,311 1,542,450 134,506,900 1.15%1989 101,414 21,904 127,684 889,872 354,128 25,081 54,815 1,574,898 137,199,800 1.15%1990 104,479 24,435 133,888 901,274 356,281 26,151 56,536 1,603,044 139,380,900 1.15%1991 107,472 25,900 137,606 893,801 355,350 27,208 57,844 1,605,181 138,605,800 1.16%1992 109,571 28,192 143,206 902,511 356,107 29,476 59,225 1,628,288 139,162,100 1.17%1993 112,016 30,810 147,745 919,139 359,840 31,925 61,093 1,662,568 141,779,400 1.17%1994 116,186 32,959 155,510 941,673 366,900 33,997 66,184 1,713,409 145,223,600 1.18%1995 120,102 35,477 163,862 966,633 375,292 36,571 68,914 1,766,851 148,982,800 1.19%1996 123,382 36,117 170,393 983,582 377,989 38,314 72,478 1,802,255 152,150,200 1.18%1997 125,877 37,155 174,971 996,767 383,013 39,100 77,642 1,834,525 155,608,200 1.18%1998 130,644 39,013 181,302 1,023,599 390,128 38,829 80,646 1,884,161 159,628,200 1.18%1999 139,474 39,878 192,330 1,038,891 393,937 41,487 81,993 1,927,990 162,955,300 1.18%2000 144,501 41,954 199,367 1,057,734 398,286 44,544 85,883 1,972,269 166,758,800 1.18%2001 149,589 43,660 205,024 1,046,186 401,445 47,128 88,983 1,982,015 167,014,700 1.19%2002 149,633 45,119 211,387 1,022,064 398,008 49,058 89,580 1,964,849 166,633,100 1.18%2003 152,965 46,126 218,313 1,014,417 397,044 50,534 92,016 1,971,415 167,553,500 1.18%2004 157,055 47,710 224,025 1,027,266 400,767 53,808 93,903 2,004,534 170,512,700 1.18%2005 161,903 49,337 229,914 1,045,476 406,265 55,483 96,690 2,045,068 174,176,400 1.17%2006 165,173 51,726 235,730 1,063,321 411,180 57,291 98,306 2,082,727 178,332,900 1.17%
1980-2006 3.3% 4.8% 4.4% 1.5% 1.0% 4.5% 3.9% 2.0% 1.7%1980-1990 3.9% 4.7% 5.8% 2.2% 1.2% 3.7% 4.5% 2.4% 2.0%1990-2006 2.9% 4.8% 3.6% 1.0% 0.9% 5.0% 3.5% 1.6% 1.6%
(a) Seven-county Metropolitan Council share of U.S.
Source: United States Department of Commerce, Bureau of Economic Analysis.
Table A.3
MINNEAPOLIS-ST. PAUL INTERNATIONAL AIRPORT
Historical Employment
Average Annual Growth Rate
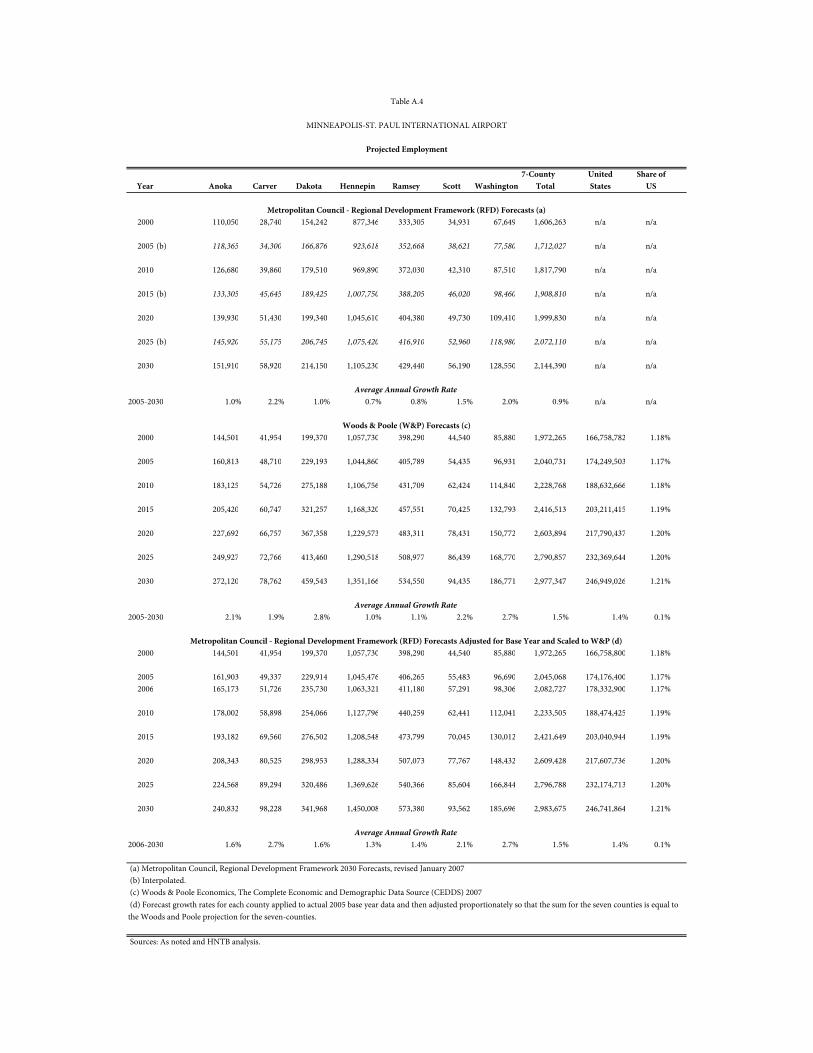
7-County United Share ofYear Anoka Carver Dakota Hennepin Ramsey Scott Washington Total States US
2000 110,050 28,740 154,242 877,346 333,305 34,931 67,649 1,606,263 n/a n/a
2005 (b) 118,365 34,300 166,876 923,618 352,668 38,621 77,580 1,712,027 n/a n/a
2010 126,680 39,860 179,510 969,890 372,030 42,310 87,510 1,817,790 n/a n/a
2015 (b) 133,305 45,645 189,425 1,007,750 388,205 46,020 98,460 1,908,810 n/a n/a
2020 139,930 51,430 199,340 1,045,610 404,380 49,730 109,410 1,999,830 n/a n/a
2025 (b) 145,920 55,175 206,745 1,075,420 416,910 52,960 118,980 2,072,110 n/a n/a
2030 151,910 58,920 214,150 1,105,230 429,440 56,190 128,550 2,144,390 n/a n/a
2005-2030 1.0% 2.2% 1.0% 0.7% 0.8% 1.5% 2.0% 0.9% n/a n/a
2000 144,501 41,954 199,370 1,057,730 398,290 44,540 85,880 1,972,265 166,758,782 1.18%
2005 160,813 48,710 229,193 1,044,860 405,789 54,435 96,931 2,040,731 174,249,503 1.17%
2010 183,125 54,726 275,188 1,106,756 431,709 62,424 114,840 2,228,768 188,632,666 1.18%
2015 205,420 60,747 321,257 1,168,320 457,551 70,425 132,793 2,416,513 203,211,415 1.19%
2020 227,692 66,757 367,358 1,229,573 483,311 78,431 150,772 2,603,894 217,790,437 1.20%
2025 249,927 72,766 413,460 1,290,518 508,977 86,439 168,770 2,790,857 232,369,644 1.20%
2030 272,120 78,762 459,543 1,351,166 534,550 94,435 186,771 2,977,347 246,949,026 1.21%
2005-2030 2.1% 1.9% 2.8% 1.0% 1.1% 2.2% 2.7% 1.5% 1.4% 0.1%
2000 144,501 41,954 199,370 1,057,730 398,290 44,540 85,880 1,972,265 166,758,800 1.18%
2005 161,903 49,337 229,914 1,045,476 406,265 55,483 96,690 2,045,068 174,176,400 1.17%2006 165,173 51,726 235,730 1,063,321 411,180 57,291 98,306 2,082,727 178,332,900 1.17%
2010 178,002 58,898 254,066 1,127,796 440,259 62,441 112,041 2,233,505 188,474,425 1.19%
2015 193,182 69,560 276,502 1,208,548 473,799 70,045 130,012 2,421,649 203,040,944 1.19%
2020 208,343 80,525 298,953 1,288,334 507,073 77,767 148,432 2,609,428 217,607,736 1.20%
2025 224,568 89,294 320,486 1,369,626 540,366 85,604 166,844 2,796,788 232,174,713 1.20%
2030 240,832 98,228 341,968 1,450,008 573,380 93,562 185,696 2,983,675 246,741,864 1.21%
2006-2030 1.6% 2.7% 1.6% 1.3% 1.4% 2.1% 2.7% 1.5% 1.4% 0.1%
(a) Metropolitan Council, Regional Development Framework 2030 Forecasts, revised January 2007. (b) Interpolated. (c) Woods & Poole Economics, The Complete Economic and Demographic Data Source (CEDDS) 2007
Sources: As noted and HNTB analysis.
Table A.4
MINNEAPOLIS-ST. PAUL INTERNATIONAL AIRPORT
Projected Employment
Average Annual Growth Rate
Metropolitan Council - Regional Development Framework (RFD) Forecasts (a)
Woods & Poole (W&P) Forecasts (c)
Average Annual Growth Rate
Metropolitan Council - Regional Development Framework (RFD) Forecasts Adjusted for Base Year and Scaled to W&P (d)
Average Annual Growth Rate
(d) Forecast growth rates for each county applied to actual 2005 base year data and then adjusted proportionately so that the sum for the seven counties is equal to the Woods and Poole projection for the seven-counties.
7-County United Share ofYear Anoka Carver Dakota Hennepin Ramsey Scott Washington Total States US (a)
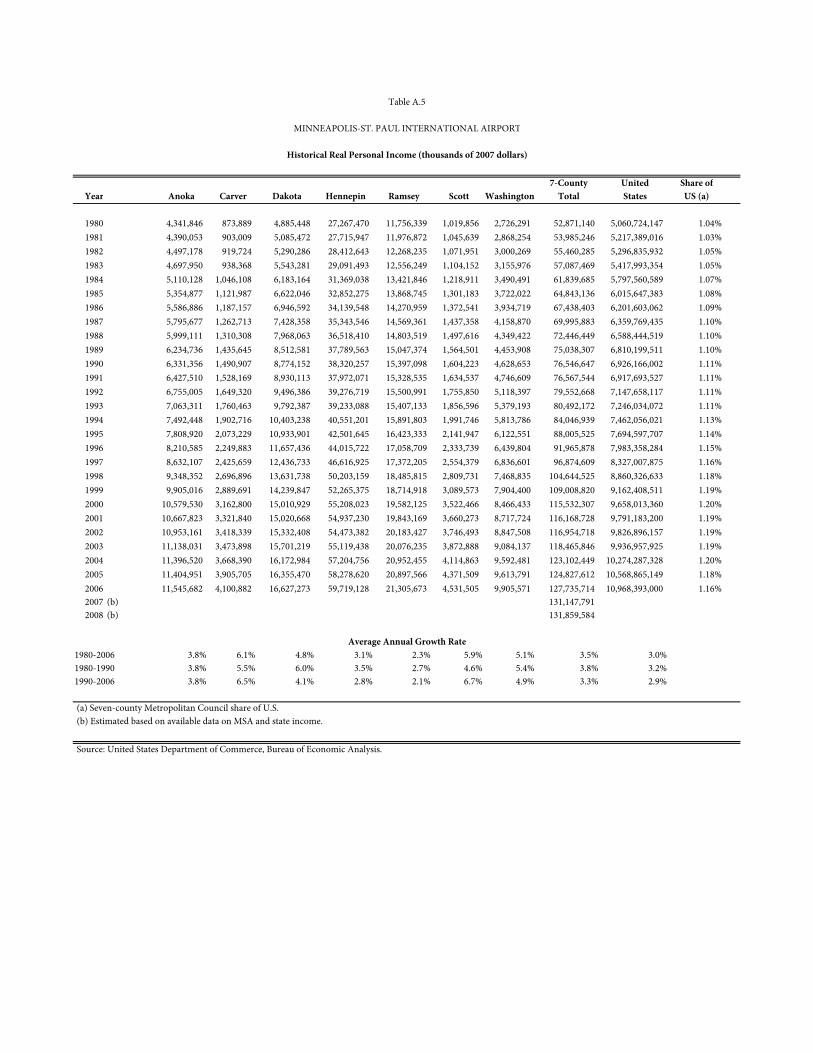
1980 4,341,846 873,889 4,885,448 27,267,470 11,756,339 1,019,856 2,726,291 52,871,140 5,060,724,147 1.04%1981 4,390,053 903,009 5,085,472 27,715,947 11,976,872 1,045,639 2,868,254 53,985,246 5,217,389,016 1.03%1982 4,497,178 919,724 5,290,286 28,412,643 12,268,235 1,071,951 3,000,269 55,460,285 5,296,835,932 1.05%1983 4,697,950 938,368 5,543,281 29,091,493 12,556,249 1,104,152 3,155,976 57,087,469 5,417,993,354 1.05%1984 5,110,128 1,046,108 6,183,164 31,369,038 13,421,846 1,218,911 3,490,491 61,839,685 5,797,560,589 1.07%1985 5,354,877 1,121,987 6,622,046 32,852,275 13,868,745 1,301,183 3,722,022 64,843,136 6,015,647,383 1.08%1986 5,586,886 1,187,157 6,946,592 34,139,548 14,270,959 1,372,541 3,934,719 67,438,403 6,201,603,062 1.09%1987 5,795,677 1,262,713 7,428,358 35,343,546 14,569,361 1,437,358 4,158,870 69,995,883 6,359,769,435 1.10%1988 5,999,111 1,310,308 7,968,063 36,518,410 14,803,519 1,497,616 4,349,422 72,446,449 6,588,444,519 1.10%1989 6,234,736 1,435,645 8,512,581 37,789,563 15,047,374 1,564,501 4,453,908 75,038,307 6,810,199,511 1.10%1990 6,331,356 1,490,907 8,774,152 38,320,257 15,397,098 1,604,223 4,628,653 76,546,647 6,926,166,002 1.11%1991 6,427,510 1,528,169 8,930,113 37,972,071 15,328,535 1,634,537 4,746,609 76,567,544 6,917,693,527 1.11%1992 6,755,005 1,649,320 9,496,386 39,276,719 15,500,991 1,755,850 5,118,397 79,552,668 7,147,658,117 1.11%1993 7,063,311 1,760,463 9,792,387 39,233,088 15,407,133 1,856,596 5,379,193 80,492,172 7,246,034,072 1.11%1994 7,492,448 1,902,716 10,403,238 40,551,201 15,891,803 1,991,746 5,813,786 84,046,939 7,462,056,021 1.13%1995 7,808,920 2,073,229 10,933,901 42,501,645 16,423,333 2,141,947 6,122,551 88,005,525 7,694,597,707 1.14%1996 8,210,585 2,249,883 11,657,436 44,015,722 17,058,709 2,333,739 6,439,804 91,965,878 7,983,358,284 1.15%1997 8,632,107 2,425,659 12,436,733 46,616,925 17,372,205 2,554,379 6,836,601 96,874,609 8,327,007,875 1.16%1998 9,348,352 2,696,896 13,631,738 50,203,159 18,485,815 2,809,731 7,468,835 104,644,525 8,860,326,633 1.18%1999 9,905,016 2,889,691 14,239,847 52,265,375 18,714,918 3,089,573 7,904,400 109,008,820 9,162,408,511 1.19%2000 10,579,530 3,162,800 15,010,929 55,208,023 19,582,125 3,522,466 8,466,433 115,532,307 9,658,013,360 1.20%2001 10,667,823 3,321,840 15,020,668 54,937,230 19,843,169 3,660,273 8,717,724 116,168,728 9,791,183,200 1.19%2002 10,953,161 3,418,339 15,332,408 54,473,382 20,183,427 3,746,493 8,847,508 116,954,718 9,826,896,157 1.19%2003 11,138,031 3,473,898 15,701,219 55,119,438 20,076,235 3,872,888 9,084,137 118,465,846 9,936,957,925 1.19%2004 11,396,520 3,668,390 16,172,984 57,204,756 20,952,455 4,114,863 9,592,481 123,102,449 10,274,287,328 1.20%2005 11,404,951 3,905,705 16,355,470 58,278,620 20,897,566 4,371,509 9,613,791 124,827,612 10,568,865,149 1.18%2006 11,545,682 4,100,882 16,627,273 59,719,128 21,305,673 4,531,505 9,905,571 127,735,714 10,968,393,000 1.16%2007 (b) 131,147,791 2008 (b) 131,859,584
1980-2006 3.8% 6.1% 4.8% 3.1% 2.3% 5.9% 5.1% 3.5% 3.0%1980-1990 3.8% 5.5% 6.0% 3.5% 2.7% 4.6% 5.4% 3.8% 3.2%1990-2006 3.8% 6.5% 4.1% 2.8% 2.1% 6.7% 4.9% 3.3% 2.9%
(a) Seven-county Metropolitan Council share of U.S. (b) Estimated based on available data on MSA and state income.
Source: United States Department of Commerce, Bureau of Economic Analysis.
Table A.5
MINNEAPOLIS-ST. PAUL INTERNATIONAL AIRPORT
Historical Real Personal Income (thousands of 2007 dollars)
Average Annual Growth Rate
7-County United Share ofYear Anoka Carver Dakota Hennepin Ramsey Scott Washington Total States US (a)
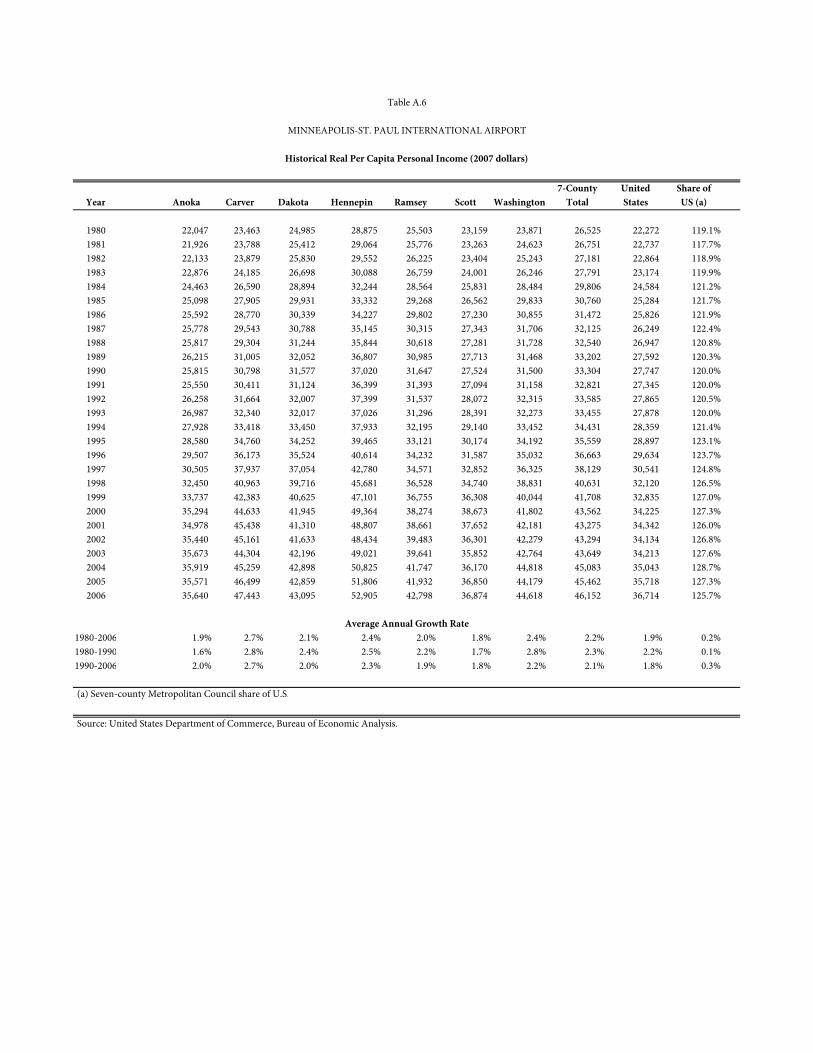
1980 22,047 23,463 24,985 28,875 25,503 23,159 23,871 26,525 22,272 119.1%1981 21,926 23,788 25,412 29,064 25,776 23,263 24,623 26,751 22,737 117.7%1982 22,133 23,879 25,830 29,552 26,225 23,404 25,243 27,181 22,864 118.9%1983 22,876 24,185 26,698 30,088 26,759 24,001 26,246 27,791 23,174 119.9%1984 24,463 26,590 28,894 32,244 28,564 25,831 28,484 29,806 24,584 121.2%1985 25,098 27,905 29,931 33,332 29,268 26,562 29,833 30,760 25,284 121.7%1986 25,592 28,770 30,339 34,227 29,802 27,230 30,855 31,472 25,826 121.9%1987 25,778 29,543 30,788 35,145 30,315 27,343 31,706 32,125 26,249 122.4%1988 25,817 29,304 31,244 35,844 30,618 27,281 31,728 32,540 26,947 120.8%1989 26,215 31,005 32,052 36,807 30,985 27,713 31,468 33,202 27,592 120.3%1990 25,815 30,798 31,577 37,020 31,647 27,524 31,500 33,304 27,747 120.0%1991 25,550 30,411 31,124 36,399 31,393 27,094 31,158 32,821 27,345 120.0%1992 26,258 31,664 32,007 37,399 31,537 28,072 32,315 33,585 27,865 120.5%1993 26,987 32,340 32,017 37,026 31,296 28,391 32,273 33,455 27,878 120.0%1994 27,928 33,418 33,450 37,933 32,195 29,140 33,452 34,431 28,359 121.4%1995 28,580 34,760 34,252 39,465 33,121 30,174 34,192 35,559 28,897 123.1%1996 29,507 36,173 35,524 40,614 34,232 31,587 35,032 36,663 29,634 123.7%1997 30,505 37,937 37,054 42,780 34,571 32,852 36,325 38,129 30,541 124.8%1998 32,450 40,963 39,716 45,681 36,528 34,740 38,831 40,631 32,120 126.5%1999 33,737 42,383 40,625 47,101 36,755 36,308 40,044 41,708 32,835 127.0%2000 35,294 44,633 41,945 49,364 38,274 38,673 41,802 43,562 34,225 127.3%2001 34,978 45,438 41,310 48,807 38,661 37,652 42,181 43,275 34,342 126.0%2002 35,440 45,161 41,633 48,434 39,483 36,301 42,279 43,294 34,134 126.8%2003 35,673 44,304 42,196 49,021 39,641 35,852 42,764 43,649 34,213 127.6%2004 35,919 45,259 42,898 50,825 41,747 36,170 44,818 45,083 35,043 128.7%2005 35,571 46,499 42,859 51,806 41,932 36,850 44,179 45,462 35,718 127.3%2006 35,640 47,443 43,095 52,905 42,798 36,874 44,618 46,152 36,714 125.7%
1980-2006 1.9% 2.7% 2.1% 2.4% 2.0% 1.8% 2.4% 2.2% 1.9% 0.2%1980-1990 1.6% 2.8% 2.4% 2.5% 2.2% 1.7% 2.8% 2.3% 2.2% 0.1%1990-2006 2.0% 2.7% 2.0% 2.3% 1.9% 1.8% 2.2% 2.1% 1.8% 0.3%
(a) Seven-county Metropolitan Council share of U.S.
Source: United States Department of Commerce, Bureau of Economic Analysis.
Table A.6
MINNEAPOLIS-ST. PAUL INTERNATIONAL AIRPORT
Historical Real Per Capita Personal Income (2007 dollars)
Average Annual Growth Rate
7-County United Share ofYear Anoka Carver Dakota Hennepin Ramsey Scott Washington Total States US
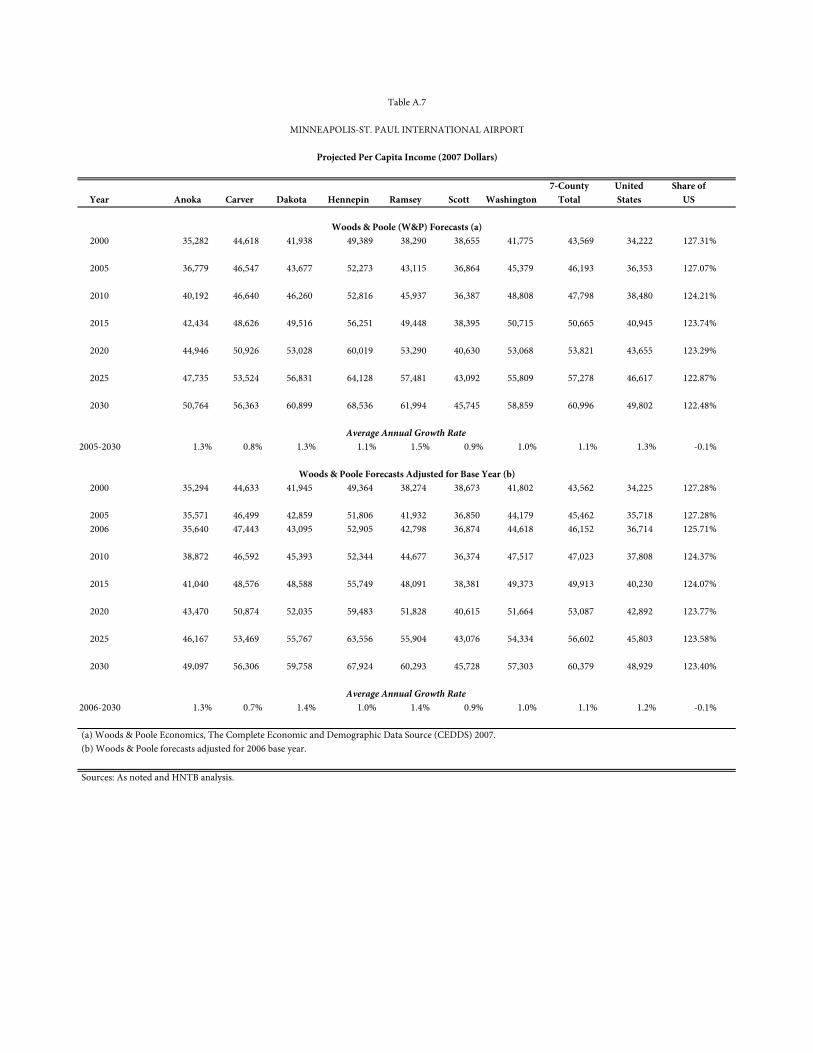
2000 35,282 44,618 41,938 49,389 38,290 38,655 41,775 43,569 34,222 127.31%
2005 36,779 46,547 43,677 52,273 43,115 36,864 45,379 46,193 36,353 127.07%
2010 40,192 46,640 46,260 52,816 45,937 36,387 48,808 47,798 38,480 124.21%
2015 42,434 48,626 49,516 56,251 49,448 38,395 50,715 50,665 40,945 123.74%
2020 44,946 50,926 53,028 60,019 53,290 40,630 53,068 53,821 43,655 123.29%
2025 47,735 53,524 56,831 64,128 57,481 43,092 55,809 57,278 46,617 122.87%
2030 50,764 56,363 60,899 68,536 61,994 45,745 58,859 60,996 49,802 122.48%
2005-2030 1.3% 0.8% 1.3% 1.1% 1.5% 0.9% 1.0% 1.1% 1.3% -0.1%
2000 35,294 44,633 41,945 49,364 38,274 38,673 41,802 43,562 34,225 127.28%
2005 35,571 46,499 42,859 51,806 41,932 36,850 44,179 45,462 35,718 127.28%2006 35,640 47,443 43,095 52,905 42,798 36,874 44,618 46,152 36,714 125.71%
2010 38,872 46,592 45,393 52,344 44,677 36,374 47,517 47,023 37,808 124.37%
2015 41,040 48,576 48,588 55,749 48,091 38,381 49,373 49,913 40,230 124.07%
2020 43,470 50,874 52,035 59,483 51,828 40,615 51,664 53,087 42,892 123.77%
2025 46,167 53,469 55,767 63,556 55,904 43,076 54,334 56,602 45,803 123.58%
2030 49,097 56,306 59,758 67,924 60,293 45,728 57,303 60,379 48,929 123.40%
2006-2030 1.3% 0.7% 1.4% 1.0% 1.4% 0.9% 1.0% 1.1% 1.2% -0.1%
(a) Woods & Poole Economics, The Complete Economic and Demographic Data Source (CEDDS) 2007.
Sources: As noted and HNTB analysis.
(b) Woods & Poole forecasts adjusted for 2006 base year.
Woods & Poole Forecasts Adjusted for Base Year (b)
Average Annual Growth Rate
Table A.7
MINNEAPOLIS-ST. PAUL INTERNATIONAL AIRPORT
Projected Per Capita Income (2007 Dollars)
Average Annual Growth Rate
Woods & Poole (W&P) Forecasts (a)
7-County United Share ofYear Anoka Carver Dakota Hennepin Ramsey Scott Washington Total States US
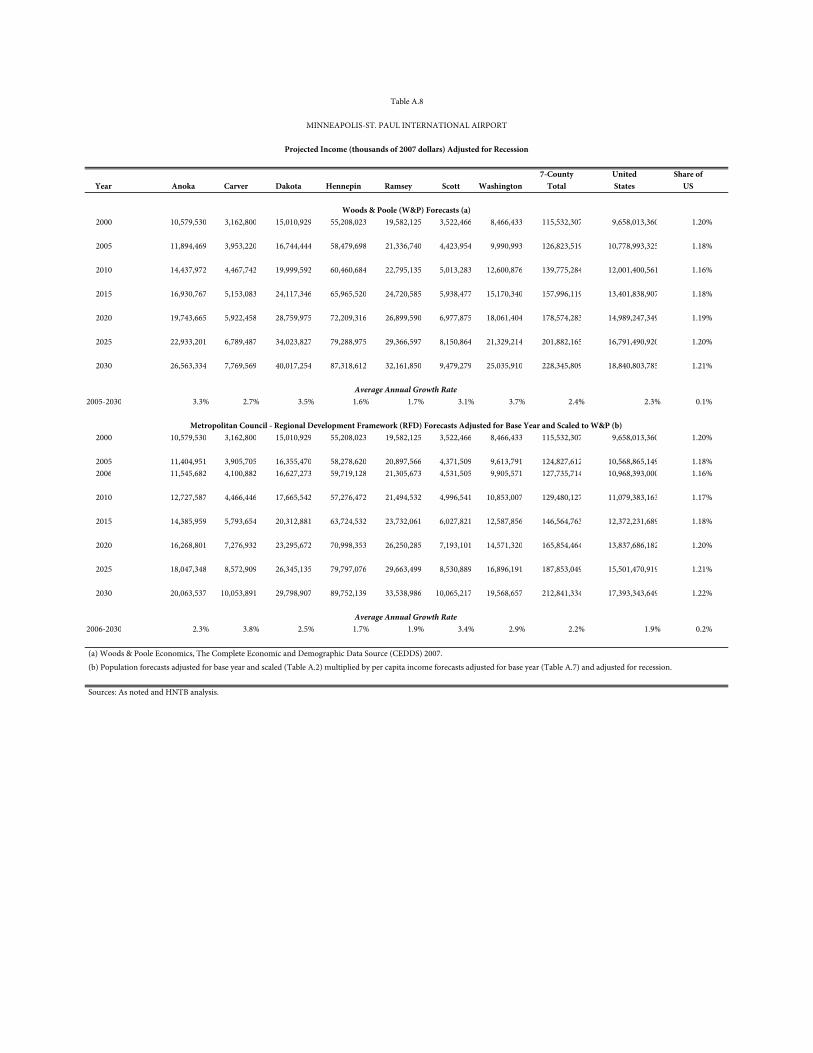
2000 10,579,530 3,162,800 15,010,929 55,208,023 19,582,125 3,522,466 8,466,433 115,532,307 9,658,013,360 1.20%
2005 11,894,469 3,953,220 16,744,444 58,479,698 21,336,740 4,423,954 9,990,993 126,823,519 10,778,993,325 1.18%
2010 14,437,972 4,467,742 19,999,592 60,460,684 22,795,135 5,013,283 12,600,876 139,775,284 12,001,400,561 1.16%
2015 16,930,767 5,153,083 24,117,346 65,965,520 24,720,585 5,938,477 15,170,340 157,996,119 13,401,838,907 1.18%
2020 19,743,665 5,922,458 28,759,975 72,209,316 26,899,590 6,977,875 18,061,404 178,574,283 14,989,247,349 1.19%
2025 22,933,201 6,789,487 34,023,827 79,288,975 29,366,597 8,150,864 21,329,214 201,882,165 16,791,490,920 1.20%
2030 26,563,334 7,769,569 40,017,254 87,318,612 32,161,850 9,479,279 25,035,910 228,345,809 18,840,803,785 1.21%
2005-2030 3.3% 2.7% 3.5% 1.6% 1.7% 3.1% 3.7% 2.4% 2.3% 0.1%
2000 10,579,530 3,162,800 15,010,929 55,208,023 19,582,125 3,522,466 8,466,433 115,532,307 9,658,013,360 1.20%
2005 11,404,951 3,905,705 16,355,470 58,278,620 20,897,566 4,371,509 9,613,791 124,827,612 10,568,865,149 1.18%2006 11,545,682 4,100,882 16,627,273 59,719,128 21,305,673 4,531,505 9,905,571 127,735,714 10,968,393,000 1.16%
2010 12,727,587 4,466,446 17,665,542 57,276,472 21,494,532 4,996,541 10,853,007 129,480,127 11,079,383,163 1.17%
2015 14,385,959 5,793,654 20,312,881 63,724,532 23,732,061 6,027,821 12,587,856 146,564,763 12,372,231,689 1.18%
2020 16,268,801 7,276,932 23,295,672 70,998,353 26,250,285 7,193,101 14,571,320 165,854,464 13,837,686,182 1.20%
2025 18,047,348 8,572,909 26,345,135 79,797,076 29,663,499 8,530,889 16,896,191 187,853,049 15,501,470,919 1.21%
2030 20,063,537 10,053,891 29,798,907 89,752,139 33,538,986 10,065,217 19,568,657 212,841,334 17,393,343,649 1.22%
2006-2030 2.3% 3.8% 2.5% 1.7% 1.9% 3.4% 2.9% 2.2% 1.9% 0.2%
(a) Woods & Poole Economics, The Complete Economic and Demographic Data Source (CEDDS) 2007.
Sources: As noted and HNTB analysis.
Table A.8
MINNEAPOLIS-ST. PAUL INTERNATIONAL AIRPORT
Projected Income (thousands of 2007 dollars) Adjusted for Recession
Average Annual Growth Rate
Woods & Poole (W&P) Forecasts (a)
Metropolitan Council - Regional Development Framework (RFD) Forecasts Adjusted for Base Year and Scaled to W&P (b)
Average Annual Growth Rate
(b) Population forecasts adjusted for base year and scaled (Table A.2) multiplied by per capita income forecasts adjusted for base year (Table A.7) and adjusted for recession.
Ave
rage
Ave
rage
Secu
rity
Nom
inal
Nom
inal
Real
Re
alG
DP
Nom
inal
Nom
inal
Dist
ance
Segm
ents
Exci
se T
ax (b
)Se
gmen
t Tax
(b)
Surc
harg
e (b)
Fare
w/
Yiel
d w
/Fa
re w
/Yi
eld
w/
Pric
eYe
arFa
re (a
)Yi
eld
(a)
(a)
(a)
(% o
f Far
e)(p
er E
npla
nem
ent)
(per
Enp
lane
men
t)M
SP (c
)G
ener
al (d
)Fe
es (e
)Fe
es (f
)Fe
es (g
)Fe
es (h
)D
efla
tor (
i)
1990
178.
030.
179
997
1.31
8.2%
-$
-
$
-
$
-
$
19
2.5 7
19.3
128
1.33
28.2
21.
461
1991
174.
9 70.
175
1001
1.30
10.0
%-
$
-$
-$
-$
192.
4719
.22
271.
3427
.10
1.41
019
9216
6.9 4
0.16
710
031.
3110
.0%
-$
-
$
1.
75$
1.
75$
185.
9218
.54
254.
7625
.41
1.37
019
9317
9.0 4
0.17
999
91.
2810
.0%
-$
-
$
3.
00$
3.
00$
200.
7920
.10
268.
9226
.93
1.33
919
9 418
8.80
0.18
710
101.
2910
.0%
-$
-
$
3.
00$
3.
00$
211.
5620
.96
277.
5127
.49
1.31
219
9518
3.7 4
0.18
698
81.
2710
.0%
-$
-
$
3.
00$
3.
00$
205.
9220
.85
264.
4426
.77
1.28
419
9619
7.18
0.19
899
41.
263.
5%-
$
-$
3.00
$
3.00
$
20
7.78
20.9
026
1.21
26.2
81.
257
1997
191.
640.
192
996
1.27
7.9%
0.25
$
-
$
3.
00$
3.
00$
210.
9721
.18
260.
8226
.18
1.23
619
9819
6.32
0.19
610
011.
288.
8%1.
25$
-$
3.00
$
3.00
$
21
8.93
21.8
626
8.25
26.7
91.
225
1999
186.
6 60.
185
1007
1.24
7.9%
2.06
$
-
$
3.
00$
3.
00$
207.
6520
.61
250.
2724
.84
1.20
520
0017
9.5 0
0.17
510
281.
237.
5%2.
50$
-$
3.00
$
3.00
$
19
9.71
19.4
223
4.86
22.8
41.
176
2001
174.
010.
164
1058
1.26
7.5%
2.75
$
-
$
4.
13$
3.
90$
195.
6518
.49
225.
3621
.30
1.15
220
0217
3.2 4
0.16
010
811.
307.
5%3.
00$
2.29
$
4.
50$
3.
90$
198.
7418
.39
225.
7220
.88
1.13
620
0317
3.33
0.16
010
861.
297.
5%3.
00$
1.67
$
4.
50$
3.
90$
197.
9618
.23
220.
4620
.30
1.11
420
0416
5.56
0.15
210
881.
267.
5%3.
10$
2.50
$
4.
50$
3.
90$
190.
5217
.51
206.
7119
.00
1.08
520
0515
3.9 2
0.14
310
741.
237.
5%3.
20$
2.50
$
4.
50$
3.
90$
177.
9016
.56
187.
4917
.45
1.05
420
0616
7.30
0.15
610
711.
247.
5%3.
30$
2.50
$
4.
50$
3.
90$
192.
4517
.97
197.
3618
.43
1.02
620
0716
5.54
0.15
410
761.
237.
5%3.
40$
2.50
$
4.
50$
3.
90$
190.
6417
.72
190.
6417
.72
1.00
0
1990
-200
0-1
.8%
-2.1
%20
01-2
008
-2.6
%-3
.1%
1990
-200
8-2
.1%
-2.6
%
(a) U
SDO
T O
rigin
-Des
tinat
ion
Surv
ey as
com
pile
d by
Dat
aBas
e Pro
duct
s. (b
) Hist
oric
al p
asse
nger
tick
et ta
x da
ta fr
om A
ir Tr
ansp
ort A
ssoc
iatio
n. V
alue
s pro
rate
d w
hen
chan
ges o
r exp
iratio
ns o
ccur
red
with
in ca
lend
ar y
ear.
(c) F
eder
al A
viat
ion
Adm
inist
ratio
n. V
alue
s pro
rate
d w
hen
chan
ges o
ccur
red
with
in ca
lend
ar y
ear .
(d) F
eder
al A
viat
ion
Adm
inist
ratio
n. E
stim
ated
aver
age o
f all
airp
orts.
(e) N
omin
al fa
res w
ith ta
xes a
nd fe
es in
clud
ed.
(f) N
omin
al y
ield
s with
taxe
s and
fees
incl
uded
. (g
) Ave
rage
fare
s with
taxe
s and
fees
incl
uded
conv
erte
d to
200
7 pr
ices
. (h
) Ave
rage
yie
lds w
ith ta
xes a
nd fe
es in
clud
ed co
nver
ted
to 2
007
pric
es.
(i) G
ross
Dom
estic
Pro
duct
Impl
icit
Pric
e Def
lato
r for
Con
sum
er E
xpen
ditu
res f
rom
U.S
. Bur
eau
of E
cono
mic
Ana
lysis
.
Sou
rces
: As n
oted
, Air
Tran
spor
t Ass
ocia
tion
web
site
and
HN
TB an
alys
is.
Ave
age A
nnua
l Gro
wth
Rat
e
(per
Enp
lane
men
t)
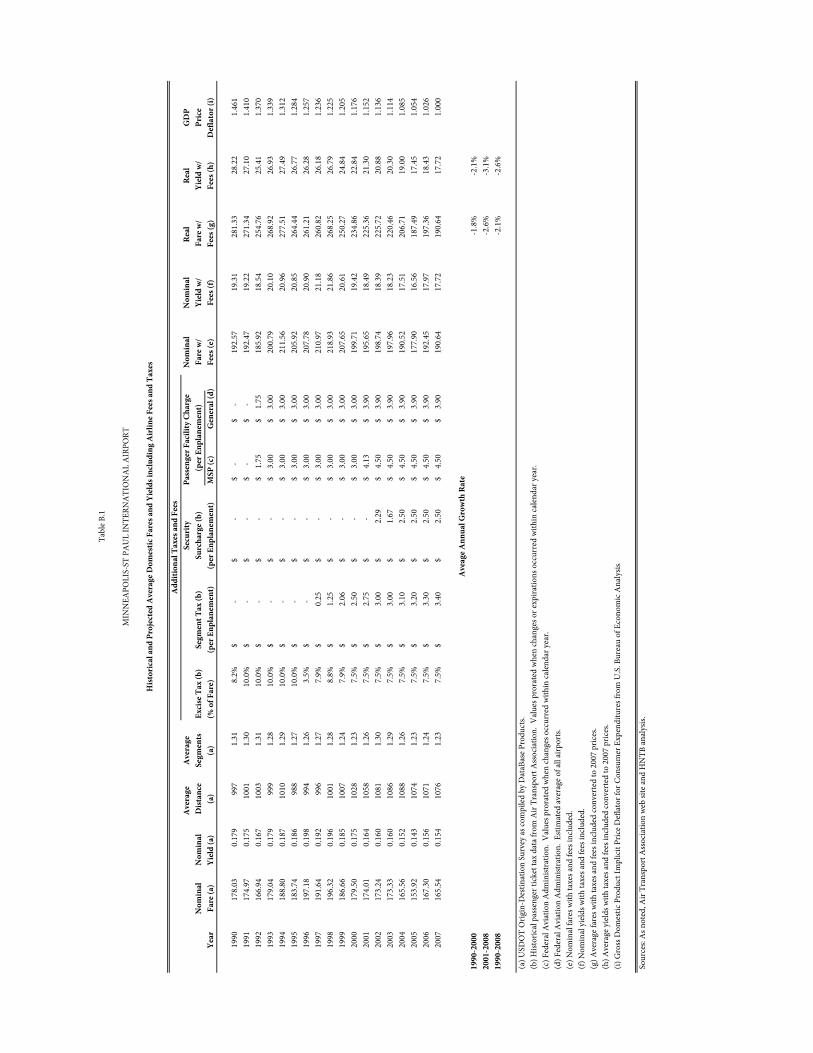
Tabl
e B.1
MIN
NEA
POLI
S-ST
PA
UL
INTE
RNA
TIO
NA
L A
IRPO
RT
Hist
oric
al a
nd P
roje
cted
Ave
rage
Dom
estic
Far
es a
nd Y
ield
s inc
ludi
ng A
irlin
e Fee
s and
Tax
es
Pass
enge
r Fac
ility
Cha
rge
Add
ition
al T
axes
and
Fee
s
Year
Mai
nlin
eRe
gion
alA
vera
ge (b
)M
ainl
ine
Regi
onal
Ave
rage
(b)
Mai
nlin
eRe
gion
alA
vera
ge (d
)M
ainl
ine
Regi
onal
Tota
l
2000
16.8
736
.41
17.7
487
2.6
286.
579
9.7
$147
.21
$104
.31
$141
.88
561.
5079
.70
641.
2020
0115
.76
36.8
716
.77
886.
730
2.1
811.
6$1
39.7
4$1
11.3
8$1
36.1
054
5.40
80.4
062
5.80
2002
13.9
131
.55
15.0
291
1.8
336.
382
3.1
$126
.83
$106
.10
$123
.64
486.
5088
.60
575.
1020
0313
.54
28.8
614
.76
939.
137
3.9
838.
1$1
27.1
5$1
07.9
1$1
23.7
248
2.80
105.
0058
7.80
2004
12.6
226
.28
13.9
397
2.0
410.
985
9.6
$122
.67
$107
.98
$119
.73
502.
6012
5.90
628.
5020
0512
.06
20.8
713
.03
981.
543
4.7
861.
9$1
18.3
7$9
0.72
$112
.32
523.
0014
6.40
669.
4020
0612
.62
20.3
413
.53
995.
445
0.4
871.
3$1
25.6
2$9
1.61
$117
.88
516.
3015
2.20
668.
5020
0712
.45
20.1
213
.35
992.
845
0.9
870.
4$1
23.6
0$9
0.72
$116
.18
533.
8015
5.70
689.
5020
0812
.51
20.3
713
.45
989.
145
5.3
867.
2$1
23.7
4$9
2.74
$116
.66
537.
3015
9.00
696.
30
2010
12.3
219
.39
13.2
399
1.0
479.
787
1.4
$122
.09
$93.
01$1
15.2
957
1.70
174.
5074
6.20
2015
11.9
017
.32
12.6
91,
019.
954
0.5
903.
5$1
21.3
7$9
3.61
$114
.63
650.
5020
8.50
859.
00
2020
11.5
015
.66
12.1
71,
070.
160
1.4
950.
4$1
23.0
6$9
4.18
$115
.68
732.
6025
1.40
984.
00
2025
11.1
214
.28
11.6
71,
133.
266
2.2
1,00
7.7
$126
.01
$94.
56$1
17.6
382
0.30
297.
901,
118.
20
2030
(e)
11.1
91,
065.
1$1
19.2
3
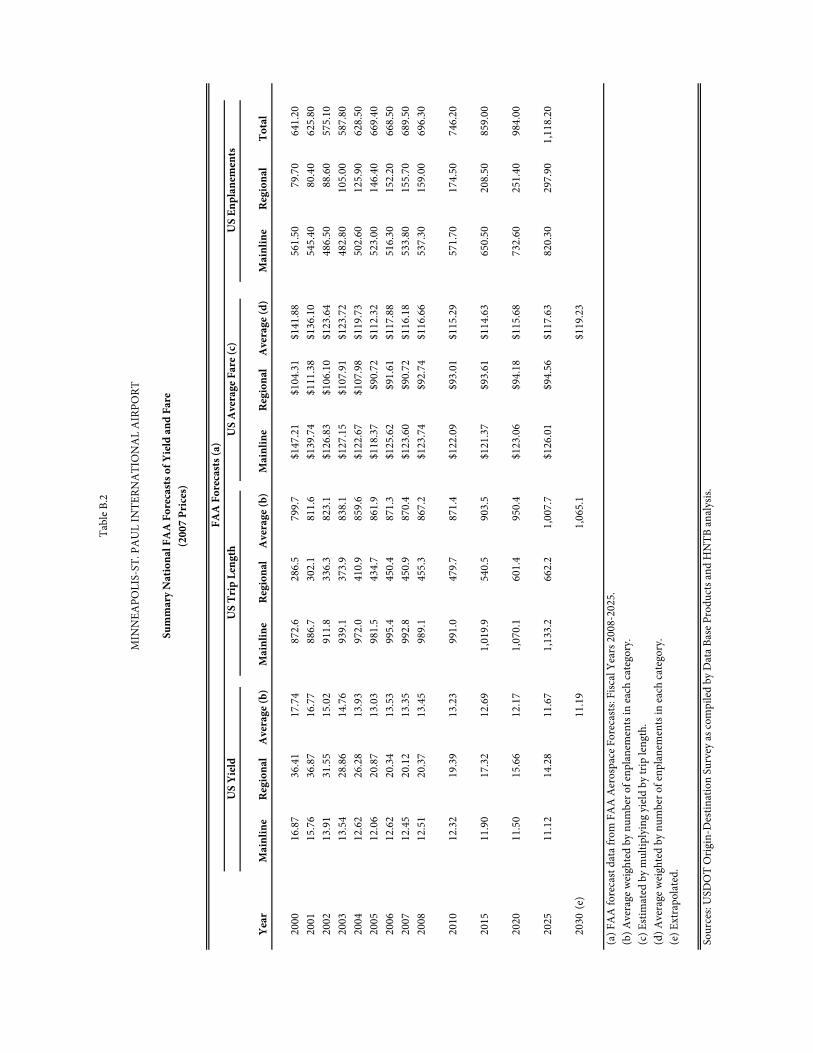
(a) F
AA
fore
cast
data
from
FA
A A
eros
pace
For
ecas
ts: F
iscal
Yea
rs 2
008-
2025
. (b
) Ave
rage
wei
ghte
d by
num
ber o
f enp
lane
men
ts in
each
cate
gory
. (c
) Esti
mat
ed b
y m
ultip
lyin
g yi
eld
by tr
ip le
ngth
. (d
) Ave
rage
wei
ghte
d by
num
ber o
f enp
lane
men
ts in
each
cate
gory
. (e
) Ext
rapo
late
d.
Sou
rces
: USD
OT
Orig
in-D
estin
atio
n Su
rvey
as co
mpi
led
by D
ata B
ase P
rodu
cts a
nd H
NTB
anal
ysis.
US
Ave
rage
Far
e (c)
US
Yiel
d
MIN
NEA
POLI
S-ST
. PA
UL
INTE
RNA
TIO
NA
L A
IRPO
RT
Tabl
e B.2
(200
7 Pr
ices
)
FAA
For
ecas
ts (a
)U
S Tr
ip L
engt
hU
S En
plan
emen
ts
Sum
mar
y N
atio
nal F
AA
For
ecas
ts o
f Yie
ld a
nd F
are
Year
2008
DO
E Fo
reca
st (a
)20
09 D
OE
Fore
cast
(b)
Diff
eren
ce
(per
cent
)20
08 D
OE
Fore
cast
2009
DO
E Fo
reca
stD
iffer
ence
Diff
eren
ce
Adj
uste
d fo
r Fu
el E
ffici
ency
(d
)
FAA
U
ndaj
uste
d Yi
eld
(e)
FAA
Adj
uste
d Yi
eld
(f)
2006
205.
820
5.8
0.0%
3.99
3.99
0.00
13.5
313
.53
2007
208.
221
7.3
4.4%
4.08
4.08
0.00
13.3
513
.35
2008
218.
429
7.5
36.2
%4.
285.
591.
311.
3113
.45
14.7
620
0922
5.8
197.
4-1
2.6%
4.43
3.71
-0.7
2-0
.71
2010
218.
820
3.5
-7.0
%4.
293.
82-0
.47
-0.4
613
.23
12.7
720
1121
5.1
225.
74.
9%4.
224.
240.
020.
0220
1220
4.3
245.
520
.1%
4.00
4.61
0.60
0.58
2013
195.
425
5.0
30.5
%3.
834.
790.
960.
9112
.89
13.8
120
1419
0.7
277.
545
.5%
3.74
5.21
1.47
1.39
2015
182.
628
6.2
56.7
%3.
585.
371.
801.
6712
.69
14.3
6
2020
184.
229
5.5
60.5
%3.
615.
551.
941.
7212
.17
13.8
9
2025
196.
330
7.2
56.5
%3.
855.
771.
921.
6211
.67
13.2
9
2030
213.
333
1.3
55.3
%4.
186.
222.
041.
6411
.19
12.8
3
2008
-203
0-0
.1%
0.5%
1.9%
-0.1
%0.
5%2.
0%1.
0%-0
.8%
-0.6
%
(e) T
able
B.2
. (f
) Una
djus
ted
FAA
yie
ld fo
reca
st w
ith d
iffer
cenc
e in
jet f
uel c
ost p
er R
PM ad
juste
d fo
r fue
l effi
cien
cy ad
ded .
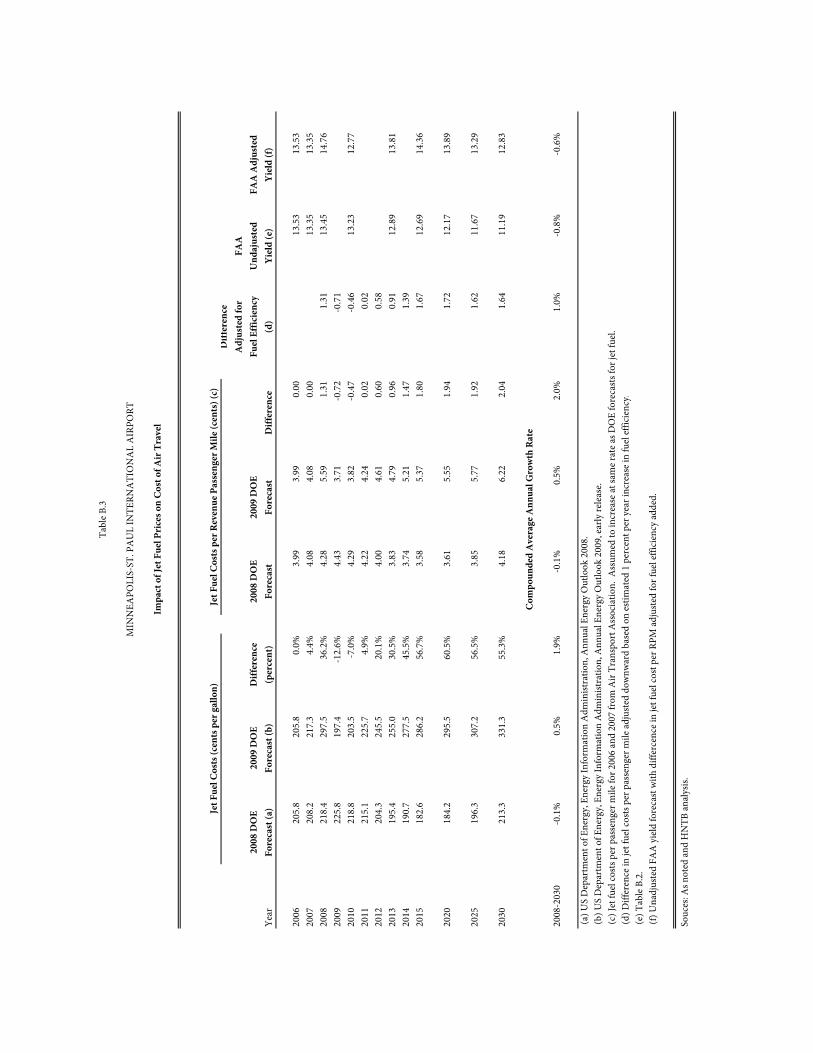
Tabl
e B.3
Impa
ct o
f Jet
Fue
l Pri
ces o
n Co
st o
f Air
Tra
vel
Com
poun
ded
Ave
rage
Ann
ual G
row
th R
ate
Jet F
uel C
osts
(cen
ts p
er g
allo
n)
MIN
NEA
POLI
S-ST
. PA
UL
INTE
RNA
TIO
NA
L A
IRPO
R T
Jet F
uel C
osts
per
Rev
enue
Pas
seng
er M
ile (c
ents
) (c)
(b) U
S D
epar
tmen
t of E
nerg
y, E
nerg
y In
form
atio
n A
dmin
istra
tion,
Ann
ual E
nerg
y O
utlo
ok 2
009,
early
rele
ase.
(c) J
et fu
el co
sts p
er p
asse
nger
mile
for 2
006
and
2007
from
Air
Tran
spor
t Ass
ocia
tion.
Ass
umed
to in
crea
se at
sam
e rat
e as D
OE
fore
casts
for j
et fu
el.
(d) D
iffer
ence
in je
t fue
l cos
ts pe
r pas
seng
er m
ile ad
juste
d do
wnw
ard
base
d on
estim
ated
1 p
erce
nt p
er y
ear i
ncre
ase i
n fu
el ef
ficie
ncy.
Souc
es: A
s not
ed an
d H
NTB
anal
ysis.
(a) U
S D
epar
tmen
t of E
nerg
y, E
nerg
y In
form
atio
n A
dmin
istra
tion,
Ann
ual E
nerg
y O
utlo
ok 2
008.
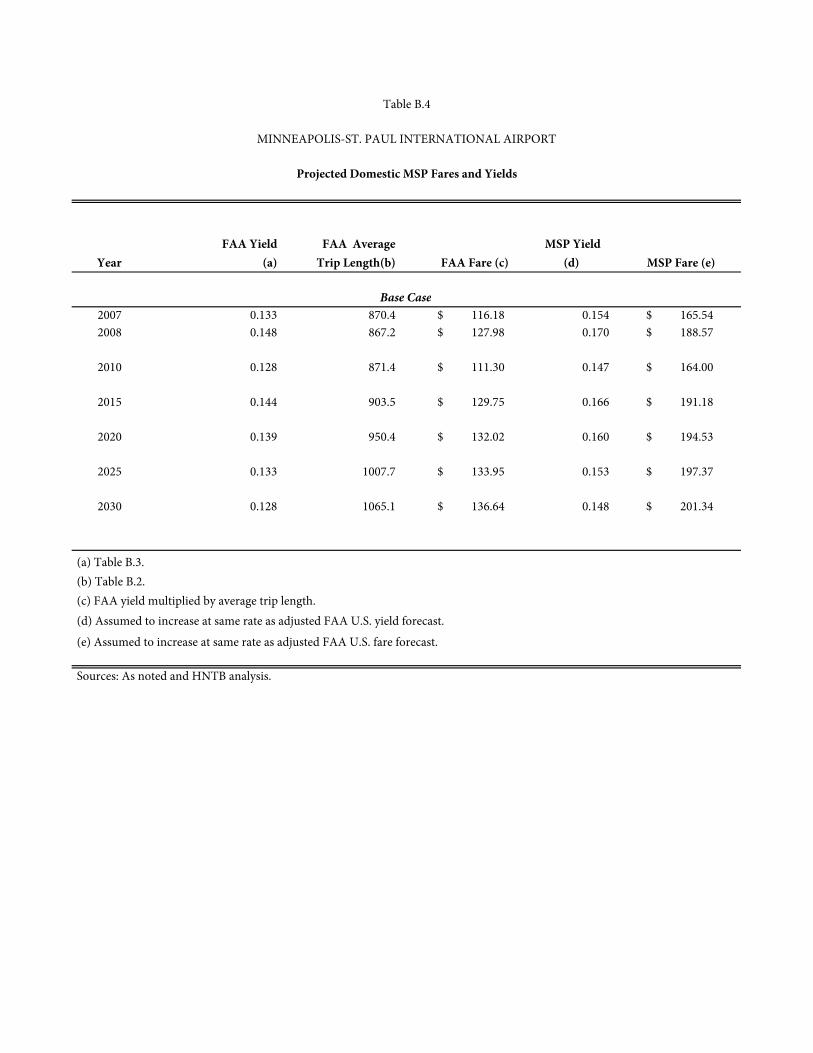
YearFAA Yield
(a)FAA Average
Trip Length(b) FAA Fare (c) MSP Yield
(d) MSP Fare (e)
2007 0.133 870.4 116.18$ 0.154 165.54$ 2008 0.148 867.2 127.98$ 0.170 188.57$
2010 0.128 871.4 111.30$ 0.147 164.00$
2015 0.144 903.5 129.75$ 0.166 191.18$
2020 0.139 950.4 132.02$ 0.160 194.53$
2025 0.133 1007.7 133.95$ 0.153 197.37$
2030 0.128 1065.1 136.64$ 0.148 201.34$
(b) Table B.2.
Sources: As noted and HNTB analysis.
Table B.4
MINNEAPOLIS-ST. PAUL INTERNATIONAL AIRPORT
Projected Domestic MSP Fares and Yields
Base Case
(d) Assumed to increase at same rate as adjusted FAA U.S. yield forecast. (e) Assumed to increase at same rate as adjusted FAA U.S. fare forecast.
(a) Table B.3.
(c) FAA yield multiplied by average trip length.
Fare
Yiel
dW
ithou
tW
ithou
tA
vera
geA
vera
geSe
curi
tyRe
al
Real
Fees
and
Fe
es a
nd
Dist
ance
Segm
ents
Exci
se T
ax (c
)Se
gmen
t Tax
(c)
Surc
harg
e (c)
Fare
w/
Yiel
d w
/Ye
arTa
xes (
a)Ta
xes (
a)(b
)(c
)(%
of F
are)
(per
Enp
lane
men
t)(p
er E
npla
nem
ent)
MSP
(c)
Gen
eral
(c)
Fees
(d)
Fees
(e)
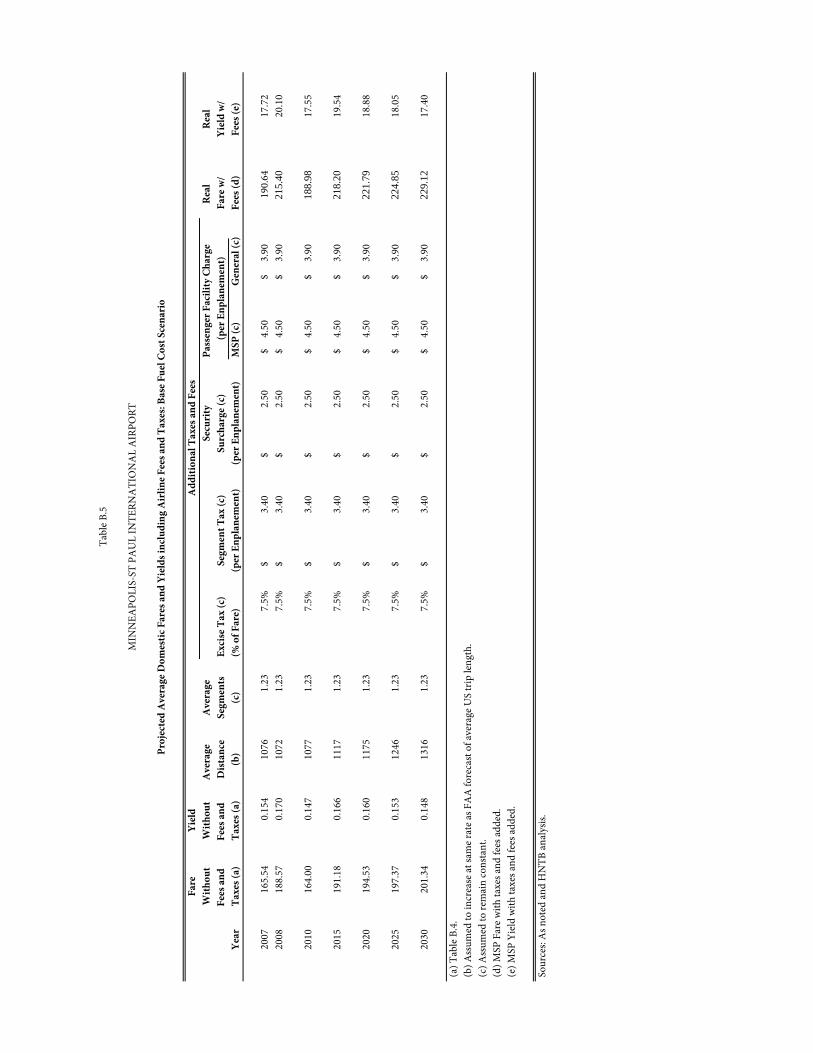
2007
165.
54
0.15
410
761.
237.
5%3.
40$
2.
50$
4.50
$
3.90
$
19
0.64
17.7
220
0818
8.57
0.
170
1072
1.23
7.5%
3.40
$
2.50
$
4.
50$
3.
90$
215.
4020
.10
2010
164.
00
0.14
710
771.
237.
5%3.
40$
2.
50$
4.50
$
3.90
$
18
8.98
17.5
5
2015
191.
18
0.16
611
171.
237.
5%3.
40$
2.
50$
4.50
$
3.90
$
21
8.20
19.5
4
2020
194.
53
0.16
011
751.
237.
5%3.
40$
2.
50$
4.50
$
3.90
$
22
1.79
18.8
8
2025
197.
37
0.15
312
461.
237.
5%3.
40$
2.
50$
4.50
$
3.90
$
22
4.85
18.0
5
2030
201.
34
0.14
813
161.
237.
5%3.
40$
2.
50$
4.50
$
3.90
$
22
9.12
17.4
0
(a) T
able
B.4
. (b
) Ass
umed
to in
crea
se at
sam
e rat
e as F
AA
fore
cast
of av
erag
e US
trip
leng
th.
(c) A
ssum
ed to
rem
ain
cons
tant
. (d
) MSP
Far
e with
taxe
s and
fees
adde
d. (e
) MSP
Yie
ld w
ith ta
xes a
nd fe
es ad
ded.
Sou
rces
: As n
oted
and
HN
TB an
alys
is.
(per
Enp
lane
men
t)
Tabl
e B.5
MIN
NEA
POLI
S-ST
PA
UL
INTE
RNA
TIO
NA
L A
IRPO
RT
Proj
ecte
d A
vera
ge D
omes
tic F
ares
and
Yie
lds i
nclu
ding
Air
line F
ees a
nd T
axes
: Bas
e Fue
l Cos
t Sce
nari
o
Pass
enge
r Fac
ility
Cha
rge
Add
ition
al T
axes
and
Fee
s
Ave
rage
Ave
rage
Ave
rage
Empl
oym
ent
Inco
me
No
Sche
d.N
WA
1991
Inst
rum
entI
nstr
umen
tIns
trum
ent
Inst
rum
ent
Dom
estic
Char
ter
Trip
Fare
(200
7Yi
eld
(200
47-
Coun
ty7-
Coun
tySe
rvic
e By
Wor
kG
ulf
Var
iabl
eV
aria
ble
Var
iabl
eV
aria
ble
NW
AYe
arO
rigi
natio
nsEn
plan
emen
tsD
istan
cePr
ices
)Pr
ices
)A
rea
Are
a (2
004
$)Su
n Co
untr
ySt
oppa
geW
arfo
r 200
1fo
r 200
2fo
r 200
3fo
r 200
4Ch
apte
r 11
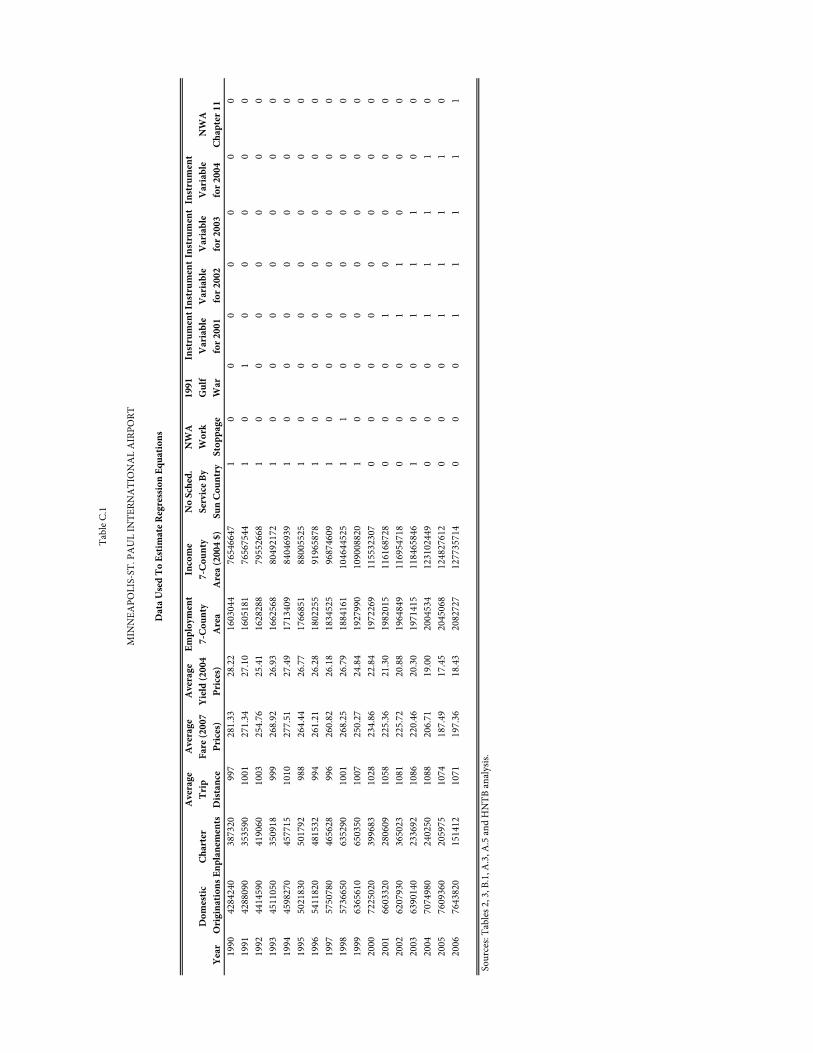
1990
4284
240
3873
2099
728
1.33
28.2
216
0304
476
5466
471
00
00
00
019
9142
8809
035
3590
1001
271.
3427
.10
1605
181
7656
7544
10
10
00
00
1992
4414
590
4190
6010
0325
4.76
25.4
116
2828
879
5526
681
00
00
00
019
9345
1105
035
0918
999
268.
9226
.93
1662
568
8049
2172
10
00
00
00
1994
4598
270
4577
1510
1027
7.51
27.4
917
1340
984
0469
391
00
00
00
019
9550
2183
050
1792
988
264.
4426
.77
1766
851
8800
5525
10
00
00
00
1996
5411
820
4815
3299
426
1.21
26.2
818
0225
591
9658
781
00
00
00
019
9757
5078
046
5628
996
260.
8226
.18
1834
525
9687
4609
10
00
00
00
1998
5736
650
6352
9010
0126
8.25
26.7
918
8416
110
4644
525
11
00
00
00
1999
6365
610
6503
5010
0725
0.27
24.8
419
2799
010
9008
820
10
00
00
00
2000
7225
020
3996
8310
2823
4.86
22.8
419
7226
911
5532
307
00
00
00
00
2001
6603
320
2806
0910
5822
5.36
21.3
019
8201
511
6168
728
00
01
00
00
2002
6207
930
3650
2310
8122
5.72
20.8
819
6484
911
6954
718
00
01
10
00
2003
6390
140
2336
9210
8622
0.46
20.3
019
7141
511
8465
846
10
01
11
00
2004
7074
980
2402
5010
8820
6.71
19.0
020
0453
412
3102
449
00
01
11
10
2005
7609
360
2059
7510
7418
7.49
17.4
520
4506
812
4827
612
00
01
11
10
2006
7643
820
1514
1210
7119
7.36
18.4
320
8272
712
7735
714
00
01
11
11
Sou
rces
: Tab
les 2
, 3, B
.1, A
.3, A
.5 an
d H
NTB
anal
ysis.
Tabl
e C.1
MIN
NEA
POLI
S-ST
. PA
UL
INTE
RNA
TIO
NA
L A
IRPO
R T
Dat
a U
sed
To E
stim
ate R
egre
ssio
n Eq
uatio
ns
Ave
rage
Ave
rage
Ave
rage
Empl
oym
ent
Inco
me
No
Sche
d.N
WA
1991
Inst
rum
ent
Inst
rum
ent
Inst
rum
ent
Inst
rum
ent
Dom
estic
Char
ter
Trip
Fare
(200
7Yi
eld
(200
47-
Coun
ty7-
Coun
tySe
rvic
e By
Wor
kG
ulf
Var
iabl
eV
aria
ble
Var
iabl
eV
aria
ble
NW
AYe
arO
rigi
natio
nsEn
plan
emen
tsD
istan
cePr
ices
)Pr
ices
)A
rea
Are
a (2
004
$)Su
n Co
untr
ySt
oppa
geW
arfo
r 200
1fo
r 200
2fo
r 200
3fo
r 200
4Ch
apte
r 11
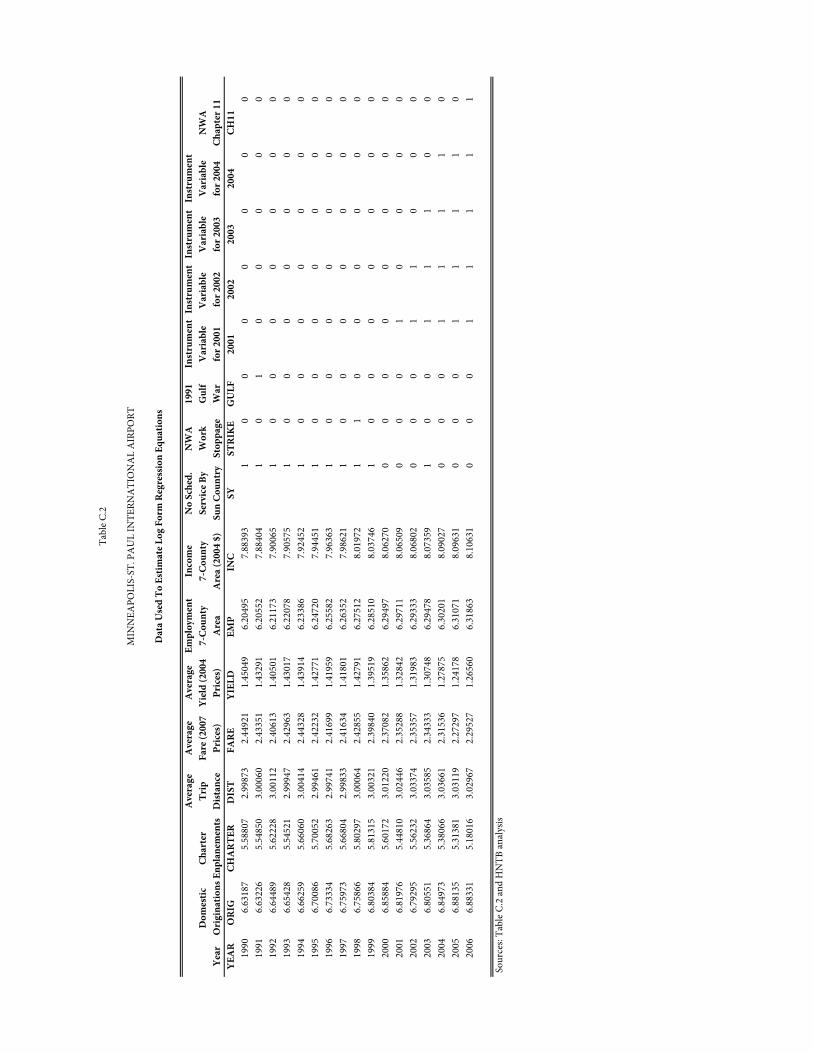
YEA
RO
RIG
CH
ART
ERD
IST
FARE
YI
ELD
EM
P IN
C SY
STRI
KE
GU
LF20
0120
0220
0320
04CH
1119
906.
6318
75.
5880
72.
9987
32.
4492
11.
4504
96.
2049
57.
8839
31
00
00
00
019
916.
6322
65.
5485
03.
0006
02.
4335
11.
4329
16.
2055
27.
8840
41
01
00
00
019
926.
6448
95.
6222
83.
0011
22.
4061
31.
4050
16.
2117
37.
9006
51
00
00
00
019
936.
6542
85.
5452
12.
9994
72.
4296
31.
4301
76.
2207
87.
9057
51
00
00
00
019
946.
6625
95.
6606
03.
0041
42.
4432
81.
4391
46.
2338
67.
9245
21
00
00
00
019
956.
7008
65.
7005
22.
9946
12.
4223
21.
4277
16.
2472
07.
9445
11
00
00
00
019
966.
7333
45.
6826
32.
9974
12.
4169
91.
4195
96.
2558
27.
9636
31
00
00
00
019
976.
7597
35.
6680
42.
9983
32.
4163
41.
4180
16.
2635
27.
9862
11
00
00
00
019
986.
7586
65.
8029
73.
0006
42.
4285
51.
4279
16.
2751
28.
0197
21
10
00
00
019
996.
8038
45.
8131
53.
0032
12.
3984
01.
3951
96.
2851
08.
0374
61
00
00
00
020
006.
8588
45.
6017
23.
0122
02.
3708
21.
3586
26.
2949
78.
0627
00
00
00
00
020
016.
8197
65.
4481
03.
0244
62.
3528
81.
3284
26.
2971
18.
0650
90
00
10
00
020
026.
7929
55.
5623
23.
0337
42.
3535
71.
3198
36.
2933
38.
0680
20
00
11
00
020
036.
8055
15.
3686
43.
0358
52.
3433
31.
3074
86.
2947
88.
0735
91
00
11
10
020
046.
8497
35.
3806
63.
0366
12.
3153
61.
2787
56.
3020
18.
0902
70
00
11
11
020
056.
8813
55.
3138
13.
0311
92.
2729
71.
2417
86.
3107
18.
0963
10
00
11
11
020
066.
8833
15.
1801
63.
0296
72.
2952
71.
2656
06.
3186
38.
1063
10
00
11
11
1
Sou
rces
: Tab
le C
.2 an
d H
NTB
anal
ysis
Tabl
e C.2
MIN
NEA
POLI
S-ST
. PA
UL
INTE
RNA
TIO
NA
L A
IRPO
R T
Dat
a U
sed
To E
stim
ate L
og F
orm
Reg
ress
ion
Equa
tions
Airp
ort
1990
1991
1992
1993
1994
1995
1996
1997
1998
1999
2000
2001
2002
2003
2004
2005
2006
2007
2008
BWI To
tal R
elat
ive S
hare
of U
.S. (
a)1.
38
1.40
1.
43
1.55
1.
69
1.81
1.
95
2.
14
2.
07
2.09
1.
94
1.80
1.
85
1.82
1.
90
Sout
hwes
t Por
tion
0.13
0.
21
0.27
0.
36
0.43
0.
53
0.64
0.79
0.84
0.
91
0.86
0.
83
0.89
0.
90
Non
-Sou
thw
est P
ortio
n1.
25
1.19
1.
16
1.19
1.
26
1.28
1.
31
1.
35
1.
24
1.18
1.
09
0.97
0.
96
0.92
CLE To
tal R
elat
ive S
hare
of U
.S. (
a)1.
02
1.20
1.
13
1.06
1.
07
1.09
1.
05
1.01
0.96
0.93
0.
87
0.87
0.
88
0.87
0.
87
0.91
So
uthw
est P
ortio
n0.
12
0.13
0.
13
0.13
0.
12
0.13
0.
14
0.15
0.16
0.15
0.
14
0.13
0.
13
0.13
0.
13
Non
-Sou
thw
est P
ortio
n0.
90
1.07
1.
01
0.93
0.
95
0.96
0.
91
0.86
0.81
0.77
0.
72
0.74
0.
75
0.74
0.
74
DEN
Tota
l Rel
ativ
e Sha
re o
f U.S
. (a)
1.08
1.
12
1.19
So
uthw
est P
ortio
n0.
07
0.11
N
on-S
outh
wes
t Por
tion
1.01
1.
01
DTW
Tota
l Rel
ativ
e Sha
re o
f U.S
. (a)
1.10
1.05
1.01
0.99
1.
04
1.07
1.
041.
04
1.05
1.
08
1.08
1.03
1.00
0.
98
0.99
0.
99
1.02
1.
05
1.05
So
uthw
est P
ortio
n0.
03
0.
02
0.
03
0.
05
0.10
0.
09
0.08
0.
07
0.08
0.
08
0.08
0.08
0.07
0.
06
0.07
0.
06
0.07
0.
08
Non
-Sou
thw
est P
ortio
n1.
07
1.
03
0.
98
0.
93
0.95
0.
98
0.97
0.
97
0.97
1.
00
1.01
0.95
0.93
0.
92
0.92
0.
93
0.95
0.
97
FLL To
tal R
elat
ive S
hare
of U
.S. (
a)1.
11
1.12
1.
23
1.35
1.50
1.60
1.
65
1.71
1.
70
1.60
1.
61
1.70
So
uthw
est P
ortio
n0.
15
0.16
0.
18
0.20
0.21
0.24
0.
23
0.23
0.
25
0.26
0.
26
Non
-Sou
thw
est P
ortio
n0.
95
0.96
1.
05
1.15
1.28
1.36
1.
43
1.48
1.
45
1.35
1.
35
MCO
Tota
l Rel
ativ
e Sha
re o
f U.S
. (a)
1.21
1.
21
1.24
1.
27
1.
29
1.
28
1.31
1.
38
1.43
1.
43
1.44
1.
50
Sout
hwes
t Por
tion
0.08
0.
10
0.11
0.
14
0.
17
0.
20
0.21
0.
23
0.27
0.
30
0.32
N
on-S
outh
wes
t Por
tion
1.13
1.
12
1.12
1.
13
1.
12
1.
08
1.10
1.
15
1.16
1.
13
1.11
PHL To
tal R
elat
ive S
hare
of U
.S. (
a)1.
19
1.17
1.
14
1.15
So
uthw
est P
ortio
n0.
17
0.20
0.
23
Non
-Sou
thw
est P
ortio
n1.
02
0.97
0.
91
PIT To
tal R
elat
ive S
hare
of U
.S. (
a)1.
05
1.06
1.
06
Sout
hwes
t Por
tion
0.16
0.
18
Non
-Sou
thw
est P
ortio
n0.
89
0.88
TPA To
tal R
elat
ive S
hare
of U
.S. (
a)1.
06
1.10
1.
16
1.19
1.26
1.26
1.
26
1.27
1.
33
1.30
1.
26
1.28
So
uthw
est P
ortio
n0.
12
0.14
0.
17
0.20
0.24
0.26
0.
26
0.27
0.
30
0.34
0.
35
Non
-Sou
thw
est P
ortio
n0.
94
0.96
0.
99
0.99
1.02
1.01
1.
00
1.00
1.
03
0.96
0.
91
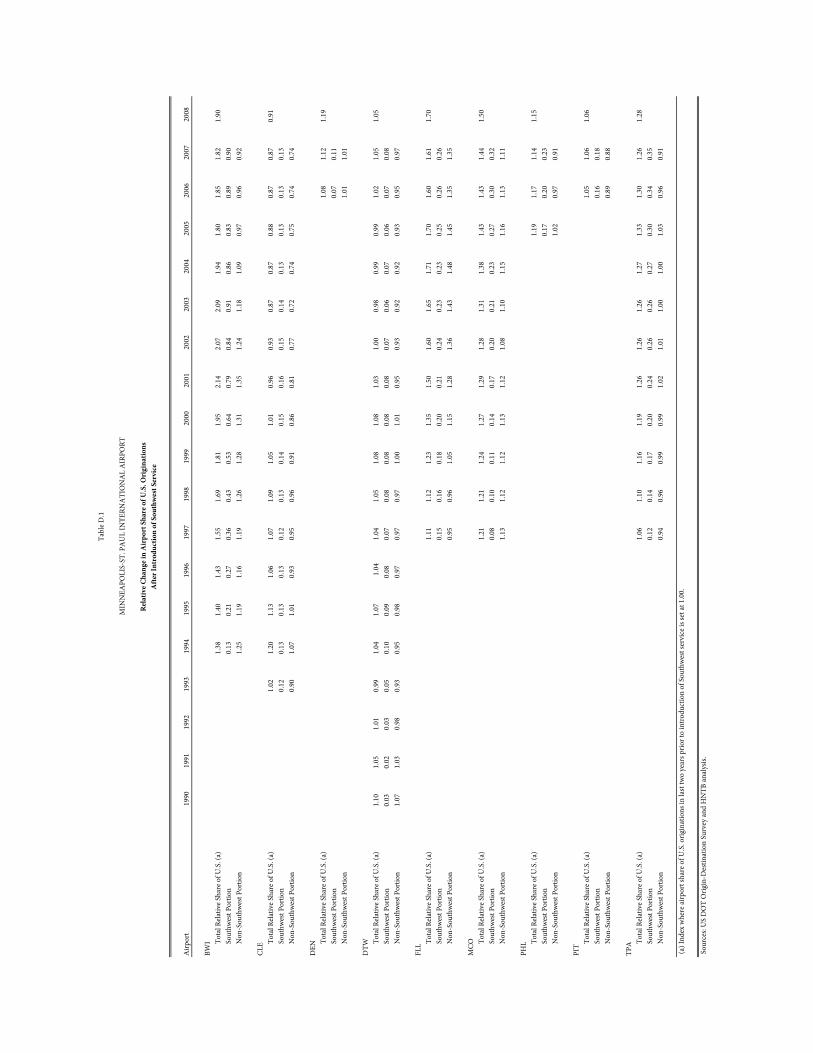
(a) I
ndex
whe
re ai
rpor
t sha
re o
f U.S
. orig
inat
ions
in la
st tw
o ye
ars p
rior t
o in
trod
uctio
n of
Sou
thw
est s
ervi
ce is
set a
t 1.0
0.
Sou
rces
: US
DO
T O
rigin
-Des
tinat
ion
Surv
ey an
d H
NTB
anal
ysis.
MIN
NEA
POLI
S-ST
. PA
UL
INTE
RNA
TIO
NA
L A
IRPO
RT
Rela
tive C
hang
e in
Air
port
Sha
re o
f U.S
. Ori
gina
tions
Afte
r Int
rodu
ctio
n of
Sou
thw
est S
ervi
ce
Tabl
e D.1
DEN PHL CLE Average
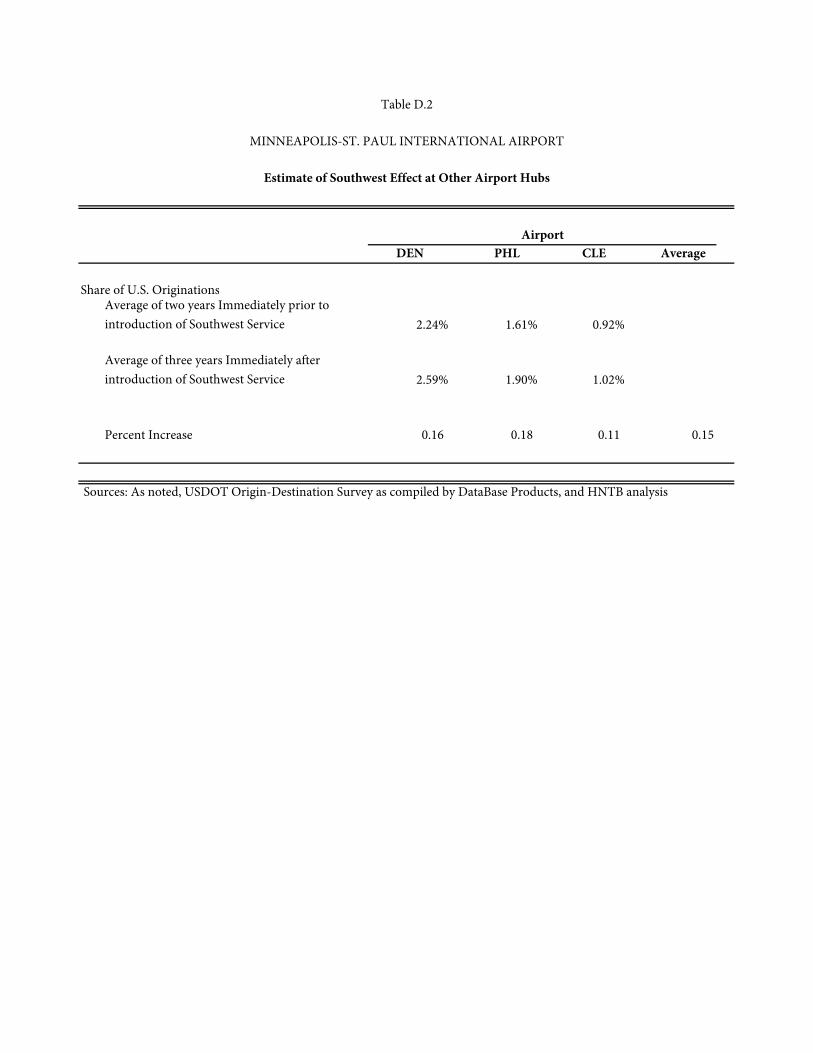
Share of U.S. OriginationsAverage of two years Immediately prior to introduction of Southwest Service 2.24% 1.61% 0.92%
Average of three years Immediately after introduction of Southwest Service 2.59% 1.90% 1.02%
Percent Increase 0.16 0.18 0.11 0.15
Sources: As noted, USDOT Origin-Destination Survey as compiled by DataBase Products, and HNTB analysis.
Airport
Table D.2
MINNEAPOLIS-ST. PAUL INTERNATIONAL AIRPORT
Estimate of Southwest Effect at Other Airport Hubs
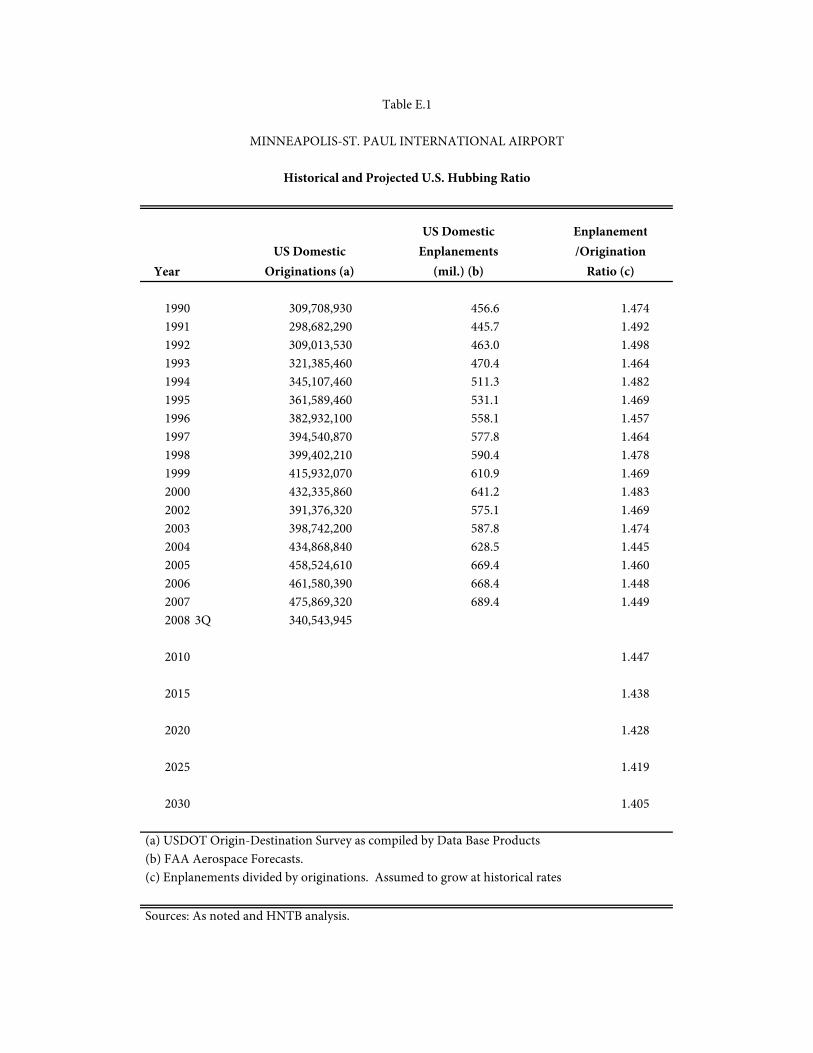
YearUS Domestic
Originations (a)
US Domestic Enplanements
(mil.) (b)
Enplanement/Origination
Ratio (c)
1990 309,708,930 456.6 1.4741991 298,682,290 445.7 1.4921992 309,013,530 463.0 1.4981993 321,385,460 470.4 1.4641994 345,107,460 511.3 1.4821995 361,589,460 531.1 1.4691996 382,932,100 558.1 1.4571997 394,540,870 577.8 1.4641998 399,402,210 590.4 1.4781999 415,932,070 610.9 1.4692000 432,335,860 641.2 1.4832002 391,376,320 575.1 1.4692003 398,742,200 587.8 1.4742004 434,868,840 628.5 1.4452005 458,524,610 669.4 1.4602006 461,580,390 668.4 1.4482007 475,869,320 689.4 1.4492008 3Q 340,543,945
2010 1.447
2015 1.438
2020 1.428
2025 1.419
2030 1.405
(a) USDOT Origin-Destination Survey as compiled by Data Base Products. (b) FAA Aerospace Forecasts. (c) Enplanements divided by originations. Assumed to grow at historical rates.
Sources: As noted and HNTB analysis.
Table E.1
MINNEAPOLIS-ST. PAUL INTERNATIONAL AIRPORT
Historical and Projected U.S. Hubbing Ratio
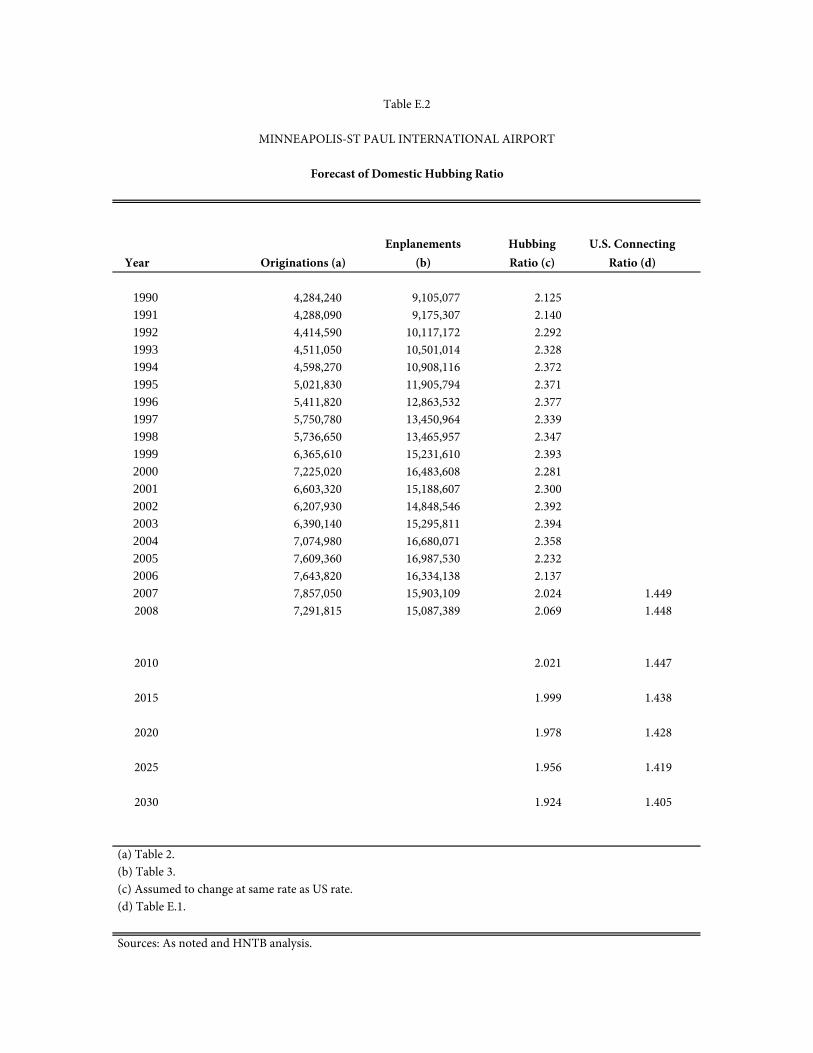
Year Originations (a)Enplanements
(b)Hubbing Ratio (c)
U.S. Connecting Ratio (d)
1990 4,284,240 9,105,077 2.125 1991 4,288,090 9,175,307 2.140 1992 4,414,590 10,117,172 2.292 1993 4,511,050 10,501,014 2.328 1994 4,598,270 10,908,116 2.372 1995 5,021,830 11,905,794 2.371 1996 5,411,820 12,863,532 2.377 1997 5,750,780 13,450,964 2.339 1998 5,736,650 13,465,957 2.347 1999 6,365,610 15,231,610 2.393 2000 7,225,020 16,483,608 2.281 2001 6,603,320 15,188,607 2.300 2002 6,207,930 14,848,546 2.392 2003 6,390,140 15,295,811 2.394 2004 7,074,980 16,680,071 2.358 2005 7,609,360 16,987,530 2.232 2006 7,643,820 16,334,138 2.137 2007 7,857,050 15,903,109 2.024 1.449 2008 7,291,815 15,087,389 2.069 1.448
2010 2.021 1.447
2015 1.999 1.438
2020 1.978 1.428
2025 1.956 1.419
2030 1.924 1.405
(a) Table 2. (b) Table 3. (c) Assumed to change at same rate as US rate. (d) Table E.1.
Sources: As noted and HNTB analysis.
MINNEAPOLIS-ST PAUL INTERNATIONAL AIRPORT
Forecast of Domestic Hubbing Ratio
Table E.2
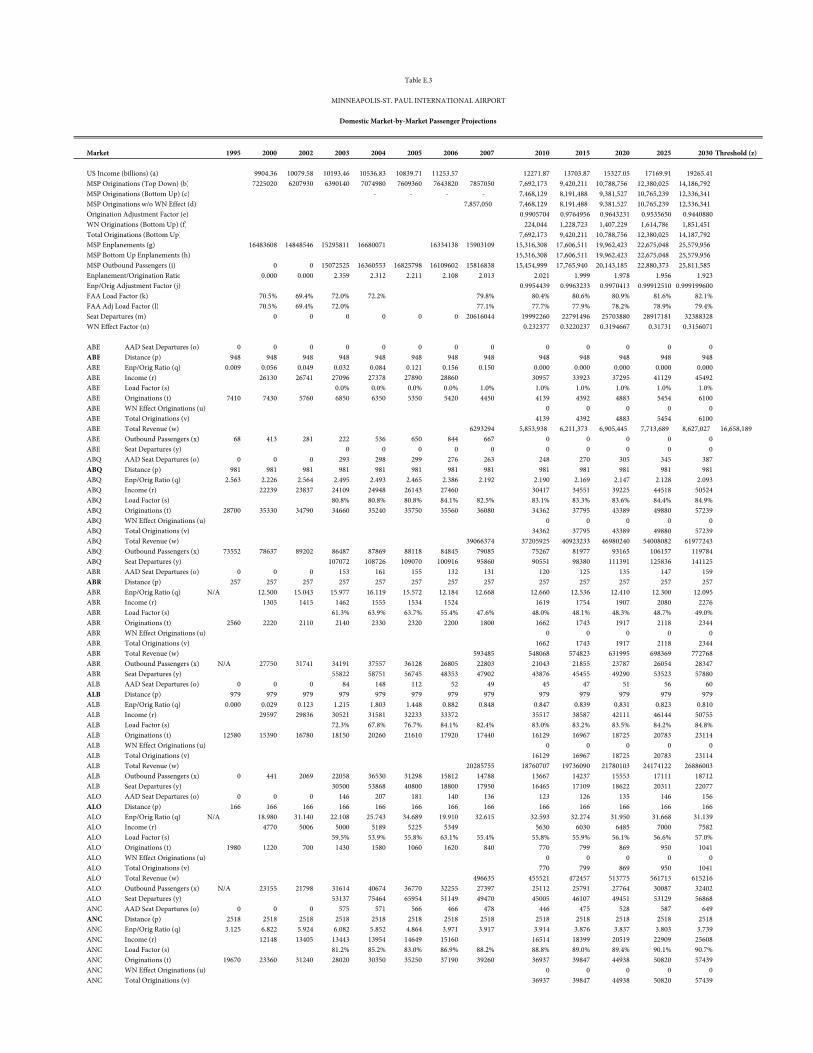
Market 1995 2000 2002 2003 2004 2005 2006 2007 2010 2015 2020 2025 2030 Threshold (z)
US Income (billions) (a) 9904.36 10079.58 10193.46 10536.83 10839.71 11253.57 12271.87 13703.87 15327.05 17169.91 19265.41MSP Originations (Top Down) (b) 7225020 6207930 6390140 7074980 7609360 7643820 7857050 7,692,173 9,420,211 10,788,756 12,380,025 14,186,792MSP Originations (Bottom Up) (c) - - - - 7,468,129 8,191,488 9,381,527 10,765,239 12,336,341MSP Originations w/o WN Effect (d) 7,857,050 7,468,129 8,191,488 9,381,527 10,765,239 12,336,341Origination Adjustment Factor (e) 0.9905704 0.9764956 0.9643231 0.9535650 0.9440880WN Originations (Bottom Up) (f) 224,044 1,228,723 1,407,229 1,614,786 1,851,451 Total Originations (Bottom Up) 7,692,173 9,420,211 10,788,756 12,380,025 14,187,792MSP Enplanements (g) 16483608 14848546 15295811 16680071 16334138 15903109 15,316,308 17,606,511 19,962,423 22,675,048 25,579,956MSP Bottom Up Enplanements (h) 15,316,308 17,606,511 19,962,423 22,675,048 25,579,956MSP Outbound Passengers (i) 0 0 15072525 16360553 16825798 16109602 15816838 15,454,999 17,765,940 20,143,185 22,880,373 25,811,585Enplanement/Origination Ratio 0.000 0.000 2.359 2.312 2.211 2.108 2.013 2.021 1.999 1.978 1.956 1.923Enp/Orig Adjustment Factor (j) 0.9954439 0.9963233 0.9970413 0.99912510 0.999199600FAA Load Factor (k) 70.5% 69.4% 72.0% 72.2% 79.8% 80.4% 80.6% 80.9% 81.6% 82.1%FAA Adj Load Factor (l) 70.5% 69.4% 72.0% 77.1% 77.7% 77.9% 78.2% 78.9% 79.4%Seat Departures (m) 0 0 0 0 0 0 20616044 19992260 22791496 25703880 28917181 32388328WN Effect Factor (n) 0.232377 0.3220237 0.3194667 0.31731 0.3156071
ABE AAD Seat Departures (o) 0 0 0 0 0 0 0 0 0 0 0 0 0ABE Distance (p) 948 948 948 948 948 948 948 948 948 948 948 948 948ABE Enp/Orig Ratio (q) 0.009 0.056 0.049 0.032 0.084 0.121 0.156 0.150 0.000 0.000 0.000 0.000 0.000ABE Income (r) 26130 26741 27096 27378 27890 28860 30957 33923 37295 41129 45492ABE Load Factor (s) 0.0% 0.0% 0.0% 0.0% 1.0% 1.0% 1.0% 1.0% 1.0% 1.0%ABE Originations (t) 7410 7430 5760 6850 6350 5350 5420 4450 4139 4392 4883 5454 6100ABE WN Effect Originations (u) 0 0 0 0 0ABE Total Originations (v) 4139 4392 4883 5454 6100ABE Total Revenue (w) 6293294 5,853,938 6,211,373 6,905,445 7,713,689 8,627,027 16,658,189ABE Outbound Passengers (x) 68 413 281 222 536 650 844 667 0 0 0 0 0ABE Seat Departures (y) 0 0 0 0 0 0 0 0 0 0ABQ AAD Seat Departures (o) 0 0 0 293 298 299 276 263 248 270 305 345 387ABQ Distance (p) 981 981 981 981 981 981 981 981 981 981 981 981 981ABQ Enp/Orig Ratio (q) 2.563 2.226 2.564 2.495 2.493 2.465 2.386 2.192 2.190 2.169 2.147 2.128 2.093ABQ Income (r) 22239 23837 24109 24948 26143 27460 30417 34551 39225 44518 50524ABQ Load Factor (s) 80.8% 80.8% 80.8% 84.1% 82.5% 83.1% 83.3% 83.6% 84.4% 84.9%ABQ Originations (t) 28700 35330 34790 34660 35240 35750 35560 36080 34362 37795 43389 49880 57239ABQ WN Effect Originations (u) 0 0 0 0 0ABQ Total Originations (v) 34362 37795 43389 49880 57239ABQ Total Revenue (w) 39066374 37205925 40923233 46980240 54008082 61977243ABQ Outbound Passengers (x) 73552 78637 89202 86487 87869 88118 84845 79085 75267 81977 93165 106157 119784ABQ Seat Departures (y) 107072 108726 109070 100916 95860 90551 98380 111391 125836 141125ABR AAD Seat Departures (o) 0 0 0 153 161 155 132 131 120 125 135 147 159ABR Distance (p) 257 257 257 257 257 257 257 257 257 257 257 257 257ABR Enp/Orig Ratio (q) N/A 12.500 15.043 15.977 16.119 15.572 12.184 12.668 12.660 12.536 12.410 12.300 12.095ABR Income (r) 1305 1415 1462 1555 1534 1524 1619 1754 1907 2080 2276ABR Load Factor (s) 61.3% 63.9% 63.7% 55.4% 47.6% 48.0% 48.1% 48.3% 48.7% 49.0%ABR Originations (t) 2560 2220 2110 2140 2330 2320 2200 1800 1662 1743 1917 2118 2344ABR WN Effect Originations (u) 0 0 0 0 0ABR Total Originations (v) 1662 1743 1917 2118 2344ABR Total Revenue (w) 593485 548068 574823 631995 698369 772768ABR Outbound Passengers (x) N/A 27750 31741 34191 37557 36128 26805 22803 21043 21855 23787 26054 28347ABR Seat Departures (y) 55822 58751 56745 48353 47902 43876 45455 49290 53523 57880ALB AAD Seat Departures (o) 0 0 0 84 148 112 52 49 45 47 51 56 60ALB Distance (p) 979 979 979 979 979 979 979 979 979 979 979 979 979ALB Enp/Orig Ratio (q) 0.000 0.029 0.123 1.215 1.803 1.448 0.882 0.848 0.847 0.839 0.831 0.823 0.810ALB Income (r) 29597 29836 30521 31581 32233 33372 35517 38587 42111 46144 50755ALB Load Factor (s) 72.3% 67.8% 76.7% 84.1% 82.4% 83.0% 83.2% 83.5% 84.2% 84.8%ALB Originations (t) 12580 15390 16780 18150 20260 21610 17920 17440 16129 16967 18725 20783 23114ALB WN Effect Originations (u) 0 0 0 0 0ALB Total Originations (v) 16129 16967 18725 20783 23114ALB Total Revenue (w) 20285755 18760707 19736090 21780103 24174122 26886003ALB Outbound Passengers (x) 0 441 2069 22058 36530 31298 15812 14788 13667 14237 15553 17111 18712ALB Seat Departures (y) 30500 53868 40800 18800 17950 16465 17109 18622 20311 22077ALO AAD Seat Departures (o) 0 0 0 146 207 181 140 136 123 126 135 146 156ALO Distance (p) 166 166 166 166 166 166 166 166 166 166 166 166 166ALO Enp/Orig Ratio (q) N/A 18.980 31.140 22.108 25.743 34.689 19.910 32.615 32.593 32.274 31.950 31.668 31.139ALO Income (r) 4770 5006 5000 5189 5225 5349 5630 6030 6485 7000 7582ALO Load Factor (s) 59.5% 53.9% 55.8% 63.1% 55.4% 55.8% 55.9% 56.1% 56.6% 57.0%ALO Originations (t) 1980 1220 700 1430 1580 1060 1620 840 770 799 869 950 1041ALO WN Effect Originations (u) 0 0 0 0 0ALO Total Originations (v) 770 799 869 950 1041ALO Total Revenue (w) 496635 455521 472457 513775 561713 615216ALO Outbound Passengers (x) N/A 23155 21798 31614 40674 36770 32255 27397 25112 25791 27764 30087 32402ALO Seat Departures (y) 53137 75464 65954 51149 49470 45005 46107 49451 53129 56868ANC AAD Seat Departures (o) 0 0 0 575 571 566 466 478 446 475 528 587 649ANC Distance (p) 2518 2518 2518 2518 2518 2518 2518 2518 2518 2518 2518 2518 2518ANC Enp/Orig Ratio (q) 3.125 6.822 5.924 6.082 5.852 4.864 3.971 3.917 3.914 3.876 3.837 3.803 3.739ANC Income (r) 12148 13405 13443 13954 14649 15160 16514 18399 20519 22909 25608ANC Load Factor (s) 81.2% 85.2% 83.0% 86.9% 88.2% 88.8% 89.0% 89.4% 90.1% 90.7%ANC Originations (t) 19670 23360 31240 28020 30350 35250 37190 39260 36937 39847 44938 50820 57439ANC WN Effect Originations (u) 0 0 0 0 0ANC Total Originations (v) 36937 39847 44938 50820 57439
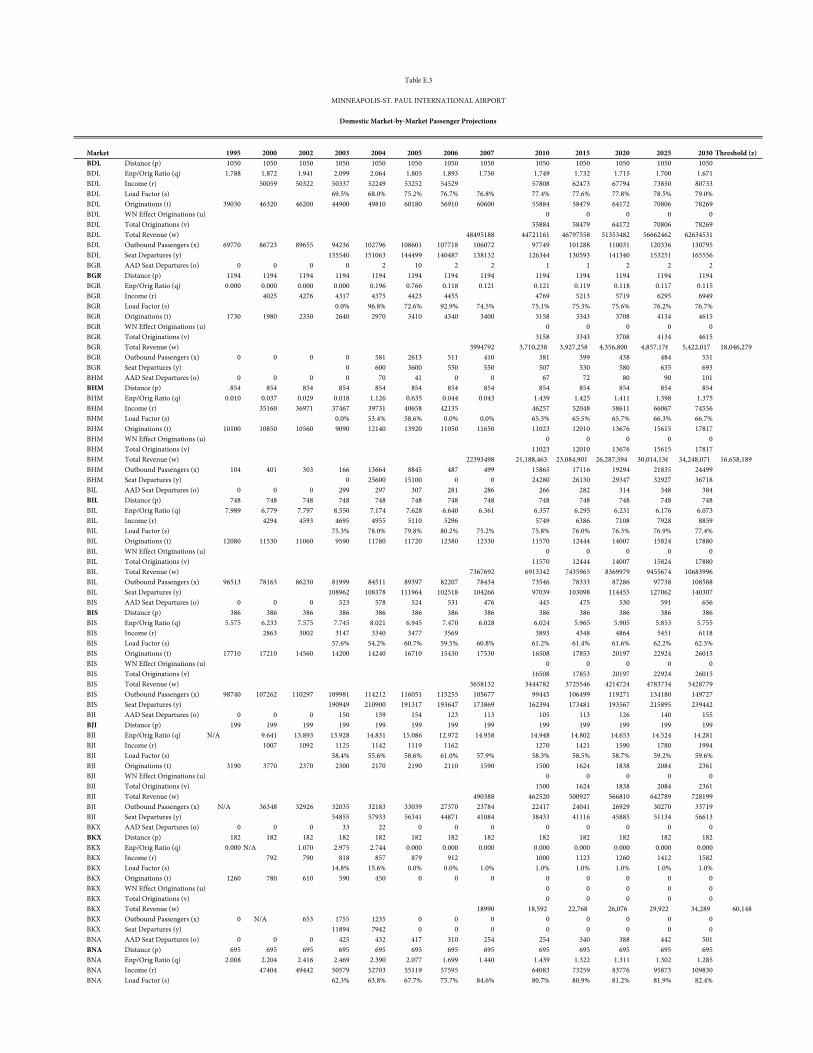
Table E.3
MINNEAPOLIS-ST. PAUL INTERNATIONAL AIRPORT
Domestic Market-by-Market Passenger Projections
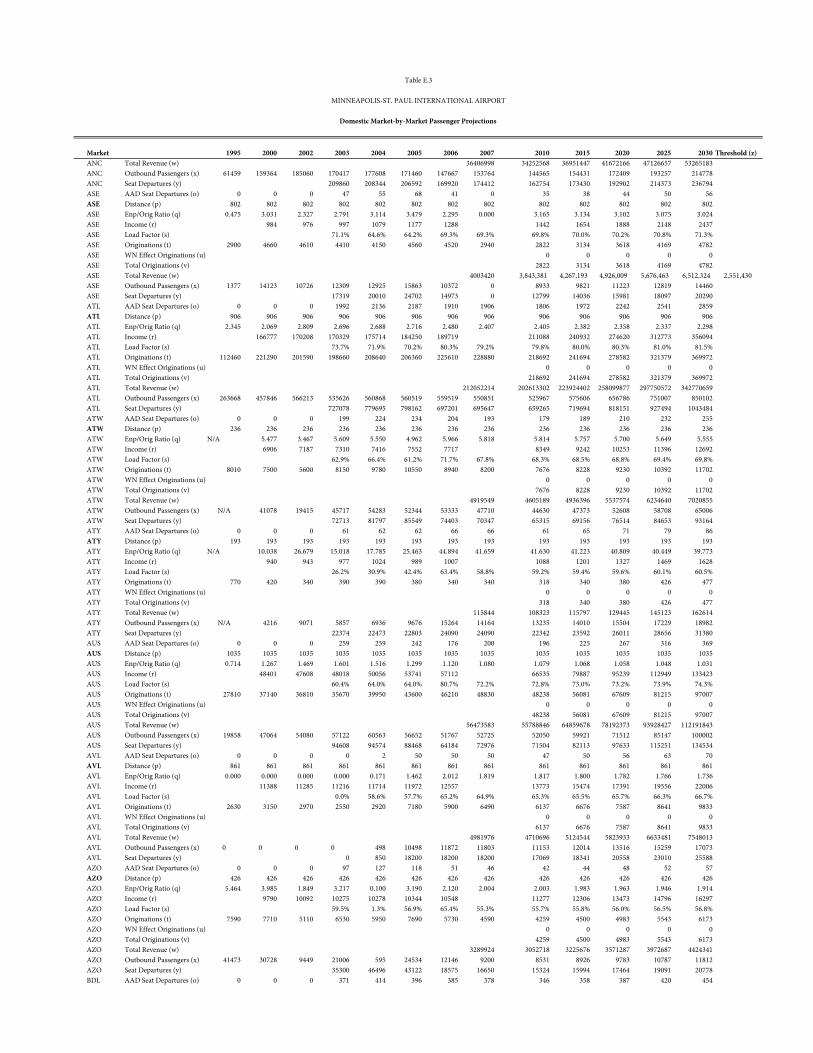
Market 1995 2000 2002 2003 2004 2005 2006 2007 2010 2015 2020 2025 2030 Threshold (z)
Table E.3
MINNEAPOLIS-ST. PAUL INTERNATIONAL AIRPORT
Domestic Market-by-Market Passenger Projections
ANC Total Revenue (w) 36406998 34252568 36951447 41672166 47126657 53265183ANC Outbound Passengers (x) 61459 159364 185060 170417 177608 171460 147667 153764 144565 154431 172409 193257 214778ANC Seat Departures (y) 209860 208344 206592 169920 174412 162754 173430 192902 214373 236794ASE AAD Seat Departures (o) 0 0 0 47 55 68 41 0 35 38 44 50 56ASE Distance (p) 802 802 802 802 802 802 802 802 802 802 802 802 802ASE Enp/Orig Ratio (q) 0.475 3.031 2.327 2.791 3.114 3.479 2.295 0.000 3.165 3.134 3.102 3.075 3.024ASE Income (r) 984 976 997 1079 1177 1288 1442 1654 1888 2148 2437ASE Load Factor (s) 71.1% 64.6% 64.2% 69.3% 69.3% 69.8% 70.0% 70.2% 70.8% 71.3%ASE Originations (t) 2900 4660 4610 4410 4150 4560 4520 2940 2822 3134 3618 4169 4782ASE WN Effect Originations (u) 0 0 0 0 0ASE Total Originations (v) 2822 3134 3618 4169 4782ASE Total Revenue (w) 4003420 3,843,381 4,267,193 4,926,009 5,676,463 6,512,324 2,551,430 ASE Outbound Passengers (x) 1377 14123 10726 12309 12925 15863 10372 0 8933 9821 11223 12819 14460ASE Seat Departures (y) 17319 20010 24702 14973 0 12799 14036 15981 18097 20290ATL AAD Seat Departures (o) 0 0 0 1992 2136 2187 1910 1906 1806 1972 2242 2541 2859ATL Distance (p) 906 906 906 906 906 906 906 906 906 906 906 906 906ATL Enp/Orig Ratio (q) 2.345 2.069 2.809 2.696 2.688 2.716 2.480 2.407 2.405 2.382 2.358 2.337 2.298ATL Income (r) 166777 170208 170329 175714 184250 189719 211088 240932 274620 312773 356094ATL Load Factor (s) 73.7% 71.9% 70.2% 80.3% 79.2% 79.8% 80.0% 80.3% 81.0% 81.5%ATL Originations (t) 112460 221290 201590 198660 208640 206360 225610 228880 218692 241694 278582 321379 369972ATL WN Effect Originations (u) 0 0 0 0 0ATL Total Originations (v) 218692 241694 278582 321379 369972ATL Total Revenue (w) 212052214 202613302 223924402 258099877 297750572 342770659ATL Outbound Passengers (x) 263668 457846 566213 535626 560868 560519 559519 550851 525967 575606 656786 751007 850102ATL Seat Departures (y) 727078 779695 798162 697201 695647 659265 719694 818151 927494 1043484ATW AAD Seat Departures (o) 0 0 0 199 224 234 204 193 179 189 210 232 255ATW Distance (p) 236 236 236 236 236 236 236 236 236 236 236 236 236ATW Enp/Orig Ratio (q) N/A 5.477 3.467 5.609 5.550 4.962 5.966 5.818 5.814 5.757 5.700 5.649 5.555ATW Income (r) 6906 7187 7310 7416 7552 7717 8349 9242 10253 11396 12692ATW Load Factor (s) 62.9% 66.4% 61.2% 71.7% 67.8% 68.3% 68.5% 68.8% 69.4% 69.8%ATW Originations (t) 8010 7500 5600 8150 9780 10550 8940 8200 7676 8228 9230 10392 11702ATW WN Effect Originations (u) 0 0 0 0 0ATW Total Originations (v) 7676 8228 9230 10392 11702ATW Total Revenue (w) 4919549 4605189 4936396 5537574 6234640 7020855ATW Outbound Passengers (x) N/A 41078 19415 45717 54283 52344 53333 47710 44630 47373 52608 58708 65006ATW Seat Departures (y) 72713 81797 85549 74403 70347 65315 69156 76514 84653 93164ATY AAD Seat Departures (o) 0 0 0 61 62 62 66 66 61 65 71 79 86ATY Distance (p) 193 193 193 193 193 193 193 193 193 193 193 193 193ATY Enp/Orig Ratio (q) N/A 10.038 26.679 15.018 17.785 25.463 44.894 41.659 41.630 41.223 40.809 40.449 39.773ATY Income (r) 940 943 977 1024 989 1007 1088 1201 1327 1469 1628ATY Load Factor (s) 26.2% 30.9% 42.4% 63.4% 58.8% 59.2% 59.4% 59.6% 60.1% 60.5%ATY Originations (t) 770 420 340 390 390 380 340 340 318 340 380 426 477ATY WN Effect Originations (u) 0 0 0 0 0ATY Total Originations (v) 318 340 380 426 477ATY Total Revenue (w) 115844 108323 115797 129445 145123 162614ATY Outbound Passengers (x) N/A 4216 9071 5857 6936 9676 15264 14164 13235 14010 15504 17229 18982ATY Seat Departures (y) 22374 22473 22803 24090 24090 22342 23592 26011 28656 31380AUS AAD Seat Departures (o) 0 0 0 259 259 242 176 200 196 225 267 316 369AUS Distance (p) 1035 1035 1035 1035 1035 1035 1035 1035 1035 1035 1035 1035 1035AUS Enp/Orig Ratio (q) 0.714 1.267 1.469 1.601 1.516 1.299 1.120 1.080 1.079 1.068 1.058 1.048 1.031AUS Income (r) 48401 47608 48018 50056 53741 57112 66535 79887 95239 112949 133423AUS Load Factor (s) 60.4% 64.0% 64.0% 80.7% 72.2% 72.8% 73.0% 73.2% 73.9% 74.3%AUS Originations (t) 27810 37140 36810 35670 39950 43600 46210 48830 48238 56081 67609 81215 97007AUS WN Effect Originations (u) 0 0 0 0 0AUS Total Originations (v) 48238 56081 67609 81215 97007AUS Total Revenue (w) 56473583 55788846 64859678 78192373 93928427 112191843AUS Outbound Passengers (x) 19858 47064 54080 57122 60563 56652 51767 52725 52050 59921 71512 85147 100002AUS Seat Departures (y) 94608 94574 88468 64184 72976 71504 82113 97633 115251 134534AVL AAD Seat Departures (o) 0 0 0 0 2 50 50 50 47 50 56 63 70AVL Distance (p) 861 861 861 861 861 861 861 861 861 861 861 861 861AVL Enp/Orig Ratio (q) 0.000 0.000 0.000 0.000 0.171 1.462 2.012 1.819 1.817 1.800 1.782 1.766 1.736AVL Income (r) 11388 11285 11216 11714 11972 12557 13773 15474 17391 19556 22006AVL Load Factor (s) 0.0% 58.6% 57.7% 65.2% 64.9% 65.3% 65.5% 65.7% 66.3% 66.7%AVL Originations (t) 2630 3150 2970 2550 2920 7180 5900 6490 6137 6676 7587 8641 9833AVL WN Effect Originations (u) 0 0 0 0 0AVL Total Originations (v) 6137 6676 7587 8641 9833AVL Total Revenue (w) 4981976 4710696 5124544 5823933 6633481 7548013AVL Outbound Passengers (x) 0 0 0 0 498 10498 11872 11803 11153 12014 13516 15259 17073AVL Seat Departures (y) 0 850 18200 18200 18200 17069 18341 20558 23010 25588AZO AAD Seat Departures (o) 0 0 0 97 127 118 51 46 42 44 48 52 57AZO Distance (p) 426 426 426 426 426 426 426 426 426 426 426 426 426AZO Enp/Orig Ratio (q) 5.464 3.985 1.849 3.217 0.100 3.190 2.120 2.004 2.003 1.983 1.963 1.946 1.914AZO Income (r) 9790 10092 10275 10278 10344 10548 11277 12306 13473 14796 16297AZO Load Factor (s) 59.5% 1.3% 56.9% 65.4% 55.3% 55.7% 55.8% 56.0% 56.5% 56.8%AZO Originations (t) 7590 7710 5110 6530 5950 7690 5730 4590 4259 4500 4983 5543 6173AZO WN Effect Originations (u) 0 0 0 0 0AZO Total Originations (v) 4259 4500 4983 5543 6173AZO Total Revenue (w) 3289924 3052718 3225676 3571287 3972687 4424341AZO Outbound Passengers (x) 41473 30728 9449 21006 595 24534 12146 9200 8531 8926 9783 10787 11812AZO Seat Departures (y) 35300 46496 43122 18575 16650 15324 15994 17464 19091 20778BDL AAD Seat Departures (o) 0 0 0 371 414 396 385 378 346 358 387 420 454
Market 1995 2000 2002 2003 2004 2005 2006 2007 2010 2015 2020 2025 2030 Threshold (z)
Table E.3
MINNEAPOLIS-ST. PAUL INTERNATIONAL AIRPORT
Domestic Market-by-Market Passenger Projections
BDL Distance (p) 1050 1050 1050 1050 1050 1050 1050 1050 1050 1050 1050 1050 1050BDL Enp/Orig Ratio (q) 1.788 1.872 1.941 2.099 2.064 1.805 1.893 1.750 1.749 1.732 1.715 1.700 1.671BDL Income (r) 50059 50322 50337 52249 53252 54529 57808 62473 67794 73850 80733BDL Load Factor (s) 69.5% 68.0% 75.2% 76.7% 76.8% 77.4% 77.6% 77.8% 78.5% 79.0%BDL Originations (t) 39030 46320 46200 44900 49810 60180 56910 60600 55884 58479 64172 70806 78269BDL WN Effect Originations (u) 0 0 0 0 0BDL Total Originations (v) 55884 58479 64172 70806 78269BDL Total Revenue (w) 48495188 44721161 46797558 51353482 56662462 62634531BDL Outbound Passengers (x) 69770 86723 89655 94236 102796 108601 107718 106072 97749 101288 110031 120336 130795BDL Seat Departures (y) 135540 151063 144499 140487 138132 126344 130593 141340 153251 165556BGR AAD Seat Departures (o) 0 0 0 0 2 10 2 2 1 1 2 2 2BGR Distance (p) 1194 1194 1194 1194 1194 1194 1194 1194 1194 1194 1194 1194 1194BGR Enp/Orig Ratio (q) 0.000 0.000 0.000 0.000 0.196 0.766 0.118 0.121 0.121 0.119 0.118 0.117 0.115BGR Income (r) 4025 4276 4317 4375 4423 4455 4769 5213 5719 6295 6949BGR Load Factor (s) 0.0% 96.8% 72.6% 92.9% 74.5% 75.1% 75.3% 75.6% 76.2% 76.7%BGR Originations (t) 1730 1980 2350 2640 2970 3410 4340 3400 3158 3343 3708 4134 4615BGR WN Effect Originations (u) 0 0 0 0 0BGR Total Originations (v) 3158 3343 3708 4134 4615BGR Total Revenue (w) 3994792 3,710,238 3,927,258 4,356,800 4,857,176 5,422,017 18,046,279BGR Outbound Passengers (x) 0 0 0 0 581 2613 511 410 381 399 438 484 531BGR Seat Departures (y) 0 600 3600 550 550 507 530 580 635 693BHM AAD Seat Departures (o) 0 0 0 0 70 41 0 0 67 72 80 90 101BHM Distance (p) 854 854 854 854 854 854 854 854 854 854 854 854 854BHM Enp/Orig Ratio (q) 0.010 0.037 0.029 0.018 1.126 0.635 0.044 0.043 1.439 1.425 1.411 1.398 1.375BHM Income (r) 35160 36971 37467 39731 40658 42135 46257 52048 58611 66067 74556BHM Load Factor (s) 0.0% 53.4% 58.6% 0.0% 0.0% 65.3% 65.5% 65.7% 66.3% 66.7%BHM Originations (t) 10100 10850 10560 9090 12140 13920 11050 11650 11023 12010 13676 15615 17817BHM WN Effect Originations (u) 0 0 0 0 0BHM Total Originations (v) 11023 12010 13676 15615 17817BHM Total Revenue (w) 22393498 21,188,463 23,084,901 26,287,594 30,014,136 34,248,071 16,658,189BHM Outbound Passengers (x) 104 401 303 166 13664 8845 487 499 15865 17116 19294 21835 24499BHM Seat Departures (y) 0 25600 15100 0 0 24280 26130 29347 32927 36718BIL AAD Seat Departures (o) 0 0 0 299 297 307 281 286 266 282 314 348 384BIL Distance (p) 748 748 748 748 748 748 748 748 748 748 748 748 748BIL Enp/Orig Ratio (q) 7.989 6.779 7.797 8.550 7.174 7.628 6.640 6.361 6.357 6.295 6.231 6.176 6.073BIL Income (r) 4294 4593 4695 4955 5110 5296 5749 6386 7108 7928 8859BIL Load Factor (s) 75.3% 78.0% 79.8% 80.2% 75.2% 75.8% 76.0% 76.3% 76.9% 77.4%BIL Originations (t) 12080 11530 11060 9590 11780 11720 12380 12330 11570 12444 14007 15824 17880BIL WN Effect Originations (u) 0 0 0 0 0BIL Total Originations (v) 11570 12444 14007 15824 17880BIL Total Revenue (w) 7367692 6913342 7435965 8369979 9455674 10683996BIL Outbound Passengers (x) 96513 78163 86230 81999 84511 89397 82207 78434 73546 78333 87286 97738 108588BIL Seat Departures (y) 108962 108378 111964 102518 104266 97039 103098 114455 127062 140307BIS AAD Seat Departures (o) 0 0 0 523 578 524 531 476 445 475 530 591 656BIS Distance (p) 386 386 386 386 386 386 386 386 386 386 386 386 386BIS Enp/Orig Ratio (q) 5.575 6.233 7.575 7.745 8.021 6.945 7.470 6.028 6.024 5.965 5.905 5.853 5.755BIS Income (r) 2863 3002 3147 3340 3477 3569 3893 4348 4864 5451 6118BIS Load Factor (s) 57.6% 54.2% 60.7% 59.5% 60.8% 61.2% 61.4% 61.6% 62.2% 62.5%BIS Originations (t) 17710 17210 14560 14200 14240 16710 15430 17530 16508 17853 20197 22924 26015BIS WN Effect Originations (u) 0 0 0 0 0BIS Total Originations (v) 16508 17853 20197 22924 26015BIS Total Revenue (w) 3658132 3444782 3725546 4214724 4783734 5428779BIS Outbound Passengers (x) 98740 107262 110297 109981 114212 116051 115255 105677 99445 106499 119271 134180 149727BIS Seat Departures (y) 190949 210900 191317 193647 173869 162394 173481 193567 215895 239442BJI AAD Seat Departures (o) 0 0 0 150 159 154 123 113 105 113 126 140 155BJI Distance (p) 199 199 199 199 199 199 199 199 199 199 199 199 199BJI Enp/Orig Ratio (q) N/A 9.641 13.893 13.928 14.831 15.086 12.972 14.958 14.948 14.802 14.653 14.524 14.281BJI Income (r) 1007 1092 1125 1142 1119 1162 1270 1421 1590 1780 1994BJI Load Factor (s) 58.4% 55.6% 58.6% 61.0% 57.9% 58.3% 58.5% 58.7% 59.2% 59.6%BJI Originations (t) 3190 3770 2370 2300 2170 2190 2110 1590 1500 1624 1838 2084 2361BJI WN Effect Originations (u) 0 0 0 0 0BJI Total Originations (v) 1500 1624 1838 2084 2361BJI Total Revenue (w) 490388 462520 500927 566810 642789 728199BJI Outbound Passengers (x) N/A 36348 32926 32035 32183 33039 27370 23784 22417 24041 26929 30270 33719BJI Seat Departures (y) 54855 57933 56341 44871 41084 38433 41116 45885 51134 56613BKX AAD Seat Departures (o) 0 0 0 33 22 0 0 0 0 0 0 0 0BKX Distance (p) 182 182 182 182 182 182 182 182 182 182 182 182 182BKX Enp/Orig Ratio (q) 0.000 N/A 1.070 2.975 2.744 0.000 0.000 0.000 0.000 0.000 0.000 0.000 0.000BKX Income (r) 792 790 818 857 879 912 1000 1123 1260 1412 1582BKX Load Factor (s) 14.8% 15.6% 0.0% 0.0% 1.0% 1.0% 1.0% 1.0% 1.0% 1.0%BKX Originations (t) 1260 780 610 590 450 0 0 0 0 0 0 0 0BKX WN Effect Originations (u) 0 0 0 0 0BKX Total Originations (v) 0 0 0 0 0BKX Total Revenue (w) 18990 18,592 22,768 26,076 29,922 34,289 60,148 BKX Outbound Passengers (x) 0 N/A 653 1755 1235 0 0 0 0 0 0 0 0BKX Seat Departures (y) 11894 7942 0 0 0 0 0 0 0 0BNA AAD Seat Departures (o) 0 0 0 425 432 417 310 254 254 340 388 442 501BNA Distance (p) 695 695 695 695 695 695 695 695 695 695 695 695 695BNA Enp/Orig Ratio (q) 2.008 2.204 2.416 2.469 2.390 2.077 1.699 1.440 1.439 1.322 1.311 1.302 1.285BNA Income (r) 47404 49442 50579 52703 55119 57595 64083 73259 83776 95873 109830BNA Load Factor (s) 62.3% 63.8% 67.7% 75.7% 84.6% 80.7% 80.9% 81.2% 81.9% 82.4%
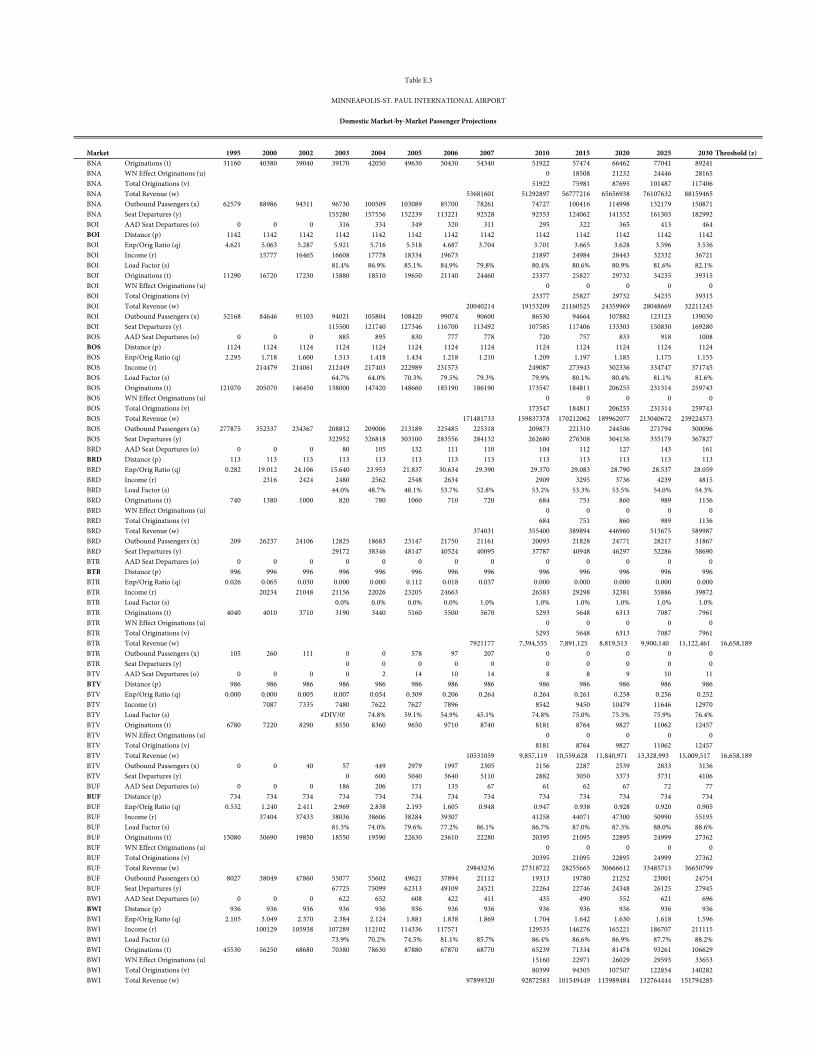
Market 1995 2000 2002 2003 2004 2005 2006 2007 2010 2015 2020 2025 2030 Threshold (z)
Table E.3
MINNEAPOLIS-ST. PAUL INTERNATIONAL AIRPORT
Domestic Market-by-Market Passenger Projections
BNA Originations (t) 31160 40380 39040 39170 42050 49630 50430 54340 51922 57474 66462 77041 89241BNA WN Effect Originations (u) 0 18508 21232 24446 28165BNA Total Originations (v) 51922 75981 87695 101487 117406BNA Total Revenue (w) 53681601 51292897 56777216 65656938 76107632 88159465BNA Outbound Passengers (x) 62579 88986 94311 96730 100509 103089 85700 78261 74727 100416 114998 132179 150871BNA Seat Departures (y) 155280 157556 152239 113221 92528 92553 124062 141552 161303 182992BOI AAD Seat Departures (o) 0 0 0 316 334 349 320 311 295 322 365 413 464BOI Distance (p) 1142 1142 1142 1142 1142 1142 1142 1142 1142 1142 1142 1142 1142BOI Enp/Orig Ratio (q) 4.621 5.063 5.287 5.921 5.716 5.518 4.687 3.704 3.701 3.665 3.628 3.596 3.536BOI Income (r) 15777 16465 16608 17778 18334 19673 21897 24984 28443 32332 36721BOI Load Factor (s) 81.4% 86.9% 85.1% 84.9% 79.8% 80.4% 80.6% 80.9% 81.6% 82.1%BOI Originations (t) 11290 16720 17230 15880 18510 19650 21140 24460 23377 25827 29732 34235 39315BOI WN Effect Originations (u) 0 0 0 0 0BOI Total Originations (v) 23377 25827 29732 34235 39315BOI Total Revenue (w) 20040214 19153209 21160525 24359969 28048669 32211245BOI Outbound Passengers (x) 52168 84646 91103 94021 105804 108420 99074 90600 86530 94664 107882 123123 139030BOI Seat Departures (y) 115500 121740 127346 116700 113492 107585 117406 133303 150830 169280BOS AAD Seat Departures (o) 0 0 0 885 895 830 777 778 720 757 833 918 1008BOS Distance (p) 1124 1124 1124 1124 1124 1124 1124 1124 1124 1124 1124 1124 1124BOS Enp/Orig Ratio (q) 2.295 1.718 1.600 1.513 1.418 1.434 1.218 1.210 1.209 1.197 1.185 1.175 1.155BOS Income (r) 214479 214061 212449 217403 222989 231573 249087 273943 302336 334747 371745BOS Load Factor (s) 64.7% 64.0% 70.3% 79.5% 79.3% 79.9% 80.1% 80.4% 81.1% 81.6%BOS Originations (t) 121070 205070 146450 138000 147420 148660 185190 186190 173547 184811 206255 231314 259743BOS WN Effect Originations (u) 0 0 0 0 0BOS Total Originations (v) 173547 184811 206255 231314 259743BOS Total Revenue (w) 171481733 159837378 170212062 189962077 213040672 239224573BOS Outbound Passengers (x) 277875 352337 234367 208812 209006 213189 225485 225318 209873 221310 244506 271794 300096BOS Seat Departures (y) 322952 326818 303100 283556 284132 262680 276308 304136 335179 367827BRD AAD Seat Departures (o) 0 0 0 80 105 132 111 110 104 112 127 143 161BRD Distance (p) 113 113 113 113 113 113 113 113 113 113 113 113 113BRD Enp/Orig Ratio (q) 0.282 19.012 24.106 15.640 23.953 21.837 30.634 29.390 29.370 29.083 28.790 28.537 28.059BRD Income (r) 2316 2424 2480 2562 2548 2634 2909 3295 3736 4239 4815BRD Load Factor (s) 44.0% 48.7% 48.1% 53.7% 52.8% 53.2% 53.3% 53.5% 54.0% 54.3%BRD Originations (t) 740 1380 1000 820 780 1060 710 720 684 751 860 989 1136BRD WN Effect Originations (u) 0 0 0 0 0BRD Total Originations (v) 684 751 860 989 1136BRD Total Revenue (w) 374031 355400 389894 446960 513675 589987BRD Outbound Passengers (x) 209 26237 24106 12825 18683 23147 21750 21161 20093 21828 24771 28217 31867BRD Seat Departures (y) 29172 38346 48147 40524 40095 37787 40948 46297 52286 58690BTR AAD Seat Departures (o) 0 0 0 0 0 0 0 0 0 0 0 0 0BTR Distance (p) 996 996 996 996 996 996 996 996 996 996 996 996 996BTR Enp/Orig Ratio (q) 0.026 0.065 0.030 0.000 0.000 0.112 0.018 0.037 0.000 0.000 0.000 0.000 0.000BTR Income (r) 20234 21048 21156 22026 23205 24663 26583 29298 32381 35886 39872BTR Load Factor (s) 0.0% 0.0% 0.0% 0.0% 1.0% 1.0% 1.0% 1.0% 1.0% 1.0%BTR Originations (t) 4040 4010 3710 3190 3440 5160 5500 5670 5293 5648 6313 7087 7961BTR WN Effect Originations (u) 0 0 0 0 0BTR Total Originations (v) 5293 5648 6313 7087 7961BTR Total Revenue (w) 7921177 7,394,555 7,891,125 8,819,513 9,900,140 11,122,461 16,658,189BTR Outbound Passengers (x) 105 260 111 0 0 578 97 207 0 0 0 0 0BTR Seat Departures (y) 0 0 0 0 0 0 0 0 0 0BTV AAD Seat Departures (o) 0 0 0 0 2 14 10 14 8 8 9 10 11BTV Distance (p) 986 986 986 986 986 986 986 986 986 986 986 986 986BTV Enp/Orig Ratio (q) 0.000 0.000 0.005 0.007 0.054 0.309 0.206 0.264 0.264 0.261 0.258 0.256 0.252BTV Income (r) 7087 7335 7480 7622 7627 7896 8542 9450 10479 11646 12970BTV Load Factor (s) #DIV/0! 74.8% 59.1% 54.9% 45.1% 74.8% 75.0% 75.3% 75.9% 76.4%BTV Originations (t) 6780 7220 8290 8550 8360 9650 9710 8740 8181 8764 9827 11062 12457BTV WN Effect Originations (u) 0 0 0 0 0BTV Total Originations (v) 8181 8764 9827 11062 12457BTV Total Revenue (w) 10531059 9,857,119 10,559,628 11,840,971 13,328,993 15,009,517 16,658,189BTV Outbound Passengers (x) 0 0 40 57 449 2979 1997 2305 2156 2287 2539 2833 3136BTV Seat Departures (y) 0 600 5040 3640 5110 2882 3050 3373 3731 4106BUF AAD Seat Departures (o) 0 0 0 186 206 171 135 67 61 62 67 72 77BUF Distance (p) 734 734 734 734 734 734 734 734 734 734 734 734 734BUF Enp/Orig Ratio (q) 0.532 1.240 2.411 2.969 2.838 2.193 1.605 0.948 0.947 0.938 0.928 0.920 0.905BUF Income (r) 37404 37433 38036 38606 38284 39307 41258 44071 47300 50990 55195BUF Load Factor (s) 81.3% 74.0% 79.6% 77.2% 86.1% 86.7% 87.0% 87.3% 88.0% 88.6%BUF Originations (t) 15080 30690 19850 18550 19590 22630 23610 22280 20395 21095 22895 24999 27362BUF WN Effect Originations (u) 0 0 0 0 0BUF Total Originations (v) 20395 21095 22895 24999 27362BUF Total Revenue (w) 29843236 27318722 28255665 30666612 33485713 36650799BUF Outbound Passengers (x) 8027 38049 47860 55077 55602 49621 37894 21112 19313 19780 21252 23001 24754BUF Seat Departures (y) 67725 75099 62313 49109 24521 22264 22746 24348 26125 27945BWI AAD Seat Departures (o) 0 0 0 622 652 608 422 411 435 490 552 621 696BWI Distance (p) 936 936 936 936 936 936 936 936 936 936 936 936 936BWI Enp/Orig Ratio (q) 2.105 3.049 2.370 2.384 2.124 1.881 1.838 1.869 1.704 1.642 1.630 1.618 1.596BWI Income (r) 100129 105938 107289 112102 114336 117571 129535 146276 165221 186707 211115BWI Load Factor (s) 73.9% 70.2% 74.5% 81.1% 85.7% 86.4% 86.6% 86.9% 87.7% 88.2%BWI Originations (t) 45530 56250 68680 70380 78630 87880 67870 68770 65239 71334 81478 93261 106629BWI WN Effect Originations (u) 15160 22971 26029 29593 33653BWI Total Originations (v) 80399 94305 107507 122854 140282BWI Total Revenue (w) 97899320 92872583 101549449 115989484 132764444 151794285
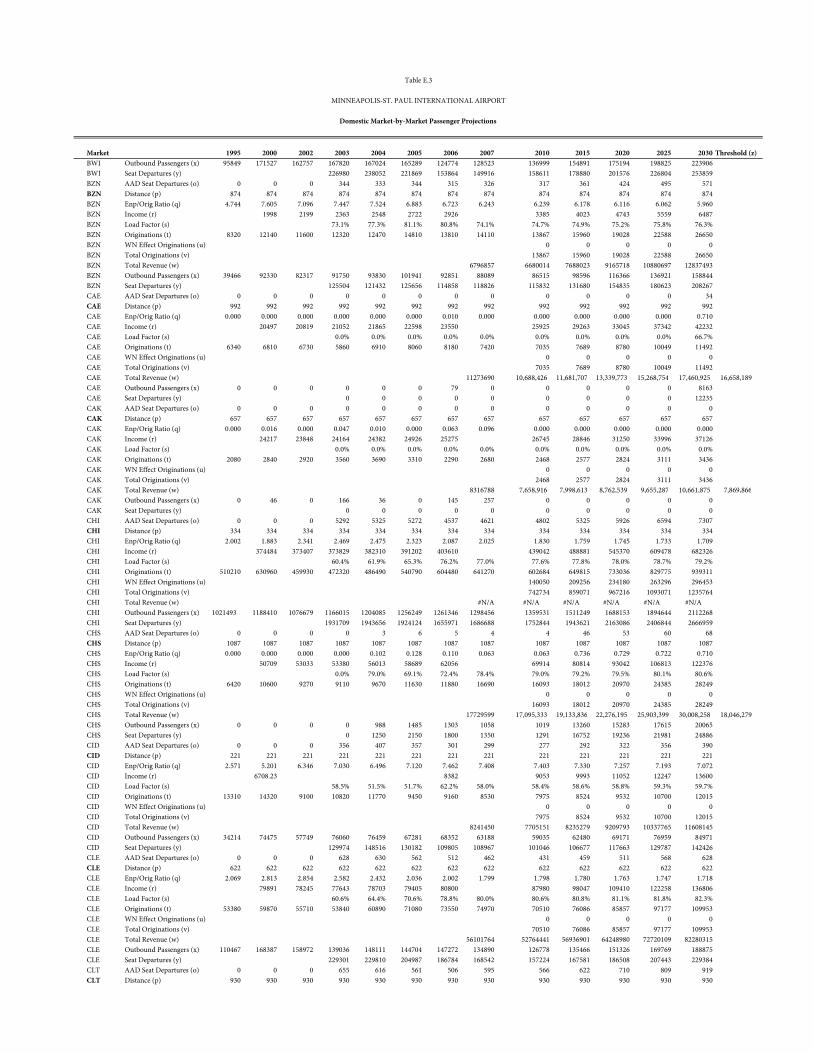
Market 1995 2000 2002 2003 2004 2005 2006 2007 2010 2015 2020 2025 2030 Threshold (z)
Table E.3
MINNEAPOLIS-ST. PAUL INTERNATIONAL AIRPORT
Domestic Market-by-Market Passenger Projections
BWI Outbound Passengers (x) 95849 171527 162757 167820 167024 165289 124774 128523 136999 154891 175194 198825 223906BWI Seat Departures (y) 226980 238052 221869 153864 149916 158611 178880 201576 226804 253859BZN AAD Seat Departures (o) 0 0 0 344 333 344 315 326 317 361 424 495 571BZN Distance (p) 874 874 874 874 874 874 874 874 874 874 874 874 874BZN Enp/Orig Ratio (q) 4.744 7.605 7.096 7.447 7.524 6.883 6.723 6.243 6.239 6.178 6.116 6.062 5.960BZN Income (r) 1998 2199 2363 2548 2722 2926 3385 4023 4743 5559 6487BZN Load Factor (s) 73.1% 77.3% 81.1% 80.8% 74.1% 74.7% 74.9% 75.2% 75.8% 76.3%BZN Originations (t) 8320 12140 11600 12320 12470 14810 13810 14110 13867 15960 19028 22588 26650BZN WN Effect Originations (u) 0 0 0 0 0BZN Total Originations (v) 13867 15960 19028 22588 26650BZN Total Revenue (w) 6796857 6680014 7688023 9165718 10880697 12837493BZN Outbound Passengers (x) 39466 92330 82317 91750 93830 101941 92851 88089 86515 98596 116366 136921 158844BZN Seat Departures (y) 125504 121432 125656 114858 118826 115832 131680 154835 180623 208267CAE AAD Seat Departures (o) 0 0 0 0 0 0 0 0 0 0 0 0 34CAE Distance (p) 992 992 992 992 992 992 992 992 992 992 992 992 992CAE Enp/Orig Ratio (q) 0.000 0.000 0.000 0.000 0.000 0.000 0.010 0.000 0.000 0.000 0.000 0.000 0.710CAE Income (r) 20497 20819 21052 21865 22598 23550 25925 29263 33045 37342 42232CAE Load Factor (s) 0.0% 0.0% 0.0% 0.0% 0.0% 0.0% 0.0% 0.0% 0.0% 66.7%CAE Originations (t) 6340 6810 6730 5860 6910 8060 8180 7420 7035 7689 8780 10049 11492CAE WN Effect Originations (u) 0 0 0 0 0CAE Total Originations (v) 7035 7689 8780 10049 11492CAE Total Revenue (w) 11273690 10,688,426 11,681,707 13,339,773 15,268,754 17,460,925 16,658,189CAE Outbound Passengers (x) 0 0 0 0 0 0 79 0 0 0 0 0 8163CAE Seat Departures (y) 0 0 0 0 0 0 0 0 0 12235CAK AAD Seat Departures (o) 0 0 0 0 0 0 0 0 0 0 0 0 0CAK Distance (p) 657 657 657 657 657 657 657 657 657 657 657 657 657CAK Enp/Orig Ratio (q) 0.000 0.016 0.000 0.047 0.010 0.000 0.063 0.096 0.000 0.000 0.000 0.000 0.000CAK Income (r) 24217 23848 24164 24382 24926 25275 26745 28846 31250 33996 37126CAK Load Factor (s) 0.0% 0.0% 0.0% 0.0% 0.0% 0.0% 0.0% 0.0% 0.0% 0.0%CAK Originations (t) 2080 2840 2920 3560 3690 3310 2290 2680 2468 2577 2824 3111 3436CAK WN Effect Originations (u) 0 0 0 0 0CAK Total Originations (v) 2468 2577 2824 3111 3436CAK Total Revenue (w) 8316788 7,658,916 7,998,613 8,762,539 9,655,287 10,661,875 7,869,866 CAK Outbound Passengers (x) 0 46 0 166 36 0 145 257 0 0 0 0 0CAK Seat Departures (y) 0 0 0 0 0 0 0 0 0 0CHI AAD Seat Departures (o) 0 0 0 5292 5325 5272 4537 4621 4802 5325 5926 6594 7307CHI Distance (p) 334 334 334 334 334 334 334 334 334 334 334 334 334CHI Enp/Orig Ratio (q) 2.002 1.883 2.341 2.469 2.475 2.323 2.087 2.025 1.830 1.759 1.745 1.733 1.709CHI Income (r) 374484 373407 373829 382310 391202 403610 439042 488881 545370 609478 682326CHI Load Factor (s) 60.4% 61.9% 65.3% 76.2% 77.0% 77.6% 77.8% 78.0% 78.7% 79.2%CHI Originations (t) 510210 630960 459930 472320 486490 540790 604480 641270 602684 649815 733036 829775 939311CHI WN Effect Originations (u) 140050 209256 234180 263296 296453CHI Total Originations (v) 742734 859071 967216 1093071 1235764CHI Total Revenue (w) #N/A #N/A #N/A #N/A #N/A #N/ACHI Outbound Passengers (x) 1021493 1188410 1076679 1166015 1204085 1256249 1261346 1298456 1359531 1511249 1688153 1894644 2112268CHI Seat Departures (y) 1931709 1943656 1924124 1655971 1686688 1752844 1943621 2163086 2406844 2666959CHS AAD Seat Departures (o) 0 0 0 0 3 6 5 4 4 46 53 60 68CHS Distance (p) 1087 1087 1087 1087 1087 1087 1087 1087 1087 1087 1087 1087 1087CHS Enp/Orig Ratio (q) 0.000 0.000 0.000 0.000 0.102 0.128 0.110 0.063 0.063 0.736 0.729 0.722 0.710CHS Income (r) 50709 53033 53380 56013 58689 62056 69914 80814 93042 106813 122376CHS Load Factor (s) 0.0% 79.0% 69.1% 72.4% 78.4% 79.0% 79.2% 79.5% 80.1% 80.6%CHS Originations (t) 6420 10600 9270 9110 9670 11630 11880 16690 16093 18012 20970 24385 28249CHS WN Effect Originations (u) 0 0 0 0 0CHS Total Originations (v) 16093 18012 20970 24385 28249CHS Total Revenue (w) 17729599 17,095,333 19,133,836 22,276,195 25,903,399 30,008,258 18,046,279CHS Outbound Passengers (x) 0 0 0 0 988 1485 1303 1058 1019 13260 15283 17615 20065CHS Seat Departures (y) 0 1250 2150 1800 1350 1291 16752 19236 21981 24886CID AAD Seat Departures (o) 0 0 0 356 407 357 301 299 277 292 322 356 390CID Distance (p) 221 221 221 221 221 221 221 221 221 221 221 221 221CID Enp/Orig Ratio (q) 2.571 5.201 6.346 7.030 6.496 7.120 7.462 7.408 7.403 7.330 7.257 7.193 7.072CID Income (r) 6708.23 8382 9053 9993 11052 12247 13600CID Load Factor (s) 58.5% 51.5% 51.7% 62.2% 58.0% 58.4% 58.6% 58.8% 59.3% 59.7%CID Originations (t) 13310 14320 9100 10820 11770 9450 9160 8530 7975 8524 9532 10700 12015CID WN Effect Originations (u) 0 0 0 0 0CID Total Originations (v) 7975 8524 9532 10700 12015CID Total Revenue (w) 8241450 7705151 8235279 9209793 10337765 11608145CID Outbound Passengers (x) 34214 74475 57749 76060 76459 67281 68352 63188 59035 62480 69171 76959 84971CID Seat Departures (y) 129974 148516 130182 109805 108967 101046 106677 117663 129787 142426CLE AAD Seat Departures (o) 0 0 0 628 630 562 512 462 431 459 511 568 628CLE Distance (p) 622 622 622 622 622 622 622 622 622 622 622 622 622CLE Enp/Orig Ratio (q) 2.069 2.813 2.854 2.582 2.432 2.036 2.002 1.799 1.798 1.780 1.763 1.747 1.718CLE Income (r) 79891 78245 77643 78703 79405 80800 87980 98047 109410 122258 136806CLE Load Factor (s) 60.6% 64.4% 70.6% 78.8% 80.0% 80.6% 80.8% 81.1% 81.8% 82.3%CLE Originations (t) 53380 59870 55710 53840 60890 71080 73550 74970 70510 76086 85857 97177 109953CLE WN Effect Originations (u) 0 0 0 0 0CLE Total Originations (v) 70510 76086 85857 97177 109953CLE Total Revenue (w) 56101764 52764441 56936901 64248980 72720109 82280315CLE Outbound Passengers (x) 110467 168387 158972 139036 148111 144704 147272 134890 126778 135466 151326 169769 188875CLE Seat Departures (y) 229301 229810 204987 186784 168542 157224 167581 186508 207443 229384CLT AAD Seat Departures (o) 0 0 0 655 616 561 506 595 566 622 710 809 919CLT Distance (p) 930 930 930 930 930 930 930 930 930 930 930 930 930
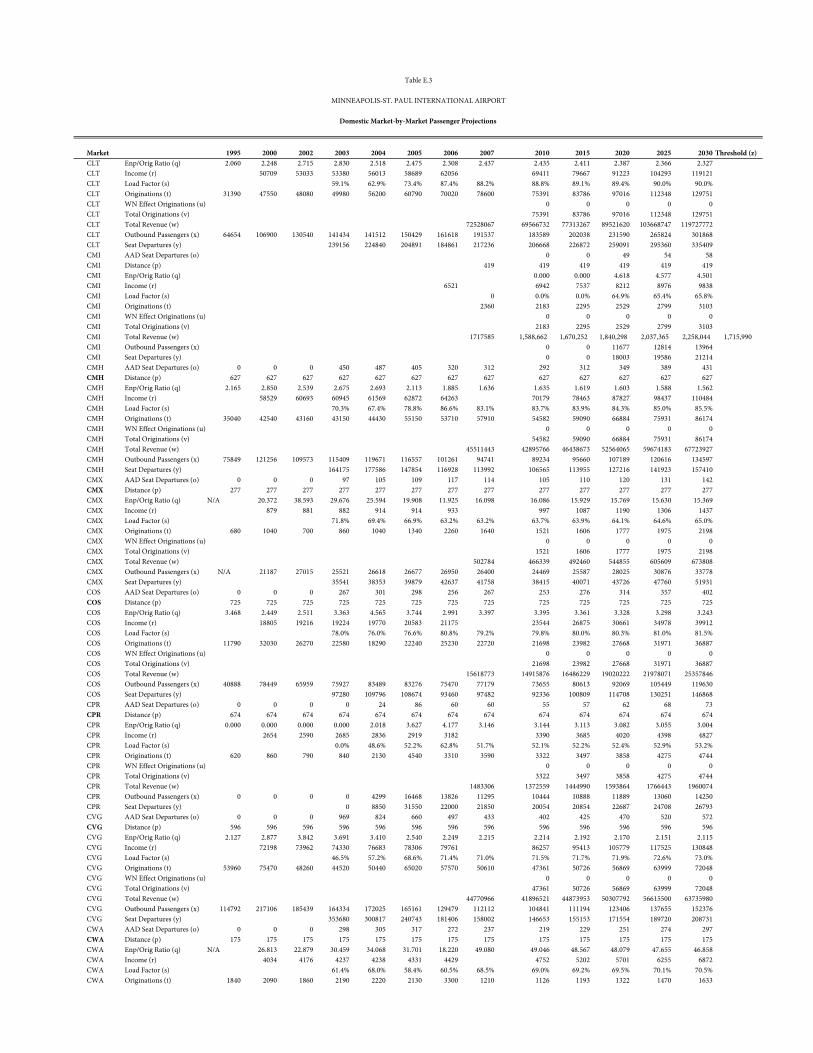
Market 1995 2000 2002 2003 2004 2005 2006 2007 2010 2015 2020 2025 2030 Threshold (z)
Table E.3
MINNEAPOLIS-ST. PAUL INTERNATIONAL AIRPORT
Domestic Market-by-Market Passenger Projections
CLT Enp/Orig Ratio (q) 2.060 2.248 2.715 2.830 2.518 2.475 2.308 2.437 2.435 2.411 2.387 2.366 2.327CLT Income (r) 50709 53033 53380 56013 58689 62056 69411 79667 91223 104293 119121CLT Load Factor (s) 59.1% 62.9% 73.4% 87.4% 88.2% 88.8% 89.1% 89.4% 90.0% 90.0%CLT Originations (t) 31390 47550 48080 49980 56200 60790 70020 78600 75391 83786 97016 112348 129751CLT WN Effect Originations (u) 0 0 0 0 0CLT Total Originations (v) 75391 83786 97016 112348 129751CLT Total Revenue (w) 72528067 69566732 77313267 89521620 103668747 119727772CLT Outbound Passengers (x) 64654 106900 130540 141434 141512 150429 161618 191537 183589 202038 231590 265824 301868CLT Seat Departures (y) 239156 224840 204891 184861 217236 206668 226872 259091 295360 335409CMI AAD Seat Departures (o) 0 0 49 54 58CMI Distance (p) 419 419 419 419 419 419CMI Enp/Orig Ratio (q) 0.000 0.000 4.618 4.577 4.501CMI Income (r) 6521 6942 7537 8212 8976 9838CMI Load Factor (s) 0 0.0% 0.0% 64.9% 65.4% 65.8%CMI Originations (t) 2360 2183 2295 2529 2799 3103CMI WN Effect Originations (u) 0 0 0 0 0CMI Total Originations (v) 2183 2295 2529 2799 3103CMI Total Revenue (w) 1717585 1,588,662 1,670,252 1,840,298 2,037,365 2,258,044 1,715,990 CMI Outbound Passengers (x) 0 0 11677 12814 13964CMI Seat Departures (y) 0 0 18003 19586 21214CMH AAD Seat Departures (o) 0 0 0 450 487 405 320 312 292 312 349 389 431CMH Distance (p) 627 627 627 627 627 627 627 627 627 627 627 627 627CMH Enp/Orig Ratio (q) 2.165 2.850 2.539 2.675 2.693 2.113 1.885 1.636 1.635 1.619 1.603 1.588 1.562CMH Income (r) 58529 60693 60945 61569 62872 64263 70179 78463 87827 98437 110484CMH Load Factor (s) 70.3% 67.4% 78.8% 86.6% 83.1% 83.7% 83.9% 84.3% 85.0% 85.5%CMH Originations (t) 35040 42540 43160 43150 44430 55150 53710 57910 54582 59090 66884 75931 86174CMH WN Effect Originations (u) 0 0 0 0 0CMH Total Originations (v) 54582 59090 66884 75931 86174CMH Total Revenue (w) 45511443 42895766 46438673 52564065 59674183 67723927CMH Outbound Passengers (x) 75849 121256 109573 115409 119671 116557 101261 94741 89234 95660 107189 120616 134597CMH Seat Departures (y) 164175 177586 147854 116928 113992 106565 113955 127216 141923 157410CMX AAD Seat Departures (o) 0 0 0 97 105 109 117 114 105 110 120 131 142CMX Distance (p) 277 277 277 277 277 277 277 277 277 277 277 277 277CMX Enp/Orig Ratio (q) N/A 20.372 38.593 29.676 25.594 19.908 11.925 16.098 16.086 15.929 15.769 15.630 15.369CMX Income (r) 879 881 882 914 914 933 997 1087 1190 1306 1437CMX Load Factor (s) 71.8% 69.4% 66.9% 63.2% 63.2% 63.7% 63.9% 64.1% 64.6% 65.0%CMX Originations (t) 680 1040 700 860 1040 1340 2260 1640 1521 1606 1777 1975 2198CMX WN Effect Originations (u) 0 0 0 0 0CMX Total Originations (v) 1521 1606 1777 1975 2198CMX Total Revenue (w) 502784 466339 492460 544855 605609 673808CMX Outbound Passengers (x) N/A 21187 27015 25521 26618 26677 26950 26400 24469 25587 28025 30876 33778CMX Seat Departures (y) 35541 38353 39879 42637 41758 38415 40071 43726 47760 51931COS AAD Seat Departures (o) 0 0 0 267 301 298 256 267 253 276 314 357 402COS Distance (p) 725 725 725 725 725 725 725 725 725 725 725 725 725COS Enp/Orig Ratio (q) 3.468 2.449 2.511 3.363 4.565 3.744 2.991 3.397 3.395 3.361 3.328 3.298 3.243COS Income (r) 18805 19216 19224 19770 20583 21175 23544 26875 30661 34978 39912COS Load Factor (s) 78.0% 76.0% 76.6% 80.8% 79.2% 79.8% 80.0% 80.3% 81.0% 81.5%COS Originations (t) 11790 32030 26270 22580 18290 22240 25230 22720 21698 23982 27668 31971 36887COS WN Effect Originations (u) 0 0 0 0 0COS Total Originations (v) 21698 23982 27668 31971 36887COS Total Revenue (w) 15618773 14915876 16486229 19020222 21978071 25357846COS Outbound Passengers (x) 40888 78449 65959 75927 83489 83276 75470 77179 73655 80613 92069 105449 119630COS Seat Departures (y) 97280 109796 108674 93460 97482 92336 100809 114708 130251 146868CPR AAD Seat Departures (o) 0 0 0 0 24 86 60 60 55 57 62 68 73CPR Distance (p) 674 674 674 674 674 674 674 674 674 674 674 674 674CPR Enp/Orig Ratio (q) 0.000 0.000 0.000 0.000 2.018 3.627 4.177 3.146 3.144 3.113 3.082 3.055 3.004CPR Income (r) 2654 2590 2685 2836 2919 3182 3390 3685 4020 4398 4827CPR Load Factor (s) 0.0% 48.6% 52.2% 62.8% 51.7% 52.1% 52.2% 52.4% 52.9% 53.2%CPR Originations (t) 620 860 790 840 2130 4540 3310 3590 3322 3497 3858 4275 4744CPR WN Effect Originations (u) 0 0 0 0 0CPR Total Originations (v) 3322 3497 3858 4275 4744CPR Total Revenue (w) 1483306 1372559 1444990 1593864 1766443 1960074CPR Outbound Passengers (x) 0 0 0 0 4299 16468 13826 11295 10444 10888 11889 13060 14250CPR Seat Departures (y) 0 8850 31550 22000 21850 20054 20854 22687 24708 26793CVG AAD Seat Departures (o) 0 0 0 969 824 660 497 433 402 425 470 520 572CVG Distance (p) 596 596 596 596 596 596 596 596 596 596 596 596 596CVG Enp/Orig Ratio (q) 2.127 2.877 3.842 3.691 3.410 2.540 2.249 2.215 2.214 2.192 2.170 2.151 2.115CVG Income (r) 72198 73962 74330 76683 78306 79761 86257 95413 105779 117525 130848CVG Load Factor (s) 46.5% 57.2% 68.6% 71.4% 71.0% 71.5% 71.7% 71.9% 72.6% 73.0%CVG Originations (t) 53960 75470 48260 44520 50440 65020 57570 50610 47361 50726 56869 63999 72048CVG WN Effect Originations (u) 0 0 0 0 0CVG Total Originations (v) 47361 50726 56869 63999 72048CVG Total Revenue (w) 44770966 41896521 44873953 50307792 56615500 63735980CVG Outbound Passengers (x) 114792 217106 185439 164334 172025 165161 129479 112112 104841 111194 123406 137655 152376CVG Seat Departures (y) 353680 300817 240743 181406 158002 146653 155153 171554 189720 208731CWA AAD Seat Departures (o) 0 0 0 298 305 317 272 237 219 229 251 274 297CWA Distance (p) 175 175 175 175 175 175 175 175 175 175 175 175 175CWA Enp/Orig Ratio (q) N/A 26.813 22.879 30.459 34.068 31.701 18.220 49.080 49.046 48.567 48.079 47.655 46.858CWA Income (r) 4034 4176 4237 4238 4331 4429 4752 5202 5701 6255 6872CWA Load Factor (s) 61.4% 68.0% 58.4% 60.5% 68.5% 69.0% 69.2% 69.5% 70.1% 70.5%CWA Originations (t) 1840 2090 1860 2190 2220 2130 3300 1210 1126 1193 1322 1470 1633
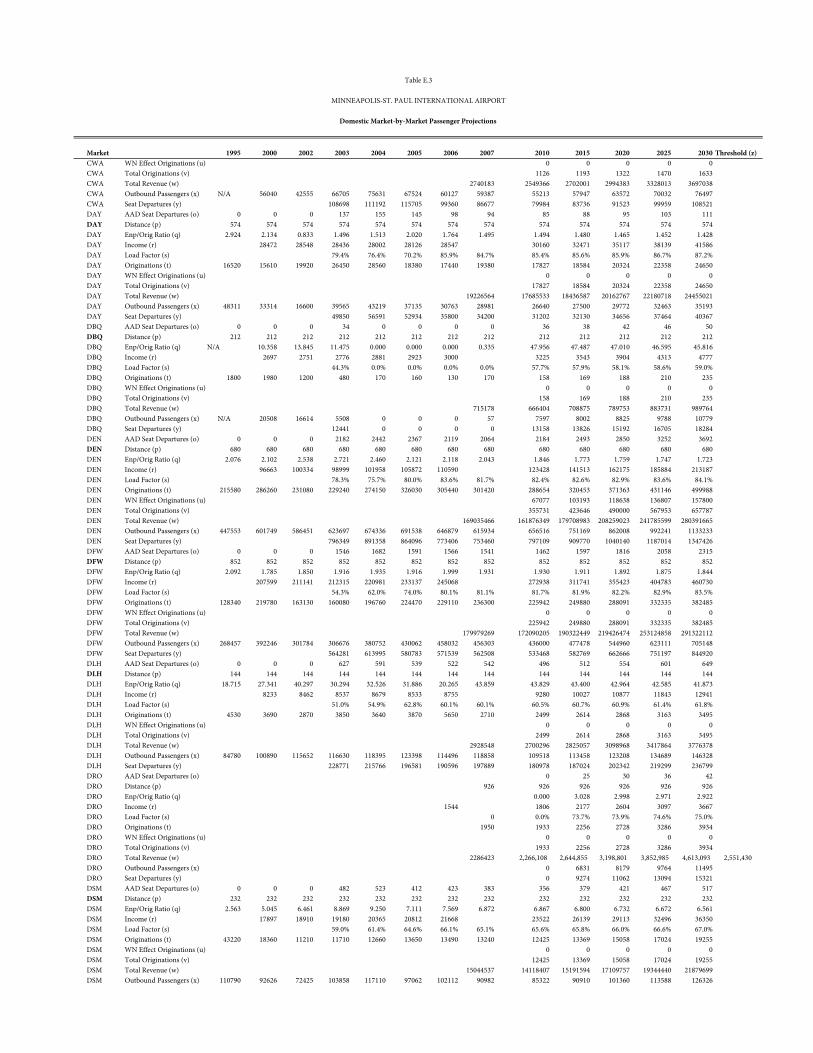
Market 1995 2000 2002 2003 2004 2005 2006 2007 2010 2015 2020 2025 2030 Threshold (z)
Table E.3
MINNEAPOLIS-ST. PAUL INTERNATIONAL AIRPORT
Domestic Market-by-Market Passenger Projections
CWA WN Effect Originations (u) 0 0 0 0 0CWA Total Originations (v) 1126 1193 1322 1470 1633CWA Total Revenue (w) 2740183 2549366 2702001 2994383 3328013 3697038CWA Outbound Passengers (x) N/A 56040 42555 66705 75631 67524 60127 59387 55213 57947 63572 70032 76497CWA Seat Departures (y) 108698 111192 115705 99360 86677 79984 83736 91523 99959 108521DAY AAD Seat Departures (o) 0 0 0 137 155 145 98 94 85 88 95 103 111DAY Distance (p) 574 574 574 574 574 574 574 574 574 574 574 574 574DAY Enp/Orig Ratio (q) 2.924 2.134 0.833 1.496 1.513 2.020 1.764 1.495 1.494 1.480 1.465 1.452 1.428DAY Income (r) 28472 28548 28436 28002 28126 28547 30160 32471 35117 38139 41586DAY Load Factor (s) 79.4% 76.4% 70.2% 85.9% 84.7% 85.4% 85.6% 85.9% 86.7% 87.2%DAY Originations (t) 16520 15610 19920 26450 28560 18380 17440 19380 17827 18584 20324 22358 24650DAY WN Effect Originations (u) 0 0 0 0 0DAY Total Originations (v) 17827 18584 20324 22358 24650DAY Total Revenue (w) 19226564 17685533 18436587 20162767 22180718 24455021DAY Outbound Passengers (x) 48311 33314 16600 39565 43219 37135 30763 28981 26640 27500 29772 32463 35193DAY Seat Departures (y) 49850 56591 52934 35800 34200 31202 32130 34656 37464 40367DBQ AAD Seat Departures (o) 0 0 0 34 0 0 0 0 36 38 42 46 50DBQ Distance (p) 212 212 212 212 212 212 212 212 212 212 212 212 212DBQ Enp/Orig Ratio (q) N/A 10.358 13.845 11.475 0.000 0.000 0.000 0.335 47.956 47.487 47.010 46.595 45.816DBQ Income (r) 2697 2751 2776 2881 2923 3000 3225 3543 3904 4313 4777DBQ Load Factor (s) 44.3% 0.0% 0.0% 0.0% 0.0% 57.7% 57.9% 58.1% 58.6% 59.0%DBQ Originations (t) 1800 1980 1200 480 170 160 130 170 158 169 188 210 235DBQ WN Effect Originations (u) 0 0 0 0 0DBQ Total Originations (v) 158 169 188 210 235DBQ Total Revenue (w) 715178 666404 708875 789753 883731 989764DBQ Outbound Passengers (x) N/A 20508 16614 5508 0 0 0 57 7597 8002 8825 9788 10779DBQ Seat Departures (y) 12441 0 0 0 0 13158 13826 15192 16705 18284DEN AAD Seat Departures (o) 0 0 0 2182 2442 2367 2119 2064 2184 2493 2850 3252 3692DEN Distance (p) 680 680 680 680 680 680 680 680 680 680 680 680 680DEN Enp/Orig Ratio (q) 2.076 2.102 2.538 2.721 2.460 2.121 2.118 2.043 1.846 1.773 1.759 1.747 1.723DEN Income (r) 96663 100334 98999 101958 105872 110590 123428 141513 162175 185884 213187DEN Load Factor (s) 78.3% 75.7% 80.0% 83.6% 81.7% 82.4% 82.6% 82.9% 83.6% 84.1%DEN Originations (t) 215580 286260 231080 229240 274150 326030 305440 301420 288654 320453 371363 431146 499988DEN WN Effect Originations (u) 67077 103193 118638 136807 157800DEN Total Originations (v) 355731 423646 490000 567953 657787DEN Total Revenue (w) 169035466 161876349 179708983 208259023 241785599 280391665DEN Outbound Passengers (x) 447553 601749 586451 623697 674336 691538 646879 615934 656516 751169 862008 992241 1133233DEN Seat Departures (y) 796349 891358 864096 773406 753460 797109 909770 1040140 1187014 1347426DFW AAD Seat Departures (o) 0 0 0 1546 1682 1591 1566 1541 1462 1597 1816 2058 2315DFW Distance (p) 852 852 852 852 852 852 852 852 852 852 852 852 852DFW Enp/Orig Ratio (q) 2.092 1.785 1.850 1.916 1.935 1.916 1.999 1.931 1.930 1.911 1.892 1.875 1.844DFW Income (r) 207599 211141 212315 220981 233137 245068 272938 311741 355423 404783 460730DFW Load Factor (s) 54.3% 62.0% 74.0% 80.1% 81.1% 81.7% 81.9% 82.2% 82.9% 83.5%DFW Originations (t) 128340 219780 163130 160080 196760 224470 229110 236300 225942 249880 288091 332335 382485DFW WN Effect Originations (u) 0 0 0 0 0DFW Total Originations (v) 225942 249880 288091 332335 382485DFW Total Revenue (w) 179979269 172090205 190322449 219426474 253124858 291322112DFW Outbound Passengers (x) 268457 392246 301784 306676 380752 430062 458032 456303 436000 477478 544960 623111 705148DFW Seat Departures (y) 564281 613995 580783 571539 562508 533468 582769 662666 751197 844920DLH AAD Seat Departures (o) 0 0 0 627 591 539 522 542 496 512 554 601 649DLH Distance (p) 144 144 144 144 144 144 144 144 144 144 144 144 144DLH Enp/Orig Ratio (q) 18.715 27.341 40.297 30.294 32.526 31.886 20.265 43.859 43.829 43.400 42.964 42.585 41.873DLH Income (r) 8233 8462 8537 8679 8533 8755 9280 10027 10877 11843 12941DLH Load Factor (s) 51.0% 54.9% 62.8% 60.1% 60.1% 60.5% 60.7% 60.9% 61.4% 61.8%DLH Originations (t) 4530 3690 2870 3850 3640 3870 5650 2710 2499 2614 2868 3163 3495DLH WN Effect Originations (u) 0 0 0 0 0DLH Total Originations (v) 2499 2614 2868 3163 3495DLH Total Revenue (w) 2928548 2700296 2825057 3098968 3417864 3776378DLH Outbound Passengers (x) 84780 100890 115652 116630 118395 123398 114496 118858 109518 113458 123208 134689 146328DLH Seat Departures (y) 228771 215766 196581 190596 197889 180978 187024 202342 219299 236799DRO AAD Seat Departures (o) 0 25 30 36 42DRO Distance (p) 926 926 926 926 926 926DRO Enp/Orig Ratio (q) 0.000 3.028 2.998 2.971 2.922DRO Income (r) 1544 1806 2177 2604 3097 3667DRO Load Factor (s) 0 0.0% 73.7% 73.9% 74.6% 75.0%DRO Originations (t) 1950 1933 2256 2728 3286 3934DRO WN Effect Originations (u) 0 0 0 0 0DRO Total Originations (v) 1933 2256 2728 3286 3934DRO Total Revenue (w) 2286423 2,266,108 2,644,855 3,198,801 3,852,985 4,613,093 2,551,430 DRO Outbound Passengers (x) 0 6831 8179 9764 11495DRO Seat Departures (y) 0 9274 11062 13094 15321DSM AAD Seat Departures (o) 0 0 0 482 523 412 423 383 356 379 421 467 517DSM Distance (p) 232 232 232 232 232 232 232 232 232 232 232 232 232DSM Enp/Orig Ratio (q) 2.563 5.045 6.461 8.869 9.250 7.111 7.569 6.872 6.867 6.800 6.732 6.672 6.561DSM Income (r) 17897 18910 19180 20365 20812 21668 23522 26139 29113 32496 36350DSM Load Factor (s) 59.0% 61.4% 64.6% 66.1% 65.1% 65.6% 65.8% 66.0% 66.6% 67.0%DSM Originations (t) 43220 18360 11210 11710 12660 13650 13490 13240 12425 13369 15058 17024 19255DSM WN Effect Originations (u) 0 0 0 0 0DSM Total Originations (v) 12425 13369 15058 17024 19255DSM Total Revenue (w) 15044537 14118407 15191594 17109757 19344440 21879699DSM Outbound Passengers (x) 110790 92626 72425 103858 117110 97062 102112 90982 85322 90910 101360 113588 126326
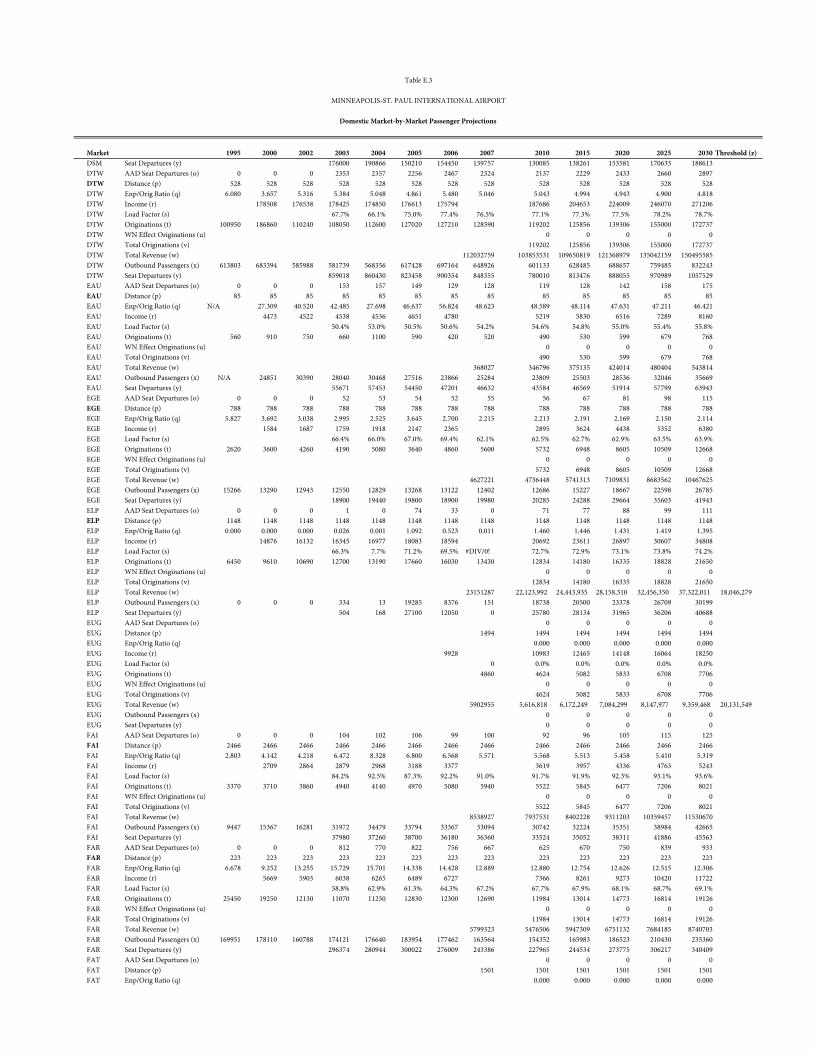
Market 1995 2000 2002 2003 2004 2005 2006 2007 2010 2015 2020 2025 2030 Threshold (z)
Table E.3
MINNEAPOLIS-ST. PAUL INTERNATIONAL AIRPORT
Domestic Market-by-Market Passenger Projections
DSM Seat Departures (y) 176000 190866 150210 154450 139757 130085 138261 153581 170633 188613DTW AAD Seat Departures (o) 0 0 0 2353 2357 2256 2467 2324 2137 2229 2433 2660 2897DTW Distance (p) 528 528 528 528 528 528 528 528 528 528 528 528 528DTW Enp/Orig Ratio (q) 6.080 3.657 5.316 5.384 5.048 4.861 5.480 5.046 5.043 4.994 4.943 4.900 4.818DTW Income (r) 178508 176538 178425 174850 176613 175794 187686 204653 224009 246070 271206DTW Load Factor (s) 67.7% 66.1% 75.0% 77.4% 76.5% 77.1% 77.3% 77.5% 78.2% 78.7%DTW Originations (t) 100950 186860 110240 108050 112600 127020 127210 128590 119202 125856 139306 155000 172737DTW WN Effect Originations (u) 0 0 0 0 0DTW Total Originations (v) 119202 125856 139306 155000 172737DTW Total Revenue (w) 112032759 103853531 109650819 121368979 135042159 150495585DTW Outbound Passengers (x) 613803 683394 585988 581739 568356 617428 697164 648926 601133 628485 688657 759485 832243DTW Seat Departures (y) 859018 860430 823458 900354 848355 780010 813476 888055 970989 1057529EAU AAD Seat Departures (o) 0 0 0 153 157 149 129 128 119 128 142 158 175EAU Distance (p) 85 85 85 85 85 85 85 85 85 85 85 85 85EAU Enp/Orig Ratio (q) N/A 27.309 40.520 42.485 27.698 46.637 56.824 48.623 48.589 48.114 47.631 47.211 46.421EAU Income (r) 4473 4522 4538 4536 4651 4780 5219 5830 6516 7289 8160EAU Load Factor (s) 50.4% 53.0% 50.5% 50.6% 54.2% 54.6% 54.8% 55.0% 55.4% 55.8%EAU Originations (t) 560 910 750 660 1100 590 420 520 490 530 599 679 768EAU WN Effect Originations (u) 0 0 0 0 0EAU Total Originations (v) 490 530 599 679 768EAU Total Revenue (w) 368027 346796 375135 424014 480404 543814EAU Outbound Passengers (x) N/A 24851 30390 28040 30468 27516 23866 25284 23809 25503 28536 32046 35669EAU Seat Departures (y) 55671 57453 54450 47201 46632 43584 46569 51914 57799 63943EGE AAD Seat Departures (o) 0 0 0 52 53 54 52 55 56 67 81 98 115EGE Distance (p) 788 788 788 788 788 788 788 788 788 788 788 788 788EGE Enp/Orig Ratio (q) 5.827 3.692 3.038 2.995 2.525 3.645 2.700 2.215 2.213 2.191 2.169 2.150 2.114EGE Income (r) 1584 1687 1759 1918 2147 2365 2895 3624 4438 5352 6380EGE Load Factor (s) 66.4% 66.0% 67.0% 69.4% 62.1% 62.5% 62.7% 62.9% 63.5% 63.9%EGE Originations (t) 2620 3600 4260 4190 5080 3640 4860 5600 5732 6948 8605 10509 12668EGE WN Effect Originations (u) 0 0 0 0 0EGE Total Originations (v) 5732 6948 8605 10509 12668EGE Total Revenue (w) 4627221 4736448 5741313 7109831 8683562 10467625EGE Outbound Passengers (x) 15266 13290 12943 12550 12829 13268 13122 12402 12686 15227 18667 22598 26785EGE Seat Departures (y) 18900 19440 19800 18900 19980 20285 24288 29664 35603 41943ELP AAD Seat Departures (o) 0 0 0 1 0 74 33 0 71 77 88 99 111ELP Distance (p) 1148 1148 1148 1148 1148 1148 1148 1148 1148 1148 1148 1148 1148ELP Enp/Orig Ratio (q) 0.000 0.000 0.000 0.026 0.001 1.092 0.523 0.011 1.460 1.446 1.431 1.419 1.395ELP Income (r) 14876 16132 16345 16977 18083 18594 20692 23611 26897 30607 34808ELP Load Factor (s) 66.3% 7.7% 71.2% 69.5% #DIV/0! 72.7% 72.9% 73.1% 73.8% 74.2%ELP Originations (t) 6450 9610 10690 12700 13190 17660 16030 13430 12834 14180 16335 18828 21650ELP WN Effect Originations (u) 0 0 0 0 0ELP Total Originations (v) 12834 14180 16335 18828 21650ELP Total Revenue (w) 23151287 22,123,992 24,443,935 28,158,310 32,456,350 37,322,011 18,046,279ELP Outbound Passengers (x) 0 0 0 334 13 19285 8376 151 18738 20500 23378 26709 30199ELP Seat Departures (y) 504 168 27100 12050 0 25780 28134 31965 36206 40688EUG AAD Seat Departures (o) 0 0 0 0 0EUG Distance (p) 1494 1494 1494 1494 1494 1494EUG Enp/Orig Ratio (q) 0.000 0.000 0.000 0.000 0.000EUG Income (r) 9928 10983 12465 14148 16064 18250EUG Load Factor (s) 0 0.0% 0.0% 0.0% 0.0% 0.0%EUG Originations (t) 4860 4624 5082 5833 6708 7706EUG WN Effect Originations (u) 0 0 0 0 0EUG Total Originations (v) 4624 5082 5833 6708 7706EUG Total Revenue (w) 5902955 5,616,818 6,172,249 7,084,299 8,147,977 9,359,468 20,131,549EUG Outbound Passengers (x) 0 0 0 0 0EUG Seat Departures (y) 0 0 0 0 0FAI AAD Seat Departures (o) 0 0 0 104 102 106 99 100 92 96 105 115 125FAI Distance (p) 2466 2466 2466 2466 2466 2466 2466 2466 2466 2466 2466 2466 2466FAI Enp/Orig Ratio (q) 2.803 4.142 4.218 6.472 8.328 6.800 6.568 5.571 5.568 5.513 5.458 5.410 5.319FAI Income (r) 2709 2864 2879 2968 3188 3377 3619 3957 4336 4763 5243FAI Load Factor (s) 84.2% 92.5% 87.3% 92.2% 91.0% 91.7% 91.9% 92.3% 93.1% 93.6%FAI Originations (t) 3370 3710 3860 4940 4140 4970 5080 5940 5522 5845 6477 7206 8021FAI WN Effect Originations (u) 0 0 0 0 0FAI Total Originations (v) 5522 5845 6477 7206 8021FAI Total Revenue (w) 8538927 7937531 8402228 9311203 10359457 11530670FAI Outbound Passengers (x) 9447 15367 16281 31972 34479 33794 33367 33094 30742 32224 35351 38984 42665FAI Seat Departures (y) 37980 37260 38700 36180 36360 33524 35052 38311 41886 45563FAR AAD Seat Departures (o) 0 0 0 812 770 822 756 667 625 670 750 839 933FAR Distance (p) 223 223 223 223 223 223 223 223 223 223 223 223 223FAR Enp/Orig Ratio (q) 6.678 9.252 13.255 15.729 15.701 14.338 14.428 12.889 12.880 12.754 12.626 12.515 12.306FAR Income (r) 5669 5903 6038 6265 6489 6727 7366 8261 9273 10420 11722FAR Load Factor (s) 58.8% 62.9% 61.3% 64.3% 67.2% 67.7% 67.9% 68.1% 68.7% 69.1%FAR Originations (t) 25450 19250 12130 11070 11250 12830 12300 12690 11984 13014 14773 16814 19126FAR WN Effect Originations (u) 0 0 0 0 0FAR Total Originations (v) 11984 13014 14773 16814 19126FAR Total Revenue (w) 5799323 5476506 5947309 6751132 7684185 8740703FAR Outbound Passengers (x) 169951 178110 160788 174121 176640 183954 177462 163564 154352 165983 186523 210430 235360FAR Seat Departures (y) 296374 280944 300022 276009 243386 227965 244534 273775 306217 340409FAT AAD Seat Departures (o) 0 0 0 0 0FAT Distance (p) 1501 1501 1501 1501 1501 1501FAT Enp/Orig Ratio (q) 0.000 0.000 0.000 0.000 0.000
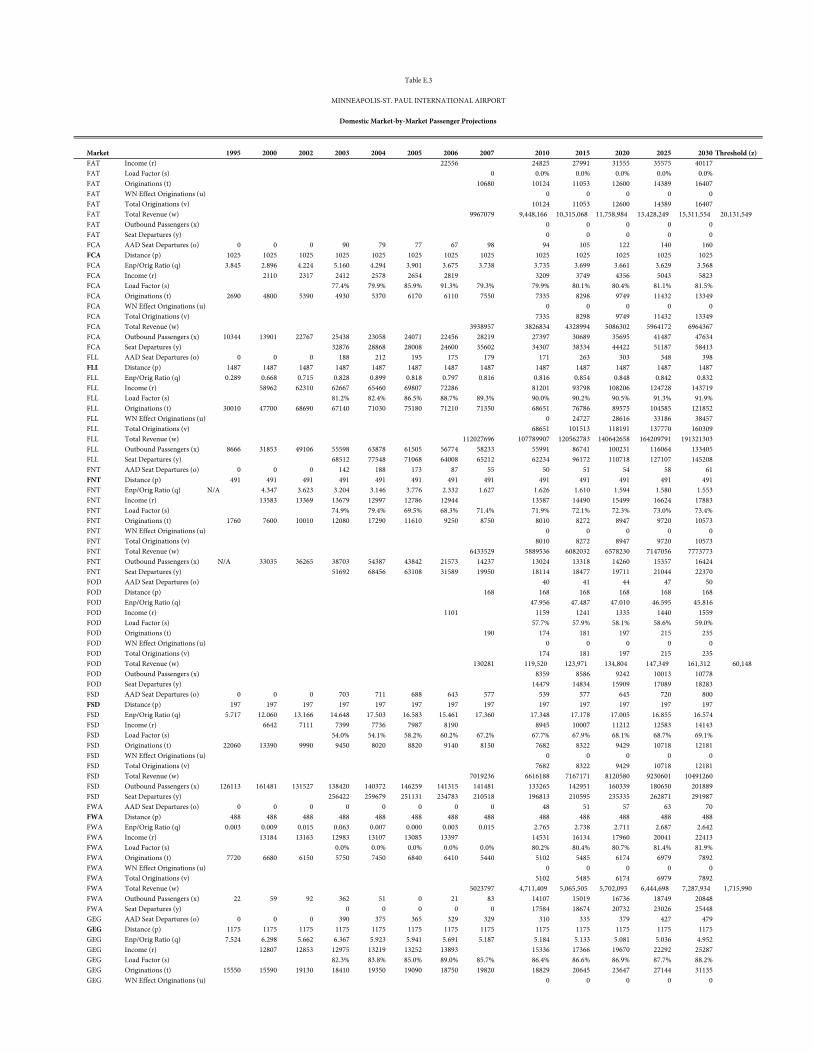
Market 1995 2000 2002 2003 2004 2005 2006 2007 2010 2015 2020 2025 2030 Threshold (z)
Table E.3
MINNEAPOLIS-ST. PAUL INTERNATIONAL AIRPORT
Domestic Market-by-Market Passenger Projections
FAT Income (r) 22556 24825 27991 31555 35575 40117FAT Load Factor (s) 0 0.0% 0.0% 0.0% 0.0% 0.0%FAT Originations (t) 10680 10124 11053 12600 14389 16407FAT WN Effect Originations (u) 0 0 0 0 0FAT Total Originations (v) 10124 11053 12600 14389 16407FAT Total Revenue (w) 9967079 9,448,166 10,315,068 11,758,984 13,428,249 15,311,554 20,131,549FAT Outbound Passengers (x) 0 0 0 0 0FAT Seat Departures (y) 0 0 0 0 0FCA AAD Seat Departures (o) 0 0 0 90 79 77 67 98 94 105 122 140 160FCA Distance (p) 1025 1025 1025 1025 1025 1025 1025 1025 1025 1025 1025 1025 1025FCA Enp/Orig Ratio (q) 3.845 2.896 4.224 5.160 4.294 3.901 3.675 3.738 3.735 3.699 3.661 3.629 3.568FCA Income (r) 2110 2317 2412 2578 2654 2819 3209 3749 4356 5043 5823FCA Load Factor (s) 77.4% 79.9% 85.9% 91.3% 79.3% 79.9% 80.1% 80.4% 81.1% 81.5%FCA Originations (t) 2690 4800 5390 4930 5370 6170 6110 7550 7335 8298 9749 11432 13349FCA WN Effect Originations (u) 0 0 0 0 0FCA Total Originations (v) 7335 8298 9749 11432 13349FCA Total Revenue (w) 3938957 3826834 4328994 5086302 5964172 6964367FCA Outbound Passengers (x) 10344 13901 22767 25438 23058 24071 22456 28219 27397 30689 35695 41487 47634FCA Seat Departures (y) 32876 28868 28008 24600 35602 34307 38334 44422 51187 58413FLL AAD Seat Departures (o) 0 0 0 188 212 195 175 179 171 263 303 348 398FLL Distance (p) 1487 1487 1487 1487 1487 1487 1487 1487 1487 1487 1487 1487 1487FLL Enp/Orig Ratio (q) 0.289 0.668 0.715 0.828 0.899 0.818 0.797 0.816 0.816 0.854 0.848 0.842 0.832FLL Income (r) 58962 62310 62667 65460 69807 72286 81201 93798 108206 124728 143719FLL Load Factor (s) 81.2% 82.4% 86.5% 88.7% 89.3% 90.0% 90.2% 90.5% 91.3% 91.9%FLL Originations (t) 30010 47700 68690 67140 71030 75180 71210 71350 68651 76786 89575 104585 121852FLL WN Effect Originations (u) 0 24727 28616 33186 38457FLL Total Originations (v) 68651 101513 118191 137770 160309FLL Total Revenue (w) 112027696 107789907 120562783 140642658 164209791 191321303FLL Outbound Passengers (x) 8666 31853 49106 55598 63878 61505 56774 58233 55991 86741 100231 116064 133405FLL Seat Departures (y) 68512 77548 71068 64008 65212 62234 96172 110718 127107 145208FNT AAD Seat Departures (o) 0 0 0 142 188 173 87 55 50 51 54 58 61FNT Distance (p) 491 491 491 491 491 491 491 491 491 491 491 491 491FNT Enp/Orig Ratio (q) N/A 4.347 3.623 3.204 3.146 3.776 2.332 1.627 1.626 1.610 1.594 1.580 1.553FNT Income (r) 13583 13369 13679 12997 12786 12944 13587 14490 15499 16624 17883FNT Load Factor (s) 74.9% 79.4% 69.5% 68.3% 71.4% 71.9% 72.1% 72.3% 73.0% 73.4%FNT Originations (t) 1760 7600 10010 12080 17290 11610 9250 8750 8010 8272 8947 9720 10573FNT WN Effect Originations (u) 0 0 0 0 0FNT Total Originations (v) 8010 8272 8947 9720 10573FNT Total Revenue (w) 6433529 5889536 6082032 6578230 7147056 7773773FNT Outbound Passengers (x) N/A 33035 36265 38703 54387 43842 21573 14237 13024 13318 14260 15357 16424FNT Seat Departures (y) 51692 68456 63108 31589 19950 18114 18477 19711 21044 22370FOD AAD Seat Departures (o) 40 41 44 47 50FOD Distance (p) 168 168 168 168 168 168FOD Enp/Orig Ratio (q) 47.956 47.487 47.010 46.595 45.816FOD Income (r) 1101 1159 1241 1335 1440 1559FOD Load Factor (s) 57.7% 57.9% 58.1% 58.6% 59.0%FOD Originations (t) 190 174 181 197 215 235FOD WN Effect Originations (u) 0 0 0 0 0FOD Total Originations (v) 174 181 197 215 235FOD Total Revenue (w) 130281 119,520 123,971 134,804 147,349 161,312 60,148 FOD Outbound Passengers (x) 8359 8586 9242 10013 10778FOD Seat Departures (y) 14479 14834 15909 17089 18283FSD AAD Seat Departures (o) 0 0 0 703 711 688 643 577 539 577 645 720 800FSD Distance (p) 197 197 197 197 197 197 197 197 197 197 197 197 197FSD Enp/Orig Ratio (q) 5.717 12.060 13.166 14.648 17.503 16.583 15.461 17.360 17.348 17.178 17.005 16.855 16.574FSD Income (r) 6642 7111 7399 7736 7987 8190 8945 10007 11212 12583 14143FSD Load Factor (s) 54.0% 54.1% 58.2% 60.2% 67.2% 67.7% 67.9% 68.1% 68.7% 69.1%FSD Originations (t) 22060 13390 9990 9450 8020 8820 9140 8150 7682 8322 9429 10718 12181FSD WN Effect Originations (u) 0 0 0 0 0FSD Total Originations (v) 7682 8322 9429 10718 12181FSD Total Revenue (w) 7019236 6616188 7167171 8120580 9230601 10491260FSD Outbound Passengers (x) 126113 161481 131527 138420 140372 146259 141315 141481 133265 142951 160339 180650 201889FSD Seat Departures (y) 256422 259679 251131 234783 210518 196813 210595 235335 262871 291987FWA AAD Seat Departures (o) 0 0 0 0 0 0 0 0 48 51 57 63 70FWA Distance (p) 488 488 488 488 488 488 488 488 488 488 488 488 488FWA Enp/Orig Ratio (q) 0.003 0.009 0.015 0.063 0.007 0.000 0.003 0.015 2.765 2.738 2.711 2.687 2.642FWA Income (r) 13184 13163 12983 13107 13085 13397 14531 16134 17960 20041 22413FWA Load Factor (s) 0.0% 0.0% 0.0% 0.0% 0.0% 80.2% 80.4% 80.7% 81.4% 81.9%FWA Originations (t) 7720 6680 6150 5750 7450 6840 6410 5440 5102 5485 6174 6979 7892FWA WN Effect Originations (u) 0 0 0 0 0FWA Total Originations (v) 5102 5485 6174 6979 7892FWA Total Revenue (w) 5023797 4,711,409 5,065,505 5,702,093 6,444,698 7,287,934 1,715,990 FWA Outbound Passengers (x) 22 59 92 362 51 0 21 83 14107 15019 16736 18749 20848FWA Seat Departures (y) 0 0 0 0 0 17584 18674 20732 23026 25448GEG AAD Seat Departures (o) 0 0 0 390 375 365 329 329 310 335 379 427 479GEG Distance (p) 1175 1175 1175 1175 1175 1175 1175 1175 1175 1175 1175 1175 1175GEG Enp/Orig Ratio (q) 7.524 6.298 5.662 6.367 5.923 5.941 5.691 5.187 5.184 5.133 5.081 5.036 4.952GEG Income (r) 12807 12853 12975 13219 13252 13893 15336 17366 19670 22292 25287GEG Load Factor (s) 82.3% 83.8% 85.0% 89.0% 85.7% 86.4% 86.6% 86.9% 87.7% 88.2%GEG Originations (t) 15550 15590 19130 18410 19350 19090 18750 19820 18829 20645 23647 27144 31135GEG WN Effect Originations (u) 0 0 0 0 0
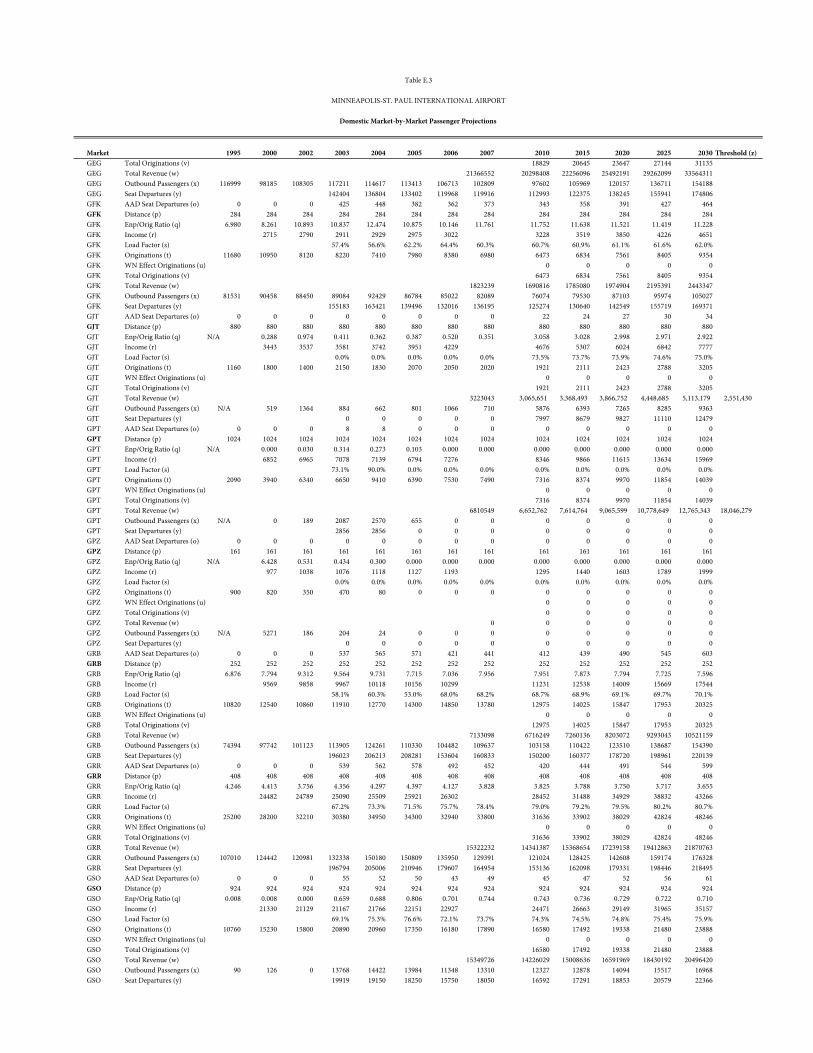
Market 1995 2000 2002 2003 2004 2005 2006 2007 2010 2015 2020 2025 2030 Threshold (z)
Table E.3
MINNEAPOLIS-ST. PAUL INTERNATIONAL AIRPORT
Domestic Market-by-Market Passenger Projections
GEG Total Originations (v) 18829 20645 23647 27144 31135GEG Total Revenue (w) 21366552 20298408 22256096 25492191 29262099 33564311GEG Outbound Passengers (x) 116999 98185 108305 117211 114617 113413 106713 102809 97602 105969 120157 136711 154188GEG Seat Departures (y) 142404 136804 133402 119968 119916 112993 122375 138245 155941 174806GFK AAD Seat Departures (o) 0 0 0 425 448 382 362 373 343 358 391 427 464GFK Distance (p) 284 284 284 284 284 284 284 284 284 284 284 284 284GFK Enp/Orig Ratio (q) 6.980 8.261 10.893 10.837 12.474 10.875 10.146 11.761 11.752 11.638 11.521 11.419 11.228GFK Income (r) 2715 2790 2911 2929 2975 3022 3228 3519 3850 4226 4651GFK Load Factor (s) 57.4% 56.6% 62.2% 64.4% 60.3% 60.7% 60.9% 61.1% 61.6% 62.0%GFK Originations (t) 11680 10950 8120 8220 7410 7980 8380 6980 6473 6834 7561 8405 9354GFK WN Effect Originations (u) 0 0 0 0 0GFK Total Originations (v) 6473 6834 7561 8405 9354GFK Total Revenue (w) 1823239 1690816 1785080 1974904 2195391 2443347GFK Outbound Passengers (x) 81531 90458 88450 89084 92429 86784 85022 82089 76074 79530 87103 95974 105027GFK Seat Departures (y) 155183 163421 139496 132016 136195 125274 130640 142549 155719 169371GJT AAD Seat Departures (o) 0 0 0 0 0 0 0 0 22 24 27 30 34GJT Distance (p) 880 880 880 880 880 880 880 880 880 880 880 880 880GJT Enp/Orig Ratio (q) N/A 0.288 0.974 0.411 0.362 0.387 0.520 0.351 3.058 3.028 2.998 2.971 2.922GJT Income (r) 3443 3537 3581 3742 3951 4229 4676 5307 6024 6842 7777GJT Load Factor (s) 0.0% 0.0% 0.0% 0.0% 0.0% 73.5% 73.7% 73.9% 74.6% 75.0%GJT Originations (t) 1160 1800 1400 2150 1830 2070 2050 2020 1921 2111 2423 2788 3205GJT WN Effect Originations (u) 0 0 0 0 0GJT Total Originations (v) 1921 2111 2423 2788 3205GJT Total Revenue (w) 3223043 3,065,651 3,368,493 3,866,752 4,448,685 5,113,179 2,551,430 GJT Outbound Passengers (x) N/A 519 1364 884 662 801 1066 710 5876 6393 7265 8285 9363GJT Seat Departures (y) 0 0 0 0 0 7997 8679 9827 11110 12479GPT AAD Seat Departures (o) 0 0 0 8 8 0 0 0 0 0 0 0 0GPT Distance (p) 1024 1024 1024 1024 1024 1024 1024 1024 1024 1024 1024 1024 1024GPT Enp/Orig Ratio (q) N/A 0.000 0.030 0.314 0.273 0.103 0.000 0.000 0.000 0.000 0.000 0.000 0.000GPT Income (r) 6852 6965 7078 7139 6794 7276 8346 9866 11615 13634 15969GPT Load Factor (s) 73.1% 90.0% 0.0% 0.0% 0.0% 0.0% 0.0% 0.0% 0.0% 0.0%GPT Originations (t) 2090 3940 6340 6650 9410 6390 7530 7490 7316 8374 9970 11854 14039GPT WN Effect Originations (u) 0 0 0 0 0GPT Total Originations (v) 7316 8374 9970 11854 14039GPT Total Revenue (w) 6810549 6,652,762 7,614,764 9,065,599 10,778,649 12,765,343 18,046,279GPT Outbound Passengers (x) N/A 0 189 2087 2570 655 0 0 0 0 0 0 0GPT Seat Departures (y) 2856 2856 0 0 0 0 0 0 0 0GPZ AAD Seat Departures (o) 0 0 0 0 0 0 0 0 0 0 0 0 0GPZ Distance (p) 161 161 161 161 161 161 161 161 161 161 161 161 161GPZ Enp/Orig Ratio (q) N/A 6.428 0.531 0.434 0.300 0.000 0.000 0.000 0.000 0.000 0.000 0.000 0.000GPZ Income (r) 977 1038 1076 1118 1127 1193 1295 1440 1603 1789 1999GPZ Load Factor (s) 0.0% 0.0% 0.0% 0.0% 0.0% 0.0% 0.0% 0.0% 0.0% 0.0%GPZ Originations (t) 900 820 350 470 80 0 0 0 0 0 0 0 0GPZ WN Effect Originations (u) 0 0 0 0 0GPZ Total Originations (v) 0 0 0 0 0GPZ Total Revenue (w) 0 0 0 0 0 0GPZ Outbound Passengers (x) N/A 5271 186 204 24 0 0 0 0 0 0 0 0GPZ Seat Departures (y) 0 0 0 0 0 0 0 0 0 0GRB AAD Seat Departures (o) 0 0 0 537 565 571 421 441 412 439 490 545 603GRB Distance (p) 252 252 252 252 252 252 252 252 252 252 252 252 252GRB Enp/Orig Ratio (q) 6.876 7.794 9.312 9.564 9.731 7.715 7.036 7.956 7.951 7.873 7.794 7.725 7.596GRB Income (r) 9569 9858 9967 10118 10156 10299 11231 12538 14009 15669 17544GRB Load Factor (s) 58.1% 60.3% 53.0% 68.0% 68.2% 68.7% 68.9% 69.1% 69.7% 70.1%GRB Originations (t) 10820 12540 10860 11910 12770 14300 14850 13780 12975 14025 15847 17953 20325GRB WN Effect Originations (u) 0 0 0 0 0GRB Total Originations (v) 12975 14025 15847 17953 20325GRB Total Revenue (w) 7133098 6716249 7260136 8203072 9293043 10521159GRB Outbound Passengers (x) 74394 97742 101123 113905 124261 110330 104482 109637 103158 110422 123510 138687 154390GRB Seat Departures (y) 196023 206213 208281 153604 160833 150200 160377 178720 198961 220139GRR AAD Seat Departures (o) 0 0 0 539 562 578 492 452 420 444 491 544 599GRR Distance (p) 408 408 408 408 408 408 408 408 408 408 408 408 408GRR Enp/Orig Ratio (q) 4.246 4.413 3.756 4.356 4.297 4.397 4.127 3.828 3.825 3.788 3.750 3.717 3.655GRR Income (r) 24482 24789 25090 25509 25921 26302 28452 31488 34929 38832 43266GRR Load Factor (s) 67.2% 73.3% 71.5% 75.7% 78.4% 79.0% 79.2% 79.5% 80.2% 80.7%GRR Originations (t) 25200 28200 32210 30380 34950 34300 32940 33800 31636 33902 38029 42824 48246GRR WN Effect Originations (u) 0 0 0 0 0GRR Total Originations (v) 31636 33902 38029 42824 48246GRR Total Revenue (w) 15322232 14341387 15368654 17239158 19412863 21870763GRR Outbound Passengers (x) 107010 124442 120981 132338 150180 150809 135950 129391 121024 128425 142608 159174 176328GRR Seat Departures (y) 196794 205006 210946 179607 164954 153136 162098 179331 198446 218495GSO AAD Seat Departures (o) 0 0 0 55 52 50 43 49 45 47 52 56 61GSO Distance (p) 924 924 924 924 924 924 924 924 924 924 924 924 924GSO Enp/Orig Ratio (q) 0.008 0.008 0.000 0.659 0.688 0.806 0.701 0.744 0.743 0.736 0.729 0.722 0.710GSO Income (r) 21330 21129 21167 21766 22151 22927 24471 26663 29149 31965 35157GSO Load Factor (s) 69.1% 75.3% 76.6% 72.1% 73.7% 74.3% 74.5% 74.8% 75.4% 75.9%GSO Originations (t) 10760 15230 15800 20890 20960 17350 16180 17890 16580 17492 19338 21480 23888GSO WN Effect Originations (u) 0 0 0 0 0GSO Total Originations (v) 16580 17492 19338 21480 23888GSO Total Revenue (w) 15349726 14226029 15008636 16591969 18430192 20496420GSO Outbound Passengers (x) 90 126 0 13768 14422 13984 11348 13310 12327 12878 14094 15517 16968GSO Seat Departures (y) 19919 19150 18250 15750 18050 16592 17291 18853 20579 22366
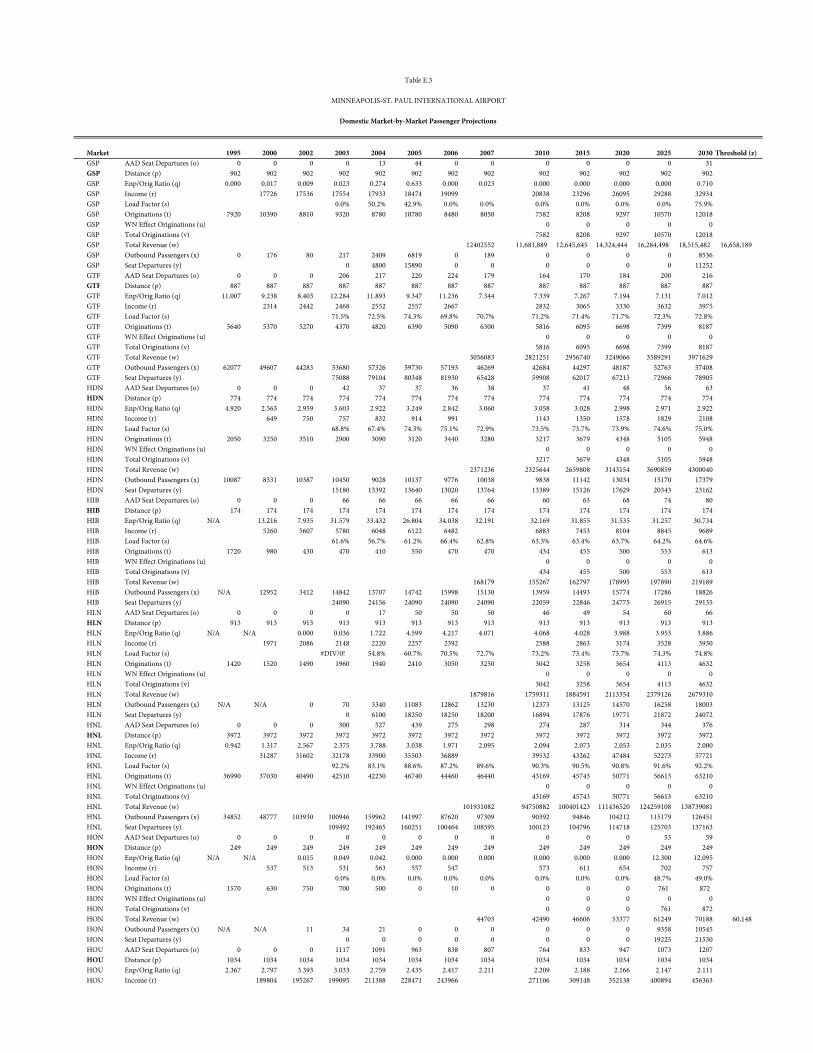
Market 1995 2000 2002 2003 2004 2005 2006 2007 2010 2015 2020 2025 2030 Threshold (z)
Table E.3
MINNEAPOLIS-ST. PAUL INTERNATIONAL AIRPORT
Domestic Market-by-Market Passenger Projections
GSP AAD Seat Departures (o) 0 0 0 0 13 44 0 0 0 0 0 0 31GSP Distance (p) 902 902 902 902 902 902 902 902 902 902 902 902 902GSP Enp/Orig Ratio (q) 0.000 0.017 0.009 0.023 0.274 0.633 0.000 0.023 0.000 0.000 0.000 0.000 0.710GSP Income (r) 17726 17536 17554 17933 18474 19099 20838 23296 26095 29288 32934GSP Load Factor (s) 0.0% 50.2% 42.9% 0.0% 0.0% 0.0% 0.0% 0.0% 0.0% 75.9%GSP Originations (t) 7920 10390 8810 9320 8780 10780 8480 8050 7582 8208 9297 10570 12018GSP WN Effect Originations (u) 0 0 0 0 0GSP Total Originations (v) 7582 8208 9297 10570 12018GSP Total Revenue (w) 12402552 11,681,889 12,645,645 14,324,444 16,284,498 18,515,482 16,658,189GSP Outbound Passengers (x) 0 176 80 217 2409 6819 0 189 0 0 0 0 8536GSP Seat Departures (y) 0 4800 15890 0 0 0 0 0 0 11252GTF AAD Seat Departures (o) 0 0 0 206 217 220 224 179 164 170 184 200 216GTF Distance (p) 887 887 887 887 887 887 887 887 887 887 887 887 887GTF Enp/Orig Ratio (q) 11.007 9.238 8.403 12.284 11.893 9.347 11.236 7.344 7.339 7.267 7.194 7.131 7.012GTF Income (r) 2314 2442 2468 2552 2557 2667 2832 3065 3330 3632 3975GTF Load Factor (s) 71.5% 72.5% 74.3% 69.8% 70.7% 71.2% 71.4% 71.7% 72.3% 72.8%GTF Originations (t) 5640 5370 5270 4370 4820 6390 5090 6300 5816 6095 6698 7399 8187GTF WN Effect Originations (u) 0 0 0 0 0GTF Total Originations (v) 5816 6095 6698 7399 8187GTF Total Revenue (w) 3056083 2821251 2956740 3249066 3589291 3971629GTF Outbound Passengers (x) 62077 49607 44283 53680 57326 59730 57193 46269 42684 44297 48187 52763 57408GTF Seat Departures (y) 75088 79104 80348 81930 65428 59908 62017 67213 72966 78905HDN AAD Seat Departures (o) 0 0 0 42 37 37 36 38 37 41 48 56 63HDN Distance (p) 774 774 774 774 774 774 774 774 774 774 774 774 774HDN Enp/Orig Ratio (q) 4.920 2.563 2.959 3.603 2.922 3.249 2.842 3.060 3.058 3.028 2.998 2.971 2.922HDN Income (r) 649 750 757 832 914 991 1143 1350 1578 1829 2108HDN Load Factor (s) 68.8% 67.4% 74.3% 75.1% 72.9% 73.5% 73.7% 73.9% 74.6% 75.0%HDN Originations (t) 2050 3250 3510 2900 3090 3120 3440 3280 3217 3679 4348 5105 5948HDN WN Effect Originations (u) 0 0 0 0 0HDN Total Originations (v) 3217 3679 4348 5105 5948HDN Total Revenue (w) 2371236 2325644 2659808 3143154 3690859 4300040HDN Outbound Passengers (x) 10087 8331 10387 10450 9028 10137 9776 10038 9838 11142 13034 15170 17379HDN Seat Departures (y) 15180 13392 13640 13020 13764 13389 15126 17629 20343 23162HIB AAD Seat Departures (o) 0 0 0 66 66 66 66 66 60 63 68 74 80HIB Distance (p) 174 174 174 174 174 174 174 174 174 174 174 174 174HIB Enp/Orig Ratio (q) N/A 13.216 7.935 31.579 33.432 26.804 34.038 32.191 32.169 31.855 31.535 31.257 30.734HIB Income (r) 5260 5607 5780 6048 6122 6482 6883 7453 8104 8845 9689HIB Load Factor (s) 61.6% 56.7% 61.2% 66.4% 62.8% 63.3% 63.4% 63.7% 64.2% 64.6%HIB Originations (t) 1720 980 430 470 410 550 470 470 434 455 500 553 613HIB WN Effect Originations (u) 0 0 0 0 0HIB Total Originations (v) 434 455 500 553 613HIB Total Revenue (w) 168179 155267 162797 178995 197890 219189HIB Outbound Passengers (x) N/A 12952 3412 14842 13707 14742 15998 15130 13959 14493 15774 17286 18826HIB Seat Departures (y) 24090 24156 24090 24090 24090 22059 22846 24775 26915 29135HLN AAD Seat Departures (o) 0 0 0 0 17 50 50 50 46 49 54 60 66HLN Distance (p) 913 913 913 913 913 913 913 913 913 913 913 913 913HLN Enp/Orig Ratio (q) N/A N/A 0.000 0.036 1.722 4.599 4.217 4.071 4.068 4.028 3.988 3.953 3.886HLN Income (r) 1971 2086 2148 2220 2257 2392 2588 2863 3174 3528 3930HLN Load Factor (s) #DIV/0! 54.8% 60.7% 70.5% 72.7% 73.2% 73.4% 73.7% 74.3% 74.8%HLN Originations (t) 1420 1520 1490 1960 1940 2410 3050 3250 3042 3258 3654 4113 4632HLN WN Effect Originations (u) 0 0 0 0 0HLN Total Originations (v) 3042 3258 3654 4113 4632HLN Total Revenue (w) 1879816 1759311 1884591 2113354 2379126 2679310HLN Outbound Passengers (x) N/A N/A 0 70 3340 11083 12862 13230 12373 13125 14570 16258 18003HLN Seat Departures (y) 0 6100 18250 18250 18200 16894 17876 19771 21872 24072HNL AAD Seat Departures (o) 0 0 0 300 527 439 275 298 274 287 314 344 376HNL Distance (p) 3972 3972 3972 3972 3972 3972 3972 3972 3972 3972 3972 3972 3972HNL Enp/Orig Ratio (q) 0.942 1.317 2.567 2.375 3.788 3.038 1.971 2.095 2.094 2.073 2.053 2.035 2.000HNL Income (r) 31287 31602 32178 33900 35503 36889 39532 43262 47484 52273 57721HNL Load Factor (s) 92.2% 83.1% 88.6% 87.2% 89.6% 90.3% 90.5% 90.8% 91.6% 92.2%HNL Originations (t) 36990 37030 40490 42510 42230 46740 44460 46440 43169 45743 50771 56613 63210HNL WN Effect Originations (u) 0 0 0 0 0HNL Total Originations (v) 43169 45743 50771 56613 63210HNL Total Revenue (w) 101931082 94750882 100401423 111436520 124259108 138739081HNL Outbound Passengers (x) 34852 48777 103930 100946 159962 141997 87620 97309 90392 94846 104212 115179 126451HNL Seat Departures (y) 109492 192465 160251 100464 108595 100123 104796 114718 125703 137163HON AAD Seat Departures (o) 0 0 0 0 0 0 0 0 0 0 0 53 59HON Distance (p) 249 249 249 249 249 249 249 249 249 249 249 249 249HON Enp/Orig Ratio (q) N/A N/A 0.015 0.049 0.042 0.000 0.000 0.000 0.000 0.000 0.000 12.300 12.095HON Income (r) 537 513 531 563 557 547 573 611 654 702 757HON Load Factor (s) 0.0% 0.0% 0.0% 0.0% 0.0% 0.0% 0.0% 0.0% 48.7% 49.0%HON Originations (t) 1570 630 750 700 500 0 10 0 0 0 0 761 872 HON WN Effect Originations (u) 0 0 0 0 0HON Total Originations (v) 0 0 0 761 872HON Total Revenue (w) 44703 42490 46606 53377 61249 70188 60,148 HON Outbound Passengers (x) N/A N/A 11 34 21 0 0 0 0 0 0 9358 10545HON Seat Departures (y) 0 0 0 0 0 0 0 0 19225 21530HOU AAD Seat Departures (o) 0 0 0 1117 1091 963 838 807 764 833 947 1073 1207HOU Distance (p) 1034 1034 1034 1034 1034 1034 1034 1034 1034 1034 1034 1034 1034HOU Enp/Orig Ratio (q) 2.367 2.797 3.393 3.033 2.759 2.435 2.417 2.211 2.209 2.188 2.166 2.147 2.111HOU Income (r) 189804 195267 199095 211388 228471 243966 271106 309148 352138 400894 456363
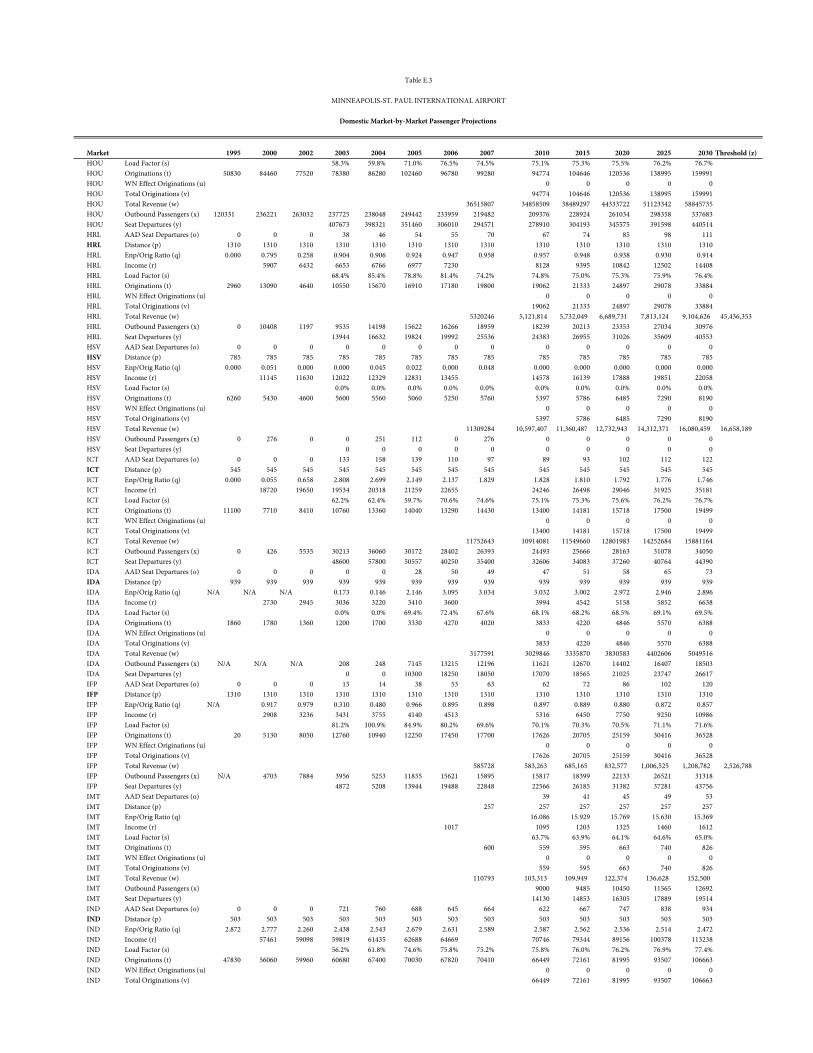
Market 1995 2000 2002 2003 2004 2005 2006 2007 2010 2015 2020 2025 2030 Threshold (z)
Table E.3
MINNEAPOLIS-ST. PAUL INTERNATIONAL AIRPORT
Domestic Market-by-Market Passenger Projections
HOU Load Factor (s) 58.3% 59.8% 71.0% 76.5% 74.5% 75.1% 75.3% 75.5% 76.2% 76.7%HOU Originations (t) 50830 84460 77520 78380 86280 102460 96780 99280 94774 104646 120536 138995 159991HOU WN Effect Originations (u) 0 0 0 0 0HOU Total Originations (v) 94774 104646 120536 138995 159991HOU Total Revenue (w) 36515807 34858509 38489297 44333722 51123342 58845735HOU Outbound Passengers (x) 120331 236221 263032 237725 238048 249442 233959 219482 209376 228924 261034 298358 337683HOU Seat Departures (y) 407673 398321 351460 306010 294571 278910 304193 345575 391598 440514HRL AAD Seat Departures (o) 0 0 0 38 46 54 55 70 67 74 85 98 111HRL Distance (p) 1310 1310 1310 1310 1310 1310 1310 1310 1310 1310 1310 1310 1310HRL Enp/Orig Ratio (q) 0.000 0.795 0.258 0.904 0.906 0.924 0.947 0.958 0.957 0.948 0.938 0.930 0.914HRL Income (r) 5907 6432 6653 6766 6977 7230 8128 9395 10842 12502 14408HRL Load Factor (s) 68.4% 85.4% 78.8% 81.4% 74.2% 74.8% 75.0% 75.3% 75.9% 76.4%HRL Originations (t) 2960 13090 4640 10550 15670 16910 17180 19800 19062 21333 24897 29078 33884HRL WN Effect Originations (u) 0 0 0 0 0HRL Total Originations (v) 19062 21333 24897 29078 33884HRL Total Revenue (w) 5320246 5,121,814 5,732,049 6,689,731 7,813,124 9,104,626 45,436,353HRL Outbound Passengers (x) 0 10408 1197 9535 14198 15622 16266 18959 18239 20213 23353 27034 30976HRL Seat Departures (y) 13944 16632 19824 19992 25536 24383 26955 31026 35609 40553HSV AAD Seat Departures (o) 0 0 0 0 0 0 0 0 0 0 0 0 0HSV Distance (p) 785 785 785 785 785 785 785 785 785 785 785 785 785HSV Enp/Orig Ratio (q) 0.000 0.051 0.000 0.000 0.045 0.022 0.000 0.048 0.000 0.000 0.000 0.000 0.000HSV Income (r) 11145 11630 12022 12329 12831 13455 14578 16139 17888 19851 22058HSV Load Factor (s) 0.0% 0.0% 0.0% 0.0% 0.0% 0.0% 0.0% 0.0% 0.0% 0.0%HSV Originations (t) 6260 5430 4600 5600 5560 5060 5250 5760 5397 5786 6485 7290 8190HSV WN Effect Originations (u) 0 0 0 0 0HSV Total Originations (v) 5397 5786 6485 7290 8190HSV Total Revenue (w) 11309284 10,597,407 11,360,487 12,732,943 14,312,371 16,080,459 16,658,189HSV Outbound Passengers (x) 0 276 0 0 251 112 0 276 0 0 0 0 0HSV Seat Departures (y) 0 0 0 0 0 0 0 0 0 0ICT AAD Seat Departures (o) 0 0 0 133 158 139 110 97 89 93 102 112 122ICT Distance (p) 545 545 545 545 545 545 545 545 545 545 545 545 545ICT Enp/Orig Ratio (q) 0.000 0.055 0.658 2.808 2.699 2.149 2.137 1.829 1.828 1.810 1.792 1.776 1.746ICT Income (r) 18720 19650 19534 20318 21259 22655 24246 26498 29046 31925 35181ICT Load Factor (s) 62.2% 62.4% 59.7% 70.6% 74.6% 75.1% 75.3% 75.6% 76.2% 76.7%ICT Originations (t) 11100 7710 8410 10760 13360 14040 13290 14430 13400 14181 15718 17500 19499ICT WN Effect Originations (u) 0 0 0 0 0ICT Total Originations (v) 13400 14181 15718 17500 19499ICT Total Revenue (w) 11752643 10914081 11549660 12801983 14252684 15881164ICT Outbound Passengers (x) 0 426 5535 30213 36060 30172 28402 26393 24493 25666 28163 31078 34050ICT Seat Departures (y) 48600 57800 50557 40250 35400 32606 34083 37260 40764 44390IDA AAD Seat Departures (o) 0 0 0 0 0 28 50 49 47 51 58 65 73IDA Distance (p) 939 939 939 939 939 939 939 939 939 939 939 939 939IDA Enp/Orig Ratio (q) N/A N/A N/A 0.173 0.146 2.146 3.095 3.034 3.032 3.002 2.972 2.946 2.896IDA Income (r) 2730 2945 3036 3220 3410 3600 3994 4542 5158 5852 6638IDA Load Factor (s) 0.0% 0.0% 69.4% 72.4% 67.6% 68.1% 68.2% 68.5% 69.1% 69.5%IDA Originations (t) 1860 1780 1360 1200 1700 3330 4270 4020 3833 4220 4846 5570 6388IDA WN Effect Originations (u) 0 0 0 0 0IDA Total Originations (v) 3833 4220 4846 5570 6388IDA Total Revenue (w) 3177591 3029846 3335870 3830583 4402606 5049516IDA Outbound Passengers (x) N/A N/A N/A 208 248 7145 13215 12196 11621 12670 14402 16407 18503IDA Seat Departures (y) 0 0 10300 18250 18050 17070 18565 21025 23747 26617IFP AAD Seat Departures (o) 0 0 0 13 14 38 53 63 62 72 86 102 120IFP Distance (p) 1310 1310 1310 1310 1310 1310 1310 1310 1310 1310 1310 1310 1310IFP Enp/Orig Ratio (q) N/A 0.917 0.979 0.310 0.480 0.966 0.895 0.898 0.897 0.889 0.880 0.872 0.857IFP Income (r) 2908 3236 3431 3755 4140 4513 5316 6450 7750 9250 10986IFP Load Factor (s) 81.2% 100.9% 84.9% 80.2% 69.6% 70.1% 70.3% 70.5% 71.1% 71.6%IFP Originations (t) 20 5130 8050 12760 10940 12250 17450 17700 17626 20705 25159 30416 36528IFP WN Effect Originations (u) 0 0 0 0 0IFP Total Originations (v) 17626 20705 25159 30416 36528IFP Total Revenue (w) 585728 583,263 685,165 832,577 1,006,525 1,208,782 2,526,788 IFP Outbound Passengers (x) N/A 4703 7884 3956 5253 11835 15621 15895 15817 18399 22133 26521 31318IFP Seat Departures (y) 4872 5208 13944 19488 22848 22566 26185 31382 37281 43756IMT AAD Seat Departures (o) 39 41 45 49 53IMT Distance (p) 257 257 257 257 257 257IMT Enp/Orig Ratio (q) 16.086 15.929 15.769 15.630 15.369IMT Income (r) 1017 1095 1203 1325 1460 1612IMT Load Factor (s) 63.7% 63.9% 64.1% 64.6% 65.0%IMT Originations (t) 600 559 595 663 740 826IMT WN Effect Originations (u) 0 0 0 0 0IMT Total Originations (v) 559 595 663 740 826IMT Total Revenue (w) 110793 103,313 109,949 122,374 136,628 152,500 IMT Outbound Passengers (x) 9000 9485 10450 11565 12692IMT Seat Departures (y) 14130 14853 16305 17889 19514IND AAD Seat Departures (o) 0 0 0 721 760 688 645 664 622 667 747 838 934IND Distance (p) 503 503 503 503 503 503 503 503 503 503 503 503 503IND Enp/Orig Ratio (q) 2.872 2.777 2.260 2.438 2.543 2.679 2.631 2.589 2.587 2.562 2.536 2.514 2.472IND Income (r) 57461 59098 59819 61435 62688 64669 70746 79344 89156 100378 113238IND Load Factor (s) 56.2% 61.8% 74.6% 75.8% 75.2% 75.8% 76.0% 76.2% 76.9% 77.4%IND Originations (t) 47830 56060 59960 60680 67400 70030 67820 70410 66449 72161 81995 93507 106663IND WN Effect Originations (u) 0 0 0 0 0IND Total Originations (v) 66449 72161 81995 93507 106663
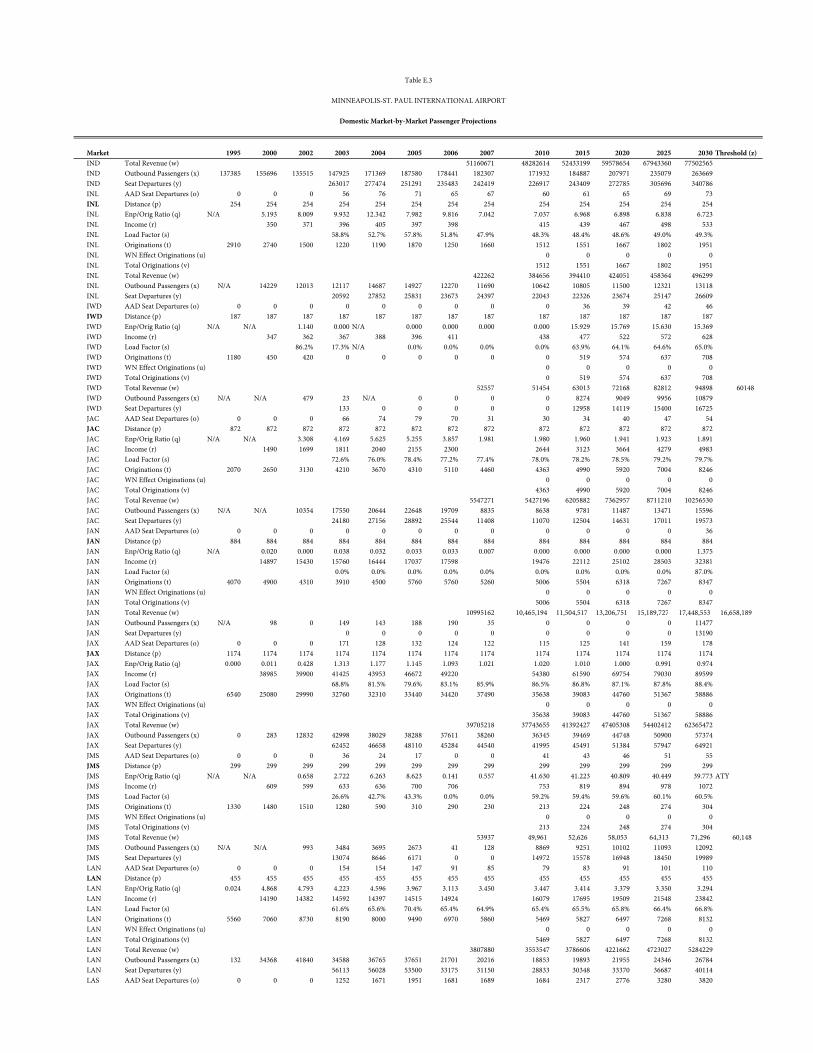
Market 1995 2000 2002 2003 2004 2005 2006 2007 2010 2015 2020 2025 2030 Threshold (z)
Table E.3
MINNEAPOLIS-ST. PAUL INTERNATIONAL AIRPORT
Domestic Market-by-Market Passenger Projections
IND Total Revenue (w) 51160671 48282614 52433199 59578654 67943360 77502565IND Outbound Passengers (x) 137385 155696 135515 147925 171369 187580 178441 182307 171932 184887 207971 235079 263669IND Seat Departures (y) 263017 277474 251291 235483 242419 226917 243409 272785 305696 340786INL AAD Seat Departures (o) 0 0 0 56 76 71 65 67 60 61 65 69 73INL Distance (p) 254 254 254 254 254 254 254 254 254 254 254 254 254INL Enp/Orig Ratio (q) N/A 5.193 8.009 9.932 12.342 7.982 9.816 7.042 7.037 6.968 6.898 6.838 6.723INL Income (r) 350 371 396 405 397 398 415 439 467 498 533INL Load Factor (s) 58.8% 52.7% 57.8% 51.8% 47.9% 48.3% 48.4% 48.6% 49.0% 49.3%INL Originations (t) 2910 2740 1500 1220 1190 1870 1250 1660 1512 1551 1667 1802 1951INL WN Effect Originations (u) 0 0 0 0 0INL Total Originations (v) 1512 1551 1667 1802 1951INL Total Revenue (w) 422262 384656 394410 424051 458364 496299INL Outbound Passengers (x) N/A 14229 12013 12117 14687 14927 12270 11690 10642 10805 11500 12321 13118INL Seat Departures (y) 20592 27852 25831 23673 24397 22043 22326 23674 25147 26609IWD AAD Seat Departures (o) 0 0 0 0 0 0 0 0 0 36 39 42 46IWD Distance (p) 187 187 187 187 187 187 187 187 187 187 187 187 187IWD Enp/Orig Ratio (q) N/A N/A 1.140 0.000 N/A 0.000 0.000 0.000 0.000 15.929 15.769 15.630 15.369IWD Income (r) 347 362 367 388 396 411 438 477 522 572 628IWD Load Factor (s) 86.2% 17.3% N/A 0.0% 0.0% 0.0% 0.0% 63.9% 64.1% 64.6% 65.0%IWD Originations (t) 1180 450 420 0 0 0 0 0 0 519 574 637 708IWD WN Effect Originations (u) 0 0 0 0 0IWD Total Originations (v) 0 519 574 637 708IWD Total Revenue (w) 52557 51454 63013 72168 82812 94898 60148IWD Outbound Passengers (x) N/A N/A 479 23 N/A 0 0 0 0 8274 9049 9956 10879IWD Seat Departures (y) 133 0 0 0 0 0 12958 14119 15400 16725JAC AAD Seat Departures (o) 0 0 0 66 74 79 70 31 30 34 40 47 54JAC Distance (p) 872 872 872 872 872 872 872 872 872 872 872 872 872JAC Enp/Orig Ratio (q) N/A N/A 3.308 4.169 5.625 5.255 3.857 1.981 1.980 1.960 1.941 1.923 1.891JAC Income (r) 1490 1699 1811 2040 2155 2300 2644 3123 3664 4279 4983JAC Load Factor (s) 72.6% 76.0% 78.4% 77.2% 77.4% 78.0% 78.2% 78.5% 79.2% 79.7%JAC Originations (t) 2070 2650 3130 4210 3670 4310 5110 4460 4363 4990 5920 7004 8246JAC WN Effect Originations (u) 0 0 0 0 0JAC Total Originations (v) 4363 4990 5920 7004 8246JAC Total Revenue (w) 5547271 5427196 6205882 7362957 8711210 10256530JAC Outbound Passengers (x) N/A N/A 10354 17550 20644 22648 19709 8835 8638 9781 11487 13471 15596JAC Seat Departures (y) 24180 27156 28892 25544 11408 11070 12504 14631 17011 19573JAN AAD Seat Departures (o) 0 0 0 0 0 0 0 0 0 0 0 0 36JAN Distance (p) 884 884 884 884 884 884 884 884 884 884 884 884 884JAN Enp/Orig Ratio (q) N/A 0.020 0.000 0.038 0.032 0.033 0.033 0.007 0.000 0.000 0.000 0.000 1.375JAN Income (r) 14897 15430 15760 16444 17037 17598 19476 22112 25102 28503 32381JAN Load Factor (s) 0.0% 0.0% 0.0% 0.0% 0.0% 0.0% 0.0% 0.0% 0.0% 87.0%JAN Originations (t) 4070 4900 4310 3910 4500 5760 5760 5260 5006 5504 6318 7267 8347JAN WN Effect Originations (u) 0 0 0 0 0JAN Total Originations (v) 5006 5504 6318 7267 8347JAN Total Revenue (w) 10995162 10,465,194 11,504,517 13,206,751 15,189,727 17,448,553 16,658,189JAN Outbound Passengers (x) N/A 98 0 149 143 188 190 35 0 0 0 0 11477JAN Seat Departures (y) 0 0 0 0 0 0 0 0 0 13190JAX AAD Seat Departures (o) 0 0 0 171 128 132 124 122 115 125 141 159 178JAX Distance (p) 1174 1174 1174 1174 1174 1174 1174 1174 1174 1174 1174 1174 1174JAX Enp/Orig Ratio (q) 0.000 0.011 0.428 1.313 1.177 1.145 1.093 1.021 1.020 1.010 1.000 0.991 0.974JAX Income (r) 38985 39900 41425 43953 46672 49220 54380 61590 69754 79030 89599JAX Load Factor (s) 68.8% 81.5% 79.6% 83.1% 85.9% 86.5% 86.8% 87.1% 87.8% 88.4%JAX Originations (t) 6540 25080 29990 32760 32310 33440 34420 37490 35638 39083 44760 51367 58886JAX WN Effect Originations (u) 0 0 0 0 0JAX Total Originations (v) 35638 39083 44760 51367 58886JAX Total Revenue (w) 39705218 37743655 41392427 47405308 54402412 62365472JAX Outbound Passengers (x) 0 283 12832 42998 38029 38288 37611 38260 36345 39469 44748 50900 57374JAX Seat Departures (y) 62452 46658 48110 45284 44540 41995 45491 51384 57947 64921JMS AAD Seat Departures (o) 0 0 0 36 24 17 0 0 41 43 46 51 55JMS Distance (p) 299 299 299 299 299 299 299 299 299 299 299 299 299JMS Enp/Orig Ratio (q) N/A N/A 0.658 2.722 6.263 8.623 0.141 0.557 41.630 41.223 40.809 40.449 39.773 ATYJMS Income (r) 609 599 633 636 700 706 753 819 894 978 1072JMS Load Factor (s) 26.6% 42.7% 43.3% 0.0% 0.0% 59.2% 59.4% 59.6% 60.1% 60.5%JMS Originations (t) 1330 1480 1510 1280 590 310 290 230 213 224 248 274 304JMS WN Effect Originations (u) 0 0 0 0 0JMS Total Originations (v) 213 224 248 274 304JMS Total Revenue (w) 53937 49,961 52,626 58,053 64,313 71,296 60,148 JMS Outbound Passengers (x) N/A N/A 993 3484 3695 2673 41 128 8869 9251 10102 11093 12092JMS Seat Departures (y) 13074 8646 6171 0 0 14972 15578 16948 18450 19989LAN AAD Seat Departures (o) 0 0 0 154 154 147 91 85 79 83 91 101 110LAN Distance (p) 455 455 455 455 455 455 455 455 455 455 455 455 455LAN Enp/Orig Ratio (q) 0.024 4.868 4.793 4.223 4.596 3.967 3.113 3.450 3.447 3.414 3.379 3.350 3.294LAN Income (r) 14190 14382 14592 14397 14515 14924 16079 17695 19509 21548 23842LAN Load Factor (s) 61.6% 65.6% 70.4% 65.4% 64.9% 65.4% 65.5% 65.8% 66.4% 66.8%LAN Originations (t) 5560 7060 8730 8190 8000 9490 6970 5860 5469 5827 6497 7268 8132LAN WN Effect Originations (u) 0 0 0 0 0LAN Total Originations (v) 5469 5827 6497 7268 8132LAN Total Revenue (w) 3807880 3553547 3786606 4221662 4723027 5284229LAN Outbound Passengers (x) 132 34368 41840 34588 36765 37651 21701 20216 18853 19893 21955 24346 26784LAN Seat Departures (y) 56113 56028 53500 33175 31150 28833 30348 33370 36687 40114LAS AAD Seat Departures (o) 0 0 0 1252 1671 1951 1681 1689 1684 2317 2776 3280 3820
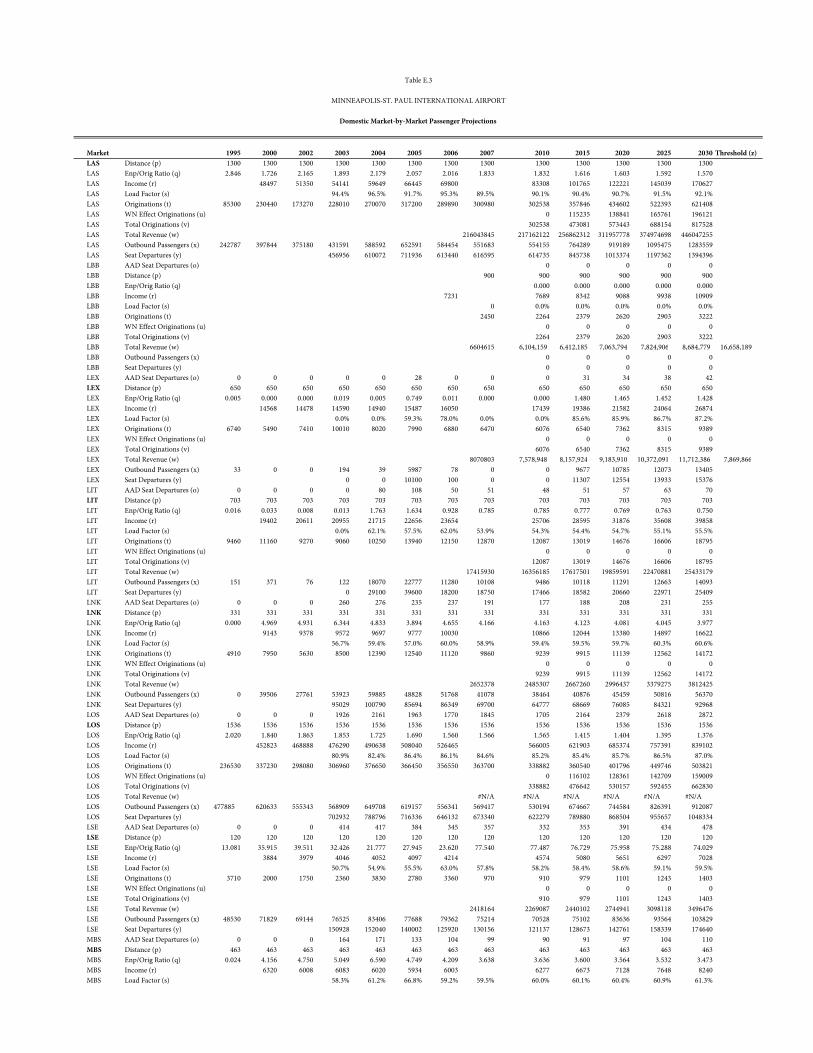
Market 1995 2000 2002 2003 2004 2005 2006 2007 2010 2015 2020 2025 2030 Threshold (z)
Table E.3
MINNEAPOLIS-ST. PAUL INTERNATIONAL AIRPORT
Domestic Market-by-Market Passenger Projections
LAS Distance (p) 1300 1300 1300 1300 1300 1300 1300 1300 1300 1300 1300 1300 1300LAS Enp/Orig Ratio (q) 2.846 1.726 2.165 1.893 2.179 2.057 2.016 1.833 1.832 1.616 1.603 1.592 1.570LAS Income (r) 48497 51350 54141 59649 66445 69800 83308 101765 122221 145039 170627LAS Load Factor (s) 94.4% 96.5% 91.7% 95.3% 89.5% 90.1% 90.4% 90.7% 91.5% 92.1%LAS Originations (t) 85300 230440 173270 228010 270070 317200 289890 300980 302538 357846 434602 522393 621408LAS WN Effect Originations (u) 0 115235 138841 165761 196121LAS Total Originations (v) 302538 473081 573443 688154 817528LAS Total Revenue (w) 216043845 217162122 256862312 311957778 374974698 446047255LAS Outbound Passengers (x) 242787 397844 375180 431591 588592 652591 584454 551683 554155 764289 919189 1095475 1283559LAS Seat Departures (y) 456956 610072 711936 613440 616595 614735 845738 1013374 1197362 1394396LBB AAD Seat Departures (o) 0 0 0 0 0LBB Distance (p) 900 900 900 900 900 900LBB Enp/Orig Ratio (q) 0.000 0.000 0.000 0.000 0.000LBB Income (r) 7231 7689 8342 9088 9938 10909LBB Load Factor (s) 0 0.0% 0.0% 0.0% 0.0% 0.0%LBB Originations (t) 2450 2264 2379 2620 2903 3222LBB WN Effect Originations (u) 0 0 0 0 0LBB Total Originations (v) 2264 2379 2620 2903 3222LBB Total Revenue (w) 6604615 6,104,159 6,412,185 7,063,794 7,824,906 8,684,779 16,658,189LBB Outbound Passengers (x) 0 0 0 0 0LBB Seat Departures (y) 0 0 0 0 0LEX AAD Seat Departures (o) 0 0 0 0 0 28 0 0 0 31 34 38 42LEX Distance (p) 650 650 650 650 650 650 650 650 650 650 650 650 650LEX Enp/Orig Ratio (q) 0.005 0.000 0.000 0.019 0.005 0.749 0.011 0.000 0.000 1.480 1.465 1.452 1.428LEX Income (r) 14568 14478 14590 14940 15487 16050 17439 19386 21582 24064 26874LEX Load Factor (s) 0.0% 0.0% 59.3% 78.0% 0.0% 0.0% 85.6% 85.9% 86.7% 87.2%LEX Originations (t) 6740 5490 7410 10010 8020 7990 6880 6470 6076 6540 7362 8315 9389LEX WN Effect Originations (u) 0 0 0 0 0LEX Total Originations (v) 6076 6540 7362 8315 9389LEX Total Revenue (w) 8070803 7,578,948 8,157,924 9,183,910 10,372,091 11,712,386 7,869,866 LEX Outbound Passengers (x) 33 0 0 194 39 5987 78 0 0 9677 10785 12073 13405LEX Seat Departures (y) 0 0 10100 100 0 0 11307 12554 13933 15376LIT AAD Seat Departures (o) 0 0 0 0 80 108 50 51 48 51 57 63 70LIT Distance (p) 703 703 703 703 703 703 703 703 703 703 703 703 703LIT Enp/Orig Ratio (q) 0.016 0.033 0.008 0.013 1.763 1.634 0.928 0.785 0.785 0.777 0.769 0.763 0.750LIT Income (r) 19402 20611 20955 21715 22656 23654 25706 28595 31876 35608 39858LIT Load Factor (s) 0.0% 62.1% 57.5% 62.0% 53.9% 54.3% 54.4% 54.7% 55.1% 55.5%LIT Originations (t) 9460 11160 9270 9060 10250 13940 12150 12870 12087 13019 14676 16606 18795LIT WN Effect Originations (u) 0 0 0 0 0LIT Total Originations (v) 12087 13019 14676 16606 18795LIT Total Revenue (w) 17415930 16356185 17617501 19859591 22470881 25433179LIT Outbound Passengers (x) 151 371 76 122 18070 22777 11280 10108 9486 10118 11291 12663 14093LIT Seat Departures (y) 0 29100 39600 18200 18750 17466 18582 20660 22971 25409LNK AAD Seat Departures (o) 0 0 0 260 276 235 237 191 177 188 208 231 255LNK Distance (p) 331 331 331 331 331 331 331 331 331 331 331 331 331LNK Enp/Orig Ratio (q) 0.000 4.969 4.931 6.344 4.833 3.894 4.655 4.166 4.163 4.123 4.081 4.045 3.977LNK Income (r) 9143 9378 9572 9697 9777 10030 10866 12044 13380 14897 16622LNK Load Factor (s) 56.7% 59.4% 57.0% 60.0% 58.9% 59.4% 59.5% 59.7% 60.3% 60.6%LNK Originations (t) 4910 7950 5630 8500 12390 12540 11120 9860 9239 9915 11139 12562 14172LNK WN Effect Originations (u) 0 0 0 0 0LNK Total Originations (v) 9239 9915 11139 12562 14172LNK Total Revenue (w) 2652378 2485307 2667260 2996437 3379275 3812425LNK Outbound Passengers (x) 0 39506 27761 53923 59885 48828 51768 41078 38464 40876 45459 50816 56370LNK Seat Departures (y) 95029 100790 85694 86349 69700 64777 68669 76085 84321 92968LOS AAD Seat Departures (o) 0 0 0 1926 2161 1963 1770 1845 1705 2164 2379 2618 2872LOS Distance (p) 1536 1536 1536 1536 1536 1536 1536 1536 1536 1536 1536 1536 1536LOS Enp/Orig Ratio (q) 2.020 1.840 1.863 1.853 1.725 1.690 1.560 1.566 1.565 1.415 1.404 1.395 1.376LOS Income (r) 452823 468888 476290 490638 508040 526465 566005 621903 685374 757391 839102LOS Load Factor (s) 80.9% 82.4% 86.4% 86.1% 84.6% 85.2% 85.4% 85.7% 86.5% 87.0%LOS Originations (t) 236530 337230 298080 306960 376650 366450 356550 363700 338882 360540 401796 449746 503821LOS WN Effect Originations (u) 0 116102 128361 142709 159009LOS Total Originations (v) 338882 476642 530157 592455 662830LOS Total Revenue (w) #N/A #N/A #N/A #N/A #N/A #N/ALOS Outbound Passengers (x) 477885 620633 555343 568909 649708 619157 556341 569417 530194 674667 744584 826391 912087LOS Seat Departures (y) 702932 788796 716336 646132 673340 622279 789880 868504 955657 1048334LSE AAD Seat Departures (o) 0 0 0 414 417 384 345 357 332 353 391 434 478LSE Distance (p) 120 120 120 120 120 120 120 120 120 120 120 120 120LSE Enp/Orig Ratio (q) 13.081 35.915 39.511 32.426 21.777 27.945 23.620 77.540 77.487 76.729 75.958 75.288 74.029LSE Income (r) 3884 3979 4046 4052 4097 4214 4574 5080 5651 6297 7028LSE Load Factor (s) 50.7% 54.9% 55.5% 63.0% 57.8% 58.2% 58.4% 58.6% 59.1% 59.5%LSE Originations (t) 3710 2000 1750 2360 3830 2780 3360 970 910 979 1101 1243 1403LSE WN Effect Originations (u) 0 0 0 0 0LSE Total Originations (v) 910 979 1101 1243 1403LSE Total Revenue (w) 2418164 2269087 2440102 2744941 3098118 3496476LSE Outbound Passengers (x) 48530 71829 69144 76525 83406 77688 79362 75214 70528 75102 83636 93564 103829LSE Seat Departures (y) 150928 152040 140002 125920 130156 121137 128673 142761 158339 174640MBS AAD Seat Departures (o) 0 0 0 164 171 133 104 99 90 91 97 104 110MBS Distance (p) 463 463 463 463 463 463 463 463 463 463 463 463 463MBS Enp/Orig Ratio (q) 0.024 4.156 4.750 5.049 6.590 4.749 4.209 3.638 3.636 3.600 3.564 3.532 3.473MBS Income (r) 6320 6008 6083 6020 5934 6003 6277 6673 7128 7648 8240MBS Load Factor (s) 58.3% 61.2% 66.8% 59.2% 59.5% 60.0% 60.1% 60.4% 60.9% 61.3%
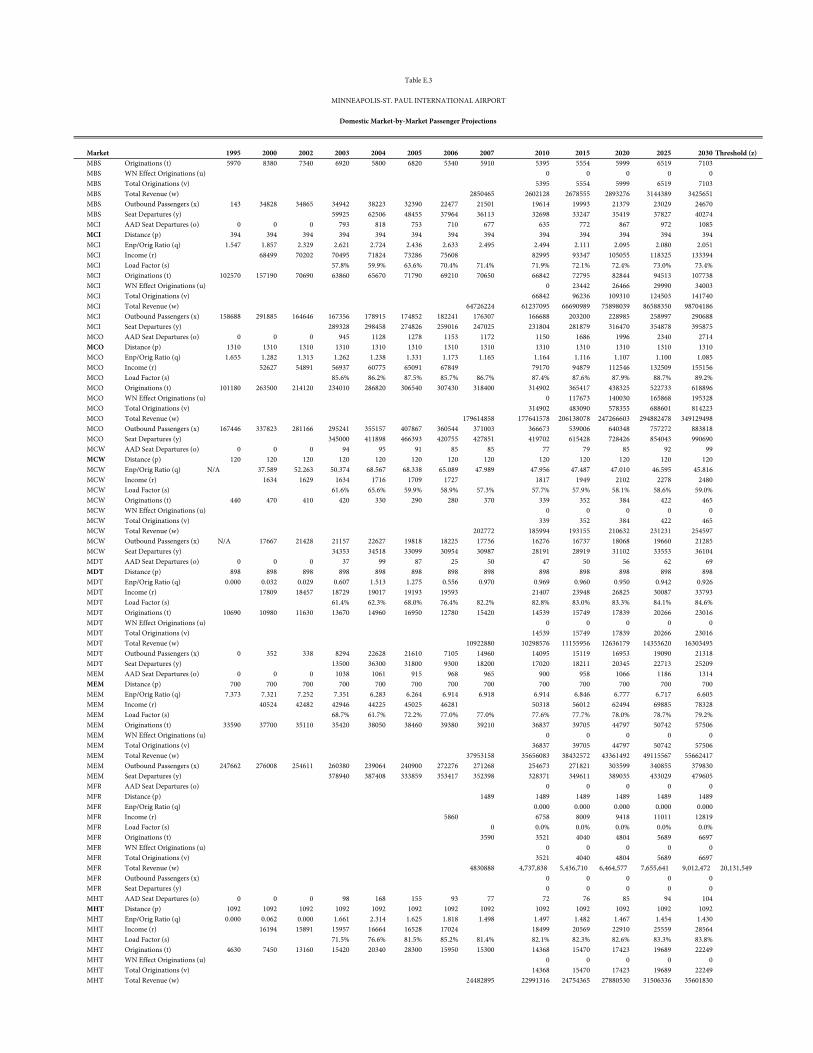
Market 1995 2000 2002 2003 2004 2005 2006 2007 2010 2015 2020 2025 2030 Threshold (z)
Table E.3
MINNEAPOLIS-ST. PAUL INTERNATIONAL AIRPORT
Domestic Market-by-Market Passenger Projections
MBS Originations (t) 5970 8380 7340 6920 5800 6820 5340 5910 5395 5554 5999 6519 7103MBS WN Effect Originations (u) 0 0 0 0 0MBS Total Originations (v) 5395 5554 5999 6519 7103MBS Total Revenue (w) 2850465 2602128 2678555 2893276 3144389 3425651MBS Outbound Passengers (x) 143 34828 34865 34942 38223 32390 22477 21501 19614 19993 21379 23029 24670MBS Seat Departures (y) 59925 62506 48455 37964 36113 32698 33247 35419 37827 40274MCI AAD Seat Departures (o) 0 0 0 793 818 753 710 677 635 772 867 972 1085MCI Distance (p) 394 394 394 394 394 394 394 394 394 394 394 394 394MCI Enp/Orig Ratio (q) 1.547 1.857 2.329 2.621 2.724 2.436 2.633 2.495 2.494 2.111 2.095 2.080 2.051MCI Income (r) 68499 70202 70495 71824 73286 75608 82995 93347 105055 118325 133394MCI Load Factor (s) 57.8% 59.9% 63.6% 70.4% 71.4% 71.9% 72.1% 72.4% 73.0% 73.4%MCI Originations (t) 102570 157190 70690 63860 65670 71790 69210 70650 66842 72795 82844 94513 107738MCI WN Effect Originations (u) 0 23442 26466 29990 34003MCI Total Originations (v) 66842 96236 109310 124503 141740MCI Total Revenue (w) 64726224 61237095 66690989 75898039 86588350 98704186MCI Outbound Passengers (x) 158688 291885 164646 167356 178915 174852 182241 176307 166688 203200 228985 258997 290688MCI Seat Departures (y) 289328 298458 274826 259016 247025 231804 281879 316470 354878 395875MCO AAD Seat Departures (o) 0 0 0 945 1128 1278 1153 1172 1150 1686 1996 2340 2714MCO Distance (p) 1310 1310 1310 1310 1310 1310 1310 1310 1310 1310 1310 1310 1310MCO Enp/Orig Ratio (q) 1.655 1.282 1.313 1.262 1.238 1.331 1.173 1.165 1.164 1.116 1.107 1.100 1.085MCO Income (r) 52627 54891 56937 60775 65091 67849 79170 94879 112546 132509 155156MCO Load Factor (s) 85.6% 86.2% 87.5% 85.7% 86.7% 87.4% 87.6% 87.9% 88.7% 89.2%MCO Originations (t) 101180 263500 214120 234010 286820 306540 307430 318400 314902 365417 438325 522733 618896MCO WN Effect Originations (u) 0 117673 140030 165868 195328MCO Total Originations (v) 314902 483090 578355 688601 814223MCO Total Revenue (w) 179614858 177641578 206138078 247266603 294882478 349129498MCO Outbound Passengers (x) 167446 337823 281166 295241 355157 407867 360544 371003 366673 539006 640348 757272 883818MCO Seat Departures (y) 345000 411898 466393 420755 427851 419702 615428 728426 854043 990690MCW AAD Seat Departures (o) 0 0 0 94 95 91 85 85 77 79 85 92 99MCW Distance (p) 120 120 120 120 120 120 120 120 120 120 120 120 120MCW Enp/Orig Ratio (q) N/A 37.589 52.263 50.374 68.567 68.338 65.089 47.989 47.956 47.487 47.010 46.595 45.816MCW Income (r) 1634 1629 1634 1716 1709 1727 1817 1949 2102 2278 2480MCW Load Factor (s) 61.6% 65.6% 59.9% 58.9% 57.3% 57.7% 57.9% 58.1% 58.6% 59.0%MCW Originations (t) 440 470 410 420 330 290 280 370 339 352 384 422 465MCW WN Effect Originations (u) 0 0 0 0 0MCW Total Originations (v) 339 352 384 422 465MCW Total Revenue (w) 202772 185994 193155 210632 231231 254597MCW Outbound Passengers (x) N/A 17667 21428 21157 22627 19818 18225 17756 16276 16737 18068 19660 21285MCW Seat Departures (y) 34353 34518 33099 30954 30987 28191 28919 31102 33553 36104MDT AAD Seat Departures (o) 0 0 0 37 99 87 25 50 47 50 56 62 69MDT Distance (p) 898 898 898 898 898 898 898 898 898 898 898 898 898MDT Enp/Orig Ratio (q) 0.000 0.032 0.029 0.607 1.513 1.275 0.556 0.970 0.969 0.960 0.950 0.942 0.926MDT Income (r) 17809 18457 18729 19017 19193 19593 21407 23948 26825 30087 33793MDT Load Factor (s) 61.4% 62.3% 68.0% 76.4% 82.2% 82.8% 83.0% 83.3% 84.1% 84.6%MDT Originations (t) 10690 10980 11630 13670 14960 16950 12780 15420 14539 15749 17839 20266 23016MDT WN Effect Originations (u) 0 0 0 0 0MDT Total Originations (v) 14539 15749 17839 20266 23016MDT Total Revenue (w) 10922880 10298576 11155956 12636179 14355620 16303495MDT Outbound Passengers (x) 0 352 338 8294 22628 21610 7105 14960 14095 15119 16953 19090 21318MDT Seat Departures (y) 13500 36300 31800 9300 18200 17020 18211 20345 22713 25209MEM AAD Seat Departures (o) 0 0 0 1038 1061 915 968 965 900 958 1066 1186 1314MEM Distance (p) 700 700 700 700 700 700 700 700 700 700 700 700 700MEM Enp/Orig Ratio (q) 7.373 7.321 7.252 7.351 6.283 6.264 6.914 6.918 6.914 6.846 6.777 6.717 6.605MEM Income (r) 40524 42482 42946 44225 45025 46281 50318 56012 62494 69885 78328MEM Load Factor (s) 68.7% 61.7% 72.2% 77.0% 77.0% 77.6% 77.7% 78.0% 78.7% 79.2%MEM Originations (t) 33590 37700 35110 35420 38050 38460 39380 39210 36837 39705 44797 50742 57506MEM WN Effect Originations (u) 0 0 0 0 0MEM Total Originations (v) 36837 39705 44797 50742 57506MEM Total Revenue (w) 37953158 35656083 38432572 43361492 49115567 55662417MEM Outbound Passengers (x) 247662 276008 254611 260380 239064 240900 272276 271268 254673 271821 303599 340855 379830MEM Seat Departures (y) 378940 387408 333859 353417 352398 328371 349611 389035 433029 479605MFR AAD Seat Departures (o) 0 0 0 0 0MFR Distance (p) 1489 1489 1489 1489 1489 1489MFR Enp/Orig Ratio (q) 0.000 0.000 0.000 0.000 0.000MFR Income (r) 5860 6758 8009 9418 11011 12819MFR Load Factor (s) 0 0.0% 0.0% 0.0% 0.0% 0.0%MFR Originations (t) 3590 3521 4040 4804 5689 6697MFR WN Effect Originations (u) 0 0 0 0 0MFR Total Originations (v) 3521 4040 4804 5689 6697MFR Total Revenue (w) 4830888 4,737,838 5,436,710 6,464,577 7,655,641 9,012,472 20,131,549MFR Outbound Passengers (x) 0 0 0 0 0MFR Seat Departures (y) 0 0 0 0 0MHT AAD Seat Departures (o) 0 0 0 98 168 155 93 77 72 76 85 94 104MHT Distance (p) 1092 1092 1092 1092 1092 1092 1092 1092 1092 1092 1092 1092 1092MHT Enp/Orig Ratio (q) 0.000 0.062 0.000 1.661 2.314 1.625 1.818 1.498 1.497 1.482 1.467 1.454 1.430MHT Income (r) 16194 15891 15957 16664 16528 17024 18499 20569 22910 25559 28564MHT Load Factor (s) 71.5% 76.6% 81.5% 85.2% 81.4% 82.1% 82.3% 82.6% 83.3% 83.8%MHT Originations (t) 4630 7450 13160 15420 20340 28300 15950 15300 14368 15470 17423 19689 22249MHT WN Effect Originations (u) 0 0 0 0 0MHT Total Originations (v) 14368 15470 17423 19689 22249MHT Total Revenue (w) 24482895 22991316 24754365 27880530 31506336 35601830
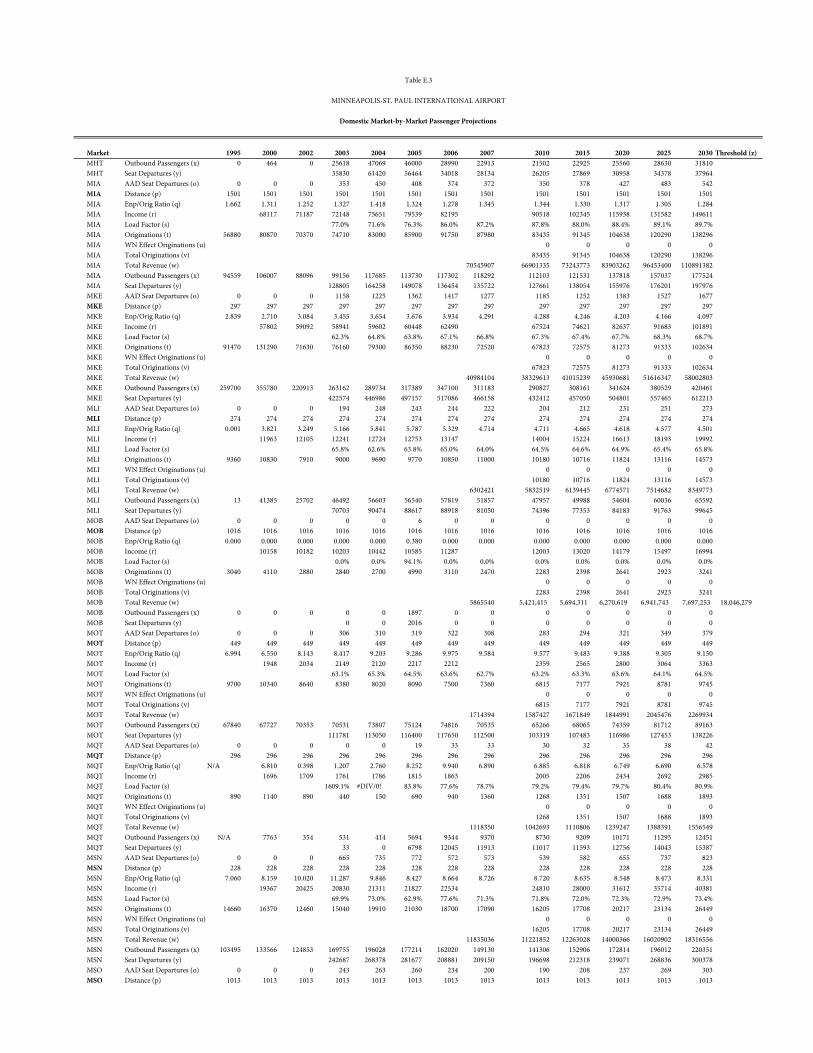
Market 1995 2000 2002 2003 2004 2005 2006 2007 2010 2015 2020 2025 2030 Threshold (z)
Table E.3
MINNEAPOLIS-ST. PAUL INTERNATIONAL AIRPORT
Domestic Market-by-Market Passenger Projections
MHT Outbound Passengers (x) 0 464 0 25618 47069 46000 28990 22913 21502 22925 25560 28630 31810MHT Seat Departures (y) 35830 61420 56464 34018 28134 26205 27869 30958 34378 37964MIA AAD Seat Departures (o) 0 0 0 353 450 408 374 372 350 378 427 483 542MIA Distance (p) 1501 1501 1501 1501 1501 1501 1501 1501 1501 1501 1501 1501 1501MIA Enp/Orig Ratio (q) 1.662 1.311 1.252 1.327 1.418 1.324 1.278 1.345 1.344 1.330 1.317 1.305 1.284MIA Income (r) 68117 71187 72148 75651 79539 82195 90518 102345 115938 131582 149611MIA Load Factor (s) 77.0% 71.6% 76.3% 86.0% 87.2% 87.8% 88.0% 88.4% 89.1% 89.7%MIA Originations (t) 56880 80870 70370 74710 83000 85900 91750 87980 83435 91345 104638 120290 138296MIA WN Effect Originations (u) 0 0 0 0 0MIA Total Originations (v) 83435 91345 104638 120290 138296MIA Total Revenue (w) 70545907 66901335 73243773 83903262 96453400 110891382MIA Outbound Passengers (x) 94559 106007 88096 99156 117685 113730 117302 118292 112103 121531 137818 157037 177524MIA Seat Departures (y) 128805 164258 149078 136454 135722 127661 138054 155976 176201 197976MKE AAD Seat Departures (o) 0 0 0 1158 1225 1362 1417 1277 1185 1252 1383 1527 1677MKE Distance (p) 297 297 297 297 297 297 297 297 297 297 297 297 297MKE Enp/Orig Ratio (q) 2.839 2.710 3.084 3.455 3.654 3.676 3.934 4.291 4.288 4.246 4.203 4.166 4.097MKE Income (r) 57802 59092 58941 59602 60448 62490 67524 74621 82637 91683 101891MKE Load Factor (s) 62.3% 64.8% 63.8% 67.1% 66.8% 67.3% 67.4% 67.7% 68.3% 68.7%MKE Originations (t) 91470 131290 71630 76160 79300 86350 88230 72520 67823 72575 81273 91333 102634MKE WN Effect Originations (u) 0 0 0 0 0MKE Total Originations (v) 67823 72575 81273 91333 102634MKE Total Revenue (w) 40984104 38329613 41015239 45930681 51616347 58002803MKE Outbound Passengers (x) 259700 355780 220913 263162 289734 317389 347100 311183 290827 308161 341624 380529 420461MKE Seat Departures (y) 422574 446986 497157 517086 466158 432412 457050 504801 557465 612213MLI AAD Seat Departures (o) 0 0 0 194 248 243 244 222 204 212 231 251 273MLI Distance (p) 274 274 274 274 274 274 274 274 274 274 274 274 274MLI Enp/Orig Ratio (q) 0.001 3.821 3.249 5.166 5.841 5.787 5.329 4.714 4.711 4.665 4.618 4.577 4.501MLI Income (r) 11963 12105 12241 12724 12753 13147 14004 15224 16613 18193 19992MLI Load Factor (s) 65.8% 62.6% 63.8% 65.0% 64.0% 64.5% 64.6% 64.9% 65.4% 65.8%MLI Originations (t) 9360 10830 7910 9000 9690 9770 10850 11000 10180 10716 11824 13116 14573MLI WN Effect Originations (u) 0 0 0 0 0MLI Total Originations (v) 10180 10716 11824 13116 14573MLI Total Revenue (w) 6302421 5832519 6139445 6774571 7514682 8349773MLI Outbound Passengers (x) 13 41385 25702 46492 56603 56540 57819 51857 47957 49988 54604 60036 65592MLI Seat Departures (y) 70703 90474 88617 88918 81050 74396 77353 84183 91763 99645MOB AAD Seat Departures (o) 0 0 0 0 0 6 0 0 0 0 0 0 0MOB Distance (p) 1016 1016 1016 1016 1016 1016 1016 1016 1016 1016 1016 1016 1016MOB Enp/Orig Ratio (q) 0.000 0.000 0.000 0.000 0.000 0.380 0.000 0.000 0.000 0.000 0.000 0.000 0.000MOB Income (r) 10158 10182 10203 10442 10585 11287 12003 13020 14179 15497 16994MOB Load Factor (s) 0.0% 0.0% 94.1% 0.0% 0.0% 0.0% 0.0% 0.0% 0.0% 0.0%MOB Originations (t) 3040 4110 2880 2840 2700 4990 3110 2470 2283 2398 2641 2923 3241MOB WN Effect Originations (u) 0 0 0 0 0MOB Total Originations (v) 2283 2398 2641 2923 3241MOB Total Revenue (w) 5865540 5,421,415 5,694,311 6,270,619 6,941,743 7,697,253 18,046,279MOB Outbound Passengers (x) 0 0 0 0 0 1897 0 0 0 0 0 0 0MOB Seat Departures (y) 0 0 2016 0 0 0 0 0 0 0MOT AAD Seat Departures (o) 0 0 0 306 310 319 322 308 283 294 321 349 379MOT Distance (p) 449 449 449 449 449 449 449 449 449 449 449 449 449MOT Enp/Orig Ratio (q) 6.994 6.550 8.143 8.417 9.203 9.286 9.975 9.584 9.577 9.483 9.388 9.305 9.150MOT Income (r) 1948 2034 2149 2120 2217 2212 2359 2565 2800 3064 3363MOT Load Factor (s) 63.1% 65.3% 64.5% 63.6% 62.7% 63.2% 63.3% 63.6% 64.1% 64.5%MOT Originations (t) 9700 10340 8640 8380 8020 8090 7500 7360 6815 7177 7921 8781 9745MOT WN Effect Originations (u) 0 0 0 0 0MOT Total Originations (v) 6815 7177 7921 8781 9745MOT Total Revenue (w) 1714394 1587427 1671849 1844991 2045476 2269934MOT Outbound Passengers (x) 67840 67727 70353 70531 73807 75124 74816 70535 65266 68065 74359 81712 89163MOT Seat Departures (y) 111781 113050 116400 117650 112500 103319 107483 116986 127453 138226MQT AAD Seat Departures (o) 0 0 0 0 0 19 33 33 30 32 35 38 42MQT Distance (p) 296 296 296 296 296 296 296 296 296 296 296 296 296MQT Enp/Orig Ratio (q) N/A 6.810 0.398 1.207 2.760 8.252 9.940 6.890 6.885 6.818 6.749 6.690 6.578MQT Income (r) 1696 1709 1761 1786 1815 1863 2005 2206 2434 2692 2985MQT Load Factor (s) 1609.1% #DIV/0! 83.8% 77.6% 78.7% 79.2% 79.4% 79.7% 80.4% 80.9%MQT Originations (t) 890 1140 890 440 150 690 940 1360 1268 1351 1507 1688 1893MQT WN Effect Originations (u) 0 0 0 0 0MQT Total Originations (v) 1268 1351 1507 1688 1893MQT Total Revenue (w) 1118350 1042693 1110806 1239247 1388391 1556549MQT Outbound Passengers (x) N/A 7763 354 531 414 5694 9344 9370 8730 9209 10171 11295 12451MQT Seat Departures (y) 33 0 6798 12045 11913 11017 11593 12756 14043 15387MSN AAD Seat Departures (o) 0 0 0 665 735 772 572 573 539 582 655 737 823MSN Distance (p) 228 228 228 228 228 228 228 228 228 228 228 228 228MSN Enp/Orig Ratio (q) 7.060 8.159 10.020 11.287 9.846 8.427 8.664 8.726 8.720 8.635 8.548 8.473 8.331MSN Income (r) 19367 20425 20830 21311 21827 22534 24810 28000 31612 35714 40381MSN Load Factor (s) 69.9% 73.0% 62.9% 77.6% 71.3% 71.8% 72.0% 72.3% 72.9% 73.4%MSN Originations (t) 14660 16370 12460 15040 19910 21030 18700 17090 16205 17708 20217 23134 26449MSN WN Effect Originations (u) 0 0 0 0 0MSN Total Originations (v) 16205 17708 20217 23134 26449MSN Total Revenue (w) 11835036 11221852 12263028 14000366 16020902 18316556MSN Outbound Passengers (x) 103495 133566 124853 169755 196028 177214 162020 149130 141306 152906 172814 196012 220351MSN Seat Departures (y) 242687 268378 281677 208881 209150 196698 212318 239071 268836 300378MSO AAD Seat Departures (o) 0 0 0 243 263 260 234 200 190 208 237 269 303MSO Distance (p) 1013 1013 1013 1013 1013 1013 1013 1013 1013 1013 1013 1013 1013
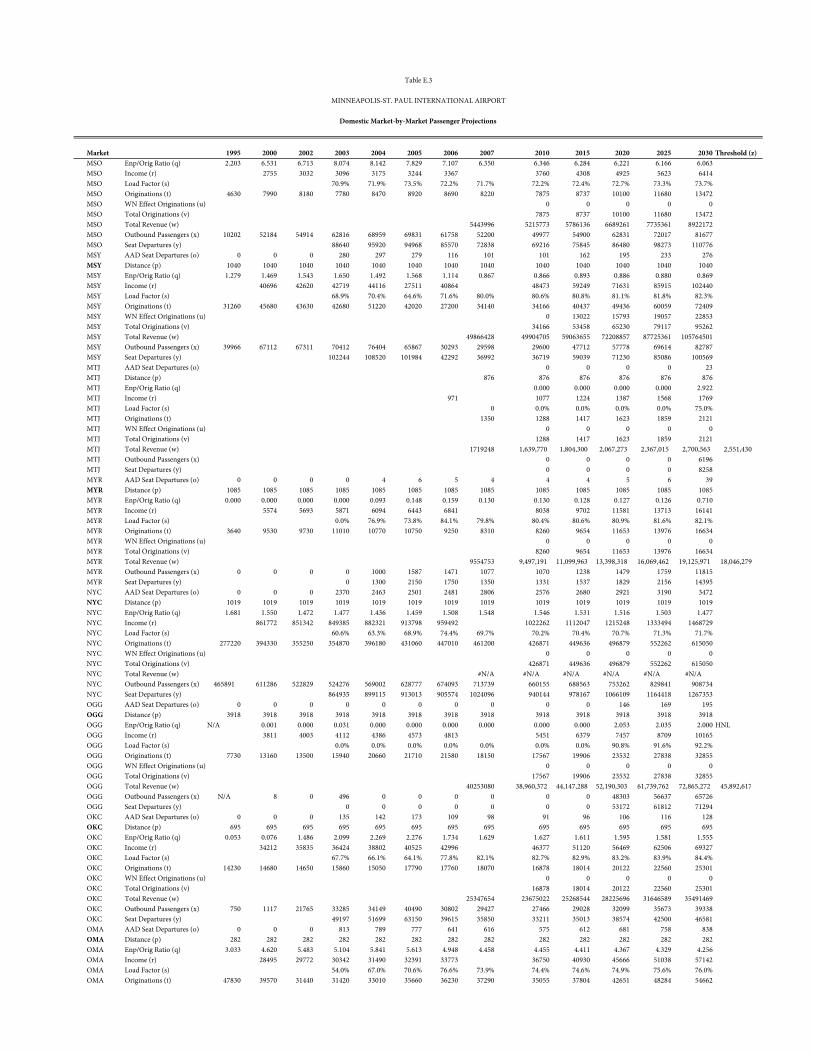
Market 1995 2000 2002 2003 2004 2005 2006 2007 2010 2015 2020 2025 2030 Threshold (z)
Table E.3
MINNEAPOLIS-ST. PAUL INTERNATIONAL AIRPORT
Domestic Market-by-Market Passenger Projections
MSO Enp/Orig Ratio (q) 2.203 6.531 6.713 8.074 8.142 7.829 7.107 6.350 6.346 6.284 6.221 6.166 6.063MSO Income (r) 2755 3032 3096 3175 3244 3367 3760 4308 4925 5623 6414MSO Load Factor (s) 70.9% 71.9% 73.5% 72.2% 71.7% 72.2% 72.4% 72.7% 73.3% 73.7%MSO Originations (t) 4630 7990 8180 7780 8470 8920 8690 8220 7875 8737 10100 11680 13472MSO WN Effect Originations (u) 0 0 0 0 0MSO Total Originations (v) 7875 8737 10100 11680 13472MSO Total Revenue (w) 5443996 5215773 5786136 6689261 7735361 8922172MSO Outbound Passengers (x) 10202 52184 54914 62816 68959 69831 61758 52200 49977 54900 62831 72017 81677MSO Seat Departures (y) 88640 95920 94968 85570 72838 69216 75845 86480 98273 110776MSY AAD Seat Departures (o) 0 0 0 280 297 279 116 101 101 162 195 233 276MSY Distance (p) 1040 1040 1040 1040 1040 1040 1040 1040 1040 1040 1040 1040 1040MSY Enp/Orig Ratio (q) 1.279 1.469 1.543 1.650 1.492 1.568 1.114 0.867 0.866 0.893 0.886 0.880 0.869MSY Income (r) 40696 42620 42719 44116 27511 40864 48473 59249 71631 85915 102440MSY Load Factor (s) 68.9% 70.4% 64.6% 71.6% 80.0% 80.6% 80.8% 81.1% 81.8% 82.3%MSY Originations (t) 31260 45680 43630 42680 51220 42020 27200 34140 34166 40437 49436 60059 72409MSY WN Effect Originations (u) 0 13022 15793 19057 22853MSY Total Originations (v) 34166 53458 65230 79117 95262MSY Total Revenue (w) 49866428 49904705 59063655 72208857 87725361 105764501MSY Outbound Passengers (x) 39966 67112 67311 70412 76404 65867 30293 29598 29600 47712 57778 69614 82787MSY Seat Departures (y) 102244 108520 101984 42292 36992 36719 59039 71230 85086 100569MTJ AAD Seat Departures (o) 0 0 0 0 23MTJ Distance (p) 876 876 876 876 876 876MTJ Enp/Orig Ratio (q) 0.000 0.000 0.000 0.000 2.922MTJ Income (r) 971 1077 1224 1387 1568 1769MTJ Load Factor (s) 0 0.0% 0.0% 0.0% 0.0% 75.0%MTJ Originations (t) 1350 1288 1417 1623 1859 2121MTJ WN Effect Originations (u) 0 0 0 0 0MTJ Total Originations (v) 1288 1417 1623 1859 2121MTJ Total Revenue (w) 1719248 1,639,770 1,804,300 2,067,273 2,367,015 2,700,563 2,551,430 MTJ Outbound Passengers (x) 0 0 0 0 6196MTJ Seat Departures (y) 0 0 0 0 8258MYR AAD Seat Departures (o) 0 0 0 0 4 6 5 4 4 4 5 6 39MYR Distance (p) 1085 1085 1085 1085 1085 1085 1085 1085 1085 1085 1085 1085 1085MYR Enp/Orig Ratio (q) 0.000 0.000 0.000 0.000 0.093 0.148 0.159 0.130 0.130 0.128 0.127 0.126 0.710MYR Income (r) 5574 5693 5871 6094 6443 6841 8038 9702 11581 13713 16141MYR Load Factor (s) 0.0% 76.9% 73.8% 84.1% 79.8% 80.4% 80.6% 80.9% 81.6% 82.1%MYR Originations (t) 3640 9530 9730 11010 10770 10750 9250 8310 8260 9654 11653 13976 16634MYR WN Effect Originations (u) 0 0 0 0 0MYR Total Originations (v) 8260 9654 11653 13976 16634MYR Total Revenue (w) 9554753 9,497,191 11,099,963 13,398,318 16,069,462 19,125,971 18,046,279MYR Outbound Passengers (x) 0 0 0 0 1000 1587 1471 1077 1070 1238 1479 1759 11815MYR Seat Departures (y) 0 1300 2150 1750 1350 1331 1537 1829 2156 14395NYC AAD Seat Departures (o) 0 0 0 2370 2463 2501 2481 2806 2576 2680 2921 3190 3472NYC Distance (p) 1019 1019 1019 1019 1019 1019 1019 1019 1019 1019 1019 1019 1019NYC Enp/Orig Ratio (q) 1.681 1.550 1.472 1.477 1.436 1.459 1.508 1.548 1.546 1.531 1.516 1.503 1.477NYC Income (r) 861772 851342 849385 882321 913798 959492 1022262 1112047 1215248 1333494 1468729NYC Load Factor (s) 60.6% 63.3% 68.9% 74.4% 69.7% 70.2% 70.4% 70.7% 71.3% 71.7%NYC Originations (t) 277220 394330 355250 354870 396180 431060 447010 461200 426871 449636 496879 552262 615050NYC WN Effect Originations (u) 0 0 0 0 0NYC Total Originations (v) 426871 449636 496879 552262 615050NYC Total Revenue (w) #N/A #N/A #N/A #N/A #N/A #N/ANYC Outbound Passengers (x) 465891 611286 522829 524276 569002 628777 674093 713739 660155 688563 753262 829841 908734NYC Seat Departures (y) 864935 899115 913013 905574 1024096 940144 978167 1066109 1164418 1267353OGG AAD Seat Departures (o) 0 0 0 0 0 0 0 0 0 0 146 169 195OGG Distance (p) 3918 3918 3918 3918 3918 3918 3918 3918 3918 3918 3918 3918 3918OGG Enp/Orig Ratio (q) N/A 0.001 0.000 0.031 0.000 0.000 0.000 0.000 0.000 0.000 2.053 2.035 2.000 HNLOGG Income (r) 3811 4003 4112 4386 4573 4813 5451 6379 7457 8709 10165OGG Load Factor (s) 0.0% 0.0% 0.0% 0.0% 0.0% 0.0% 0.0% 90.8% 91.6% 92.2%OGG Originations (t) 7730 13160 13500 15940 20660 21710 21580 18150 17567 19906 23532 27838 32855OGG WN Effect Originations (u) 0 0 0 0 0OGG Total Originations (v) 17567 19906 23532 27838 32855OGG Total Revenue (w) 40253080 38,960,372 44,147,288 52,190,303 61,739,762 72,865,272 45,892,617OGG Outbound Passengers (x) N/A 8 0 496 0 0 0 0 0 0 48303 56637 65726OGG Seat Departures (y) 0 0 0 0 0 0 0 53172 61812 71294OKC AAD Seat Departures (o) 0 0 0 135 142 173 109 98 91 96 106 116 128OKC Distance (p) 695 695 695 695 695 695 695 695 695 695 695 695 695OKC Enp/Orig Ratio (q) 0.053 0.076 1.486 2.099 2.269 2.276 1.734 1.629 1.627 1.611 1.595 1.581 1.555OKC Income (r) 34212 35835 36424 38802 40525 42996 46377 51120 56469 62506 69327OKC Load Factor (s) 67.7% 66.1% 64.1% 77.8% 82.1% 82.7% 82.9% 83.2% 83.9% 84.4%OKC Originations (t) 14230 14680 14650 15860 15050 17790 17760 18070 16878 18014 20122 22560 25301OKC WN Effect Originations (u) 0 0 0 0 0OKC Total Originations (v) 16878 18014 20122 22560 25301OKC Total Revenue (w) 25347654 23675022 25268544 28225696 31646589 35491469OKC Outbound Passengers (x) 750 1117 21765 33285 34149 40490 30802 29427 27466 29028 32099 35673 39338OKC Seat Departures (y) 49197 51699 63150 39615 35850 33211 35013 38574 42500 46581OMA AAD Seat Departures (o) 0 0 0 813 789 777 641 616 575 612 681 758 838OMA Distance (p) 282 282 282 282 282 282 282 282 282 282 282 282 282OMA Enp/Orig Ratio (q) 3.033 4.620 5.483 5.104 5.841 5.613 4.948 4.458 4.455 4.411 4.367 4.329 4.256OMA Income (r) 28495 29772 30342 31490 32391 33773 36750 40930 45666 51038 57142OMA Load Factor (s) 54.0% 67.0% 70.6% 76.6% 73.9% 74.4% 74.6% 74.9% 75.6% 76.0%OMA Originations (t) 47830 39570 31440 31420 33010 35660 36230 37290 35055 37804 42651 48284 54662
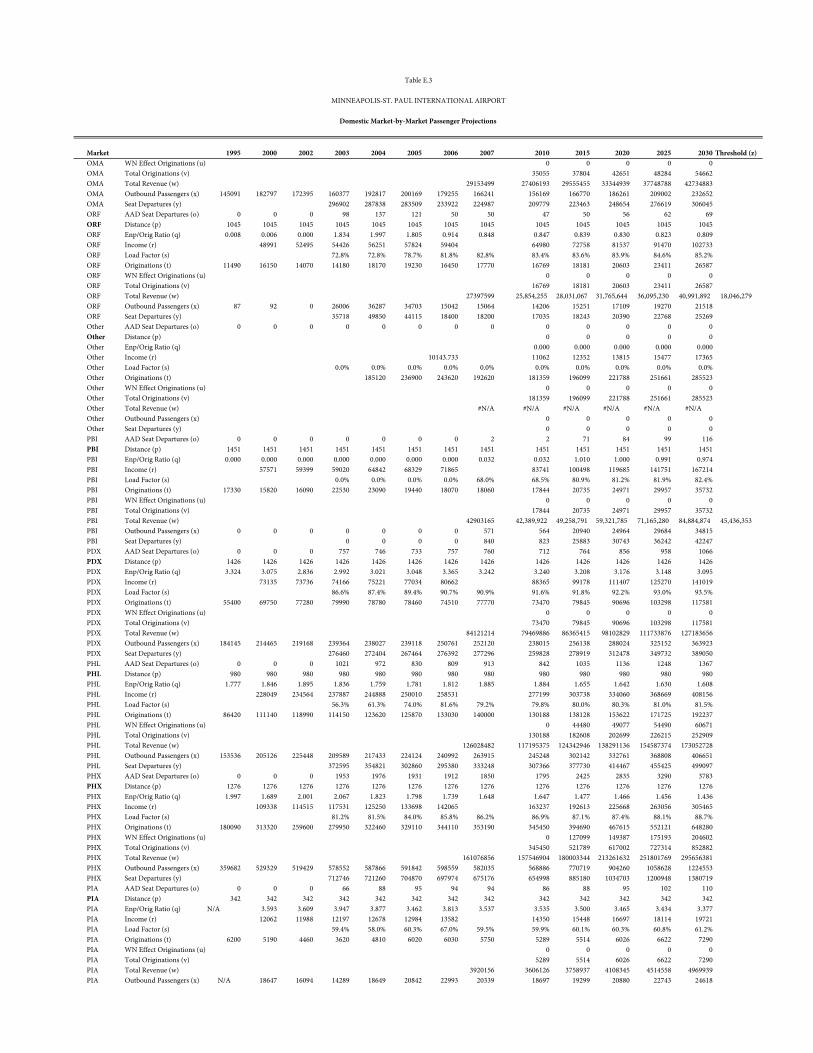
Market 1995 2000 2002 2003 2004 2005 2006 2007 2010 2015 2020 2025 2030 Threshold (z)
Table E.3
MINNEAPOLIS-ST. PAUL INTERNATIONAL AIRPORT
Domestic Market-by-Market Passenger Projections
OMA WN Effect Originations (u) 0 0 0 0 0OMA Total Originations (v) 35055 37804 42651 48284 54662OMA Total Revenue (w) 29153499 27406193 29555455 33344939 37748788 42734883OMA Outbound Passengers (x) 145091 182797 172395 160377 192817 200169 179255 166241 156169 166770 186261 209002 232652OMA Seat Departures (y) 296902 287838 283509 233922 224987 209779 223463 248654 276619 306045ORF AAD Seat Departures (o) 0 0 0 98 137 121 50 50 47 50 56 62 69ORF Distance (p) 1045 1045 1045 1045 1045 1045 1045 1045 1045 1045 1045 1045 1045ORF Enp/Orig Ratio (q) 0.008 0.006 0.000 1.834 1.997 1.805 0.914 0.848 0.847 0.839 0.830 0.823 0.809ORF Income (r) 48991 52495 54426 56251 57824 59404 64980 72758 81537 91470 102733ORF Load Factor (s) 72.8% 72.8% 78.7% 81.8% 82.8% 83.4% 83.6% 83.9% 84.6% 85.2%ORF Originations (t) 11490 16150 14070 14180 18170 19230 16450 17770 16769 18181 20603 23411 26587ORF WN Effect Originations (u) 0 0 0 0 0ORF Total Originations (v) 16769 18181 20603 23411 26587ORF Total Revenue (w) 27397599 25,854,255 28,031,067 31,765,644 36,095,230 40,991,892 18,046,279ORF Outbound Passengers (x) 87 92 0 26006 36287 34703 15042 15064 14206 15251 17109 19270 21518ORF Seat Departures (y) 35718 49850 44115 18400 18200 17035 18243 20390 22768 25269Other AAD Seat Departures (o) 0 0 0 0 0 0 0 0 0 0 0 0 0Other Distance (p) 0 0 0 0 0Other Enp/Orig Ratio (q) 0.000 0.000 0.000 0.000 0.000Other Income (r) 10143.733 11062 12352 13815 15477 17365Other Load Factor (s) 0.0% 0.0% 0.0% 0.0% 0.0% 0.0% 0.0% 0.0% 0.0% 0.0%Other Originations (t) 185120 236900 243620 192620 181359 196099 221788 251661 285523Other WN Effect Originations (u) 0 0 0 0 0Other Total Originations (v) 181359 196099 221788 251661 285523Other Total Revenue (w) #N/A #N/A #N/A #N/A #N/A #N/AOther Outbound Passengers (x) 0 0 0 0 0Other Seat Departures (y) 0 0 0 0 0PBI AAD Seat Departures (o) 0 0 0 0 0 0 0 2 2 71 84 99 116PBI Distance (p) 1451 1451 1451 1451 1451 1451 1451 1451 1451 1451 1451 1451 1451PBI Enp/Orig Ratio (q) 0.000 0.000 0.000 0.000 0.000 0.000 0.000 0.032 0.032 1.010 1.000 0.991 0.974PBI Income (r) 57571 59399 59020 64842 68329 71865 83741 100498 119685 141751 167214PBI Load Factor (s) 0.0% 0.0% 0.0% 0.0% 68.0% 68.5% 80.9% 81.2% 81.9% 82.4%PBI Originations (t) 17330 15820 16090 22530 23090 19440 18070 18060 17844 20735 24971 29957 35732PBI WN Effect Originations (u) 0 0 0 0 0PBI Total Originations (v) 17844 20735 24971 29957 35732PBI Total Revenue (w) 42903165 42,389,922 49,258,791 59,321,785 71,165,280 84,884,874 45,436,353PBI Outbound Passengers (x) 0 0 0 0 0 0 0 571 564 20940 24964 29684 34815PBI Seat Departures (y) 0 0 0 0 840 823 25883 30743 36242 42247PDX AAD Seat Departures (o) 0 0 0 757 746 733 757 760 712 764 856 958 1066PDX Distance (p) 1426 1426 1426 1426 1426 1426 1426 1426 1426 1426 1426 1426 1426PDX Enp/Orig Ratio (q) 3.324 3.075 2.836 2.992 3.021 3.048 3.365 3.242 3.240 3.208 3.176 3.148 3.095PDX Income (r) 73135 73736 74166 75221 77034 80662 88365 99178 111407 125270 141019PDX Load Factor (s) 86.6% 87.4% 89.4% 90.7% 90.9% 91.6% 91.8% 92.2% 93.0% 93.5%PDX Originations (t) 55400 69750 77280 79990 78780 78460 74510 77770 73470 79845 90696 103298 117581PDX WN Effect Originations (u) 0 0 0 0 0PDX Total Originations (v) 73470 79845 90696 103298 117581PDX Total Revenue (w) 84121214 79469886 86365415 98102829 111733876 127183656PDX Outbound Passengers (x) 184145 214465 219168 239364 238027 239118 250761 252120 238015 256138 288024 325152 363923PDX Seat Departures (y) 276460 272404 267464 276392 277296 259828 278919 312478 349732 389050PHL AAD Seat Departures (o) 0 0 0 1021 972 830 809 913 842 1035 1136 1248 1367PHL Distance (p) 980 980 980 980 980 980 980 980 980 980 980 980 980PHL Enp/Orig Ratio (q) 1.777 1.846 1.895 1.836 1.759 1.781 1.812 1.885 1.884 1.655 1.642 1.630 1.608PHL Income (r) 228049 234564 237887 244888 250010 258531 277199 303738 334060 368669 408156PHL Load Factor (s) 56.3% 61.3% 74.0% 81.6% 79.2% 79.8% 80.0% 80.3% 81.0% 81.5%PHL Originations (t) 86420 111140 118990 114150 123620 125870 133030 140000 130188 138128 153622 171725 192237PHL WN Effect Originations (u) 0 44480 49077 54490 60671PHL Total Originations (v) 130188 182608 202699 226215 252909PHL Total Revenue (w) 126028482 117195375 124342946 138291136 154587374 173052728PHL Outbound Passengers (x) 153536 205126 225448 209589 217433 224124 240992 263915 245248 302142 332761 368808 406651PHL Seat Departures (y) 372595 354821 302860 295380 333248 307366 377730 414467 455425 499097PHX AAD Seat Departures (o) 0 0 0 1953 1976 1931 1912 1850 1795 2425 2835 3290 3783PHX Distance (p) 1276 1276 1276 1276 1276 1276 1276 1276 1276 1276 1276 1276 1276PHX Enp/Orig Ratio (q) 1.997 1.689 2.001 2.067 1.823 1.798 1.739 1.648 1.647 1.477 1.466 1.456 1.436PHX Income (r) 109338 114515 117531 125250 133698 142065 163237 192613 225668 263056 305465PHX Load Factor (s) 81.2% 81.5% 84.0% 85.8% 86.2% 86.9% 87.1% 87.4% 88.1% 88.7%PHX Originations (t) 180090 313320 259600 279950 322460 329110 344110 353190 345450 394690 467615 552121 648280PHX WN Effect Originations (u) 0 127099 149387 175193 204602PHX Total Originations (v) 345450 521789 617002 727314 852882PHX Total Revenue (w) 161076856 157546904 180003344 213261632 251801769 295656381PHX Outbound Passengers (x) 359682 529329 519429 578552 587866 591842 598559 582035 568886 770719 904260 1058628 1224553PHX Seat Departures (y) 712746 721260 704870 697974 675176 654998 885180 1034703 1200948 1380719PIA AAD Seat Departures (o) 0 0 0 66 88 95 94 94 86 88 95 102 110PIA Distance (p) 342 342 342 342 342 342 342 342 342 342 342 342 342PIA Enp/Orig Ratio (q) N/A 3.593 3.609 3.947 3.877 3.462 3.813 3.537 3.535 3.500 3.465 3.434 3.377PIA Income (r) 12062 11988 12197 12678 12984 13582 14350 15448 16697 18114 19721PIA Load Factor (s) 59.4% 58.0% 60.3% 67.0% 59.5% 59.9% 60.1% 60.3% 60.8% 61.2%PIA Originations (t) 6200 5190 4460 3620 4810 6020 6030 5750 5289 5514 6026 6622 7290PIA WN Effect Originations (u) 0 0 0 0 0PIA Total Originations (v) 5289 5514 6026 6622 7290PIA Total Revenue (w) 3920156 3606126 3758937 4108345 4514558 4969939PIA Outbound Passengers (x) N/A 18647 16094 14289 18649 20842 22993 20339 18697 19299 20880 22743 24618
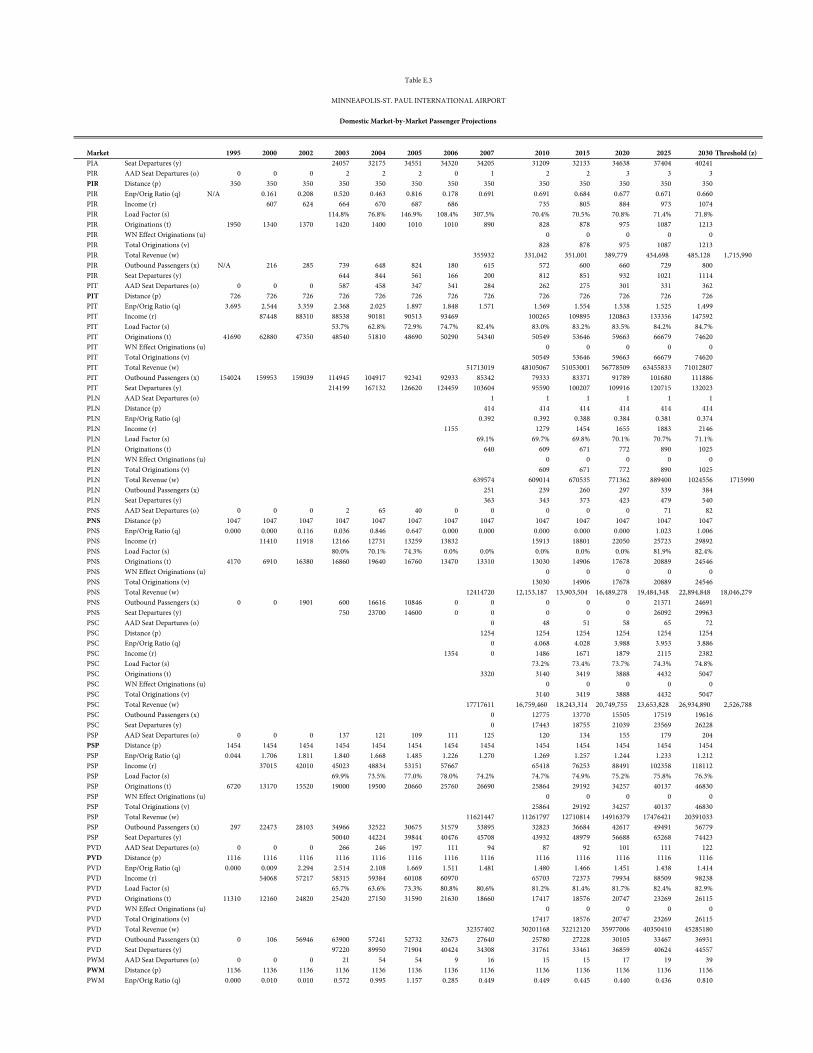
Market 1995 2000 2002 2003 2004 2005 2006 2007 2010 2015 2020 2025 2030 Threshold (z)
Table E.3
MINNEAPOLIS-ST. PAUL INTERNATIONAL AIRPORT
Domestic Market-by-Market Passenger Projections
PIA Seat Departures (y) 24057 32175 34551 34320 34205 31209 32133 34638 37404 40241PIR AAD Seat Departures (o) 0 0 0 2 2 2 0 1 2 2 3 3 3PIR Distance (p) 350 350 350 350 350 350 350 350 350 350 350 350 350PIR Enp/Orig Ratio (q) N/A 0.161 0.208 0.520 0.463 0.816 0.178 0.691 0.691 0.684 0.677 0.671 0.660PIR Income (r) 607 624 664 670 687 686 735 805 884 973 1074PIR Load Factor (s) 114.8% 76.8% 146.9% 108.4% 307.5% 70.4% 70.5% 70.8% 71.4% 71.8%PIR Originations (t) 1950 1340 1370 1420 1400 1010 1010 890 828 878 975 1087 1213PIR WN Effect Originations (u) 0 0 0 0 0PIR Total Originations (v) 828 878 975 1087 1213PIR Total Revenue (w) 355932 331,042 351,001 389,779 434,698 485,128 1,715,990 PIR Outbound Passengers (x) N/A 216 285 739 648 824 180 615 572 600 660 729 800PIR Seat Departures (y) 644 844 561 166 200 812 851 932 1021 1114PIT AAD Seat Departures (o) 0 0 0 587 458 347 341 284 262 275 301 331 362PIT Distance (p) 726 726 726 726 726 726 726 726 726 726 726 726 726PIT Enp/Orig Ratio (q) 3.695 2.544 3.359 2.368 2.025 1.897 1.848 1.571 1.569 1.554 1.538 1.525 1.499PIT Income (r) 87448 88310 88538 90181 90513 93469 100265 109895 120863 133356 147592PIT Load Factor (s) 53.7% 62.8% 72.9% 74.7% 82.4% 83.0% 83.2% 83.5% 84.2% 84.7%PIT Originations (t) 41690 62880 47350 48540 51810 48690 50290 54340 50549 53646 59663 66679 74620PIT WN Effect Originations (u) 0 0 0 0 0PIT Total Originations (v) 50549 53646 59663 66679 74620PIT Total Revenue (w) 51713019 48105067 51053001 56778509 63455833 71012807PIT Outbound Passengers (x) 154024 159953 159039 114945 104917 92341 92933 85342 79333 83371 91789 101680 111886PIT Seat Departures (y) 214199 167132 126620 124459 103604 95590 100207 109916 120715 132023PLN AAD Seat Departures (o) 1 1 1 1 1 1PLN Distance (p) 414 414 414 414 414 414PLN Enp/Orig Ratio (q) 0.392 0.392 0.388 0.384 0.381 0.374PLN Income (r) 1155 1279 1454 1655 1883 2146PLN Load Factor (s) 69.1% 69.7% 69.8% 70.1% 70.7% 71.1%PLN Originations (t) 640 609 671 772 890 1025PLN WN Effect Originations (u) 0 0 0 0 0PLN Total Originations (v) 609 671 772 890 1025PLN Total Revenue (w) 639574 609014 670535 771362 889400 1024556 1715990PLN Outbound Passengers (x) 251 239 260 297 339 384PLN Seat Departures (y) 363 343 373 423 479 540PNS AAD Seat Departures (o) 0 0 0 2 65 40 0 0 0 0 0 71 82PNS Distance (p) 1047 1047 1047 1047 1047 1047 1047 1047 1047 1047 1047 1047 1047PNS Enp/Orig Ratio (q) 0.000 0.000 0.116 0.036 0.846 0.647 0.000 0.000 0.000 0.000 0.000 1.023 1.006PNS Income (r) 11410 11918 12166 12731 13259 13832 15913 18801 22050 25723 29892PNS Load Factor (s) 80.0% 70.1% 74.3% 0.0% 0.0% 0.0% 0.0% 0.0% 81.9% 82.4%PNS Originations (t) 4170 6910 16380 16860 19640 16760 13470 13310 13030 14906 17678 20889 24546PNS WN Effect Originations (u) 0 0 0 0 0PNS Total Originations (v) 13030 14906 17678 20889 24546PNS Total Revenue (w) 12414720 12,153,187 13,903,504 16,489,278 19,484,348 22,894,848 18,046,279PNS Outbound Passengers (x) 0 0 1901 600 16616 10846 0 0 0 0 0 21371 24691PNS Seat Departures (y) 750 23700 14600 0 0 0 0 0 26092 29963PSC AAD Seat Departures (o) 0 48 51 58 65 72PSC Distance (p) 1254 1254 1254 1254 1254 1254PSC Enp/Orig Ratio (q) 0 4.068 4.028 3.988 3.953 3.886PSC Income (r) 1354 0 1486 1671 1879 2115 2382PSC Load Factor (s) 73.2% 73.4% 73.7% 74.3% 74.8%PSC Originations (t) 3320 3140 3419 3888 4432 5047PSC WN Effect Originations (u) 0 0 0 0 0PSC Total Originations (v) 3140 3419 3888 4432 5047PSC Total Revenue (w) 17717611 16,759,460 18,243,314 20,749,755 23,653,828 26,934,890 2,526,788 PSC Outbound Passengers (x) 0 12775 13770 15505 17519 19616PSC Seat Departures (y) 0 17443 18755 21039 23569 26228PSP AAD Seat Departures (o) 0 0 0 137 121 109 111 125 120 134 155 179 204PSP Distance (p) 1454 1454 1454 1454 1454 1454 1454 1454 1454 1454 1454 1454 1454PSP Enp/Orig Ratio (q) 0.044 1.706 1.811 1.840 1.668 1.485 1.226 1.270 1.269 1.257 1.244 1.233 1.212PSP Income (r) 37015 42010 45023 48834 53151 57667 65418 76253 88491 102358 118112PSP Load Factor (s) 69.9% 73.5% 77.0% 78.0% 74.2% 74.7% 74.9% 75.2% 75.8% 76.3%PSP Originations (t) 6720 13170 15520 19000 19500 20660 25760 26690 25864 29192 34257 40137 46830PSP WN Effect Originations (u) 0 0 0 0 0PSP Total Originations (v) 25864 29192 34257 40137 46830PSP Total Revenue (w) 11621447 11261797 12710814 14916379 17476421 20391033PSP Outbound Passengers (x) 297 22473 28103 34966 32522 30675 31579 33895 32823 36684 42617 49491 56779PSP Seat Departures (y) 50040 44224 39844 40476 45708 43932 48979 56688 65268 74423PVD AAD Seat Departures (o) 0 0 0 266 246 197 111 94 87 92 101 111 122PVD Distance (p) 1116 1116 1116 1116 1116 1116 1116 1116 1116 1116 1116 1116 1116PVD Enp/Orig Ratio (q) 0.000 0.009 2.294 2.514 2.108 1.669 1.511 1.481 1.480 1.466 1.451 1.438 1.414PVD Income (r) 54068 57217 58315 59384 60108 60970 65703 72373 79934 88509 98238PVD Load Factor (s) 65.7% 63.6% 73.3% 80.8% 80.6% 81.2% 81.4% 81.7% 82.4% 82.9%PVD Originations (t) 11310 12160 24820 25420 27150 31590 21630 18660 17417 18576 20747 23269 26115PVD WN Effect Originations (u) 0 0 0 0 0PVD Total Originations (v) 17417 18576 20747 23269 26115PVD Total Revenue (w) 32357402 30201168 32212120 35977006 40350410 45285180PVD Outbound Passengers (x) 0 106 56946 63900 57241 52732 32673 27640 25780 27228 30105 33467 36931PVD Seat Departures (y) 97220 89950 71904 40424 34308 31761 33461 36859 40624 44557PWM AAD Seat Departures (o) 0 0 0 21 54 54 9 16 15 15 17 19 39PWM Distance (p) 1136 1136 1136 1136 1136 1136 1136 1136 1136 1136 1136 1136 1136PWM Enp/Orig Ratio (q) 0.000 0.010 0.010 0.572 0.995 1.157 0.285 0.449 0.449 0.445 0.440 0.436 0.810
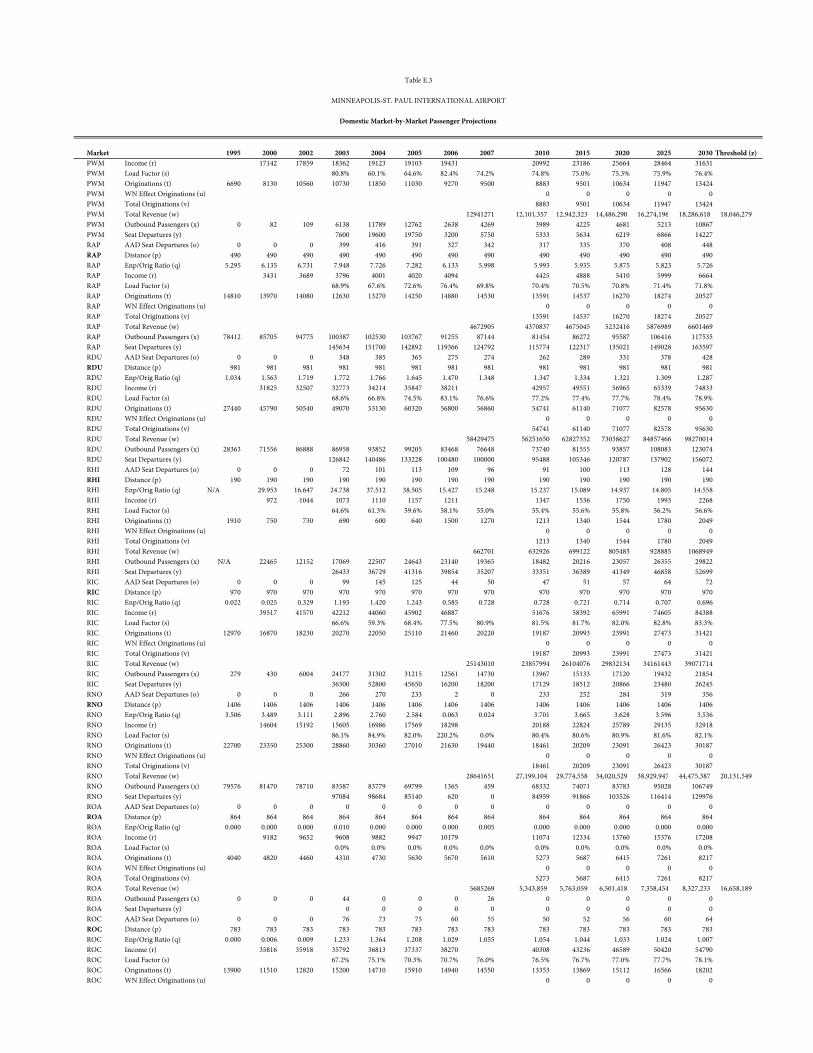
Market 1995 2000 2002 2003 2004 2005 2006 2007 2010 2015 2020 2025 2030 Threshold (z)
Table E.3
MINNEAPOLIS-ST. PAUL INTERNATIONAL AIRPORT
Domestic Market-by-Market Passenger Projections
PWM Income (r) 17142 17859 18362 19123 19103 19431 20992 23186 25664 28464 31631PWM Load Factor (s) 80.8% 60.1% 64.6% 82.4% 74.2% 74.8% 75.0% 75.3% 75.9% 76.4%PWM Originations (t) 6690 8130 10560 10730 11850 11030 9270 9500 8883 9501 10634 11947 13424PWM WN Effect Originations (u) 0 0 0 0 0PWM Total Originations (v) 8883 9501 10634 11947 13424PWM Total Revenue (w) 12941271 12,101,357 12,942,323 14,486,290 16,274,196 18,286,618 18,046,279PWM Outbound Passengers (x) 0 82 109 6138 11789 12762 2638 4269 3989 4225 4681 5213 10867PWM Seat Departures (y) 7600 19600 19750 3200 5750 5333 5634 6219 6866 14227RAP AAD Seat Departures (o) 0 0 0 399 416 391 327 342 317 335 370 408 448RAP Distance (p) 490 490 490 490 490 490 490 490 490 490 490 490 490RAP Enp/Orig Ratio (q) 5.295 6.135 6.731 7.948 7.726 7.282 6.133 5.998 5.993 5.935 5.875 5.823 5.726RAP Income (r) 3431 3689 3796 4001 4020 4094 4425 4888 5410 5999 6664RAP Load Factor (s) 68.9% 67.6% 72.6% 76.4% 69.8% 70.4% 70.5% 70.8% 71.4% 71.8%RAP Originations (t) 14810 13970 14080 12630 13270 14250 14880 14530 13591 14537 16270 18274 20527RAP WN Effect Originations (u) 0 0 0 0 0RAP Total Originations (v) 13591 14537 16270 18274 20527RAP Total Revenue (w) 4672905 4370837 4675045 5232416 5876989 6601469RAP Outbound Passengers (x) 78412 85705 94775 100387 102530 103767 91255 87144 81454 86272 95587 106416 117535RAP Seat Departures (y) 145634 151700 142892 119366 124792 115774 122317 135021 149028 163597RDU AAD Seat Departures (o) 0 0 0 348 385 365 275 274 262 289 331 378 428RDU Distance (p) 981 981 981 981 981 981 981 981 981 981 981 981 981RDU Enp/Orig Ratio (q) 1.034 1.563 1.719 1.772 1.766 1.645 1.470 1.348 1.347 1.334 1.321 1.309 1.287RDU Income (r) 31825 32507 32773 34214 35847 38211 42957 49551 56965 65339 74833RDU Load Factor (s) 68.6% 66.8% 74.5% 83.1% 76.6% 77.2% 77.4% 77.7% 78.4% 78.9%RDU Originations (t) 27440 45790 50540 49070 53130 60320 56800 56860 54741 61140 71077 82578 95630RDU WN Effect Originations (u) 0 0 0 0 0RDU Total Originations (v) 54741 61140 71077 82578 95630RDU Total Revenue (w) 58429475 56251650 62827352 73038627 84857466 98270014RDU Outbound Passengers (x) 28363 71556 86888 86958 93852 99205 83468 76648 73740 81555 93857 108083 123074RDU Seat Departures (y) 126842 140486 133228 100480 100000 95488 105346 120787 137902 156072RHI AAD Seat Departures (o) 0 0 0 72 101 113 109 96 91 100 113 128 144RHI Distance (p) 190 190 190 190 190 190 190 190 190 190 190 190 190RHI Enp/Orig Ratio (q) N/A 29.953 16.647 24.738 37.512 38.505 15.427 15.248 15.237 15.089 14.937 14.805 14.558RHI Income (r) 972 1044 1073 1110 1157 1211 1347 1536 1750 1993 2268RHI Load Factor (s) 64.6% 61.3% 59.6% 58.1% 55.0% 55.4% 55.6% 55.8% 56.2% 56.6%RHI Originations (t) 1910 750 730 690 600 640 1500 1270 1213 1340 1544 1780 2049RHI WN Effect Originations (u) 0 0 0 0 0RHI Total Originations (v) 1213 1340 1544 1780 2049RHI Total Revenue (w) 662701 632926 699122 805485 928885 1068949RHI Outbound Passengers (x) N/A 22465 12152 17069 22507 24643 23140 19365 18482 20216 23057 26355 29822RHI Seat Departures (y) 26433 36729 41316 39854 35207 33351 36389 41349 46858 52699RIC AAD Seat Departures (o) 0 0 0 99 145 125 44 50 47 51 57 64 72RIC Distance (p) 970 970 970 970 970 970 970 970 970 970 970 970 970RIC Enp/Orig Ratio (q) 0.022 0.025 0.329 1.193 1.420 1.243 0.585 0.728 0.728 0.721 0.714 0.707 0.696RIC Income (r) 39517 41570 42212 44060 45902 46887 51676 58392 65991 74605 84388RIC Load Factor (s) 66.6% 59.3% 68.4% 77.5% 80.9% 81.5% 81.7% 82.0% 82.8% 83.3%RIC Originations (t) 12970 16870 18230 20270 22050 25110 21460 20220 19187 20993 23991 27473 31421RIC WN Effect Originations (u) 0 0 0 0 0RIC Total Originations (v) 19187 20993 23991 27473 31421RIC Total Revenue (w) 25143010 23857994 26104076 29832134 34161443 39071714RIC Outbound Passengers (x) 279 430 6004 24177 31302 31215 12561 14730 13967 15133 17120 19432 21854RIC Seat Departures (y) 36300 52800 45650 16200 18200 17129 18512 20866 23480 26245RNO AAD Seat Departures (o) 0 0 0 266 270 233 2 0 233 252 284 319 356RNO Distance (p) 1406 1406 1406 1406 1406 1406 1406 1406 1406 1406 1406 1406 1406RNO Enp/Orig Ratio (q) 3.506 3.489 3.111 2.896 2.760 2.584 0.063 0.024 3.701 3.665 3.628 3.596 3.536RNO Income (r) 14604 15192 15605 16986 17569 18298 20188 22824 25789 29135 32918RNO Load Factor (s) 86.1% 84.9% 82.0% 220.2% 0.0% 80.4% 80.6% 80.9% 81.6% 82.1%RNO Originations (t) 22700 23350 25300 28860 30360 27010 21630 19440 18461 20209 23091 26423 30187RNO WN Effect Originations (u) 0 0 0 0 0RNO Total Originations (v) 18461 20209 23091 26423 30187RNO Total Revenue (w) 28641651 27,199,104 29,774,558 34,020,529 38,929,947 44,475,387 20,131,549RNO Outbound Passengers (x) 79576 81470 78710 83587 83779 69799 1365 459 68332 74071 83783 95028 106749RNO Seat Departures (y) 97084 98684 85140 620 0 84959 91866 103526 116414 129976ROA AAD Seat Departures (o) 0 0 0 0 0 0 0 0 0 0 0 0 0ROA Distance (p) 864 864 864 864 864 864 864 864 864 864 864 864 864ROA Enp/Orig Ratio (q) 0.000 0.000 0.000 0.010 0.000 0.000 0.000 0.005 0.000 0.000 0.000 0.000 0.000ROA Income (r) 9182 9652 9608 9882 9947 10179 11074 12334 13760 15376 17208ROA Load Factor (s) 0.0% 0.0% 0.0% 0.0% 0.0% 0.0% 0.0% 0.0% 0.0% 0.0%ROA Originations (t) 4040 4820 4460 4310 4730 5630 5670 5610 5273 5687 6415 7261 8217ROA WN Effect Originations (u) 0 0 0 0 0ROA Total Originations (v) 5273 5687 6415 7261 8217ROA Total Revenue (w) 5685269 5,343,859 5,763,059 6,501,418 7,358,454 8,327,233 16,658,189ROA Outbound Passengers (x) 0 0 0 44 0 0 0 26 0 0 0 0 0ROA Seat Departures (y) 0 0 0 0 0 0 0 0 0 0ROC AAD Seat Departures (o) 0 0 0 76 73 75 60 55 50 52 56 60 64ROC Distance (p) 783 783 783 783 783 783 783 783 783 783 783 783 783ROC Enp/Orig Ratio (q) 0.000 0.006 0.009 1.233 1.364 1.208 1.029 1.055 1.054 1.044 1.033 1.024 1.007ROC Income (r) 35816 35918 35792 36813 37337 38270 40308 43236 46589 50420 54790ROC Load Factor (s) 67.2% 75.1% 70.3% 70.7% 76.0% 76.5% 76.7% 77.0% 77.7% 78.1%ROC Originations (t) 13900 11510 12820 15200 14710 15910 14940 14550 13353 13869 15112 16566 18202ROC WN Effect Originations (u) 0 0 0 0 0
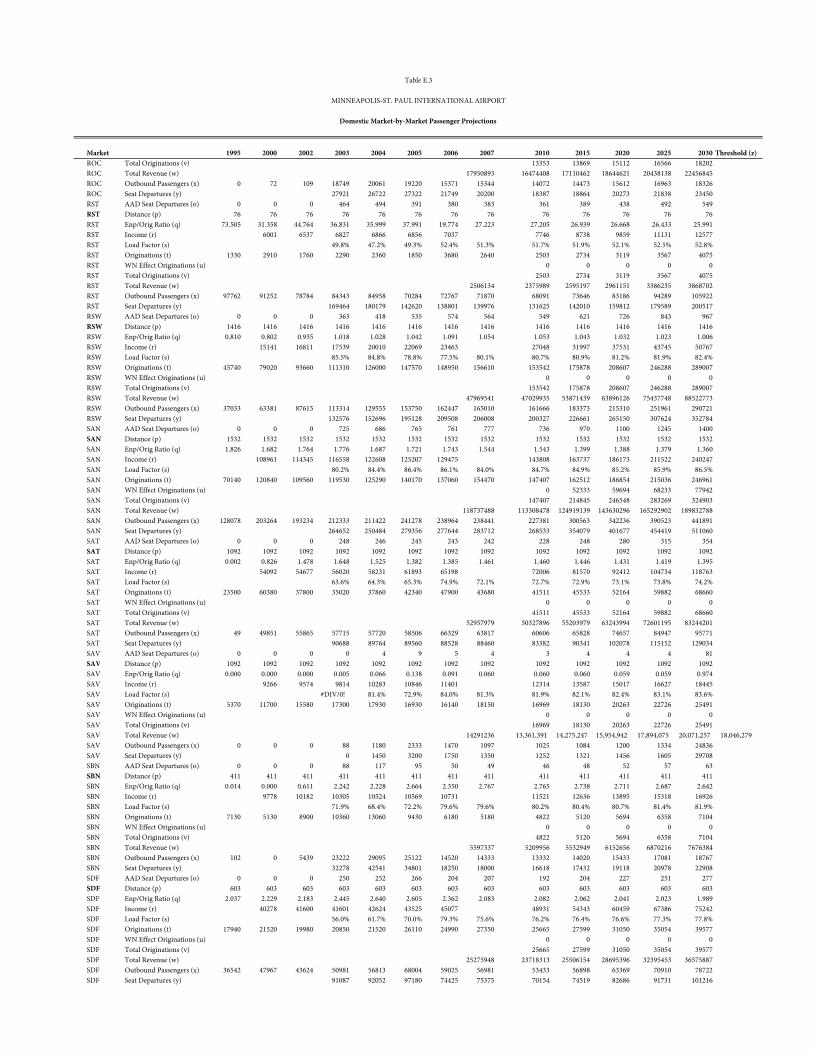
Market 1995 2000 2002 2003 2004 2005 2006 2007 2010 2015 2020 2025 2030 Threshold (z)
Table E.3
MINNEAPOLIS-ST. PAUL INTERNATIONAL AIRPORT
Domestic Market-by-Market Passenger Projections
ROC Total Originations (v) 13353 13869 15112 16566 18202ROC Total Revenue (w) 17950893 16474408 17110462 18644621 20438138 22456845ROC Outbound Passengers (x) 0 72 109 18749 20061 19220 15371 15344 14072 14473 15612 16963 18326ROC Seat Departures (y) 27921 26722 27322 21749 20200 18387 18864 20273 21838 23450RST AAD Seat Departures (o) 0 0 0 464 494 391 380 383 361 389 438 492 549RST Distance (p) 76 76 76 76 76 76 76 76 76 76 76 76 76RST Enp/Orig Ratio (q) 73.505 31.358 44.764 36.831 35.999 37.991 19.774 27.223 27.205 26.939 26.668 26.433 25.991RST Income (r) 6001 6537 6827 6866 6856 7037 7746 8738 9859 11131 12577RST Load Factor (s) 49.8% 47.2% 49.3% 52.4% 51.3% 51.7% 51.9% 52.1% 52.5% 52.8%RST Originations (t) 1330 2910 1760 2290 2360 1850 3680 2640 2503 2734 3119 3567 4075RST WN Effect Originations (u) 0 0 0 0 0RST Total Originations (v) 2503 2734 3119 3567 4075RST Total Revenue (w) 2506134 2375989 2595197 2961151 3386235 3868702RST Outbound Passengers (x) 97762 91252 78784 84343 84958 70284 72767 71870 68091 73646 83186 94289 105922RST Seat Departures (y) 169464 180179 142620 138801 139976 131625 142010 159812 179589 200517RSW AAD Seat Departures (o) 0 0 0 363 418 535 574 564 549 621 726 843 967RSW Distance (p) 1416 1416 1416 1416 1416 1416 1416 1416 1416 1416 1416 1416 1416RSW Enp/Orig Ratio (q) 0.810 0.802 0.935 1.018 1.028 1.042 1.091 1.054 1.053 1.043 1.032 1.023 1.006RSW Income (r) 15141 16811 17539 20010 22069 23463 27048 31997 37531 43745 50767RSW Load Factor (s) 85.5% 84.8% 78.8% 77.5% 80.1% 80.7% 80.9% 81.2% 81.9% 82.4%RSW Originations (t) 45740 79020 93660 111310 126000 147570 148950 156610 153542 175878 208607 246288 289007RSW WN Effect Originations (u) 0 0 0 0 0RSW Total Originations (v) 153542 175878 208607 246288 289007RSW Total Revenue (w) 47969541 47029935 53871439 63896126 75437748 88522773RSW Outbound Passengers (x) 37033 63381 87615 113314 129555 153750 162447 165010 161666 183373 215310 251961 290721RSW Seat Departures (y) 132576 152696 195128 209508 206008 200327 226661 265150 307624 352784SAN AAD Seat Departures (o) 0 0 0 725 686 765 761 777 736 970 1100 1245 1400SAN Distance (p) 1532 1532 1532 1532 1532 1532 1532 1532 1532 1532 1532 1532 1532SAN Enp/Orig Ratio (q) 1.826 1.682 1.764 1.776 1.687 1.721 1.743 1.544 1.543 1.399 1.388 1.379 1.360SAN Income (r) 108961 114345 116558 122608 125207 129475 143808 163737 186173 211522 240247SAN Load Factor (s) 80.2% 84.4% 86.4% 86.1% 84.0% 84.7% 84.9% 85.2% 85.9% 86.5%SAN Originations (t) 70140 120840 109560 119530 125290 140170 137060 154470 147407 162512 186854 215036 246961SAN WN Effect Originations (u) 0 52333 59694 68233 77942SAN Total Originations (v) 147407 214845 246548 283269 324903SAN Total Revenue (w) 118737488 113308478 124919139 143630296 165292902 189832788SAN Outbound Passengers (x) 128078 203264 193234 212333 211422 241278 238964 238441 227381 300563 342236 390523 441891SAN Seat Departures (y) 264652 250484 279356 277644 283712 268533 354079 401677 454419 511060SAT AAD Seat Departures (o) 0 0 0 248 246 245 243 242 228 248 280 315 354SAT Distance (p) 1092 1092 1092 1092 1092 1092 1092 1092 1092 1092 1092 1092 1092SAT Enp/Orig Ratio (q) 0.002 0.826 1.478 1.648 1.525 1.382 1.385 1.461 1.460 1.446 1.431 1.419 1.395SAT Income (r) 54092 54677 56020 58231 61893 65198 72006 81570 92412 104734 118763SAT Load Factor (s) 63.6% 64.3% 65.3% 74.9% 72.1% 72.7% 72.9% 73.1% 73.8% 74.2%SAT Originations (t) 23500 60380 37800 35020 37860 42340 47900 43680 41511 45533 52164 59882 68660SAT WN Effect Originations (u) 0 0 0 0 0SAT Total Originations (v) 41511 45533 52164 59882 68660SAT Total Revenue (w) 52957979 50327896 55203979 63243994 72601195 83244201SAT Outbound Passengers (x) 49 49851 55865 57715 57720 58506 66329 63817 60606 65828 74657 84947 95771SAT Seat Departures (y) 90688 89764 89560 88528 88460 83382 90341 102078 115152 129034SAV AAD Seat Departures (o) 0 0 0 0 4 9 5 4 3 4 4 4 81SAV Distance (p) 1092 1092 1092 1092 1092 1092 1092 1092 1092 1092 1092 1092 1092SAV Enp/Orig Ratio (q) 0.000 0.000 0.000 0.005 0.066 0.138 0.091 0.060 0.060 0.060 0.059 0.059 0.974SAV Income (r) 9266 9574 9814 10283 10846 11401 12314 13587 15017 16627 18445SAV Load Factor (s) #DIV/0! 81.4% 72.9% 84.0% 81.3% 81.9% 82.1% 82.4% 83.1% 83.6%SAV Originations (t) 5370 11700 15580 17300 17930 16930 16140 18150 16969 18130 20263 22726 25491SAV WN Effect Originations (u) 0 0 0 0 0SAV Total Originations (v) 16969 18130 20263 22726 25491SAV Total Revenue (w) 14291236 13,361,391 14,275,247 15,954,942 17,894,075 20,071,257 18,046,279SAV Outbound Passengers (x) 0 0 0 88 1180 2333 1470 1097 1025 1084 1200 1334 24836SAV Seat Departures (y) 0 1450 3200 1750 1350 1252 1321 1456 1605 29708SBN AAD Seat Departures (o) 0 0 0 88 117 95 50 49 46 48 52 57 63SBN Distance (p) 411 411 411 411 411 411 411 411 411 411 411 411 411SBN Enp/Orig Ratio (q) 0.014 0.000 0.611 2.242 2.228 2.664 2.350 2.767 2.765 2.738 2.711 2.687 2.642SBN Income (r) 9778 10182 10305 10524 10569 10731 11521 12636 13895 15318 16926SBN Load Factor (s) 71.9% 68.4% 72.2% 79.6% 79.6% 80.2% 80.4% 80.7% 81.4% 81.9%SBN Originations (t) 7130 5130 8900 10360 13060 9430 6180 5180 4822 5120 5694 6358 7104SBN WN Effect Originations (u) 0 0 0 0 0SBN Total Originations (v) 4822 5120 5694 6358 7104SBN Total Revenue (w) 5597337 5209956 5532949 6152656 6870216 7676384SBN Outbound Passengers (x) 102 0 5439 23222 29095 25122 14520 14333 13332 14020 15433 17081 18767SBN Seat Departures (y) 32278 42541 34801 18250 18000 16618 17432 19118 20978 22908SDF AAD Seat Departures (o) 0 0 0 250 252 266 204 207 192 204 227 251 277SDF Distance (p) 603 603 603 603 603 603 603 603 603 603 603 603 603SDF Enp/Orig Ratio (q) 2.037 2.229 2.183 2.445 2.640 2.605 2.362 2.083 2.082 2.062 2.041 2.023 1.989SDF Income (r) 40278 41600 41601 42624 43525 45077 48931 54343 60459 67386 75242SDF Load Factor (s) 56.0% 61.7% 70.0% 79.3% 75.6% 76.2% 76.4% 76.6% 77.3% 77.8%SDF Originations (t) 17940 21520 19980 20850 21520 26110 24990 27350 25665 27599 31050 35054 39577SDF WN Effect Originations (u) 0 0 0 0 0SDF Total Originations (v) 25665 27599 31050 35054 39577SDF Total Revenue (w) 25275948 23718313 25506154 28695396 32395453 36575887SDF Outbound Passengers (x) 36542 47967 43624 50981 56813 68004 59025 56981 53433 56898 63369 70910 78722SDF Seat Departures (y) 91087 92052 97180 74425 75375 70154 74519 82686 91731 101216
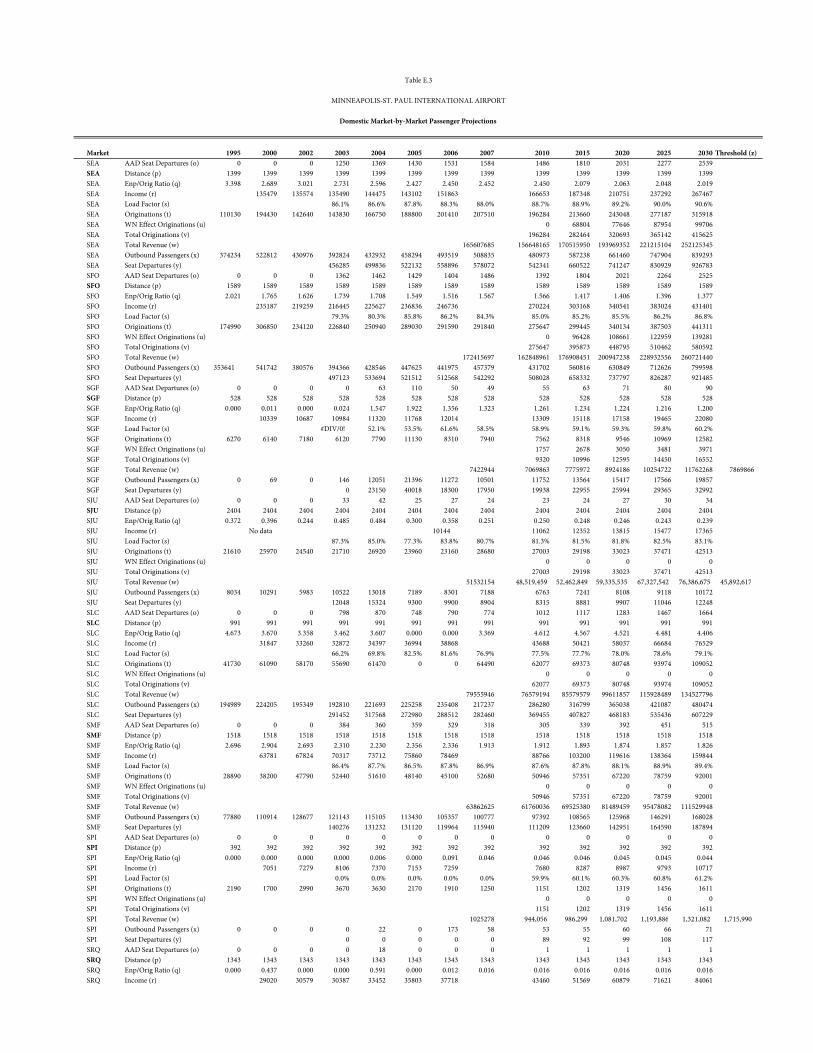
Market 1995 2000 2002 2003 2004 2005 2006 2007 2010 2015 2020 2025 2030 Threshold (z)
Table E.3
MINNEAPOLIS-ST. PAUL INTERNATIONAL AIRPORT
Domestic Market-by-Market Passenger Projections
SEA AAD Seat Departures (o) 0 0 0 1250 1369 1430 1531 1584 1486 1810 2031 2277 2539SEA Distance (p) 1399 1399 1399 1399 1399 1399 1399 1399 1399 1399 1399 1399 1399SEA Enp/Orig Ratio (q) 3.398 2.689 3.021 2.731 2.596 2.427 2.450 2.452 2.450 2.079 2.063 2.048 2.019SEA Income (r) 135479 135574 135490 144475 143102 151863 166653 187348 210751 237292 267467SEA Load Factor (s) 86.1% 86.6% 87.8% 88.3% 88.0% 88.7% 88.9% 89.2% 90.0% 90.6%SEA Originations (t) 110130 194430 142640 143830 166750 188800 201410 207510 196284 213660 243048 277187 315918SEA WN Effect Originations (u) 0 68804 77646 87954 99706SEA Total Originations (v) 196284 282464 320693 365142 415625SEA Total Revenue (w) 165607685 156648165 170515950 193969352 221215104 252125345SEA Outbound Passengers (x) 374234 522812 430976 392824 432932 458294 493519 508835 480973 587238 661460 747904 839293SEA Seat Departures (y) 456285 499836 522132 558896 578072 542341 660522 741247 830929 926783SFO AAD Seat Departures (o) 0 0 0 1362 1462 1429 1404 1486 1392 1804 2021 2264 2525SFO Distance (p) 1589 1589 1589 1589 1589 1589 1589 1589 1589 1589 1589 1589 1589SFO Enp/Orig Ratio (q) 2.021 1.765 1.626 1.739 1.708 1.549 1.516 1.567 1.566 1.417 1.406 1.396 1.377SFO Income (r) 235187 219259 216445 225627 236836 246736 270224 303168 340541 383024 431401SFO Load Factor (s) 79.3% 80.3% 85.8% 86.2% 84.3% 85.0% 85.2% 85.5% 86.2% 86.8%SFO Originations (t) 174990 306850 234120 226840 250940 289030 291590 291840 275647 299445 340134 387503 441311SFO WN Effect Originations (u) 0 96428 108661 122959 139281SFO Total Originations (v) 275647 395873 448795 510462 580592SFO Total Revenue (w) 172415697 162848961 176908451 200947238 228932556 260721440SFO Outbound Passengers (x) 353641 541742 380576 394366 428546 447625 441975 457379 431702 560816 630849 712626 799598SFO Seat Departures (y) 497123 533694 521512 512568 542292 508028 658332 737797 826287 921485SGF AAD Seat Departures (o) 0 0 0 0 63 110 50 49 55 63 71 80 90SGF Distance (p) 528 528 528 528 528 528 528 528 528 528 528 528 528SGF Enp/Orig Ratio (q) 0.000 0.011 0.000 0.024 1.547 1.922 1.356 1.323 1.261 1.234 1.224 1.216 1.200SGF Income (r) 10339 10687 10984 11320 11768 12014 13309 15118 17158 19465 22080SGF Load Factor (s) #DIV/0! 52.1% 53.5% 61.6% 58.5% 58.9% 59.1% 59.3% 59.8% 60.2%SGF Originations (t) 6270 6140 7180 6120 7790 11130 8310 7940 7562 8318 9546 10969 12582SGF WN Effect Originations (u) 1757 2678 3050 3481 3971SGF Total Originations (v) 9320 10996 12595 14450 16552SGF Total Revenue (w) 7422944 7069863 7775972 8924186 10254722 11762268 7869866SGF Outbound Passengers (x) 0 69 0 146 12051 21396 11272 10501 11752 13564 15417 17566 19857SGF Seat Departures (y) 0 23150 40018 18300 17950 19938 22955 25994 29365 32992SJU AAD Seat Departures (o) 0 0 0 33 42 25 27 24 23 24 27 30 34SJU Distance (p) 2404 2404 2404 2404 2404 2404 2404 2404 2404 2404 2404 2404 2404SJU Enp/Orig Ratio (q) 0.372 0.396 0.244 0.485 0.484 0.300 0.358 0.251 0.250 0.248 0.246 0.243 0.239SJU Income (r) No data 10144 11062 12352 13815 15477 17365SJU Load Factor (s) 87.3% 85.0% 77.3% 83.8% 80.7% 81.3% 81.5% 81.8% 82.5% 83.1%SJU Originations (t) 21610 25970 24540 21710 26920 23960 23160 28680 27003 29198 33023 37471 42513SJU WN Effect Originations (u) 0 0 0 0 0SJU Total Originations (v) 27003 29198 33023 37471 42513SJU Total Revenue (w) 51532154 48,519,459 52,462,849 59,335,535 67,327,542 76,386,675 45,892,617SJU Outbound Passengers (x) 8034 10291 5983 10522 13018 7189 8301 7188 6763 7241 8108 9118 10172SJU Seat Departures (y) 12048 15324 9300 9900 8904 8315 8881 9907 11046 12248SLC AAD Seat Departures (o) 0 0 0 798 870 748 790 774 1012 1117 1283 1467 1664SLC Distance (p) 991 991 991 991 991 991 991 991 991 991 991 991 991SLC Enp/Orig Ratio (q) 4.673 3.670 3.358 3.462 3.607 0.000 0.000 3.369 4.612 4.567 4.521 4.481 4.406SLC Income (r) 31847 33260 32872 34397 36994 38868 43688 50421 58037 66684 76529SLC Load Factor (s) 66.2% 69.8% 82.5% 81.6% 76.9% 77.5% 77.7% 78.0% 78.6% 79.1%SLC Originations (t) 41730 61090 58170 55690 61470 0 0 64490 62077 69373 80748 93974 109052SLC WN Effect Originations (u) 0 0 0 0 0SLC Total Originations (v) 62077 69373 80748 93974 109052SLC Total Revenue (w) 79555946 76579194 85579579 99611857 115928489 134527796SLC Outbound Passengers (x) 194989 224205 195349 192810 221693 225258 235408 217237 286280 316799 365038 421087 480474SLC Seat Departures (y) 291452 317568 272980 288512 282460 369455 407827 468183 535436 607229SMF AAD Seat Departures (o) 0 0 0 384 360 359 329 318 305 339 392 451 515SMF Distance (p) 1518 1518 1518 1518 1518 1518 1518 1518 1518 1518 1518 1518 1518SMF Enp/Orig Ratio (q) 2.696 2.904 2.693 2.310 2.230 2.356 2.336 1.913 1.912 1.893 1.874 1.857 1.826SMF Income (r) 63781 67824 70317 73712 75860 78469 88766 103200 119616 138364 159844SMF Load Factor (s) 86.4% 87.7% 86.5% 87.8% 86.9% 87.6% 87.8% 88.1% 88.9% 89.4%SMF Originations (t) 28890 38200 47790 52440 51610 48140 45100 52680 50946 57351 67220 78759 92001SMF WN Effect Originations (u) 0 0 0 0 0SMF Total Originations (v) 50946 57351 67220 78759 92001SMF Total Revenue (w) 63862625 61760036 69525380 81489459 95478082 111529948SMF Outbound Passengers (x) 77880 110914 128677 121143 115105 113430 105357 100777 97392 108565 125968 146291 168028SMF Seat Departures (y) 140276 131232 131120 119964 115940 111209 123660 142951 164590 187894SPI AAD Seat Departures (o) 0 0 0 0 0 0 0 0 0 0 0 0 0SPI Distance (p) 392 392 392 392 392 392 392 392 392 392 392 392 392SPI Enp/Orig Ratio (q) 0.000 0.000 0.000 0.000 0.006 0.000 0.091 0.046 0.046 0.046 0.045 0.045 0.044SPI Income (r) 7051 7279 8106 7370 7153 7259 7680 8287 8987 9793 10717SPI Load Factor (s) 0.0% 0.0% 0.0% 0.0% 0.0% 59.9% 60.1% 60.3% 60.8% 61.2%SPI Originations (t) 2190 1700 2990 3670 3630 2170 1910 1250 1151 1202 1319 1456 1611SPI WN Effect Originations (u) 0 0 0 0 0SPI Total Originations (v) 1151 1202 1319 1456 1611SPI Total Revenue (w) 1025278 944,056 986,299 1,081,702 1,193,886 1,321,082 1,715,990 SPI Outbound Passengers (x) 0 0 0 0 22 0 173 58 53 55 60 66 71SPI Seat Departures (y) 0 0 0 0 0 89 92 99 108 117SRQ AAD Seat Departures (o) 0 0 0 0 18 0 0 0 1 1 1 1 1SRQ Distance (p) 1343 1343 1343 1343 1343 1343 1343 1343 1343 1343 1343 1343 1343SRQ Enp/Orig Ratio (q) 0.000 0.437 0.000 0.000 0.591 0.000 0.012 0.016 0.016 0.016 0.016 0.016 0.016SRQ Income (r) 29020 30579 30387 33452 35803 37718 43460 51569 60879 71621 84061
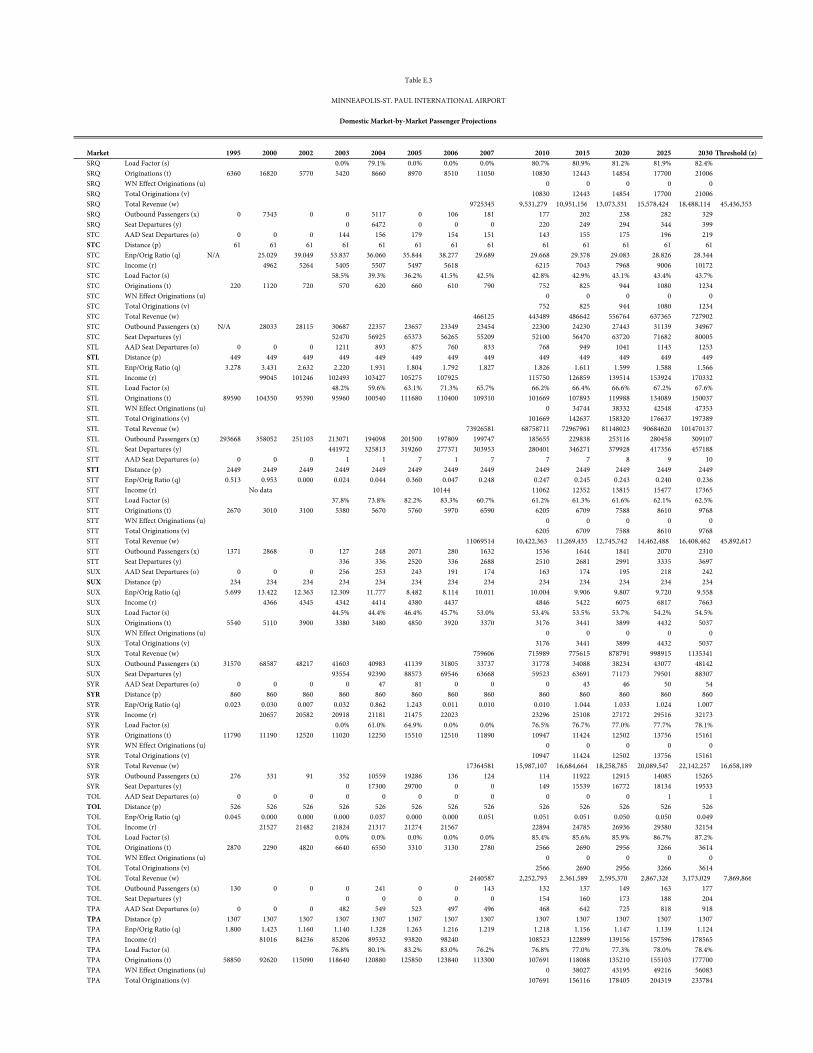
Market 1995 2000 2002 2003 2004 2005 2006 2007 2010 2015 2020 2025 2030 Threshold (z)
Table E.3
MINNEAPOLIS-ST. PAUL INTERNATIONAL AIRPORT
Domestic Market-by-Market Passenger Projections
SRQ Load Factor (s) 0.0% 79.1% 0.0% 0.0% 0.0% 80.7% 80.9% 81.2% 81.9% 82.4%SRQ Originations (t) 6360 16820 5770 5420 8660 8970 8510 11050 10830 12443 14854 17700 21006SRQ WN Effect Originations (u) 0 0 0 0 0SRQ Total Originations (v) 10830 12443 14854 17700 21006SRQ Total Revenue (w) 9725345 9,531,279 10,951,156 13,073,331 15,578,424 18,488,114 45,436,353SRQ Outbound Passengers (x) 0 7343 0 0 5117 0 106 181 177 202 238 282 329SRQ Seat Departures (y) 0 6472 0 0 0 220 249 294 344 399STC AAD Seat Departures (o) 0 0 0 144 156 179 154 151 143 155 175 196 219STC Distance (p) 61 61 61 61 61 61 61 61 61 61 61 61 61STC Enp/Orig Ratio (q) N/A 25.029 39.049 53.837 36.060 35.844 38.277 29.689 29.668 29.378 29.083 28.826 28.344STC Income (r) 4962 5264 5405 5507 5497 5618 6215 7043 7968 9006 10172STC Load Factor (s) 58.5% 39.3% 36.2% 41.5% 42.5% 42.8% 42.9% 43.1% 43.4% 43.7%STC Originations (t) 220 1120 720 570 620 660 610 790 752 825 944 1080 1234STC WN Effect Originations (u) 0 0 0 0 0STC Total Originations (v) 752 825 944 1080 1234STC Total Revenue (w) 466125 443489 486642 556764 637365 727902STC Outbound Passengers (x) N/A 28033 28115 30687 22357 23657 23349 23454 22300 24230 27443 31139 34967STC Seat Departures (y) 52470 56925 65373 56265 55209 52100 56470 63720 71682 80005STL AAD Seat Departures (o) 0 0 0 1211 893 875 760 833 768 949 1041 1143 1253STL Distance (p) 449 449 449 449 449 449 449 449 449 449 449 449 449STL Enp/Orig Ratio (q) 3.278 3.431 2.632 2.220 1.931 1.804 1.792 1.827 1.826 1.611 1.599 1.588 1.566STL Income (r) 99045 101246 102493 103427 105275 107925 115750 126859 139514 153924 170332STL Load Factor (s) 48.2% 59.6% 63.1% 71.3% 65.7% 66.2% 66.4% 66.6% 67.2% 67.6%STL Originations (t) 89590 104350 95390 95960 100540 111680 110400 109310 101669 107893 119988 134089 150037STL WN Effect Originations (u) 0 34744 38332 42548 47353STL Total Originations (v) 101669 142637 158320 176637 197389STL Total Revenue (w) 73926581 68758711 72967961 81148023 90684620 101470137STL Outbound Passengers (x) 293668 358052 251103 213071 194098 201500 197809 199747 185655 229838 253116 280458 309107STL Seat Departures (y) 441972 325813 319260 277371 303953 280401 346271 379928 417356 457188STT AAD Seat Departures (o) 0 0 0 1 1 7 1 7 7 7 8 9 10STT Distance (p) 2449 2449 2449 2449 2449 2449 2449 2449 2449 2449 2449 2449 2449STT Enp/Orig Ratio (q) 0.513 0.953 0.000 0.024 0.044 0.360 0.047 0.248 0.247 0.245 0.243 0.240 0.236STT Income (r) No data 10144 11062 12352 13815 15477 17365STT Load Factor (s) 37.8% 73.8% 82.2% 83.3% 60.7% 61.2% 61.3% 61.6% 62.1% 62.5%STT Originations (t) 2670 3010 3100 5380 5670 5760 5970 6590 6205 6709 7588 8610 9768STT WN Effect Originations (u) 0 0 0 0 0STT Total Originations (v) 6205 6709 7588 8610 9768STT Total Revenue (w) 11069514 10,422,363 11,269,435 12,745,742 14,462,488 16,408,462 45,892,617STT Outbound Passengers (x) 1371 2868 0 127 248 2071 280 1632 1536 1644 1841 2070 2310STT Seat Departures (y) 336 336 2520 336 2688 2510 2681 2991 3335 3697SUX AAD Seat Departures (o) 0 0 0 256 253 243 191 174 163 174 195 218 242SUX Distance (p) 234 234 234 234 234 234 234 234 234 234 234 234 234SUX Enp/Orig Ratio (q) 5.699 13.422 12.363 12.309 11.777 8.482 8.114 10.011 10.004 9.906 9.807 9.720 9.558SUX Income (r) 4366 4345 4342 4414 4380 4437 4846 5422 6075 6817 7663SUX Load Factor (s) 44.5% 44.4% 46.4% 45.7% 53.0% 53.4% 53.5% 53.7% 54.2% 54.5%SUX Originations (t) 5540 5110 3900 3380 3480 4850 3920 3370 3176 3441 3899 4432 5037SUX WN Effect Originations (u) 0 0 0 0 0SUX Total Originations (v) 3176 3441 3899 4432 5037SUX Total Revenue (w) 759606 715989 775615 878791 998915 1135341SUX Outbound Passengers (x) 31570 68587 48217 41603 40983 41139 31805 33737 31778 34088 38234 43077 48142SUX Seat Departures (y) 93554 92390 88573 69546 63668 59523 63691 71173 79501 88307SYR AAD Seat Departures (o) 0 0 0 0 47 81 0 0 0 43 46 50 54SYR Distance (p) 860 860 860 860 860 860 860 860 860 860 860 860 860SYR Enp/Orig Ratio (q) 0.023 0.030 0.007 0.032 0.862 1.243 0.011 0.010 0.010 1.044 1.033 1.024 1.007SYR Income (r) 20657 20582 20918 21181 21475 22023 23296 25108 27172 29516 32173SYR Load Factor (s) 0.0% 61.0% 64.9% 0.0% 0.0% 76.5% 76.7% 77.0% 77.7% 78.1%SYR Originations (t) 11790 11190 12520 11020 12250 15510 12510 11890 10947 11424 12502 13756 15161SYR WN Effect Originations (u) 0 0 0 0 0SYR Total Originations (v) 10947 11424 12502 13756 15161SYR Total Revenue (w) 17364581 15,987,107 16,684,664 18,258,785 20,089,547 22,142,257 16,658,189SYR Outbound Passengers (x) 276 331 91 352 10559 19286 136 124 114 11922 12915 14085 15265SYR Seat Departures (y) 0 17300 29700 0 0 149 15539 16772 18134 19533TOL AAD Seat Departures (o) 0 0 0 0 0 0 0 0 0 0 0 1 1TOL Distance (p) 526 526 526 526 526 526 526 526 526 526 526 526 526TOL Enp/Orig Ratio (q) 0.045 0.000 0.000 0.000 0.037 0.000 0.000 0.051 0.051 0.051 0.050 0.050 0.049TOL Income (r) 21527 21482 21824 21317 21274 21567 22894 24785 26936 29380 32154TOL Load Factor (s) 0.0% 0.0% 0.0% 0.0% 0.0% 85.4% 85.6% 85.9% 86.7% 87.2%TOL Originations (t) 2870 2290 4820 6640 6550 3310 3130 2780 2566 2690 2956 3266 3614TOL WN Effect Originations (u) 0 0 0 0 0TOL Total Originations (v) 2566 2690 2956 3266 3614TOL Total Revenue (w) 2440587 2,252,793 2,361,589 2,595,370 2,867,326 3,173,029 7,869,866 TOL Outbound Passengers (x) 130 0 0 0 241 0 0 143 132 137 149 163 177TOL Seat Departures (y) 0 0 0 0 0 154 160 173 188 204TPA AAD Seat Departures (o) 0 0 0 482 549 523 497 496 468 642 725 818 918TPA Distance (p) 1307 1307 1307 1307 1307 1307 1307 1307 1307 1307 1307 1307 1307TPA Enp/Orig Ratio (q) 1.800 1.423 1.160 1.140 1.328 1.263 1.216 1.219 1.218 1.156 1.147 1.139 1.124TPA Income (r) 81016 84236 85206 89532 93820 98240 108523 122899 139156 157596 178565TPA Load Factor (s) 76.8% 80.1% 83.2% 83.0% 76.2% 76.8% 77.0% 77.3% 78.0% 78.4%TPA Originations (t) 58850 92620 115090 118640 120880 125850 123840 113300 107691 118088 135210 155103 177700TPA WN Effect Originations (u) 0 38027 43195 49216 56083TPA Total Originations (v) 107691 156116 178405 204319 233784
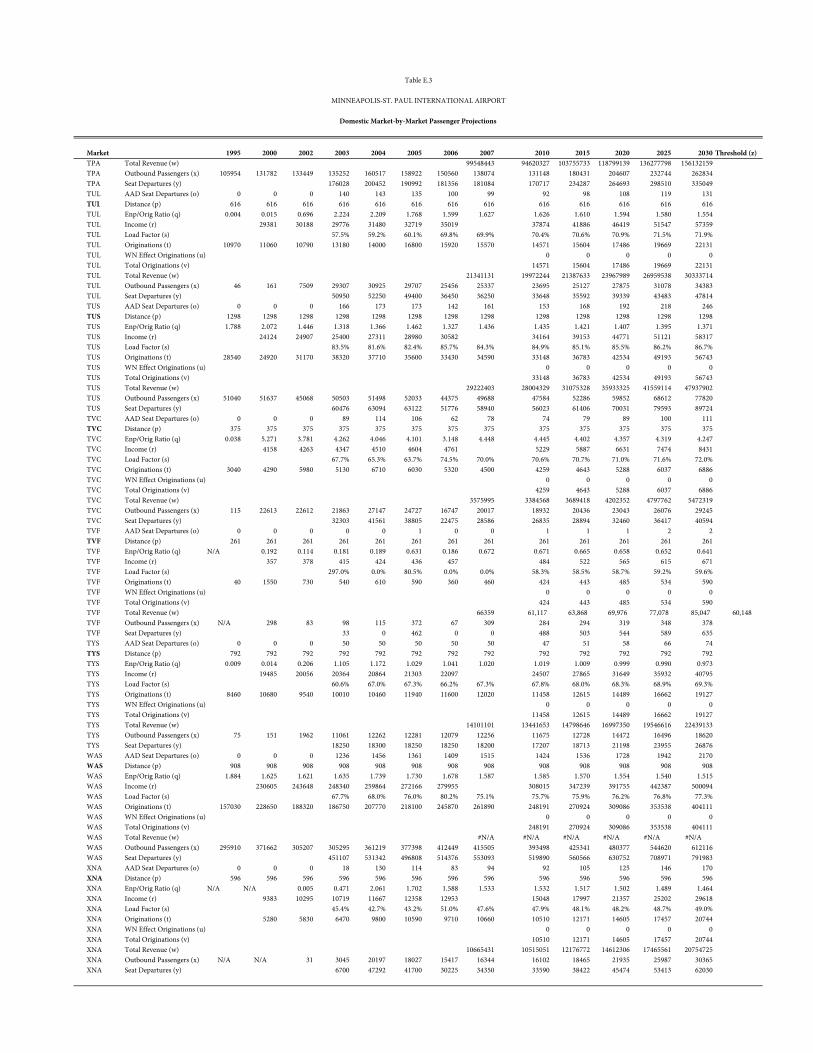
Market 1995 2000 2002 2003 2004 2005 2006 2007 2010 2015 2020 2025 2030 Threshold (z)
Table E.3
MINNEAPOLIS-ST. PAUL INTERNATIONAL AIRPORT
Domestic Market-by-Market Passenger Projections
TPA Total Revenue (w) 99548443 94620327 103755733 118799139 136277798 156132159TPA Outbound Passengers (x) 105954 131782 133449 135252 160517 158922 150560 138074 131148 180431 204607 232744 262834TPA Seat Departures (y) 176028 200452 190992 181356 181084 170717 234287 264693 298510 335049TUL AAD Seat Departures (o) 0 0 0 140 143 135 100 99 92 98 108 119 131TUL Distance (p) 616 616 616 616 616 616 616 616 616 616 616 616 616TUL Enp/Orig Ratio (q) 0.004 0.015 0.696 2.224 2.209 1.768 1.599 1.627 1.626 1.610 1.594 1.580 1.554TUL Income (r) 29381 30188 29776 31480 32719 35019 37874 41886 46419 51547 57359TUL Load Factor (s) 57.5% 59.2% 60.1% 69.8% 69.9% 70.4% 70.6% 70.9% 71.5% 71.9%TUL Originations (t) 10970 11060 10790 13180 14000 16800 15920 15570 14571 15604 17486 19669 22131TUL WN Effect Originations (u) 0 0 0 0 0TUL Total Originations (v) 14571 15604 17486 19669 22131TUL Total Revenue (w) 21341131 19972244 21387633 23967989 26959538 30333714TUL Outbound Passengers (x) 46 161 7509 29307 30925 29707 25456 25337 23695 25127 27875 31078 34383TUL Seat Departures (y) 50950 52250 49400 36450 36250 33648 35592 39339 43483 47814TUS AAD Seat Departures (o) 0 0 0 166 173 173 142 161 153 168 192 218 246TUS Distance (p) 1298 1298 1298 1298 1298 1298 1298 1298 1298 1298 1298 1298 1298TUS Enp/Orig Ratio (q) 1.788 2.072 1.446 1.318 1.366 1.462 1.327 1.436 1.435 1.421 1.407 1.395 1.371TUS Income (r) 24124 24907 25400 27311 28980 30582 34164 39153 44771 51121 58317TUS Load Factor (s) 83.5% 81.6% 82.4% 85.7% 84.3% 84.9% 85.1% 85.5% 86.2% 86.7%TUS Originations (t) 28540 24920 31170 38320 37710 35600 33430 34590 33148 36783 42534 49193 56743TUS WN Effect Originations (u) 0 0 0 0 0TUS Total Originations (v) 33148 36783 42534 49193 56743TUS Total Revenue (w) 29222403 28004329 31075328 35933325 41559114 47937902TUS Outbound Passengers (x) 51040 51637 45068 50503 51498 52033 44375 49688 47584 52286 59852 68612 77820TUS Seat Departures (y) 60476 63094 63122 51776 58940 56023 61406 70031 79593 89724TVC AAD Seat Departures (o) 0 0 0 89 114 106 62 78 74 79 89 100 111TVC Distance (p) 375 375 375 375 375 375 375 375 375 375 375 375 375TVC Enp/Orig Ratio (q) 0.038 5.271 3.781 4.262 4.046 4.101 3.148 4.448 4.445 4.402 4.357 4.319 4.247TVC Income (r) 4158 4263 4347 4510 4604 4761 5229 5887 6631 7474 8431TVC Load Factor (s) 67.7% 65.3% 63.7% 74.5% 70.0% 70.6% 70.7% 71.0% 71.6% 72.0%TVC Originations (t) 3040 4290 5980 5130 6710 6030 5320 4500 4259 4643 5288 6037 6886TVC WN Effect Originations (u) 0 0 0 0 0TVC Total Originations (v) 4259 4643 5288 6037 6886TVC Total Revenue (w) 3575995 3384568 3689418 4202352 4797762 5472319TVC Outbound Passengers (x) 115 22613 22612 21863 27147 24727 16747 20017 18932 20436 23043 26076 29245TVC Seat Departures (y) 32303 41561 38805 22475 28586 26835 28894 32460 36417 40594TVF AAD Seat Departures (o) 0 0 0 0 0 1 0 0 1 1 1 2 2TVF Distance (p) 261 261 261 261 261 261 261 261 261 261 261 261 261TVF Enp/Orig Ratio (q) N/A 0.192 0.114 0.181 0.189 0.631 0.186 0.672 0.671 0.665 0.658 0.652 0.641TVF Income (r) 357 378 415 424 436 457 484 522 565 615 671TVF Load Factor (s) 297.0% 0.0% 80.5% 0.0% 0.0% 58.3% 58.5% 58.7% 59.2% 59.6%TVF Originations (t) 40 1550 730 540 610 590 360 460 424 443 485 534 590TVF WN Effect Originations (u) 0 0 0 0 0TVF Total Originations (v) 424 443 485 534 590TVF Total Revenue (w) 66359 61,117 63,868 69,976 77,078 85,047 60,148 TVF Outbound Passengers (x) N/A 298 83 98 115 372 67 309 284 294 319 348 378TVF Seat Departures (y) 33 0 462 0 0 488 503 544 589 635TYS AAD Seat Departures (o) 0 0 0 50 50 50 50 50 47 51 58 66 74TYS Distance (p) 792 792 792 792 792 792 792 792 792 792 792 792 792TYS Enp/Orig Ratio (q) 0.009 0.014 0.206 1.105 1.172 1.029 1.041 1.020 1.019 1.009 0.999 0.990 0.973TYS Income (r) 19485 20056 20364 20864 21303 22097 24507 27865 31649 35932 40795TYS Load Factor (s) 60.6% 67.0% 67.3% 66.2% 67.3% 67.8% 68.0% 68.3% 68.9% 69.3%TYS Originations (t) 8460 10680 9540 10010 10460 11940 11600 12020 11458 12615 14489 16662 19127TYS WN Effect Originations (u) 0 0 0 0 0TYS Total Originations (v) 11458 12615 14489 16662 19127TYS Total Revenue (w) 14101101 13441653 14798646 16997350 19546616 22439133TYS Outbound Passengers (x) 75 151 1962 11061 12262 12281 12079 12256 11675 12728 14472 16496 18620TYS Seat Departures (y) 18250 18300 18250 18250 18200 17207 18713 21198 23955 26876WAS AAD Seat Departures (o) 0 0 0 1236 1456 1361 1409 1515 1424 1536 1728 1942 2170WAS Distance (p) 908 908 908 908 908 908 908 908 908 908 908 908 908WAS Enp/Orig Ratio (q) 1.884 1.625 1.621 1.635 1.739 1.730 1.678 1.587 1.585 1.570 1.554 1.540 1.515WAS Income (r) 230605 243648 248340 259864 272166 279955 308015 347239 391755 442387 500094WAS Load Factor (s) 67.7% 68.0% 76.0% 80.2% 75.1% 75.7% 75.9% 76.2% 76.8% 77.3%WAS Originations (t) 157030 228650 188320 186750 207770 218100 245870 261890 248191 270924 309086 353538 404111WAS WN Effect Originations (u) 0 0 0 0 0WAS Total Originations (v) 248191 270924 309086 353538 404111WAS Total Revenue (w) #N/A #N/A #N/A #N/A #N/A #N/AWAS Outbound Passengers (x) 295910 371662 305207 305295 361219 377398 412449 415505 393498 425341 480377 544620 612116WAS Seat Departures (y) 451107 531342 496808 514376 553093 519890 560566 630752 708971 791983XNA AAD Seat Departures (o) 0 0 0 18 130 114 83 94 92 105 125 146 170XNA Distance (p) 596 596 596 596 596 596 596 596 596 596 596 596 596XNA Enp/Orig Ratio (q) N/A N/A 0.005 0.471 2.061 1.702 1.588 1.533 1.532 1.517 1.502 1.489 1.464XNA Income (r) 9383 10295 10719 11667 12358 12953 15048 17997 21357 25202 29618XNA Load Factor (s) 45.4% 42.7% 43.2% 51.0% 47.6% 47.9% 48.1% 48.2% 48.7% 49.0%XNA Originations (t) 5280 5830 6470 9800 10590 9710 10660 10510 12171 14605 17457 20744XNA WN Effect Originations (u) 0 0 0 0 0XNA Total Originations (v) 10510 12171 14605 17457 20744XNA Total Revenue (w) 10665431 10515051 12176772 14612306 17465561 20754725XNA Outbound Passengers (x) N/A N/A 31 3045 20197 18027 15417 16344 16102 18465 21935 25987 30365XNA Seat Departures (y) 6700 47292 41700 30225 34350 33590 38422 45474 53413 62030
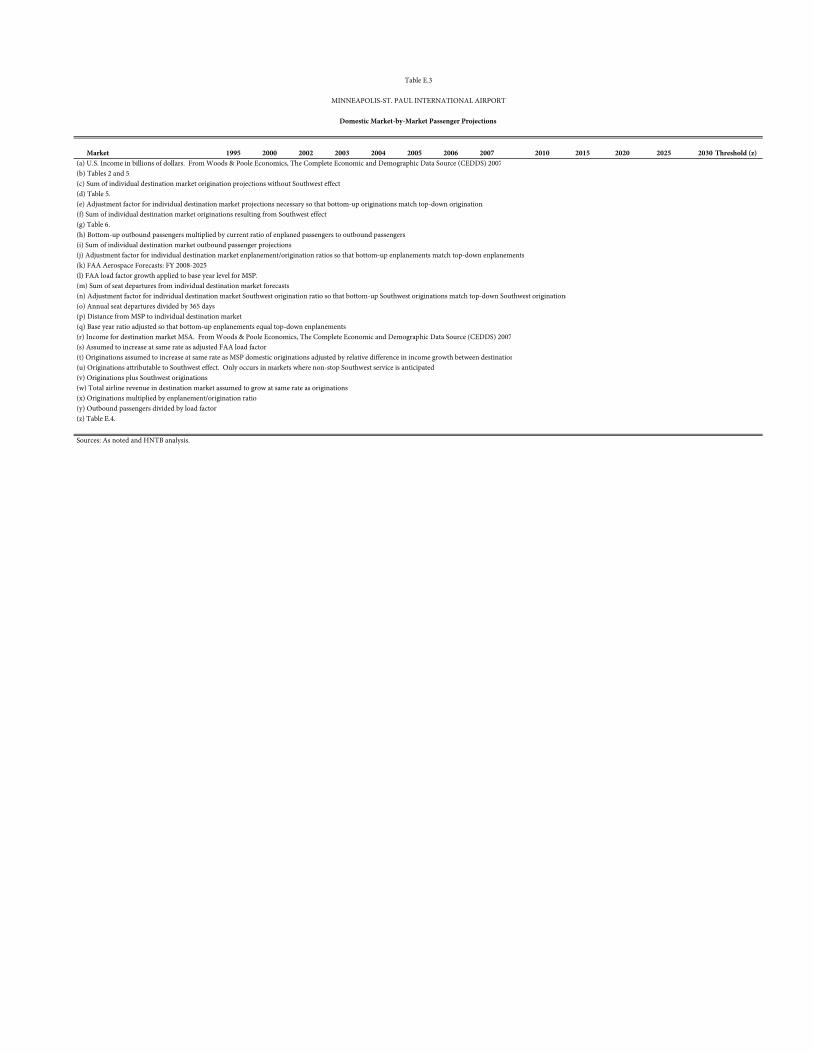
Market 1995 2000 2002 2003 2004 2005 2006 2007 2010 2015 2020 2025 2030 Threshold (z)
Table E.3
MINNEAPOLIS-ST. PAUL INTERNATIONAL AIRPORT
Domestic Market-by-Market Passenger Projections
(a) U.S. Income in billions of dollars. From Woods & Poole Economics, The Complete Economic and Demographic Data Source (CEDDS) 2007 (b) Tables 2 and 5. (c) Sum of individual destination market origination projections without Southwest effect (d) Table 5. (e) Adjustment factor for individual destination market projections necessary so that bottom-up originations match top-down originations (f) Sum of individual destination market originations resulting from Southwest effect. (g) Table 6. (h) Bottom-up outbound passengers multiplied by current ratio of enplaned passengers to outbound passengers (i) Sum of individual destination market outbound passenger projections (j) Adjustment factor for individual destination market enplanement/origination ratios so that bottom-up enplanements match top-down enplanements (k) FAA Aerospace Forecasts: FY 2008-2025. (l) FAA load factor growth applied to base year level for MSP. (m) Sum of seat departures from individual destination market forecasts. (n) Adjustment factor for individual destination market Southwest origination ratio so that bottom-up Southwest originations match top-down Southwest originations (o) Annual seat departures divided by 365 days. (p) Distance from MSP to individual destination market. (q) Base year ratio adjusted so that bottom-up enplanements equal top-down enplanements. (r) Income for destination market MSA. From Woods & Poole Economics, The Complete Economic and Demographic Data Source (CEDDS) 2007 (s) Assumed to increase at same rate as adjusted FAA load factor. (t) Originations assumed to increase at same rate as MSP domestic originations adjusted by relative difference in income growth between destination (u) Originations attributable to Southwest effect. Only occurs in markets where non-stop Southwest service is anticipated (v) Originations plus Southwest originations. (w) Total airline revenue in destination market assumed to grow at same rate as originations (x) Originations multiplied by enplanement/origination ratio. (y) Outbound passengers divided by load factor (z) Table E.4.
Sources: As noted and HNTB analysis.
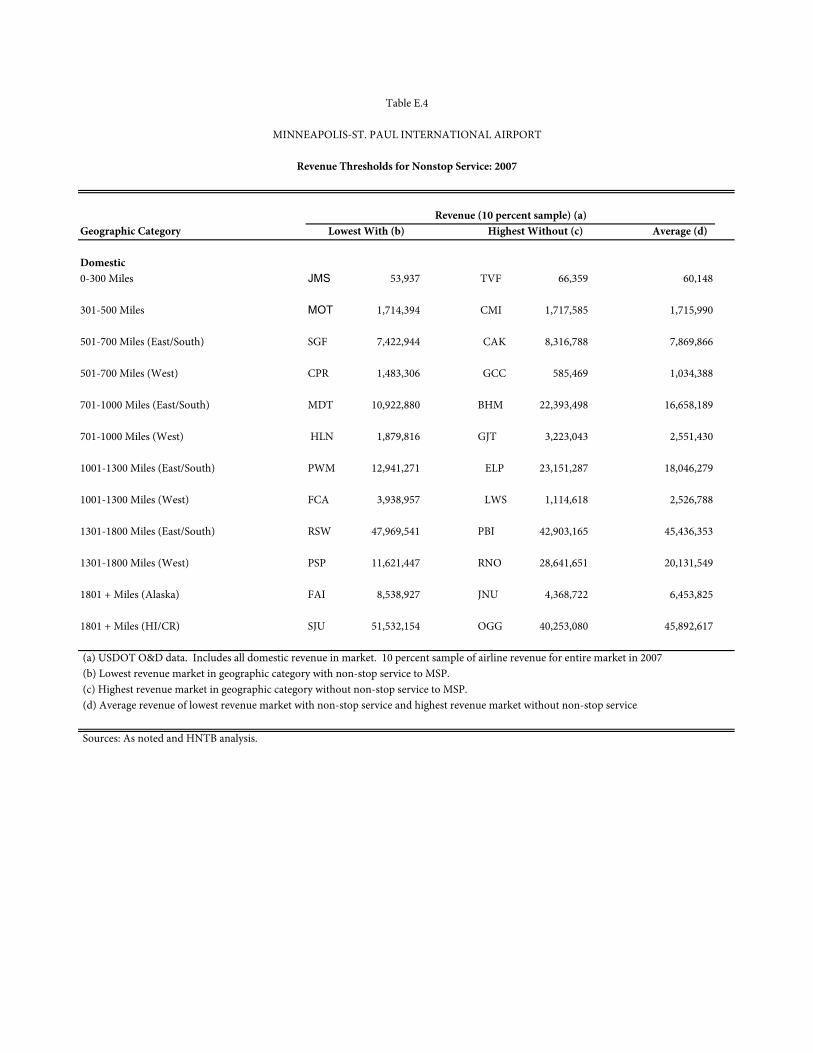
Geographic Category Average (d)
Domestic0-300 Miles JMS 53,937 TVF 66,359 60,148
301-500 Miles MOT 1,714,394 CMI 1,717,585 1,715,990
501-700 Miles (East/South) SGF 7,422,944 CAK 8,316,788 7,869,866
501-700 Miles (West) CPR 1,483,306 GCC 585,469 1,034,388
701-1000 Miles (East/South) MDT 10,922,880 BHM 22,393,498 16,658,189
701-1000 Miles (West) HLN 1,879,816 GJT 3,223,043 2,551,430
1001-1300 Miles (East/South) PWM 12,941,271 ELP 23,151,287 18,046,279
1001-1300 Miles (West) FCA 3,938,957 LWS 1,114,618 2,526,788
1301-1800 Miles (East/South) RSW 47,969,541 PBI 42,903,165 45,436,353
1301-1800 Miles (West) PSP 11,621,447 RNO 28,641,651 20,131,549
1801 + Miles (Alaska) FAI 8,538,927 JNU 4,368,722 6,453,825
1801 + Miles (HI/CR) SJU 51,532,154 OGG 40,253,080 45,892,617
(a) USDOT O&D data. Includes all domestic revenue in market. 10 percent sample of airline revenue for entire market in 2007. (b) Lowest revenue market in geographic category with non-stop service to MSP. (c) Highest revenue market in geographic category without non-stop service to MSP. (d) Average revenue of lowest revenue market with non-stop service and highest revenue market without non-stop service.
Sources: As noted and HNTB analysis.
Table E.4
Revenue Thresholds for Nonstop Service: 2007
Lowest With (b) Highest Without (c)
MINNEAPOLIS-ST. PAUL INTERNATIONAL AIRPORT
Revenue (10 percent sample) (a)
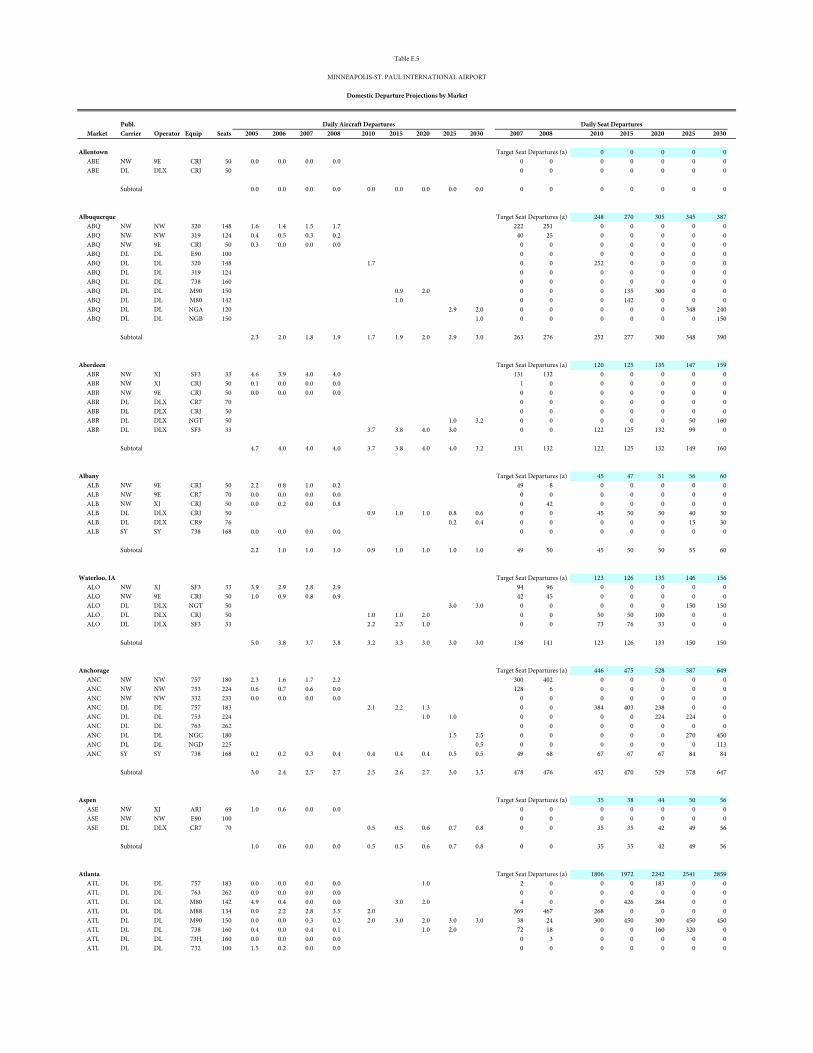
Publ.x Market Carrier Operator Equip Seats 2005 2006 2007 2008 x 2010 2015 2020 2025 2030 x 2007 2008 x 2010 2015 2020 2025 2030
Allentown Target Seat Departures (a) 0 0 0 0 0ABE NW 9E CRJ 50 0.0 0.0 0.0 0.0 0 0 0 0 0 0 0ABE DL DLX CRJ 50 0 0 0 0 0 0 0
Subtotal 0.0 0.0 0.0 0.0 0.0 0.0 0.0 0.0 0.0 0 0 0 0 0 0 0
Albuquerque Target Seat Departures (a) 248 270 305 345 387ABQ NW NW 320 148 1.6 1.4 1.5 1.7 222 251 0 0 0 0 0ABQ NW NW 319 124 0.4 0.5 0.3 0.2 40 25 0 0 0 0 0ABQ NW 9E CRJ 50 0.3 0.0 0.0 0.0 0 0 0 0 0 0 0ABQ DL DL E90 100 0 0 0 0 0 0 0ABQ DL DL 320 148 1.7 0 0 252 0 0 0 0ABQ DL DL 319 124 0 0 0 0 0 0 0ABQ DL DL 738 160 0 0 0 0 0 0 0ABQ DL DL M90 150 0.9 2.0 0 0 0 135 300 0 0ABQ DL DL M80 142 1.0 0 0 0 142 0 0 0ABQ DL DL NGA 120 2.9 2.0 0 0 0 0 0 348 240ABQ DL DL NGB 150 1.0 0 0 0 0 0 0 150
Subtotal 2.3 2.0 1.8 1.9 1.7 1.9 2.0 2.9 3.0 263 276 252 277 300 348 390
Aberdeen Target Seat Departures (a) 120 125 135 147 159ABR NW XJ SF3 33 4.6 3.9 4.0 4.0 131 132 0 0 0 0 0ABR NW XJ CRJ 50 0.1 0.0 0.0 0.0 1 0 0 0 0 0 0ABR NW 9E CRJ 50 0.0 0.0 0.0 0.0 0 0 0 0 0 0 0ABR DL DLX CR7 70 0 0 0 0 0 0 0ABR DL DLX CRJ 50 0 0 0 0 0 0 0ABR DL DLX NGT 50 1.0 3.2 0 0 0 0 0 50 160ABR DL DLX SF3 33 3.7 3.8 4.0 3.0 0 0 122 125 132 99 0
Subtotal 4.7 4.0 4.0 4.0 3.7 3.8 4.0 4.0 3.2 131 132 122 125 132 149 160
Albany Target Seat Departures (a) 45 47 51 56 60ALB NW 9E CRJ 50 2.2 0.8 1.0 0.2 49 8 0 0 0 0 0ALB NW 9E CR7 70 0.0 0.0 0.0 0.0 0 0 0 0 0 0 0ALB NW XJ CRJ 50 0.0 0.2 0.0 0.8 0 42 0 0 0 0 0ALB DL DLX CRJ 50 0.9 1.0 1.0 0.8 0.6 0 0 45 50 50 40 30ALB DL DLX CR9 76 0.2 0.4 0 0 0 0 0 15 30ALB SY SY 738 168 0.0 0.0 0.0 0.0 0 0 0 0 0 0 0
Subtotal 2.2 1.0 1.0 1.0 0.9 1.0 1.0 1.0 1.0 49 50 45 50 50 55 60
Waterloo, IA Target Seat Departures (a) 123 126 135 146 156ALO NW XJ SF3 33 3.9 2.9 2.8 2.9 94 96 0 0 0 0 0ALO NW 9E CRJ 50 1.0 0.9 0.8 0.9 42 45 0 0 0 0 0ALO DL DLX NGT 50 3.0 3.0 0 0 0 0 0 150 150ALO DL DLX CRJ 50 1.0 1.0 2.0 0 0 50 50 100 0 0ALO DL DLX SF3 33 2.2 2.3 1.0 0 0 73 76 33 0 0
Subtotal 5.0 3.8 3.7 3.8 3.2 3.3 3.0 3.0 3.0 136 141 123 126 133 150 150
Anchorage Target Seat Departures (a) 446 475 528 587 649ANC NW NW 757 180 2.3 1.6 1.7 2.2 300 402 0 0 0 0 0ANC NW NW 753 224 0.6 0.7 0.6 0.0 128 6 0 0 0 0 0ANC NW NW 332 233 0.0 0.0 0.0 0.0 0 0 0 0 0 0 0ANC DL DL 757 183 2.1 2.2 1.3 0 0 384 403 238 0 0ANC DL DL 753 224 1.0 1.0 0 0 0 0 224 224 0ANC DL DL 763 262 0 0 0 0 0 0 0ANC DL DL NGC 180 1.5 2.5 0 0 0 0 0 270 450ANC DL DL NGD 225 0.5 0 0 0 0 0 0 113ANC SY SY 738 168 0.2 0.2 0.3 0.4 0.4 0.4 0.4 0.5 0.5 49 68 67 67 67 84 84
Subtotal 3.0 2.4 2.5 2.7 2.5 2.6 2.7 3.0 3.5 478 476 452 470 529 578 647
Aspen Target Seat Departures (a) 35 38 44 50 56ASE NW XJ ARJ 69 1.0 0.6 0.0 0.0 0 0 0 0 0 0 0ASE NW NW E90 100 0 0 0 0 0 0 0ASE DL DLX CR7 70 0.5 0.5 0.6 0.7 0.8 0 0 35 35 42 49 56
Subtotal 1.0 0.6 0.0 0.0 0.5 0.5 0.6 0.7 0.8 0 0 35 35 42 49 56
Atlanta Target Seat Departures (a) 1806 1972 2242 2541 2859ATL DL DL 757 183 0.0 0.0 0.0 0.0 1.0 2 0 0 0 183 0 0ATL DL DL 763 262 0.0 0.0 0.0 0.0 0 0 0 0 0 0 0ATL DL DL M80 142 4.9 0.4 0.0 0.0 3.0 2.0 4 0 0 426 284 0 0ATL DL DL M88 134 0.0 2.2 2.8 3.5 2.0 369 467 268 0 0 0 0ATL DL DL M90 150 0.0 0.0 0.3 0.2 2.0 3.0 2.0 3.0 3.0 38 24 300 450 300 450 450ATL DL DL 738 160 0.4 0.0 0.4 0.1 1.0 2.0 72 18 0 0 160 320 0ATL DL DL 73H 160 0.0 0.0 0.0 0.0 0 3 0 0 0 0 0ATL DL DL 732 100 1.5 0.2 0.0 0.0 0 0 0 0 0 0 0
Table E.5
MINNEAPOLIS-ST. PAUL INTERNATIONAL AIRPORT
Domestic Departure Projections by Market
Daily Aircraft Departures Daily Seat Departures
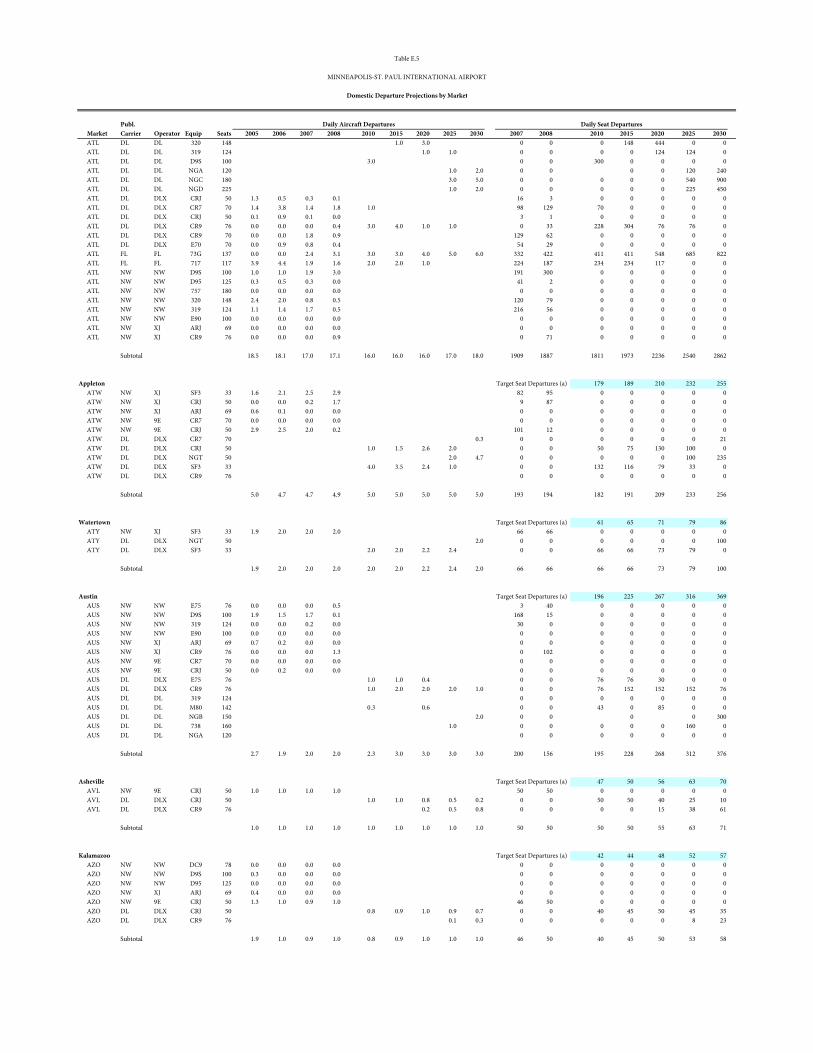
Publ.x Market Carrier Operator Equip Seats 2005 2006 2007 2008 x 2010 2015 2020 2025 2030 x 2007 2008 x 2010 2015 2020 2025 2030
Table E.5
MINNEAPOLIS-ST. PAUL INTERNATIONAL AIRPORT
Domestic Departure Projections by Market
Daily Aircraft Departures Daily Seat Departures
ATL DL DL 320 148 1.0 3.0 0 0 0 148 444 0 0ATL DL DL 319 124 1.0 1.0 0 0 0 0 124 124 0ATL DL DL D9S 100 3.0 0 0 300 0 0 0 0ATL DL DL NGA 120 1.0 2.0 0 0 0 0 120 240ATL DL DL NGC 180 3.0 5.0 0 0 0 0 0 540 900ATL DL DL NGD 225 1.0 2.0 0 0 0 0 0 225 450ATL DL DLX CRJ 50 1.3 0.5 0.3 0.1 16 3 0 0 0 0 0ATL DL DLX CR7 70 1.4 3.8 1.4 1.8 1.0 98 129 70 0 0 0 0ATL DL DLX CRJ 50 0.1 0.9 0.1 0.0 3 1 0 0 0 0 0ATL DL DLX CR9 76 0.0 0.0 0.0 0.4 3.0 4.0 1.0 1.0 0 33 228 304 76 76 0ATL DL DLX CR9 70 0.0 0.0 1.8 0.9 129 62 0 0 0 0 0ATL DL DLX E70 70 0.0 0.9 0.8 0.4 54 29 0 0 0 0 0ATL FL FL 73G 137 0.0 0.0 2.4 3.1 3.0 3.0 4.0 5.0 6.0 332 422 411 411 548 685 822ATL FL FL 717 117 3.9 4.4 1.9 1.6 2.0 2.0 1.0 224 187 234 234 117 0 0ATL NW NW D9S 100 1.0 1.0 1.9 3.0 191 300 0 0 0 0 0ATL NW NW D95 125 0.3 0.5 0.3 0.0 41 2 0 0 0 0 0ATL NW NW 757 180 0.0 0.0 0.0 0.0 0 0 0 0 0 0 0ATL NW NW 320 148 2.4 2.0 0.8 0.5 120 79 0 0 0 0 0ATL NW NW 319 124 1.1 1.4 1.7 0.5 216 56 0 0 0 0 0ATL NW NW E90 100 0.0 0.0 0.0 0.0 0 0 0 0 0 0 0ATL NW XJ ARJ 69 0.0 0.0 0.0 0.0 0 0 0 0 0 0 0ATL NW XJ CR9 76 0.0 0.0 0.0 0.9 0 71 0 0 0 0 0
Subtotal 18.5 18.1 17.0 17.1 16.0 16.0 16.0 17.0 18.0 1909 1887 1811 1973 2236 2540 2862
Appleton Target Seat Departures (a) 179 189 210 232 255ATW NW XJ SF3 33 1.6 2.1 2.5 2.9 82 95 0 0 0 0 0ATW NW XJ CRJ 50 0.0 0.0 0.2 1.7 9 87 0 0 0 0 0ATW NW XJ ARJ 69 0.6 0.1 0.0 0.0 0 0 0 0 0 0 0ATW NW 9E CR7 70 0.0 0.0 0.0 0.0 0 0 0 0 0 0 0ATW NW 9E CRJ 50 2.9 2.5 2.0 0.2 101 12 0 0 0 0 0ATW DL DLX CR7 70 0.3 0 0 0 0 0 0 21ATW DL DLX CRJ 50 1.0 1.5 2.6 2.0 0 0 50 75 130 100 0ATW DL DLX NGT 50 2.0 4.7 0 0 0 0 0 100 235ATW DL DLX SF3 33 4.0 3.5 2.4 1.0 0 0 132 116 79 33 0ATW DL DLX CR9 76 0 0 0 0 0 0 0
Subtotal 5.0 4.7 4.7 4.9 5.0 5.0 5.0 5.0 5.0 193 194 182 191 209 233 256
Watertown Target Seat Departures (a) 61 65 71 79 86ATY NW XJ SF3 33 1.9 2.0 2.0 2.0 66 66 0 0 0 0 0ATY DL DLX NGT 50 2.0 0 0 0 0 0 0 100ATY DL DLX SF3 33 2.0 2.0 2.2 2.4 0 0 66 66 73 79 0
Subtotal 1.9 2.0 2.0 2.0 2.0 2.0 2.2 2.4 2.0 66 66 66 66 73 79 100
Austin Target Seat Departures (a) 196 225 267 316 369AUS NW NW E75 76 0.0 0.0 0.0 0.5 3 40 0 0 0 0 0AUS NW NW D9S 100 1.9 1.5 1.7 0.1 168 15 0 0 0 0 0AUS NW NW 319 124 0.0 0.0 0.2 0.0 30 0 0 0 0 0 0AUS NW NW E90 100 0.0 0.0 0.0 0.0 0 0 0 0 0 0 0AUS NW XJ ARJ 69 0.7 0.2 0.0 0.0 0 0 0 0 0 0 0AUS NW XJ CR9 76 0.0 0.0 0.0 1.3 0 102 0 0 0 0 0AUS NW 9E CR7 70 0.0 0.0 0.0 0.0 0 0 0 0 0 0 0AUS NW 9E CRJ 50 0.0 0.2 0.0 0.0 0 0 0 0 0 0 0AUS DL DLX E75 76 1.0 1.0 0.4 0 0 76 76 30 0 0AUS DL DLX CR9 76 1.0 2.0 2.0 2.0 1.0 0 0 76 152 152 152 76AUS DL DL 319 124 0 0 0 0 0 0 0AUS DL DL M80 142 0.3 0.6 0 0 43 0 85 0 0AUS DL DL NGB 150 2.0 0 0 0 0 300AUS DL DL 738 160 1.0 0 0 0 0 0 160 0AUS DL DL NGA 120 0 0 0 0 0 0 0
Subtotal 2.7 1.9 2.0 2.0 2.3 3.0 3.0 3.0 3.0 200 156 195 228 268 312 376
Asheville Target Seat Departures (a) 47 50 56 63 70AVL NW 9E CRJ 50 1.0 1.0 1.0 1.0 50 50 0 0 0 0 0AVL DL DLX CRJ 50 1.0 1.0 0.8 0.5 0.2 0 0 50 50 40 25 10AVL DL DLX CR9 76 0.2 0.5 0.8 0 0 0 0 15 38 61
Subtotal 1.0 1.0 1.0 1.0 1.0 1.0 1.0 1.0 1.0 50 50 50 50 55 63 71
Kalamazoo Target Seat Departures (a) 42 44 48 52 57AZO NW NW DC9 78 0.0 0.0 0.0 0.0 0 0 0 0 0 0 0AZO NW NW D9S 100 0.3 0.0 0.0 0.0 0 0 0 0 0 0 0AZO NW NW D95 125 0.0 0.0 0.0 0.0 0 0 0 0 0 0 0AZO NW XJ ARJ 69 0.4 0.0 0.0 0.0 0 0 0 0 0 0 0AZO NW 9E CRJ 50 1.3 1.0 0.9 1.0 46 50 0 0 0 0 0AZO DL DLX CRJ 50 0.8 0.9 1.0 0.9 0.7 0 0 40 45 50 45 35AZO DL DLX CR9 76 0.1 0.3 0 0 0 0 0 8 23
Subtotal 1.9 1.0 0.9 1.0 0.8 0.9 1.0 1.0 1.0 46 50 40 45 50 53 58
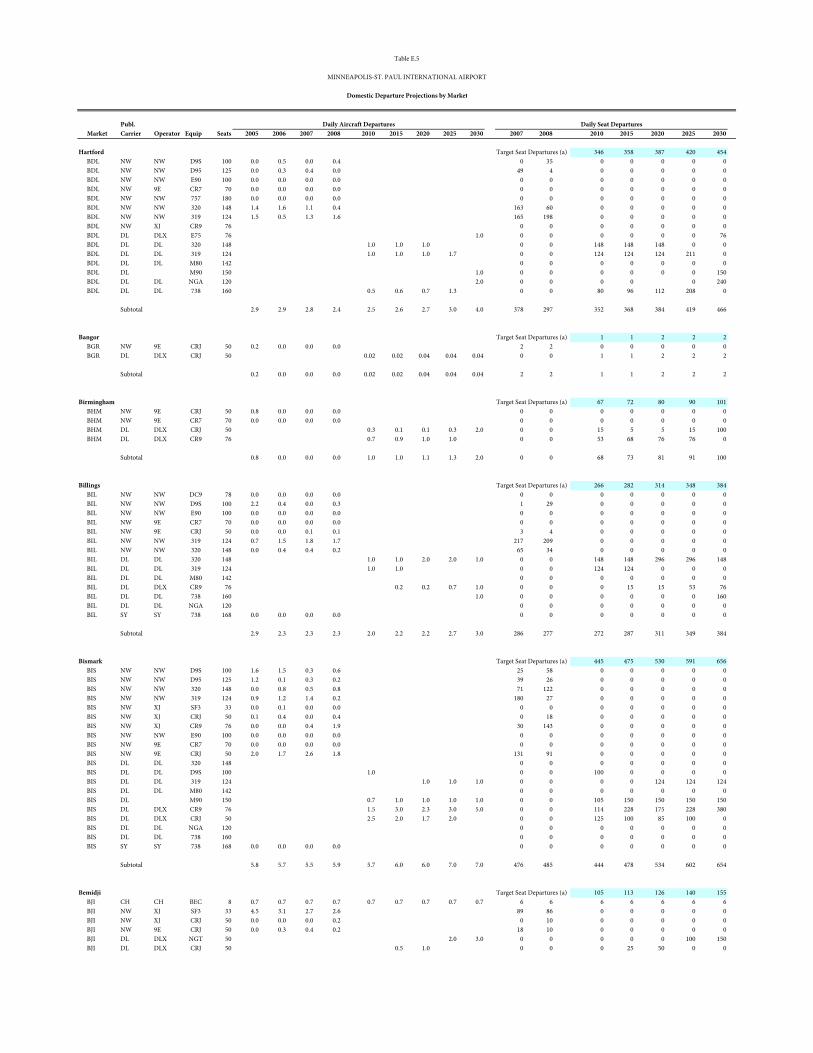
Publ.x Market Carrier Operator Equip Seats 2005 2006 2007 2008 x 2010 2015 2020 2025 2030 x 2007 2008 x 2010 2015 2020 2025 2030
Table E.5
MINNEAPOLIS-ST. PAUL INTERNATIONAL AIRPORT
Domestic Departure Projections by Market
Daily Aircraft Departures Daily Seat Departures
Hartford Target Seat Departures (a) 346 358 387 420 454BDL NW NW D9S 100 0.0 0.5 0.0 0.4 0 35 0 0 0 0 0BDL NW NW D95 125 0.0 0.3 0.4 0.0 49 4 0 0 0 0 0BDL NW NW E90 100 0.0 0.0 0.0 0.0 0 0 0 0 0 0 0BDL NW 9E CR7 70 0.0 0.0 0.0 0.0 0 0 0 0 0 0 0BDL NW NW 757 180 0.0 0.0 0.0 0.0 0 0 0 0 0 0 0BDL NW NW 320 148 1.4 1.6 1.1 0.4 163 60 0 0 0 0 0BDL NW NW 319 124 1.5 0.5 1.3 1.6 165 198 0 0 0 0 0BDL NW XJ CR9 76 0 0 0 0 0 0 0BDL DL DLX E75 76 1.0 0 0 0 0 0 0 76BDL DL DL 320 148 1.0 1.0 1.0 0 0 148 148 148 0 0BDL DL DL 319 124 1.0 1.0 1.0 1.7 0 0 124 124 124 211 0BDL DL DL M80 142 0 0 0 0 0 0 0BDL DL M90 150 1.0 0 0 0 0 0 0 150BDL DL DL NGA 120 2.0 0 0 0 0 0 240BDL DL DL 738 160 0.5 0.6 0.7 1.3 0 0 80 96 112 208 0
Subtotal 2.9 2.9 2.8 2.4 2.5 2.6 2.7 3.0 4.0 378 297 352 368 384 419 466
Bangor Target Seat Departures (a) 1 1 2 2 2BGR NW 9E CRJ 50 0.2 0.0 0.0 0.0 2 2 0 0 0 0 0BGR DL DLX CRJ 50 0.02 0.02 0.04 0.04 0.04 0 0 1 1 2 2 2
Subtotal 0.2 0.0 0.0 0.0 0.02 0.02 0.04 0.04 0.04 2 2 1 1 2 2 2
Birmingham Target Seat Departures (a) 67 72 80 90 101BHM NW 9E CRJ 50 0.8 0.0 0.0 0.0 0 0 0 0 0 0 0BHM NW 9E CR7 70 0.0 0.0 0.0 0.0 0 0 0 0 0 0 0BHM DL DLX CRJ 50 0.3 0.1 0.1 0.3 2.0 0 0 15 5 5 15 100BHM DL DLX CR9 76 0.7 0.9 1.0 1.0 0 0 53 68 76 76 0
Subtotal 0.8 0.0 0.0 0.0 1.0 1.0 1.1 1.3 2.0 0 0 68 73 81 91 100
Billings Target Seat Departures (a) 266 282 314 348 384BIL NW NW DC9 78 0.0 0.0 0.0 0.0 0 0 0 0 0 0 0BIL NW NW D9S 100 2.2 0.4 0.0 0.3 1 29 0 0 0 0 0BIL NW NW E90 100 0.0 0.0 0.0 0.0 0 0 0 0 0 0 0BIL NW 9E CR7 70 0.0 0.0 0.0 0.0 0 0 0 0 0 0 0BIL NW 9E CRJ 50 0.0 0.0 0.1 0.1 3 4 0 0 0 0 0BIL NW NW 319 124 0.7 1.5 1.8 1.7 217 209 0 0 0 0 0BIL NW NW 320 148 0.0 0.4 0.4 0.2 65 34 0 0 0 0 0BIL DL DL 320 148 1.0 1.0 2.0 2.0 1.0 0 0 148 148 296 296 148BIL DL DL 319 124 1.0 1.0 0 0 124 124 0 0 0BIL DL DL M80 142 0 0 0 0 0 0 0BIL DL DLX CR9 76 0.2 0.2 0.7 1.0 0 0 0 15 15 53 76BIL DL DL 738 160 1.0 0 0 0 0 0 0 160BIL DL DL NGA 120 0 0 0 0 0 0 0BIL SY SY 738 168 0.0 0.0 0.0 0.0 0 0 0 0 0 0 0
Subtotal 2.9 2.3 2.3 2.3 2.0 2.2 2.2 2.7 3.0 286 277 272 287 311 349 384
Bismark Target Seat Departures (a) 445 475 530 591 656BIS NW NW D9S 100 1.6 1.5 0.3 0.6 25 58 0 0 0 0 0BIS NW NW D95 125 1.2 0.1 0.3 0.2 39 26 0 0 0 0 0BIS NW NW 320 148 0.0 0.8 0.5 0.8 71 122 0 0 0 0 0BIS NW NW 319 124 0.9 1.2 1.4 0.2 180 27 0 0 0 0 0BIS NW XJ SF3 33 0.0 0.1 0.0 0.0 0 0 0 0 0 0 0BIS NW XJ CRJ 50 0.1 0.4 0.0 0.4 0 18 0 0 0 0 0BIS NW XJ CR9 76 0.0 0.0 0.4 1.9 30 143 0 0 0 0 0BIS NW NW E90 100 0.0 0.0 0.0 0.0 0 0 0 0 0 0 0BIS NW 9E CR7 70 0.0 0.0 0.0 0.0 0 0 0 0 0 0 0BIS NW 9E CRJ 50 2.0 1.7 2.6 1.8 131 91 0 0 0 0 0BIS DL DL 320 148 0 0 0 0 0 0 0BIS DL DL D9S 100 1.0 0 0 100 0 0 0 0BIS DL DL 319 124 1.0 1.0 1.0 0 0 0 0 124 124 124BIS DL DL M80 142 0 0 0 0 0 0 0BIS DL M90 150 0.7 1.0 1.0 1.0 1.0 0 0 105 150 150 150 150BIS DL DLX CR9 76 1.5 3.0 2.3 3.0 5.0 0 0 114 228 175 228 380BIS DL DLX CRJ 50 2.5 2.0 1.7 2.0 0 0 125 100 85 100 0BIS DL DL NGA 120 0 0 0 0 0 0 0BIS DL DL 738 160 0 0 0 0 0 0 0BIS SY SY 738 168 0.0 0.0 0.0 0.0 0 0 0 0 0 0 0
Subtotal 5.8 5.7 5.5 5.9 5.7 6.0 6.0 7.0 7.0 476 485 444 478 534 602 654
Bemidji Target Seat Departures (a) 105 113 126 140 155BJI CH CH BEC 8 0.7 0.7 0.7 0.7 0.7 0.7 0.7 0.7 0.7 6 6 6 6 6 6 6BJI NW XJ SF3 33 4.5 3.1 2.7 2.6 89 86 0 0 0 0 0BJI NW XJ CRJ 50 0.0 0.0 0.0 0.2 0 10 0 0 0 0 0BJI NW 9E CRJ 50 0.0 0.3 0.4 0.2 18 10 0 0 0 0 0BJI DL DLX NGT 50 2.0 3.0 0 0 0 0 0 100 150BJI DL DLX CRJ 50 0.5 1.0 0 0 0 25 50 0 0
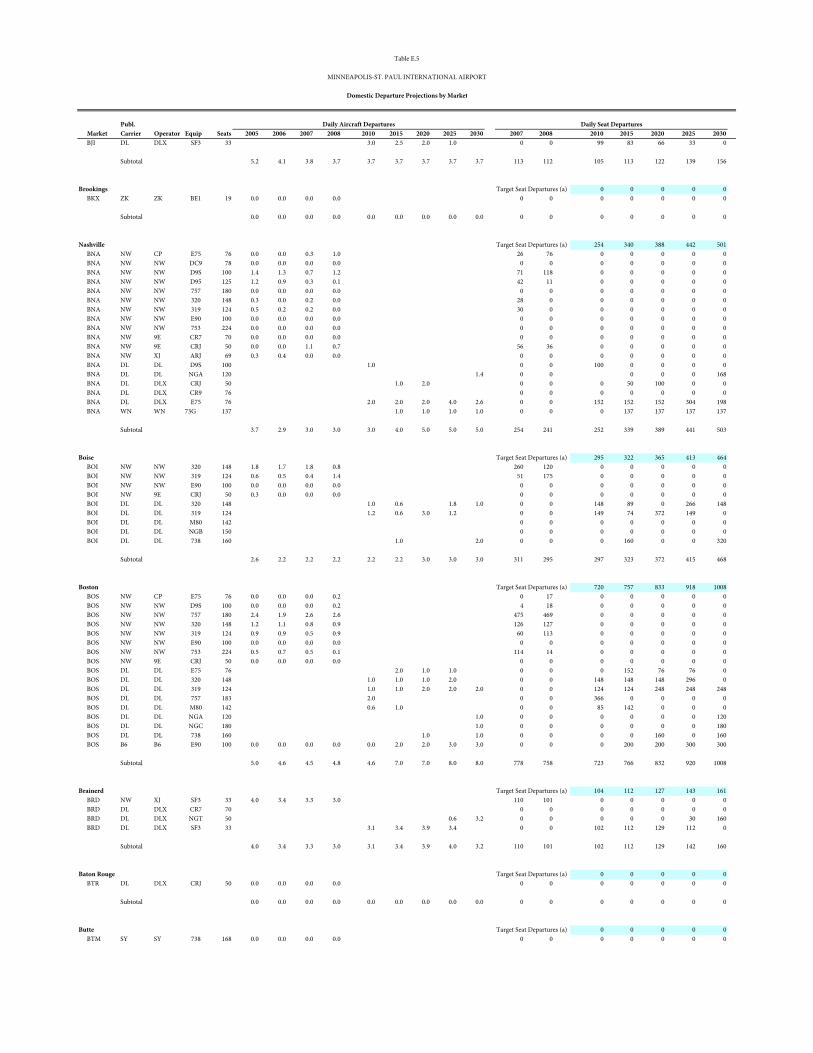
Publ.x Market Carrier Operator Equip Seats 2005 2006 2007 2008 x 2010 2015 2020 2025 2030 x 2007 2008 x 2010 2015 2020 2025 2030
Table E.5
MINNEAPOLIS-ST. PAUL INTERNATIONAL AIRPORT
Domestic Departure Projections by Market
Daily Aircraft Departures Daily Seat Departures
BJI DL DLX SF3 33 3.0 2.5 2.0 1.0 0 0 99 83 66 33 0
Subtotal 5.2 4.1 3.8 3.7 3.7 3.7 3.7 3.7 3.7 113 112 105 113 122 139 156
Brookings Target Seat Departures (a) 0 0 0 0 0BKX ZK ZK BE1 19 0.0 0.0 0.0 0.0 0 0 0 0 0 0 0
Subtotal 0.0 0.0 0.0 0.0 0.0 0.0 0.0 0.0 0.0 0 0 0 0 0 0 0
Nashville Target Seat Departures (a) 254 340 388 442 501BNA NW CP E75 76 0.0 0.0 0.3 1.0 26 76 0 0 0 0 0BNA NW NW DC9 78 0.0 0.0 0.0 0.0 0 0 0 0 0 0 0BNA NW NW D9S 100 1.4 1.3 0.7 1.2 71 118 0 0 0 0 0BNA NW NW D95 125 1.2 0.9 0.3 0.1 42 11 0 0 0 0 0BNA NW NW 757 180 0.0 0.0 0.0 0.0 0 0 0 0 0 0 0BNA NW NW 320 148 0.3 0.0 0.2 0.0 28 0 0 0 0 0 0BNA NW NW 319 124 0.5 0.2 0.2 0.0 30 0 0 0 0 0 0BNA NW NW E90 100 0.0 0.0 0.0 0.0 0 0 0 0 0 0 0BNA NW NW 753 224 0.0 0.0 0.0 0.0 0 0 0 0 0 0 0BNA NW 9E CR7 70 0.0 0.0 0.0 0.0 0 0 0 0 0 0 0BNA NW 9E CRJ 50 0.0 0.0 1.1 0.7 56 36 0 0 0 0 0BNA NW XJ ARJ 69 0.3 0.4 0.0 0.0 0 0 0 0 0 0 0BNA DL DL D9S 100 1.0 0 0 100 0 0 0 0BNA DL DL NGA 120 1.4 0 0 0 0 0 168BNA DL DLX CRJ 50 1.0 2.0 0 0 0 50 100 0 0BNA DL DLX CR9 76 0 0 0 0 0 0 0BNA DL DLX E75 76 2.0 2.0 2.0 4.0 2.6 0 0 152 152 152 304 198BNA WN WN 73G 137 1.0 1.0 1.0 1.0 0 0 0 137 137 137 137
Subtotal 3.7 2.9 3.0 3.0 3.0 4.0 5.0 5.0 5.0 254 241 252 339 389 441 503
Boise Target Seat Departures (a) 295 322 365 413 464BOI NW NW 320 148 1.8 1.7 1.8 0.8 260 120 0 0 0 0 0BOI NW NW 319 124 0.6 0.5 0.4 1.4 51 175 0 0 0 0 0BOI NW NW E90 100 0.0 0.0 0.0 0.0 0 0 0 0 0 0 0BOI NW 9E CRJ 50 0.3 0.0 0.0 0.0 0 0 0 0 0 0 0BOI DL DL 320 148 1.0 0.6 1.8 1.0 0 0 148 89 0 266 148BOI DL DL 319 124 1.2 0.6 3.0 1.2 0 0 149 74 372 149 0BOI DL DL M80 142 0 0 0 0 0 0 0BOI DL DL NGB 150 0 0 0 0 0 0 0BOI DL DL 738 160 1.0 2.0 0 0 0 160 0 0 320
Subtotal 2.6 2.2 2.2 2.2 2.2 2.2 3.0 3.0 3.0 311 295 297 323 372 415 468
Boston Target Seat Departures (a) 720 757 833 918 1008BOS NW CP E75 76 0.0 0.0 0.0 0.2 0 17 0 0 0 0 0BOS NW NW D9S 100 0.0 0.0 0.0 0.2 4 18 0 0 0 0 0BOS NW NW 757 180 2.4 1.9 2.6 2.6 475 469 0 0 0 0 0BOS NW NW 320 148 1.2 1.1 0.8 0.9 126 127 0 0 0 0 0BOS NW NW 319 124 0.9 0.9 0.5 0.9 60 113 0 0 0 0 0BOS NW NW E90 100 0.0 0.0 0.0 0.0 0 0 0 0 0 0 0BOS NW NW 753 224 0.5 0.7 0.5 0.1 114 14 0 0 0 0 0BOS NW 9E CRJ 50 0.0 0.0 0.0 0.0 0 0 0 0 0 0 0BOS DL DL E75 76 2.0 1.0 1.0 0 0 0 152 76 76 0BOS DL DL 320 148 1.0 1.0 1.0 2.0 0 0 148 148 148 296 0BOS DL DL 319 124 1.0 1.0 2.0 2.0 2.0 0 0 124 124 248 248 248BOS DL DL 757 183 2.0 0 0 366 0 0 0 0BOS DL DL M80 142 0.6 1.0 0 0 85 142 0 0 0BOS DL DL NGA 120 1.0 0 0 0 0 0 0 120BOS DL DL NGC 180 1.0 0 0 0 0 0 0 180BOS DL DL 738 160 1.0 1.0 0 0 0 0 160 0 160BOS B6 B6 E90 100 0.0 0.0 0.0 0.0 0.0 2.0 2.0 3.0 3.0 0 0 0 200 200 300 300
Subtotal 5.0 4.6 4.5 4.8 4.6 7.0 7.0 8.0 8.0 778 758 723 766 832 920 1008
Brainerd Target Seat Departures (a) 104 112 127 143 161BRD NW XJ SF3 33 4.0 3.4 3.3 3.0 110 101 0 0 0 0 0BRD DL DLX CR7 70 0 0 0 0 0 0 0BRD DL DLX NGT 50 0.6 3.2 0 0 0 0 0 30 160BRD DL DLX SF3 33 3.1 3.4 3.9 3.4 0 0 102 112 129 112 0
Subtotal 4.0 3.4 3.3 3.0 3.1 3.4 3.9 4.0 3.2 110 101 102 112 129 142 160
Baton Rouge Target Seat Departures (a) 0 0 0 0 0BTR DL DLX CRJ 50 0.0 0.0 0.0 0.0 0 0 0 0 0 0 0
Subtotal 0.0 0.0 0.0 0.0 0.0 0.0 0.0 0.0 0.0 0 0 0 0 0 0 0
Butte Target Seat Departures (a) 0 0 0 0 0BTM SY SY 738 168 0.0 0.0 0.0 0.0 0 0 0 0 0 0 0
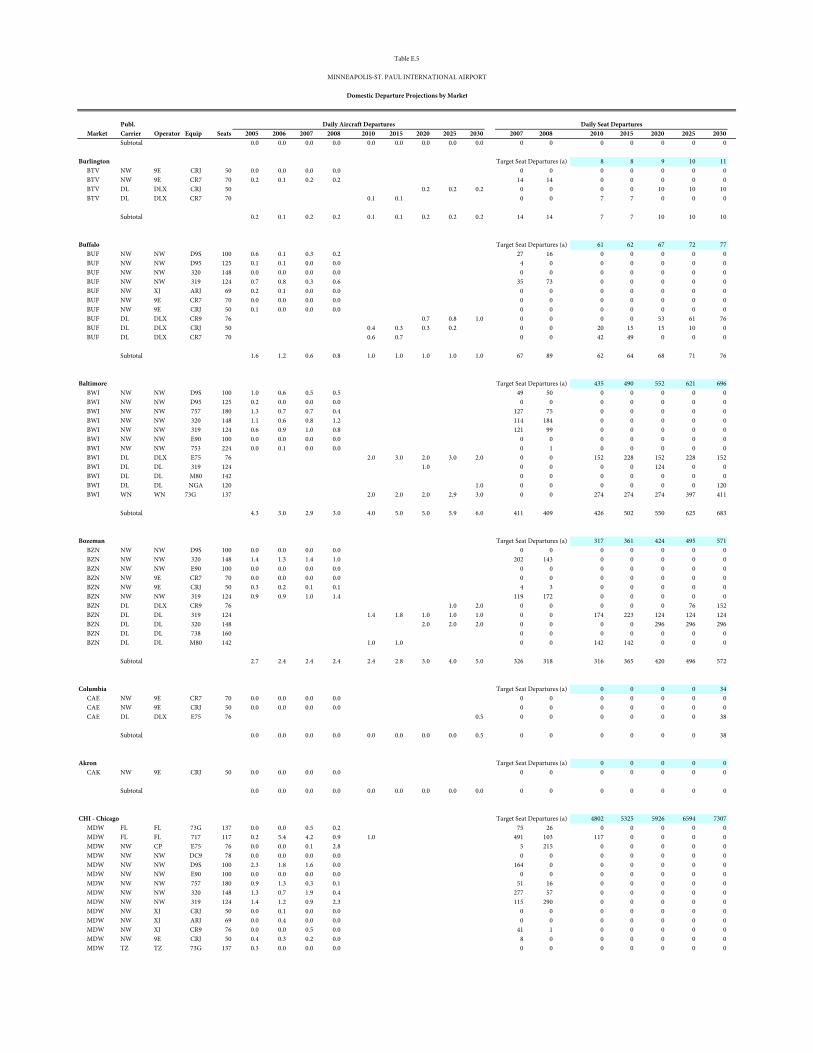
Publ.x Market Carrier Operator Equip Seats 2005 2006 2007 2008 x 2010 2015 2020 2025 2030 x 2007 2008 x 2010 2015 2020 2025 2030
Table E.5
MINNEAPOLIS-ST. PAUL INTERNATIONAL AIRPORT
Domestic Departure Projections by Market
Daily Aircraft Departures Daily Seat Departures
Subtotal 0.0 0.0 0.0 0.0 0.0 0.0 0.0 0.0 0.0 0 0 0 0 0 0 0
Burlington Target Seat Departures (a) 8 8 9 10 11BTV NW 9E CRJ 50 0.0 0.0 0.0 0.0 0 0 0 0 0 0 0BTV NW 9E CR7 70 0.2 0.1 0.2 0.2 14 14 0 0 0 0 0BTV DL DLX CRJ 50 0.2 0.2 0.2 0 0 0 0 10 10 10BTV DL DLX CR7 70 0.1 0.1 0 0 7 7 0 0 0
Subtotal 0.2 0.1 0.2 0.2 0.1 0.1 0.2 0.2 0.2 14 14 7 7 10 10 10
Buffalo Target Seat Departures (a) 61 62 67 72 77BUF NW NW D9S 100 0.6 0.1 0.3 0.2 27 16 0 0 0 0 0BUF NW NW D95 125 0.1 0.1 0.0 0.0 4 0 0 0 0 0 0BUF NW NW 320 148 0.0 0.0 0.0 0.0 0 0 0 0 0 0 0BUF NW NW 319 124 0.7 0.8 0.3 0.6 35 73 0 0 0 0 0BUF NW XJ ARJ 69 0.2 0.1 0.0 0.0 0 0 0 0 0 0 0BUF NW 9E CR7 70 0.0 0.0 0.0 0.0 0 0 0 0 0 0 0BUF NW 9E CRJ 50 0.1 0.0 0.0 0.0 0 0 0 0 0 0 0BUF DL DLX CR9 76 0.7 0.8 1.0 0 0 0 0 53 61 76BUF DL DLX CRJ 50 0.4 0.3 0.3 0.2 0 0 20 15 15 10 0BUF DL DLX CR7 70 0.6 0.7 0 0 42 49 0 0 0
Subtotal 1.6 1.2 0.6 0.8 1.0 1.0 1.0 1.0 1.0 67 89 62 64 68 71 76
Baltimore Target Seat Departures (a) 435 490 552 621 696BWI NW NW D9S 100 1.0 0.6 0.5 0.5 49 50 0 0 0 0 0BWI NW NW D95 125 0.2 0.0 0.0 0.0 0 0 0 0 0 0 0BWI NW NW 757 180 1.3 0.7 0.7 0.4 127 75 0 0 0 0 0BWI NW NW 320 148 1.1 0.6 0.8 1.2 114 184 0 0 0 0 0BWI NW NW 319 124 0.6 0.9 1.0 0.8 121 99 0 0 0 0 0BWI NW NW E90 100 0.0 0.0 0.0 0.0 0 0 0 0 0 0 0BWI NW NW 753 224 0.0 0.1 0.0 0.0 0 1 0 0 0 0 0BWI DL DLX E75 76 2.0 3.0 2.0 3.0 2.0 0 0 152 228 152 228 152BWI DL DL 319 124 1.0 0 0 0 0 124 0 0BWI DL DL M80 142 0 0 0 0 0 0 0BWI DL DL NGA 120 1.0 0 0 0 0 0 0 120BWI WN WN 73G 137 2.0 2.0 2.0 2.9 3.0 0 0 274 274 274 397 411
Subtotal 4.3 3.0 2.9 3.0 4.0 5.0 5.0 5.9 6.0 411 409 426 502 550 625 683
Bozeman Target Seat Departures (a) 317 361 424 495 571BZN NW NW D9S 100 0.0 0.0 0.0 0.0 0 0 0 0 0 0 0BZN NW NW 320 148 1.4 1.3 1.4 1.0 202 143 0 0 0 0 0BZN NW NW E90 100 0.0 0.0 0.0 0.0 0 0 0 0 0 0 0BZN NW 9E CR7 70 0.0 0.0 0.0 0.0 0 0 0 0 0 0 0BZN NW 9E CRJ 50 0.3 0.2 0.1 0.1 4 3 0 0 0 0 0BZN NW NW 319 124 0.9 0.9 1.0 1.4 119 172 0 0 0 0 0BZN DL DLX CR9 76 1.0 2.0 0 0 0 0 0 76 152BZN DL DL 319 124 1.4 1.8 1.0 1.0 1.0 0 0 174 223 124 124 124BZN DL DL 320 148 2.0 2.0 2.0 0 0 0 0 296 296 296BZN DL DL 738 160 0 0 0 0 0 0 0BZN DL DL M80 142 1.0 1.0 0 0 142 142 0 0 0
Subtotal 2.7 2.4 2.4 2.4 2.4 2.8 3.0 4.0 5.0 326 318 316 365 420 496 572
Columbia Target Seat Departures (a) 0 0 0 0 34CAE NW 9E CR7 70 0.0 0.0 0.0 0.0 0 0 0 0 0 0 0CAE NW 9E CRJ 50 0.0 0.0 0.0 0.0 0 0 0 0 0 0 0CAE DL DLX E75 76 0.5 0 0 0 0 0 0 38
Subtotal 0.0 0.0 0.0 0.0 0.0 0.0 0.0 0.0 0.5 0 0 0 0 0 0 38
Akron Target Seat Departures (a) 0 0 0 0 0CAK NW 9E CRJ 50 0.0 0.0 0.0 0.0 0 0 0 0 0 0 0
Subtotal 0.0 0.0 0.0 0.0 0.0 0.0 0.0 0.0 0.0 0 0 0 0 0 0 0
CHI - Chicago Target Seat Departures (a) 4802 5325 5926 6594 7307MDW FL FL 73G 137 0.0 0.0 0.5 0.2 75 26 0 0 0 0 0MDW FL FL 717 117 0.2 5.4 4.2 0.9 1.0 491 103 117 0 0 0 0MDW NW CP E75 76 0.0 0.0 0.1 2.8 5 215 0 0 0 0 0MDW NW NW DC9 78 0.0 0.0 0.0 0.0 0 0 0 0 0 0 0MDW NW NW D9S 100 2.3 1.8 1.6 0.0 164 0 0 0 0 0 0MDW NW NW E90 100 0.0 0.0 0.0 0.0 0 0 0 0 0 0 0MDW NW NW 757 180 0.9 1.3 0.3 0.1 51 16 0 0 0 0 0MDW NW NW 320 148 1.3 0.7 1.9 0.4 277 57 0 0 0 0 0MDW NW NW 319 124 1.4 1.2 0.9 2.3 115 290 0 0 0 0 0MDW NW XJ CRJ 50 0.0 0.1 0.0 0.0 0 0 0 0 0 0 0MDW NW XJ ARJ 69 0.0 0.4 0.0 0.0 0 0 0 0 0 0 0MDW NW XJ CR9 76 0.0 0.0 0.5 0.0 41 1 0 0 0 0 0MDW NW 9E CRJ 50 0.4 0.3 0.2 0.0 8 0 0 0 0 0 0MDW TZ TZ 73G 137 0.3 0.0 0.0 0.0 0 0 0 0 0 0 0
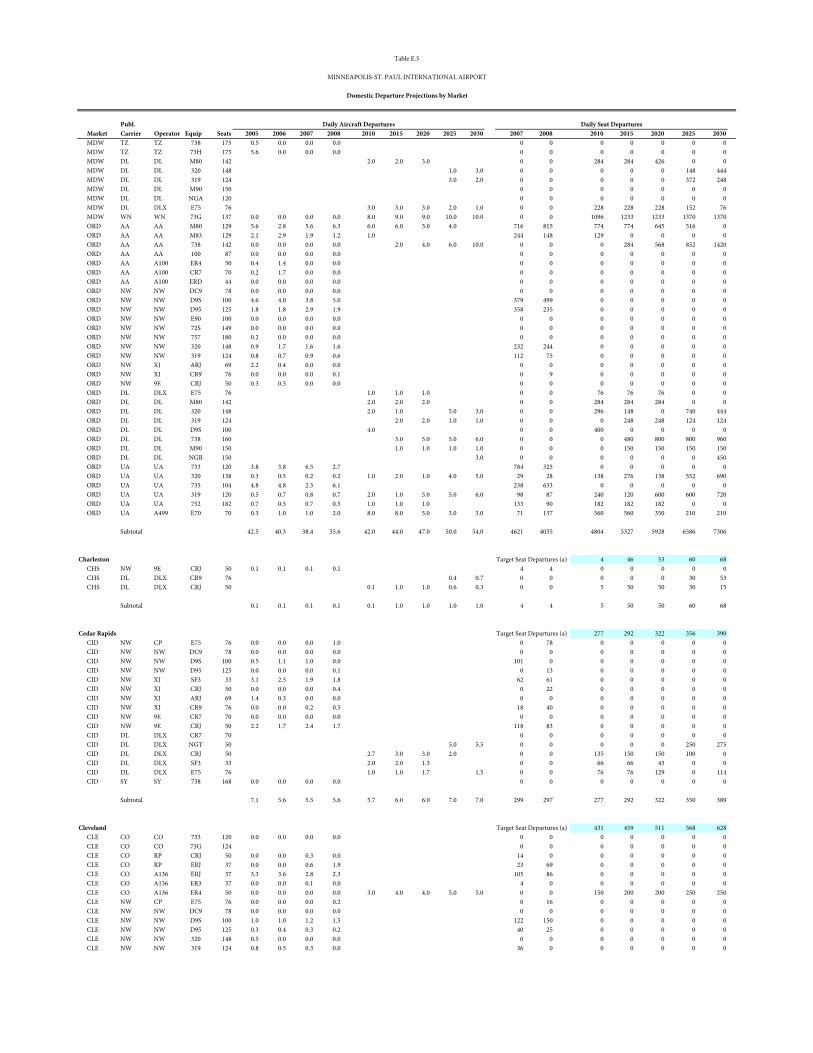
Publ.x Market Carrier Operator Equip Seats 2005 2006 2007 2008 x 2010 2015 2020 2025 2030 x 2007 2008 x 2010 2015 2020 2025 2030
Table E.5
MINNEAPOLIS-ST. PAUL INTERNATIONAL AIRPORT
Domestic Departure Projections by Market
Daily Aircraft Departures Daily Seat Departures
MDW TZ TZ 738 175 0.5 0.0 0.0 0.0 0 0 0 0 0 0 0MDW TZ TZ 73H 175 5.6 0.0 0.0 0.0 0 0 0 0 0 0 0MDW DL DL M80 142 2.0 2.0 3.0 0 0 284 284 426 0 0MDW DL DL 320 148 1.0 3.0 0 0 0 0 0 148 444MDW DL DL 319 124 3.0 2.0 0 0 0 0 0 372 248MDW DL DL M90 150 0 0 0 0 0 0 0MDW DL DL NGA 120 0 0 0 0 0 0 0MDW DL DLX E75 76 3.0 3.0 3.0 2.0 1.0 0 0 228 228 228 152 76MDW WN WN 73G 137 0.0 0.0 0.0 0.0 8.0 9.0 9.0 10.0 10.0 0 0 1096 1233 1233 1370 1370ORD AA AA M80 129 5.6 2.8 5.6 6.3 6.0 6.0 5.0 4.0 716 815 774 774 645 516 0ORD AA AA M83 129 2.1 2.9 1.9 1.2 1.0 244 148 129 0 0 0 0ORD AA AA 738 142 0.0 0.0 0.0 0.0 2.0 4.0 6.0 10.0 0 0 0 284 568 852 1420ORD AA AA 100 87 0.0 0.0 0.0 0.0 0 0 0 0 0 0 0ORD AA A100 ER4 50 0.4 1.4 0.0 0.0 0 0 0 0 0 0 0ORD AA A100 CR7 70 0.2 1.7 0.0 0.0 0 0 0 0 0 0 0ORD AA A100 ERD 44 0.0 0.0 0.0 0.0 0 0 0 0 0 0 0ORD NW NW DC9 78 0.0 0.0 0.0 0.0 0 0 0 0 0 0 0ORD NW NW D9S 100 4.6 4.0 3.8 5.0 379 499 0 0 0 0 0ORD NW NW D95 125 1.8 1.8 2.9 1.9 358 235 0 0 0 0 0ORD NW NW E90 100 0.0 0.0 0.0 0.0 0 0 0 0 0 0 0ORD NW NW 72S 149 0.0 0.0 0.0 0.0 0 0 0 0 0 0 0ORD NW NW 757 180 0.2 0.0 0.0 0.0 0 0 0 0 0 0 0ORD NW NW 320 148 0.9 1.7 1.6 1.6 232 244 0 0 0 0 0ORD NW NW 319 124 0.8 0.7 0.9 0.6 112 75 0 0 0 0 0ORD NW XJ ARJ 69 2.2 0.4 0.0 0.0 0 0 0 0 0 0 0ORD NW XJ CR9 76 0.0 0.0 0.0 0.1 0 9 0 0 0 0 0ORD NW 9E CRJ 50 0.3 0.5 0.0 0.0 0 0 0 0 0 0 0ORD DL DLX E75 76 1.0 1.0 1.0 0 0 76 76 76 0 0ORD DL DL M80 142 2.0 2.0 2.0 0 0 284 284 284 0 0ORD DL DL 320 148 2.0 1.0 5.0 3.0 0 0 296 148 0 740 444ORD DL DL 319 124 2.0 2.0 1.0 1.0 0 0 0 248 248 124 124ORD DL DL D9S 100 4.0 0 0 400 0 0 0 0ORD DL DL 738 160 3.0 5.0 5.0 6.0 0 0 0 480 800 800 960ORD DL DL M90 150 1.0 1.0 1.0 1.0 0 0 0 150 150 150 150ORD DL DL NGB 150 3.0 0 0 0 0 0 0 450ORD UA UA 733 120 3.8 3.8 6.5 2.7 784 325 0 0 0 0 0ORD UA UA 320 138 0.3 0.5 0.2 0.2 1.0 2.0 1.0 4.0 5.0 29 28 138 276 138 552 690ORD UA UA 735 104 4.8 4.8 2.3 6.1 238 633 0 0 0 0 0ORD UA UA 319 120 0.5 0.7 0.8 0.7 2.0 1.0 5.0 5.0 6.0 98 87 240 120 600 600 720ORD UA UA 752 182 0.7 0.5 0.7 0.5 1.0 1.0 1.0 133 90 182 182 182 0 0ORD UA A499 E70 70 0.3 1.0 1.0 2.0 8.0 8.0 5.0 3.0 3.0 71 137 560 560 350 210 210
Subtotal 42.5 40.3 38.4 35.6 42.0 44.0 47.0 50.0 54.0 4621 4035 4804 5327 5928 6586 7306
Charleston Target Seat Departures (a) 4 46 53 60 68CHS NW 9E CRJ 50 0.1 0.1 0.1 0.1 4 4 0 0 0 0 0CHS DL DLX CR9 76 0.4 0.7 0 0 0 0 0 30 53CHS DL DLX CRJ 50 0.1 1.0 1.0 0.6 0.3 0 0 5 50 50 30 15
Subtotal 0.1 0.1 0.1 0.1 0.1 1.0 1.0 1.0 1.0 4 4 5 50 50 60 68
Cedar Rapids Target Seat Departures (a) 277 292 322 356 390CID NW CP E75 76 0.0 0.0 0.0 1.0 0 78 0 0 0 0 0CID NW NW DC9 78 0.0 0.0 0.0 0.0 0 0 0 0 0 0 0CID NW NW D9S 100 0.5 1.1 1.0 0.0 101 0 0 0 0 0 0CID NW NW D95 125 0.0 0.0 0.0 0.1 0 13 0 0 0 0 0CID NW XJ SF3 33 3.1 2.5 1.9 1.8 62 61 0 0 0 0 0CID NW XJ CRJ 50 0.0 0.0 0.0 0.4 0 22 0 0 0 0 0CID NW XJ ARJ 69 1.4 0.3 0.0 0.0 0 0 0 0 0 0 0CID NW XJ CR9 76 0.0 0.0 0.2 0.5 18 40 0 0 0 0 0CID NW 9E CR7 70 0.0 0.0 0.0 0.0 0 0 0 0 0 0 0CID NW 9E CRJ 50 2.2 1.7 2.4 1.7 118 83 0 0 0 0 0CID DL DLX CR7 70 0 0 0 0 0 0 0CID DL DLX NGT 50 5.0 5.5 0 0 0 0 0 250 275CID DL DLX CRJ 50 2.7 3.0 3.0 2.0 0 0 135 150 150 100 0CID DL DLX SF3 33 2.0 2.0 1.3 0 0 66 66 43 0 0CID DL DLX E75 76 1.0 1.0 1.7 1.5 0 0 76 76 129 0 114CID SY SY 738 168 0.0 0.0 0.0 0.0 0 0 0 0 0 0 0
Subtotal 7.1 5.6 5.5 5.6 5.7 6.0 6.0 7.0 7.0 299 297 277 292 322 350 389
Cleveland Target Seat Departures (a) 431 459 511 568 628CLE CO CO 733 120 0.0 0.0 0.0 0.0 0 0 0 0 0 0 0CLE CO CO 73G 124 0 0 0 0 0 0 0CLE CO RP CRJ 50 0.0 0.0 0.3 0.0 14 0 0 0 0 0 0CLE CO RP ERJ 37 0.0 0.0 0.6 1.9 23 69 0 0 0 0 0CLE CO A136 ERJ 37 3.3 3.6 2.8 2.3 105 86 0 0 0 0 0CLE CO A136 ER3 37 0.0 0.0 0.1 0.0 4 0 0 0 0 0 0CLE CO A136 ER4 50 0.0 0.0 0.0 0.0 3.0 4.0 4.0 5.0 5.0 0 0 150 200 200 250 250CLE NW CP E75 76 0.0 0.0 0.0 0.2 0 16 0 0 0 0 0CLE NW NW DC9 78 0.0 0.0 0.0 0.0 0 0 0 0 0 0 0CLE NW NW D9S 100 1.0 1.0 1.2 1.5 122 150 0 0 0 0 0CLE NW NW D95 125 0.3 0.4 0.3 0.2 40 25 0 0 0 0 0CLE NW NW 320 148 0.5 0.0 0.0 0.0 0 0 0 0 0 0 0CLE NW NW 319 124 0.8 0.5 0.3 0.0 36 0 0 0 0 0 0
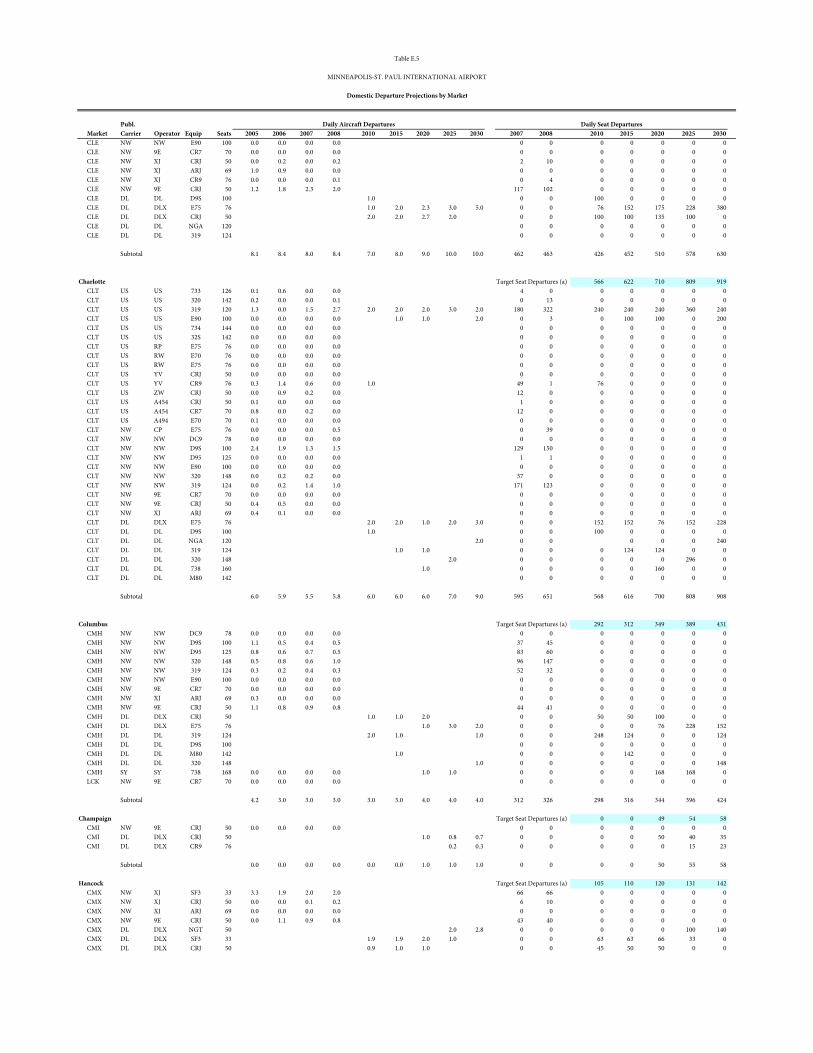
Publ.x Market Carrier Operator Equip Seats 2005 2006 2007 2008 x 2010 2015 2020 2025 2030 x 2007 2008 x 2010 2015 2020 2025 2030
Table E.5
MINNEAPOLIS-ST. PAUL INTERNATIONAL AIRPORT
Domestic Departure Projections by Market
Daily Aircraft Departures Daily Seat Departures
CLE NW NW E90 100 0.0 0.0 0.0 0.0 0 0 0 0 0 0 0CLE NW 9E CR7 70 0.0 0.0 0.0 0.0 0 0 0 0 0 0 0CLE NW XJ CRJ 50 0.0 0.2 0.0 0.2 2 10 0 0 0 0 0CLE NW XJ ARJ 69 1.0 0.9 0.0 0.0 0 0 0 0 0 0 0CLE NW XJ CR9 76 0.0 0.0 0.0 0.1 0 4 0 0 0 0 0CLE NW 9E CRJ 50 1.2 1.8 2.3 2.0 117 102 0 0 0 0 0CLE DL DL D9S 100 1.0 0 0 100 0 0 0 0CLE DL DLX E75 76 1.0 2.0 2.3 3.0 5.0 0 0 76 152 175 228 380CLE DL DLX CRJ 50 2.0 2.0 2.7 2.0 0 0 100 100 135 100 0CLE DL DL NGA 120 0 0 0 0 0 0 0CLE DL DL 319 124 0 0 0 0 0 0 0
Subtotal 8.1 8.4 8.0 8.4 7.0 8.0 9.0 10.0 10.0 462 463 426 452 510 578 630
Charlotte Target Seat Departures (a) 566 622 710 809 919CLT US US 733 126 0.1 0.6 0.0 0.0 4 0 0 0 0 0 0CLT US US 320 142 0.2 0.0 0.0 0.1 0 13 0 0 0 0 0CLT US US 319 120 1.3 0.0 1.5 2.7 2.0 2.0 2.0 3.0 2.0 180 322 240 240 240 360 240CLT US US E90 100 0.0 0.0 0.0 0.0 1.0 1.0 2.0 0 3 0 100 100 0 200CLT US US 734 144 0.0 0.0 0.0 0.0 0 0 0 0 0 0 0CLT US US 32S 142 0.0 0.0 0.0 0.0 0 0 0 0 0 0 0CLT US RP E75 76 0.0 0.0 0.0 0.0 0 0 0 0 0 0 0CLT US RW E70 76 0.0 0.0 0.0 0.0 0 0 0 0 0 0 0CLT US RW E75 76 0.0 0.0 0.0 0.0 0 0 0 0 0 0 0CLT US YV CRJ 50 0.0 0.0 0.0 0.0 0 0 0 0 0 0 0CLT US YV CR9 76 0.3 1.4 0.6 0.0 1.0 49 1 76 0 0 0 0CLT US ZW CRJ 50 0.0 0.9 0.2 0.0 12 0 0 0 0 0 0CLT US A454 CRJ 50 0.1 0.0 0.0 0.0 1 0 0 0 0 0 0CLT US A454 CR7 70 0.8 0.0 0.2 0.0 12 0 0 0 0 0 0CLT US A494 E70 70 0.1 0.0 0.0 0.0 0 0 0 0 0 0 0CLT NW CP E75 76 0.0 0.0 0.0 0.5 0 39 0 0 0 0 0CLT NW NW DC9 78 0.0 0.0 0.0 0.0 0 0 0 0 0 0 0CLT NW NW D9S 100 2.4 1.9 1.3 1.5 129 150 0 0 0 0 0CLT NW NW D95 125 0.0 0.0 0.0 0.0 1 1 0 0 0 0 0CLT NW NW E90 100 0.0 0.0 0.0 0.0 0 0 0 0 0 0 0CLT NW NW 320 148 0.0 0.2 0.2 0.0 37 0 0 0 0 0 0CLT NW NW 319 124 0.0 0.2 1.4 1.0 171 123 0 0 0 0 0CLT NW 9E CR7 70 0.0 0.0 0.0 0.0 0 0 0 0 0 0 0CLT NW 9E CRJ 50 0.4 0.5 0.0 0.0 0 0 0 0 0 0 0CLT NW XJ ARJ 69 0.4 0.1 0.0 0.0 0 0 0 0 0 0 0CLT DL DLX E75 76 2.0 2.0 1.0 2.0 3.0 0 0 152 152 76 152 228CLT DL DL D9S 100 1.0 0 0 100 0 0 0 0CLT DL DL NGA 120 2.0 0 0 0 0 0 240CLT DL DL 319 124 1.0 1.0 0 0 0 124 124 0 0CLT DL DL 320 148 2.0 0 0 0 0 0 296 0CLT DL DL 738 160 1.0 0 0 0 0 160 0 0CLT DL DL M80 142 0 0 0 0 0 0 0
Subtotal 6.0 5.9 5.5 5.8 6.0 6.0 6.0 7.0 9.0 595 651 568 616 700 808 908
Columbus Target Seat Departures (a) 292 312 349 389 431CMH NW NW DC9 78 0.0 0.0 0.0 0.0 0 0 0 0 0 0 0CMH NW NW D9S 100 1.1 0.5 0.4 0.5 37 45 0 0 0 0 0CMH NW NW D95 125 0.8 0.6 0.7 0.5 83 60 0 0 0 0 0CMH NW NW 320 148 0.5 0.8 0.6 1.0 96 147 0 0 0 0 0CMH NW NW 319 124 0.3 0.2 0.4 0.3 52 32 0 0 0 0 0CMH NW NW E90 100 0.0 0.0 0.0 0.0 0 0 0 0 0 0 0CMH NW 9E CR7 70 0.0 0.0 0.0 0.0 0 0 0 0 0 0 0CMH NW XJ ARJ 69 0.3 0.0 0.0 0.0 0 0 0 0 0 0 0CMH NW 9E CRJ 50 1.1 0.8 0.9 0.8 44 41 0 0 0 0 0CMH DL DLX CRJ 50 1.0 1.0 2.0 0 0 50 50 100 0 0CMH DL DLX E75 76 1.0 3.0 2.0 0 0 0 0 76 228 152CMH DL DL 319 124 2.0 1.0 1.0 0 0 248 124 0 0 124CMH DL DL D9S 100 0 0 0 0 0 0 0CMH DL DL M80 142 1.0 0 0 0 142 0 0 0CMH DL DL 320 148 1.0 0 0 0 0 0 0 148CMH SY SY 738 168 0.0 0.0 0.0 0.0 1.0 1.0 0 0 0 0 168 168 0LCK NW 9E CR7 70 0.0 0.0 0.0 0.0 0 0 0 0 0 0 0
Subtotal 4.2 3.0 3.0 3.0 3.0 3.0 4.0 4.0 4.0 312 326 298 316 344 396 424
Champaign Target Seat Departures (a) 0 0 49 54 58CMI NW 9E CRJ 50 0.0 0.0 0.0 0.0 0 0 0 0 0 0 0CMI DL DLX CRJ 50 1.0 0.8 0.7 0 0 0 0 50 40 35CMI DL DLX CR9 76 0.2 0.3 0 0 0 0 0 15 23
Subtotal 0.0 0.0 0.0 0.0 0.0 0.0 1.0 1.0 1.0 0 0 0 0 50 55 58
Hancock Target Seat Departures (a) 105 110 120 131 142CMX NW XJ SF3 33 3.3 1.9 2.0 2.0 66 66 0 0 0 0 0CMX NW XJ CRJ 50 0.0 0.0 0.1 0.2 6 10 0 0 0 0 0CMX NW XJ ARJ 69 0.0 0.0 0.0 0.0 0 0 0 0 0 0 0CMX NW 9E CRJ 50 0.0 1.1 0.9 0.8 43 40 0 0 0 0 0CMX DL DLX NGT 50 2.0 2.8 0 0 0 0 0 100 140CMX DL DLX SF3 33 1.9 1.9 2.0 1.0 0 0 63 63 66 33 0CMX DL DLX CRJ 50 0.9 1.0 1.0 0 0 45 50 50 0 0
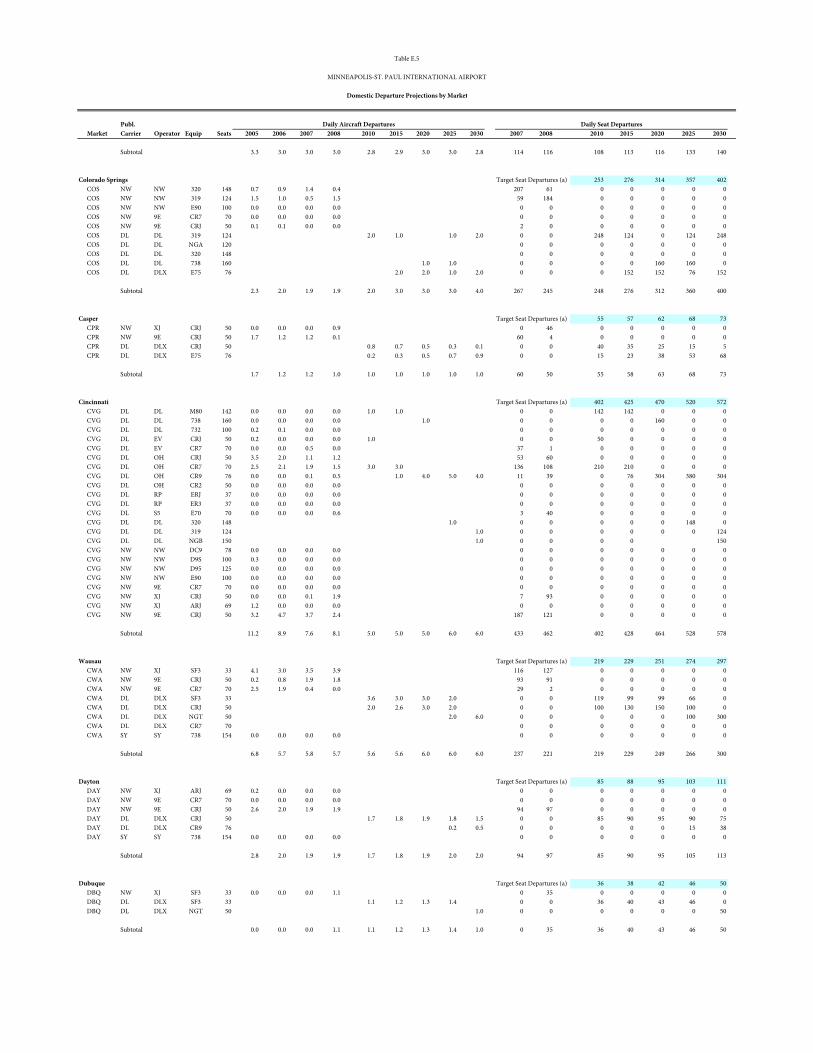
Publ.x Market Carrier Operator Equip Seats 2005 2006 2007 2008 x 2010 2015 2020 2025 2030 x 2007 2008 x 2010 2015 2020 2025 2030
Table E.5
MINNEAPOLIS-ST. PAUL INTERNATIONAL AIRPORT
Domestic Departure Projections by Market
Daily Aircraft Departures Daily Seat Departures
Subtotal 3.3 3.0 3.0 3.0 2.8 2.9 3.0 3.0 2.8 114 116 108 113 116 133 140
Colorado Springs Target Seat Departures (a) 253 276 314 357 402COS NW NW 320 148 0.7 0.9 1.4 0.4 207 61 0 0 0 0 0COS NW NW 319 124 1.5 1.0 0.5 1.5 59 184 0 0 0 0 0COS NW NW E90 100 0.0 0.0 0.0 0.0 0 0 0 0 0 0 0COS NW 9E CR7 70 0.0 0.0 0.0 0.0 0 0 0 0 0 0 0COS NW 9E CRJ 50 0.1 0.1 0.0 0.0 2 0 0 0 0 0 0COS DL DL 319 124 2.0 1.0 1.0 2.0 0 0 248 124 0 124 248COS DL DL NGA 120 0 0 0 0 0 0 0COS DL DL 320 148 0 0 0 0 0 0 0COS DL DL 738 160 1.0 1.0 0 0 0 0 160 160 0COS DL DLX E75 76 2.0 2.0 1.0 2.0 0 0 0 152 152 76 152
Subtotal 2.3 2.0 1.9 1.9 2.0 3.0 3.0 3.0 4.0 267 245 248 276 312 360 400
Casper Target Seat Departures (a) 55 57 62 68 73CPR NW XJ CRJ 50 0.0 0.0 0.0 0.9 0 46 0 0 0 0 0CPR NW 9E CRJ 50 1.7 1.2 1.2 0.1 60 4 0 0 0 0 0CPR DL DLX CRJ 50 0.8 0.7 0.5 0.3 0.1 0 0 40 35 25 15 5CPR DL DLX E75 76 0.2 0.3 0.5 0.7 0.9 0 0 15 23 38 53 68
Subtotal 1.7 1.2 1.2 1.0 1.0 1.0 1.0 1.0 1.0 60 50 55 58 63 68 73
Cincinnati Target Seat Departures (a) 402 425 470 520 572CVG DL DL M80 142 0.0 0.0 0.0 0.0 1.0 1.0 0 0 142 142 0 0 0CVG DL DL 738 160 0.0 0.0 0.0 0.0 1.0 0 0 0 0 160 0 0CVG DL DL 732 100 0.2 0.1 0.0 0.0 0 0 0 0 0 0 0CVG DL EV CRJ 50 0.2 0.0 0.0 0.0 1.0 0 0 50 0 0 0 0CVG DL EV CR7 70 0.0 0.0 0.5 0.0 37 1 0 0 0 0 0CVG DL OH CRJ 50 3.5 2.0 1.1 1.2 53 60 0 0 0 0 0CVG DL OH CR7 70 2.5 2.1 1.9 1.5 3.0 3.0 136 108 210 210 0 0 0CVG DL OH CR9 76 0.0 0.0 0.1 0.5 1.0 4.0 5.0 4.0 11 39 0 76 304 380 304CVG DL OH CR2 50 0.0 0.0 0.0 0.0 0 0 0 0 0 0 0CVG DL RP ERJ 37 0.0 0.0 0.0 0.0 0 0 0 0 0 0 0CVG DL RP ER3 37 0.0 0.0 0.0 0.0 0 0 0 0 0 0 0CVG DL S5 E70 70 0.0 0.0 0.0 0.6 3 40 0 0 0 0 0CVG DL DL 320 148 1.0 0 0 0 0 0 148 0CVG DL DL 319 124 1.0 0 0 0 0 0 0 124CVG DL DL NGB 150 1.0 0 0 0 0 150CVG NW NW DC9 78 0.0 0.0 0.0 0.0 0 0 0 0 0 0 0CVG NW NW D9S 100 0.3 0.0 0.0 0.0 0 0 0 0 0 0 0CVG NW NW D95 125 0.0 0.0 0.0 0.0 0 0 0 0 0 0 0CVG NW NW E90 100 0.0 0.0 0.0 0.0 0 0 0 0 0 0 0CVG NW 9E CR7 70 0.0 0.0 0.0 0.0 0 0 0 0 0 0 0CVG NW XJ CRJ 50 0.0 0.0 0.1 1.9 7 93 0 0 0 0 0CVG NW XJ ARJ 69 1.2 0.0 0.0 0.0 0 0 0 0 0 0 0CVG NW 9E CRJ 50 3.2 4.7 3.7 2.4 187 121 0 0 0 0 0
Subtotal 11.2 8.9 7.6 8.1 5.0 5.0 5.0 6.0 6.0 433 462 402 428 464 528 578
Wausau Target Seat Departures (a) 219 229 251 274 297CWA NW XJ SF3 33 4.1 3.0 3.5 3.9 116 127 0 0 0 0 0CWA NW 9E CRJ 50 0.2 0.8 1.9 1.8 93 91 0 0 0 0 0CWA NW 9E CR7 70 2.5 1.9 0.4 0.0 29 2 0 0 0 0 0CWA DL DLX SF3 33 3.6 3.0 3.0 2.0 0 0 119 99 99 66 0CWA DL DLX CRJ 50 2.0 2.6 3.0 2.0 0 0 100 130 150 100 0CWA DL DLX NGT 50 2.0 6.0 0 0 0 0 0 100 300CWA DL DLX CR7 70 0 0 0 0 0 0 0CWA SY SY 738 154 0.0 0.0 0.0 0.0 0 0 0 0 0 0 0
Subtotal 6.8 5.7 5.8 5.7 5.6 5.6 6.0 6.0 6.0 237 221 219 229 249 266 300
Dayton Target Seat Departures (a) 85 88 95 103 111DAY NW XJ ARJ 69 0.2 0.0 0.0 0.0 0 0 0 0 0 0 0DAY NW 9E CR7 70 0.0 0.0 0.0 0.0 0 0 0 0 0 0 0DAY NW 9E CRJ 50 2.6 2.0 1.9 1.9 94 97 0 0 0 0 0DAY DL DLX CRJ 50 1.7 1.8 1.9 1.8 1.5 0 0 85 90 95 90 75DAY DL DLX CR9 76 0.2 0.5 0 0 0 0 0 15 38DAY SY SY 738 154 0.0 0.0 0.0 0.0 0 0 0 0 0 0 0
Subtotal 2.8 2.0 1.9 1.9 1.7 1.8 1.9 2.0 2.0 94 97 85 90 95 105 113
Dubuque Target Seat Departures (a) 36 38 42 46 50DBQ NW XJ SF3 33 0.0 0.0 0.0 1.1 0 35 0 0 0 0 0DBQ DL DLX SF3 33 1.1 1.2 1.3 1.4 0 0 36 40 43 46 0DBQ DL DLX NGT 50 1.0 0 0 0 0 0 0 50
Subtotal 0.0 0.0 0.0 1.1 1.1 1.2 1.3 1.4 1.0 0 35 36 40 43 46 50
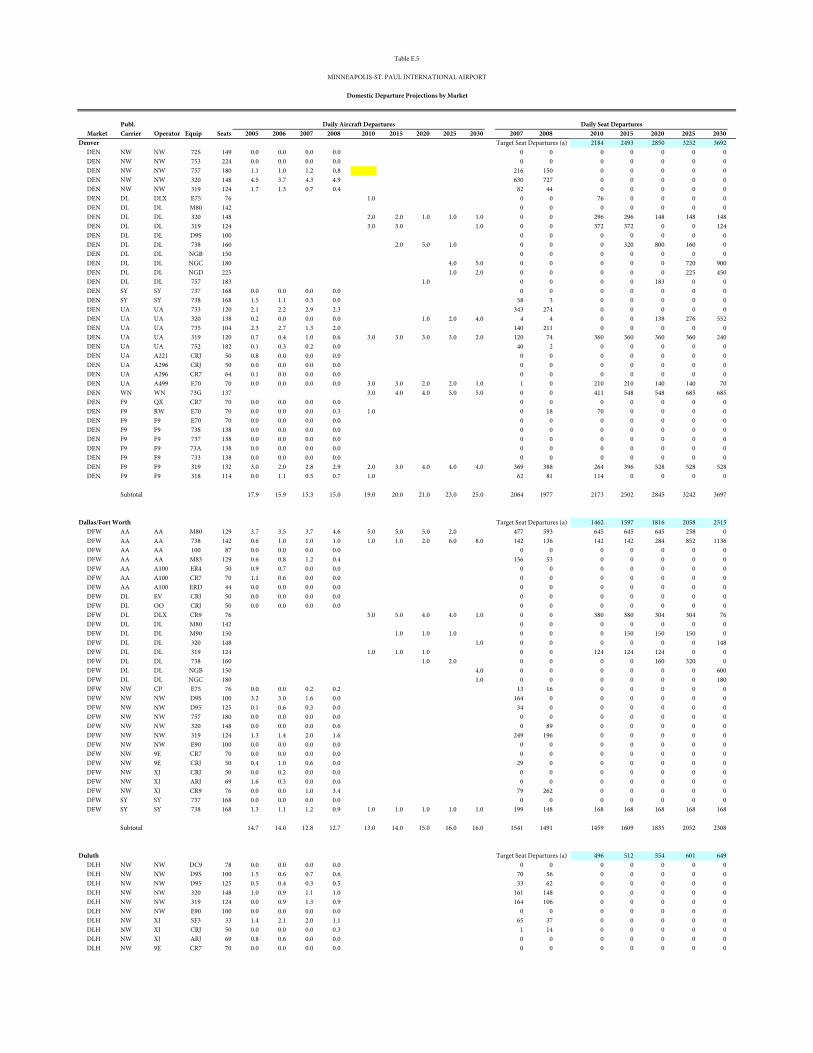
Publ.x Market Carrier Operator Equip Seats 2005 2006 2007 2008 x 2010 2015 2020 2025 2030 x 2007 2008 x 2010 2015 2020 2025 2030
Table E.5
MINNEAPOLIS-ST. PAUL INTERNATIONAL AIRPORT
Domestic Departure Projections by Market
Daily Aircraft Departures Daily Seat Departures
Denver Target Seat Departures (a) 2184 2493 2850 3252 3692DEN NW NW 72S 149 0.0 0.0 0.0 0.0 0 0 0 0 0 0 0DEN NW NW 753 224 0.0 0.0 0.0 0.0 0 0 0 0 0 0 0DEN NW NW 757 180 1.1 1.0 1.2 0.8 216 150 0 0 0 0 0DEN NW NW 320 148 4.5 3.7 4.3 4.9 630 727 0 0 0 0 0DEN NW NW 319 124 1.7 1.3 0.7 0.4 82 44 0 0 0 0 0DEN DL DLX E75 76 1.0 0 0 76 0 0 0 0DEN DL DL M80 142 0 0 0 0 0 0 0DEN DL DL 320 148 2.0 2.0 1.0 1.0 1.0 0 0 296 296 148 148 148DEN DL DL 319 124 3.0 3.0 1.0 0 0 372 372 0 0 124DEN DL DL D9S 100 0 0 0 0 0 0 0DEN DL DL 738 160 2.0 5.0 1.0 0 0 0 320 800 160 0DEN DL DL NGB 150 0 0 0 0 0 0 0DEN DL DL NGC 180 4.0 5.0 0 0 0 0 0 720 900DEN DL DL NGD 225 1.0 2.0 0 0 0 0 0 225 450DEN DL DL 757 183 1.0 0 0 0 0 183 0 0DEN SY SY 737 168 0.0 0.0 0.0 0.0 0 0 0 0 0 0 0DEN SY SY 738 168 1.5 1.1 0.3 0.0 58 3 0 0 0 0 0DEN UA UA 733 120 2.1 2.2 2.9 2.3 343 274 0 0 0 0 0DEN UA UA 320 138 0.2 0.0 0.0 0.0 1.0 2.0 4.0 4 4 0 0 138 276 552DEN UA UA 735 104 2.3 2.7 1.3 2.0 140 211 0 0 0 0 0DEN UA UA 319 120 0.7 0.4 1.0 0.6 3.0 3.0 3.0 3.0 2.0 120 74 360 360 360 360 240DEN UA UA 752 182 0.1 0.3 0.2 0.0 40 2 0 0 0 0 0DEN UA A221 CRJ 50 0.8 0.0 0.0 0.0 0 0 0 0 0 0 0DEN UA A296 CRJ 50 0.0 0.0 0.0 0.0 0 0 0 0 0 0 0DEN UA A296 CR7 64 0.1 0.0 0.0 0.0 0 0 0 0 0 0 0DEN UA A499 E70 70 0.0 0.0 0.0 0.0 3.0 3.0 2.0 2.0 1.0 1 0 210 210 140 140 70DEN WN WN 73G 137 3.0 4.0 4.0 5.0 5.0 0 0 411 548 548 685 685DEN F9 QX CR7 70 0.0 0.0 0.0 0.0 0 0 0 0 0 0 0DEN F9 RW E70 70 0.0 0.0 0.0 0.3 1.0 0 18 70 0 0 0 0DEN F9 F9 E70 70 0.0 0.0 0.0 0.0 0 0 0 0 0 0 0DEN F9 F9 73S 138 0.0 0.0 0.0 0.0 0 0 0 0 0 0 0DEN F9 F9 737 138 0.0 0.0 0.0 0.0 0 0 0 0 0 0 0DEN F9 F9 73A 138 0.0 0.0 0.0 0.0 0 0 0 0 0 0 0DEN F9 F9 733 138 0.0 0.0 0.0 0.0 0 0 0 0 0 0 0DEN F9 F9 319 132 3.0 2.0 2.8 2.9 2.0 3.0 4.0 4.0 4.0 369 388 264 396 528 528 528DEN F9 F9 318 114 0.0 1.1 0.5 0.7 1.0 62 81 114 0 0 0 0
Subtotal 17.9 15.9 15.3 15.0 19.0 20.0 21.0 23.0 25.0 2064 1977 2173 2502 2845 3242 3697
Dallas/Fort Worth Target Seat Departures (a) 1462 1597 1816 2058 2315DFW AA AA M80 129 3.7 3.5 3.7 4.6 5.0 5.0 5.0 2.0 477 593 645 645 645 258 0DFW AA AA 738 142 0.6 1.0 1.0 1.0 1.0 1.0 2.0 6.0 8.0 142 136 142 142 284 852 1136DFW AA AA 100 87 0.0 0.0 0.0 0.0 0 0 0 0 0 0 0DFW AA AA M83 129 0.6 0.8 1.2 0.4 156 53 0 0 0 0 0DFW AA A100 ER4 50 0.9 0.7 0.0 0.0 0 0 0 0 0 0 0DFW AA A100 CR7 70 1.1 0.6 0.0 0.0 0 0 0 0 0 0 0DFW AA A100 ERD 44 0.0 0.0 0.0 0.0 0 0 0 0 0 0 0DFW DL EV CRJ 50 0.0 0.0 0.0 0.0 0 0 0 0 0 0 0DFW DL OO CRJ 50 0.0 0.0 0.0 0.0 0 0 0 0 0 0 0DFW DL DLX CR9 76 5.0 5.0 4.0 4.0 1.0 0 0 380 380 304 304 76DFW DL DL M80 142 0 0 0 0 0 0 0DFW DL DL M90 150 1.0 1.0 1.0 0 0 0 150 150 150 0DFW DL DL 320 148 1.0 0 0 0 0 0 0 148DFW DL DL 319 124 1.0 1.0 1.0 0 0 124 124 124 0 0DFW DL DL 738 160 1.0 2.0 0 0 0 0 160 320 0DFW DL DL NGB 150 4.0 0 0 0 0 0 0 600DFW DL DL NGC 180 1.0 0 0 0 0 0 0 180DFW NW CP E75 76 0.0 0.0 0.2 0.2 13 16 0 0 0 0 0DFW NW NW D9S 100 3.2 3.0 1.6 0.0 164 0 0 0 0 0 0DFW NW NW D95 125 0.1 0.6 0.3 0.0 34 0 0 0 0 0 0DFW NW NW 757 180 0.0 0.0 0.0 0.0 0 0 0 0 0 0 0DFW NW NW 320 148 0.0 0.0 0.0 0.6 0 89 0 0 0 0 0DFW NW NW 319 124 1.3 1.4 2.0 1.6 249 196 0 0 0 0 0DFW NW NW E90 100 0.0 0.0 0.0 0.0 0 0 0 0 0 0 0DFW NW 9E CR7 70 0.0 0.0 0.0 0.0 0 0 0 0 0 0 0DFW NW 9E CRJ 50 0.4 1.0 0.6 0.0 29 0 0 0 0 0 0DFW NW XJ CRJ 50 0.0 0.2 0.0 0.0 0 0 0 0 0 0 0DFW NW XJ ARJ 69 1.6 0.3 0.0 0.0 0 0 0 0 0 0 0DFW NW XJ CR9 76 0.0 0.0 1.0 3.4 79 262 0 0 0 0 0DFW SY SY 737 168 0.0 0.0 0.0 0.0 0 0 0 0 0 0 0DFW SY SY 738 168 1.3 1.1 1.2 0.9 1.0 1.0 1.0 1.0 1.0 199 148 168 168 168 168 168
Subtotal 14.7 14.0 12.8 12.7 13.0 14.0 15.0 16.0 16.0 1541 1491 1459 1609 1835 2052 2308
Duluth Target Seat Departures (a) 496 512 554 601 649DLH NW NW DC9 78 0.0 0.0 0.0 0.0 0 0 0 0 0 0 0DLH NW NW D9S 100 1.5 0.6 0.7 0.6 70 56 0 0 0 0 0DLH NW NW D95 125 0.5 0.4 0.3 0.5 33 62 0 0 0 0 0DLH NW NW 320 148 1.0 0.9 1.1 1.0 161 148 0 0 0 0 0DLH NW NW 319 124 0.0 0.9 1.3 0.9 164 106 0 0 0 0 0DLH NW NW E90 100 0.0 0.0 0.0 0.0 0 0 0 0 0 0 0DLH NW XJ SF3 33 1.4 2.1 2.0 1.1 65 37 0 0 0 0 0DLH NW XJ CRJ 50 0.0 0.0 0.0 0.3 1 14 0 0 0 0 0DLH NW XJ ARJ 69 0.8 0.6 0.0 0.0 0 0 0 0 0 0 0DLH NW 9E CR7 70 0.0 0.0 0.0 0.0 0 0 0 0 0 0 0
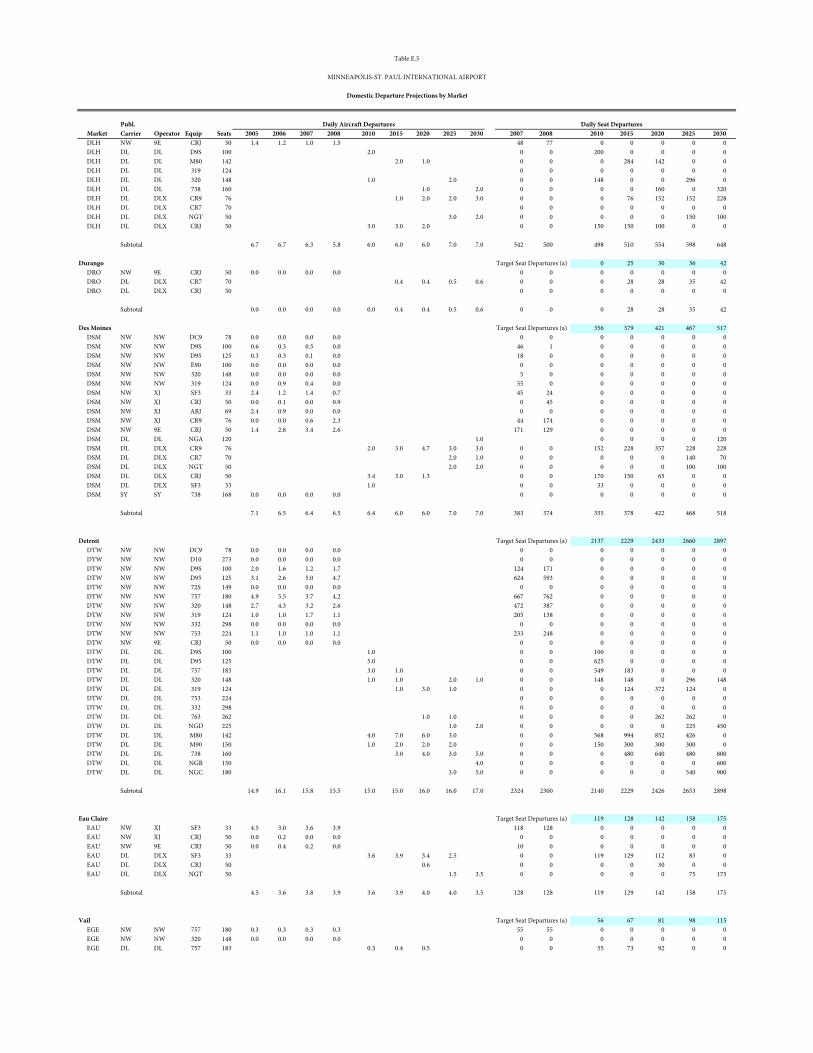
Publ.x Market Carrier Operator Equip Seats 2005 2006 2007 2008 x 2010 2015 2020 2025 2030 x 2007 2008 x 2010 2015 2020 2025 2030
Table E.5
MINNEAPOLIS-ST. PAUL INTERNATIONAL AIRPORT
Domestic Departure Projections by Market
Daily Aircraft Departures Daily Seat Departures
DLH NW 9E CRJ 50 1.4 1.2 1.0 1.5 48 77 0 0 0 0 0DLH DL DL D9S 100 2.0 0 0 200 0 0 0 0DLH DL DL M80 142 2.0 1.0 0 0 0 284 142 0 0DLH DL DL 319 124 0 0 0 0 0 0 0DLH DL DL 320 148 1.0 2.0 0 0 148 0 0 296 0DLH DL DL 738 160 1.0 2.0 0 0 0 0 160 0 320DLH DL DLX CR9 76 1.0 2.0 2.0 3.0 0 0 0 76 152 152 228DLH DL DLX CR7 70 0 0 0 0 0 0 0DLH DL DLX NGT 50 3.0 2.0 0 0 0 0 0 150 100DLH DL DLX CRJ 50 3.0 3.0 2.0 0 0 150 150 100 0 0
Subtotal 6.7 6.7 6.3 5.8 6.0 6.0 6.0 7.0 7.0 542 500 498 510 554 598 648
Durango Target Seat Departures (a) 0 25 30 36 42DRO NW 9E CRJ 50 0.0 0.0 0.0 0.0 0 0 0 0 0 0 0DRO DL DLX CR7 70 0.4 0.4 0.5 0.6 0 0 0 28 28 35 42DRO DL DLX CRJ 50 0 0 0 0 0 0 0
Subtotal 0.0 0.0 0.0 0.0 0.0 0.4 0.4 0.5 0.6 0 0 0 28 28 35 42
Des Moines Target Seat Departures (a) 356 379 421 467 517DSM NW NW DC9 78 0.0 0.0 0.0 0.0 0 0 0 0 0 0 0DSM NW NW D9S 100 0.6 0.3 0.5 0.0 46 1 0 0 0 0 0DSM NW NW D95 125 0.3 0.3 0.1 0.0 18 0 0 0 0 0 0DSM NW NW E90 100 0.0 0.0 0.0 0.0 0 0 0 0 0 0 0DSM NW NW 320 148 0.0 0.0 0.0 0.0 5 0 0 0 0 0 0DSM NW NW 319 124 0.0 0.9 0.4 0.0 55 0 0 0 0 0 0DSM NW XJ SF3 33 2.4 1.2 1.4 0.7 45 24 0 0 0 0 0DSM NW XJ CRJ 50 0.0 0.1 0.0 0.9 0 45 0 0 0 0 0DSM NW XJ ARJ 69 2.4 0.9 0.0 0.0 0 0 0 0 0 0 0DSM NW XJ CR9 76 0.0 0.0 0.6 2.3 44 174 0 0 0 0 0DSM NW 9E CRJ 50 1.4 2.8 3.4 2.6 171 129 0 0 0 0 0DSM DL DL NGA 120 1.0 0 0 0 0 120DSM DL DLX CR9 76 2.0 3.0 4.7 3.0 3.0 0 0 152 228 357 228 228DSM DL DLX CR7 70 2.0 1.0 0 0 0 0 0 140 70DSM DL DLX NGT 50 2.0 2.0 0 0 0 0 0 100 100DSM DL DLX CRJ 50 3.4 3.0 1.3 0 0 170 150 65 0 0DSM DL DLX SF3 33 1.0 0 0 33 0 0 0 0DSM SY SY 738 168 0.0 0.0 0.0 0.0 0 0 0 0 0 0 0
Subtotal 7.1 6.5 6.4 6.5 6.4 6.0 6.0 7.0 7.0 383 374 355 378 422 468 518
Detroit Target Seat Departures (a) 2137 2229 2433 2660 2897DTW NW NW DC9 78 0.0 0.0 0.0 0.0 0 0 0 0 0 0 0DTW NW NW D10 273 0.0 0.0 0.0 0.0 0 0 0 0 0 0 0DTW NW NW D9S 100 2.0 1.6 1.2 1.7 124 171 0 0 0 0 0DTW NW NW D95 125 3.1 2.6 5.0 4.7 624 593 0 0 0 0 0DTW NW NW 72S 149 0.0 0.0 0.0 0.0 0 0 0 0 0 0 0DTW NW NW 757 180 4.9 5.5 3.7 4.2 667 762 0 0 0 0 0DTW NW NW 320 148 2.7 4.3 3.2 2.6 472 387 0 0 0 0 0DTW NW NW 319 124 1.0 1.0 1.7 1.1 205 138 0 0 0 0 0DTW NW NW 332 298 0.0 0.0 0.0 0.0 0 0 0 0 0 0 0DTW NW NW 753 224 1.1 1.0 1.0 1.1 233 248 0 0 0 0 0DTW NW 9E CRJ 50 0.0 0.0 0.0 0.0 0 0 0 0 0 0 0DTW DL DL D9S 100 1.0 0 0 100 0 0 0 0DTW DL DL D95 125 5.0 0 0 625 0 0 0 0DTW DL DL 757 183 3.0 1.0 0 0 549 183 0 0 0DTW DL DL 320 148 1.0 1.0 2.0 1.0 0 0 148 148 0 296 148DTW DL DL 319 124 1.0 3.0 1.0 0 0 0 124 372 124 0DTW DL DL 753 224 0 0 0 0 0 0 0DTW DL DL 332 298 0 0 0 0 0 0 0DTW DL DL 763 262 1.0 1.0 0 0 0 0 262 262 0DTW DL DL NGD 225 1.0 2.0 0 0 0 0 0 225 450DTW DL DL M80 142 4.0 7.0 6.0 3.0 0 0 568 994 852 426 0DTW DL DL M90 150 1.0 2.0 2.0 2.0 0 0 150 300 300 300 0DTW DL DL 738 160 3.0 4.0 3.0 5.0 0 0 0 480 640 480 800DTW DL DL NGB 150 4.0 0 0 0 0 0 0 600DTW DL DL NGC 180 3.0 5.0 0 0 0 0 0 540 900
Subtotal 14.9 16.1 15.8 15.5 15.0 15.0 16.0 16.0 17.0 2324 2300 2140 2229 2426 2653 2898
Eau Claire Target Seat Departures (a) 119 128 142 158 175EAU NW XJ SF3 33 4.5 3.0 3.6 3.9 118 128 0 0 0 0 0EAU NW XJ CRJ 50 0.0 0.2 0.0 0.0 0 0 0 0 0 0 0EAU NW 9E CRJ 50 0.0 0.4 0.2 0.0 10 0 0 0 0 0 0EAU DL DLX SF3 33 3.6 3.9 3.4 2.5 0 0 119 129 112 83 0EAU DL DLX CRJ 50 0.6 0 0 0 0 30 0 0EAU DL DLX NGT 50 1.5 3.5 0 0 0 0 0 75 175
Subtotal 4.5 3.6 3.8 3.9 3.6 3.9 4.0 4.0 3.5 128 128 119 129 142 158 175
Vail Target Seat Departures (a) 56 67 81 98 115EGE NW NW 757 180 0.3 0.3 0.3 0.3 55 55 0 0 0 0 0EGE NW NW 320 148 0.0 0.0 0.0 0.0 0 0 0 0 0 0 0EGE DL DL 757 183 0.3 0.4 0.5 0 0 55 73 92 0 0
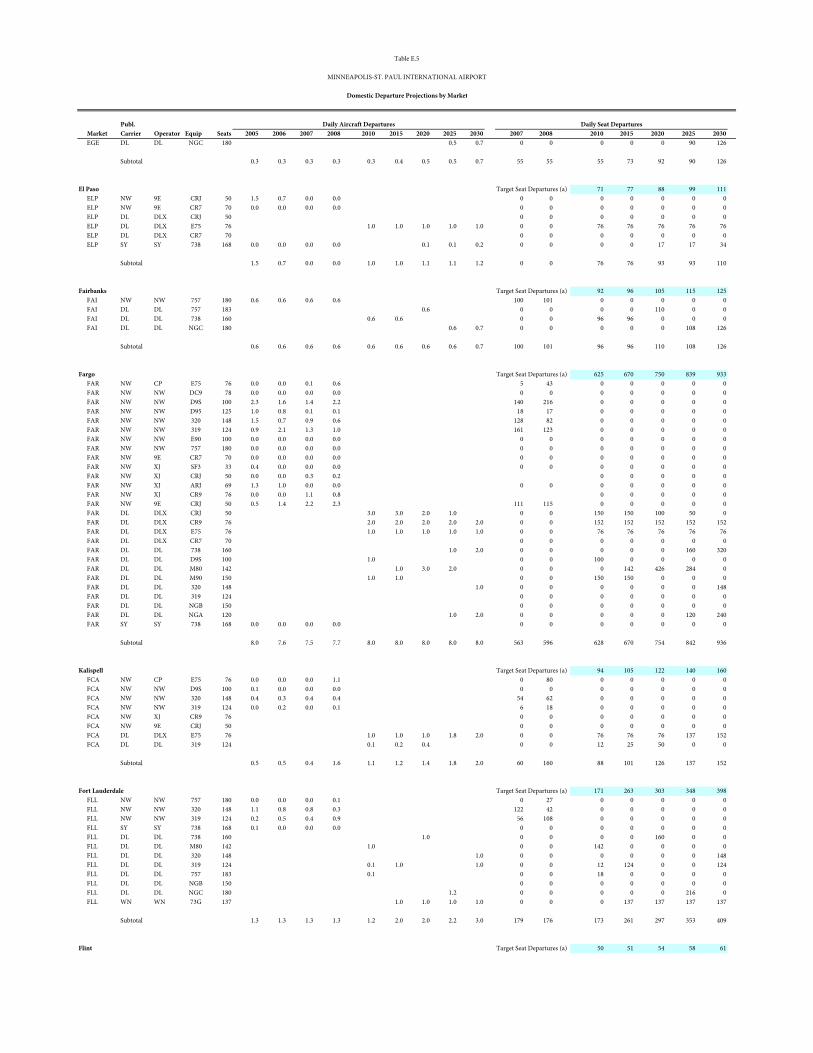
Publ.x Market Carrier Operator Equip Seats 2005 2006 2007 2008 x 2010 2015 2020 2025 2030 x 2007 2008 x 2010 2015 2020 2025 2030
Table E.5
MINNEAPOLIS-ST. PAUL INTERNATIONAL AIRPORT
Domestic Departure Projections by Market
Daily Aircraft Departures Daily Seat Departures
EGE DL DL NGC 180 0.5 0.7 0 0 0 0 0 90 126
Subtotal 0.3 0.3 0.3 0.3 0.3 0.4 0.5 0.5 0.7 55 55 55 73 92 90 126
El Paso Target Seat Departures (a) 71 77 88 99 111ELP NW 9E CRJ 50 1.5 0.7 0.0 0.0 0 0 0 0 0 0 0ELP NW 9E CR7 70 0.0 0.0 0.0 0.0 0 0 0 0 0 0 0ELP DL DLX CRJ 50 0 0 0 0 0 0 0ELP DL DLX E75 76 1.0 1.0 1.0 1.0 1.0 0 0 76 76 76 76 76ELP DL DLX CR7 70 0 0 0 0 0 0 0ELP SY SY 738 168 0.0 0.0 0.0 0.0 0.1 0.1 0.2 0 0 0 0 17 17 34
Subtotal 1.5 0.7 0.0 0.0 1.0 1.0 1.1 1.1 1.2 0 0 76 76 93 93 110
Fairbanks Target Seat Departures (a) 92 96 105 115 125FAI NW NW 757 180 0.6 0.6 0.6 0.6 100 101 0 0 0 0 0FAI DL DL 757 183 0.6 0 0 0 0 110 0 0FAI DL DL 738 160 0.6 0.6 0 0 96 96 0 0 0FAI DL DL NGC 180 0.6 0.7 0 0 0 0 0 108 126
Subtotal 0.6 0.6 0.6 0.6 0.6 0.6 0.6 0.6 0.7 100 101 96 96 110 108 126
Fargo Target Seat Departures (a) 625 670 750 839 933FAR NW CP E75 76 0.0 0.0 0.1 0.6 5 43 0 0 0 0 0FAR NW NW DC9 78 0.0 0.0 0.0 0.0 0 0 0 0 0 0 0FAR NW NW D9S 100 2.3 1.6 1.4 2.2 140 216 0 0 0 0 0FAR NW NW D95 125 1.0 0.8 0.1 0.1 18 17 0 0 0 0 0FAR NW NW 320 148 1.5 0.7 0.9 0.6 128 82 0 0 0 0 0FAR NW NW 319 124 0.9 2.1 1.3 1.0 161 123 0 0 0 0 0FAR NW NW E90 100 0.0 0.0 0.0 0.0 0 0 0 0 0 0 0FAR NW NW 757 180 0.0 0.0 0.0 0.0 0 0 0 0 0 0 0FAR NW 9E CR7 70 0.0 0.0 0.0 0.0 0 0 0 0 0 0 0FAR NW XJ SF3 33 0.4 0.0 0.0 0.0 0 0 0 0 0 0 0FAR NW XJ CRJ 50 0.0 0.0 0.3 0.2 0 0 0 0 0FAR NW XJ ARJ 69 1.3 1.0 0.0 0.0 0 0 0 0 0 0 0FAR NW XJ CR9 76 0.0 0.0 1.1 0.8 0 0 0 0 0FAR NW 9E CRJ 50 0.5 1.4 2.2 2.3 111 115 0 0 0 0 0FAR DL DLX CRJ 50 3.0 3.0 2.0 1.0 0 0 150 150 100 50 0FAR DL DLX CR9 76 2.0 2.0 2.0 2.0 2.0 0 0 152 152 152 152 152FAR DL DLX E75 76 1.0 1.0 1.0 1.0 1.0 0 0 76 76 76 76 76FAR DL DLX CR7 70 0 0 0 0 0 0 0FAR DL DL 738 160 1.0 2.0 0 0 0 0 0 160 320FAR DL DL D9S 100 1.0 0 0 100 0 0 0 0FAR DL DL M80 142 1.0 3.0 2.0 0 0 0 142 426 284 0FAR DL DL M90 150 1.0 1.0 0 0 150 150 0 0 0FAR DL DL 320 148 1.0 0 0 0 0 0 0 148FAR DL DL 319 124 0 0 0 0 0 0 0FAR DL DL NGB 150 0 0 0 0 0 0 0FAR DL DL NGA 120 1.0 2.0 0 0 0 0 0 120 240FAR SY SY 738 168 0.0 0.0 0.0 0.0 0 0 0 0 0 0 0
Subtotal 8.0 7.6 7.5 7.7 8.0 8.0 8.0 8.0 8.0 563 596 628 670 754 842 936
Kalispell Target Seat Departures (a) 94 105 122 140 160FCA NW CP E75 76 0.0 0.0 0.0 1.1 0 80 0 0 0 0 0FCA NW NW D9S 100 0.1 0.0 0.0 0.0 0 0 0 0 0 0 0FCA NW NW 320 148 0.4 0.3 0.4 0.4 54 62 0 0 0 0 0FCA NW NW 319 124 0.0 0.2 0.0 0.1 6 18 0 0 0 0 0FCA NW XJ CR9 76 0 0 0 0 0 0 0FCA NW 9E CRJ 50 0 0 0 0 0 0 0FCA DL DLX E75 76 1.0 1.0 1.0 1.8 2.0 0 0 76 76 76 137 152FCA DL DL 319 124 0.1 0.2 0.4 0 0 12 25 50 0 0
Subtotal 0.5 0.5 0.4 1.6 1.1 1.2 1.4 1.8 2.0 60 160 88 101 126 137 152
Fort Lauderdale Target Seat Departures (a) 171 263 303 348 398FLL NW NW 757 180 0.0 0.0 0.0 0.1 0 27 0 0 0 0 0FLL NW NW 320 148 1.1 0.8 0.8 0.3 122 42 0 0 0 0 0FLL NW NW 319 124 0.2 0.5 0.4 0.9 56 108 0 0 0 0 0FLL SY SY 738 168 0.1 0.0 0.0 0.0 0 0 0 0 0 0 0FLL DL DL 738 160 1.0 0 0 0 0 160 0 0FLL DL DL M80 142 1.0 0 0 142 0 0 0 0FLL DL DL 320 148 1.0 0 0 0 0 0 0 148FLL DL DL 319 124 0.1 1.0 1.0 0 0 12 124 0 0 124FLL DL DL 757 183 0.1 0 0 18 0 0 0 0FLL DL DL NGB 150 0 0 0 0 0 0 0FLL DL DL NGC 180 1.2 0 0 0 0 0 216 0FLL WN WN 73G 137 1.0 1.0 1.0 1.0 0 0 0 137 137 137 137
Subtotal 1.3 1.3 1.3 1.3 1.2 2.0 2.0 2.2 3.0 179 176 173 261 297 353 409
Flint Target Seat Departures (a) 50 51 54 58 61
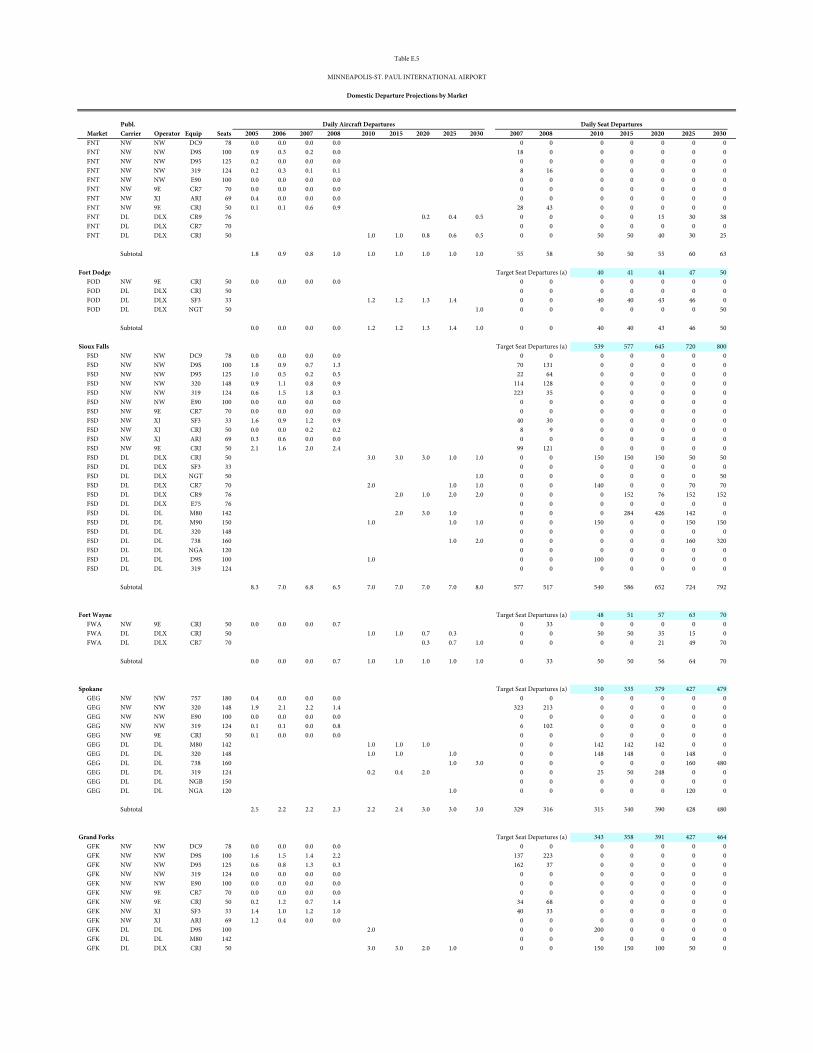
Publ.x Market Carrier Operator Equip Seats 2005 2006 2007 2008 x 2010 2015 2020 2025 2030 x 2007 2008 x 2010 2015 2020 2025 2030
Table E.5
MINNEAPOLIS-ST. PAUL INTERNATIONAL AIRPORT
Domestic Departure Projections by Market
Daily Aircraft Departures Daily Seat Departures
FNT NW NW DC9 78 0.0 0.0 0.0 0.0 0 0 0 0 0 0 0FNT NW NW D9S 100 0.9 0.3 0.2 0.0 18 0 0 0 0 0 0FNT NW NW D95 125 0.2 0.0 0.0 0.0 0 0 0 0 0 0 0FNT NW NW 319 124 0.2 0.3 0.1 0.1 8 16 0 0 0 0 0FNT NW NW E90 100 0.0 0.0 0.0 0.0 0 0 0 0 0 0 0FNT NW 9E CR7 70 0.0 0.0 0.0 0.0 0 0 0 0 0 0 0FNT NW XJ ARJ 69 0.4 0.0 0.0 0.0 0 0 0 0 0 0 0FNT NW 9E CRJ 50 0.1 0.1 0.6 0.9 28 43 0 0 0 0 0FNT DL DLX CR9 76 0.2 0.4 0.5 0 0 0 0 15 30 38FNT DL DLX CR7 70 0 0 0 0 0 0 0FNT DL DLX CRJ 50 1.0 1.0 0.8 0.6 0.5 0 0 50 50 40 30 25
Subtotal 1.8 0.9 0.8 1.0 1.0 1.0 1.0 1.0 1.0 55 58 50 50 55 60 63
Fort Dodge Target Seat Departures (a) 40 41 44 47 50FOD NW 9E CRJ 50 0.0 0.0 0.0 0.0 0 0 0 0 0 0 0FOD DL DLX CRJ 50 0 0 0 0 0 0 0FOD DL DLX SF3 33 1.2 1.2 1.3 1.4 0 0 40 40 43 46 0FOD DL DLX NGT 50 1.0 0 0 0 0 0 0 50
Subtotal 0.0 0.0 0.0 0.0 1.2 1.2 1.3 1.4 1.0 0 0 40 40 43 46 50
Sioux Falls Target Seat Departures (a) 539 577 645 720 800FSD NW NW DC9 78 0.0 0.0 0.0 0.0 0 0 0 0 0 0 0FSD NW NW D9S 100 1.8 0.9 0.7 1.3 70 131 0 0 0 0 0FSD NW NW D95 125 1.0 0.5 0.2 0.5 22 64 0 0 0 0 0FSD NW NW 320 148 0.9 1.1 0.8 0.9 114 128 0 0 0 0 0FSD NW NW 319 124 0.6 1.5 1.8 0.3 223 35 0 0 0 0 0FSD NW NW E90 100 0.0 0.0 0.0 0.0 0 0 0 0 0 0 0FSD NW 9E CR7 70 0.0 0.0 0.0 0.0 0 0 0 0 0 0 0FSD NW XJ SF3 33 1.6 0.9 1.2 0.9 40 30 0 0 0 0 0FSD NW XJ CRJ 50 0.0 0.0 0.2 0.2 8 9 0 0 0 0 0FSD NW XJ ARJ 69 0.3 0.6 0.0 0.0 0 0 0 0 0 0 0FSD NW 9E CRJ 50 2.1 1.6 2.0 2.4 99 121 0 0 0 0 0FSD DL DLX CRJ 50 3.0 3.0 3.0 1.0 1.0 0 0 150 150 150 50 50FSD DL DLX SF3 33 0 0 0 0 0 0 0FSD DL DLX NGT 50 1.0 0 0 0 0 0 0 50FSD DL DLX CR7 70 2.0 1.0 1.0 0 0 140 0 0 70 70FSD DL DLX CR9 76 2.0 1.0 2.0 2.0 0 0 0 152 76 152 152FSD DL DLX E75 76 0 0 0 0 0 0 0FSD DL DL M80 142 2.0 3.0 1.0 0 0 0 284 426 142 0FSD DL DL M90 150 1.0 1.0 1.0 0 0 150 0 0 150 150FSD DL DL 320 148 0 0 0 0 0 0 0FSD DL DL 738 160 1.0 2.0 0 0 0 0 0 160 320FSD DL DL NGA 120 0 0 0 0 0 0 0FSD DL DL D9S 100 1.0 0 0 100 0 0 0 0FSD DL DL 319 124 0 0 0 0 0 0 0
Subtotal 8.3 7.0 6.8 6.5 7.0 7.0 7.0 7.0 8.0 577 517 540 586 652 724 792
Fort Wayne Target Seat Departures (a) 48 51 57 63 70FWA NW 9E CRJ 50 0.0 0.0 0.0 0.7 0 33 0 0 0 0 0FWA DL DLX CRJ 50 1.0 1.0 0.7 0.3 0 0 50 50 35 15 0FWA DL DLX CR7 70 0.3 0.7 1.0 0 0 0 0 21 49 70
Subtotal 0.0 0.0 0.0 0.7 1.0 1.0 1.0 1.0 1.0 0 33 50 50 56 64 70
Spokane Target Seat Departures (a) 310 335 379 427 479GEG NW NW 757 180 0.4 0.0 0.0 0.0 0 0 0 0 0 0 0GEG NW NW 320 148 1.9 2.1 2.2 1.4 323 213 0 0 0 0 0GEG NW NW E90 100 0.0 0.0 0.0 0.0 0 0 0 0 0 0 0GEG NW NW 319 124 0.1 0.1 0.0 0.8 6 102 0 0 0 0 0GEG NW 9E CRJ 50 0.1 0.0 0.0 0.0 0 0 0 0 0 0 0GEG DL DL M80 142 1.0 1.0 1.0 0 0 142 142 142 0 0GEG DL DL 320 148 1.0 1.0 1.0 0 0 148 148 0 148 0GEG DL DL 738 160 1.0 3.0 0 0 0 0 0 160 480GEG DL DL 319 124 0.2 0.4 2.0 0 0 25 50 248 0 0GEG DL DL NGB 150 0 0 0 0 0 0 0GEG DL DL NGA 120 1.0 0 0 0 0 0 120 0
Subtotal 2.5 2.2 2.2 2.3 2.2 2.4 3.0 3.0 3.0 329 316 315 340 390 428 480
Grand Forks Target Seat Departures (a) 343 358 391 427 464GFK NW NW DC9 78 0.0 0.0 0.0 0.0 0 0 0 0 0 0 0GFK NW NW D9S 100 1.6 1.5 1.4 2.2 137 223 0 0 0 0 0GFK NW NW D95 125 0.6 0.8 1.3 0.3 162 37 0 0 0 0 0GFK NW NW 319 124 0.0 0.0 0.0 0.0 0 0 0 0 0 0 0GFK NW NW E90 100 0.0 0.0 0.0 0.0 0 0 0 0 0 0 0GFK NW 9E CR7 70 0.0 0.0 0.0 0.0 0 0 0 0 0 0 0GFK NW 9E CRJ 50 0.2 1.2 0.7 1.4 34 68 0 0 0 0 0GFK NW XJ SF3 33 1.4 1.0 1.2 1.0 40 33 0 0 0 0 0GFK NW XJ ARJ 69 1.2 0.4 0.0 0.0 0 0 0 0 0 0 0GFK DL DL D9S 100 2.0 0 0 200 0 0 0 0GFK DL DL M80 142 0 0 0 0 0 0 0GFK DL DLX CRJ 50 3.0 3.0 2.0 1.0 0 0 150 150 100 50 0
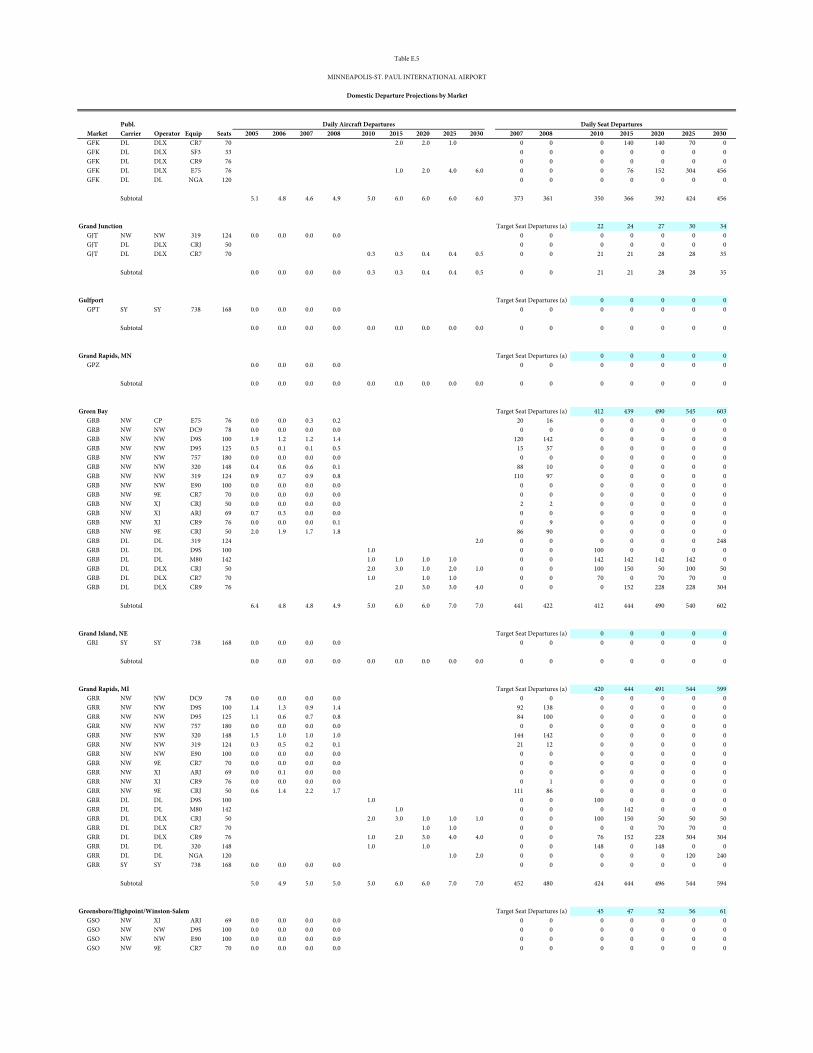
Publ.x Market Carrier Operator Equip Seats 2005 2006 2007 2008 x 2010 2015 2020 2025 2030 x 2007 2008 x 2010 2015 2020 2025 2030
Table E.5
MINNEAPOLIS-ST. PAUL INTERNATIONAL AIRPORT
Domestic Departure Projections by Market
Daily Aircraft Departures Daily Seat Departures
GFK DL DLX CR7 70 2.0 2.0 1.0 0 0 0 140 140 70 0GFK DL DLX SF3 33 0 0 0 0 0 0 0GFK DL DLX CR9 76 0 0 0 0 0 0 0GFK DL DLX E75 76 1.0 2.0 4.0 6.0 0 0 0 76 152 304 456GFK DL DL NGA 120 0 0 0 0 0 0 0
Subtotal 5.1 4.8 4.6 4.9 5.0 6.0 6.0 6.0 6.0 373 361 350 366 392 424 456
Grand Junction Target Seat Departures (a) 22 24 27 30 34GJT NW NW 319 124 0.0 0.0 0.0 0.0 0 0 0 0 0 0 0GJT DL DLX CRJ 50 0 0 0 0 0 0 0GJT DL DLX CR7 70 0.3 0.3 0.4 0.4 0.5 0 0 21 21 28 28 35
Subtotal 0.0 0.0 0.0 0.0 0.3 0.3 0.4 0.4 0.5 0 0 21 21 28 28 35
Gulfport Target Seat Departures (a) 0 0 0 0 0GPT SY SY 738 168 0.0 0.0 0.0 0.0 0 0 0 0 0 0 0
Subtotal 0.0 0.0 0.0 0.0 0.0 0.0 0.0 0.0 0.0 0 0 0 0 0 0 0
Grand Rapids, MN Target Seat Departures (a) 0 0 0 0 0GPZ 0.0 0.0 0.0 0.0 0 0 0 0 0 0 0
Subtotal 0.0 0.0 0.0 0.0 0.0 0.0 0.0 0.0 0.0 0 0 0 0 0 0 0
Green Bay Target Seat Departures (a) 412 439 490 545 603GRB NW CP E75 76 0.0 0.0 0.3 0.2 20 16 0 0 0 0 0GRB NW NW DC9 78 0.0 0.0 0.0 0.0 0 0 0 0 0 0 0GRB NW NW D9S 100 1.9 1.2 1.2 1.4 120 142 0 0 0 0 0GRB NW NW D95 125 0.5 0.1 0.1 0.5 15 57 0 0 0 0 0GRB NW NW 757 180 0.0 0.0 0.0 0.0 0 0 0 0 0 0 0GRB NW NW 320 148 0.4 0.6 0.6 0.1 88 10 0 0 0 0 0GRB NW NW 319 124 0.9 0.7 0.9 0.8 110 97 0 0 0 0 0GRB NW NW E90 100 0.0 0.0 0.0 0.0 0 0 0 0 0 0 0GRB NW 9E CR7 70 0.0 0.0 0.0 0.0 0 0 0 0 0 0 0GRB NW XJ CRJ 50 0.0 0.0 0.0 0.0 2 2 0 0 0 0 0GRB NW XJ ARJ 69 0.7 0.3 0.0 0.0 0 0 0 0 0 0 0GRB NW XJ CR9 76 0.0 0.0 0.0 0.1 0 9 0 0 0 0 0GRB NW 9E CRJ 50 2.0 1.9 1.7 1.8 86 90 0 0 0 0 0GRB DL DL 319 124 2.0 0 0 0 0 0 0 248GRB DL DL D9S 100 1.0 0 0 100 0 0 0 0GRB DL DL M80 142 1.0 1.0 1.0 1.0 0 0 142 142 142 142 0GRB DL DLX CRJ 50 2.0 3.0 1.0 2.0 1.0 0 0 100 150 50 100 50GRB DL DLX CR7 70 1.0 1.0 1.0 0 0 70 0 70 70 0GRB DL DLX CR9 76 2.0 3.0 3.0 4.0 0 0 0 152 228 228 304
Subtotal 6.4 4.8 4.8 4.9 5.0 6.0 6.0 7.0 7.0 441 422 412 444 490 540 602
Grand Island, NE Target Seat Departures (a) 0 0 0 0 0GRI SY SY 738 168 0.0 0.0 0.0 0.0 0 0 0 0 0 0 0
Subtotal 0.0 0.0 0.0 0.0 0.0 0.0 0.0 0.0 0.0 0 0 0 0 0 0 0
Grand Rapids, MI Target Seat Departures (a) 420 444 491 544 599GRR NW NW DC9 78 0.0 0.0 0.0 0.0 0 0 0 0 0 0 0GRR NW NW D9S 100 1.4 1.3 0.9 1.4 92 138 0 0 0 0 0GRR NW NW D95 125 1.1 0.6 0.7 0.8 84 100 0 0 0 0 0GRR NW NW 757 180 0.0 0.0 0.0 0.0 0 0 0 0 0 0 0GRR NW NW 320 148 1.5 1.0 1.0 1.0 144 142 0 0 0 0 0GRR NW NW 319 124 0.3 0.5 0.2 0.1 21 12 0 0 0 0 0GRR NW NW E90 100 0.0 0.0 0.0 0.0 0 0 0 0 0 0 0GRR NW 9E CR7 70 0.0 0.0 0.0 0.0 0 0 0 0 0 0 0GRR NW XJ ARJ 69 0.0 0.1 0.0 0.0 0 0 0 0 0 0 0GRR NW XJ CR9 76 0.0 0.0 0.0 0.0 0 1 0 0 0 0 0GRR NW 9E CRJ 50 0.6 1.4 2.2 1.7 111 86 0 0 0 0 0GRR DL DL D9S 100 1.0 0 0 100 0 0 0 0GRR DL DL M80 142 1.0 0 0 0 142 0 0 0GRR DL DLX CRJ 50 2.0 3.0 1.0 1.0 1.0 0 0 100 150 50 50 50GRR DL DLX CR7 70 1.0 1.0 0 0 0 0 70 70 0GRR DL DLX CR9 76 1.0 2.0 3.0 4.0 4.0 0 0 76 152 228 304 304GRR DL DL 320 148 1.0 1.0 0 0 148 0 148 0 0GRR DL DL NGA 120 1.0 2.0 0 0 0 0 0 120 240GRR SY SY 738 168 0.0 0.0 0.0 0.0 0 0 0 0 0 0 0
Subtotal 5.0 4.9 5.0 5.0 5.0 6.0 6.0 7.0 7.0 452 480 424 444 496 544 594
Greensboro/Highpoint/Winston-Salem Target Seat Departures (a) 45 47 52 56 61GSO NW XJ ARJ 69 0.0 0.0 0.0 0.0 0 0 0 0 0 0 0GSO NW NW D9S 100 0.0 0.0 0.0 0.0 0 0 0 0 0 0 0GSO NW NW E90 100 0.0 0.0 0.0 0.0 0 0 0 0 0 0 0GSO NW 9E CR7 70 0.0 0.0 0.0 0.0 0 0 0 0 0 0 0
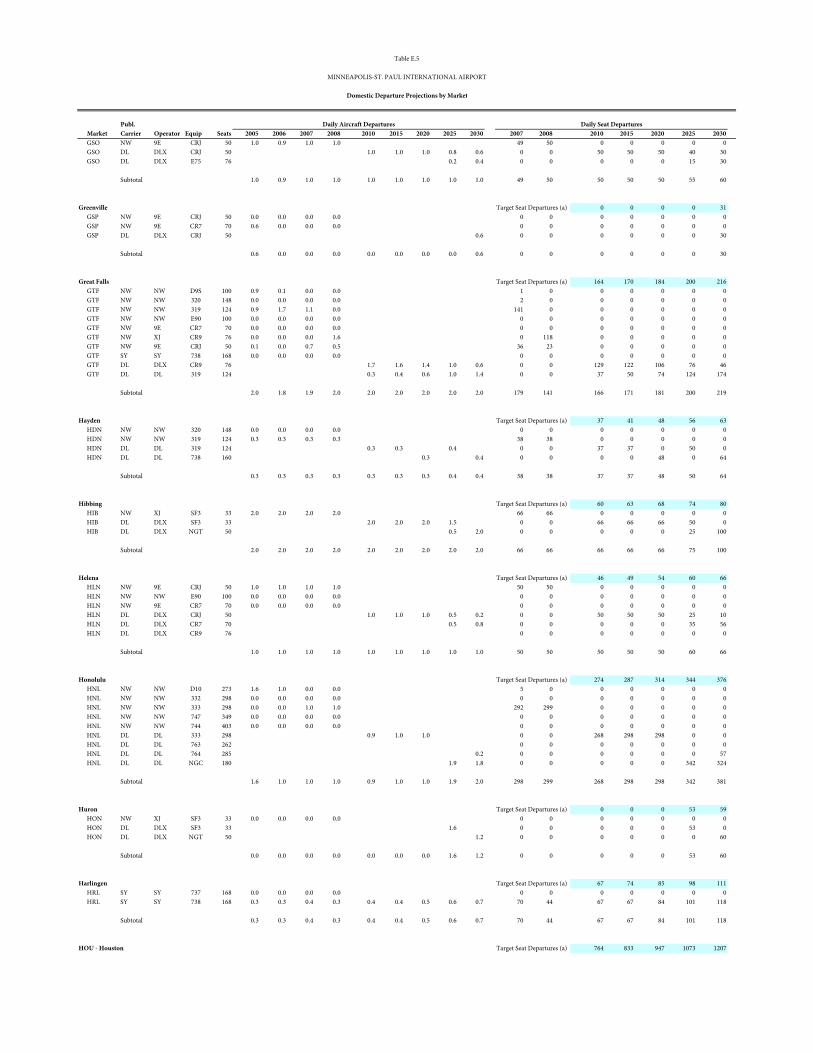
Publ.x Market Carrier Operator Equip Seats 2005 2006 2007 2008 x 2010 2015 2020 2025 2030 x 2007 2008 x 2010 2015 2020 2025 2030
Table E.5
MINNEAPOLIS-ST. PAUL INTERNATIONAL AIRPORT
Domestic Departure Projections by Market
Daily Aircraft Departures Daily Seat Departures
GSO NW 9E CRJ 50 1.0 0.9 1.0 1.0 49 50 0 0 0 0 0GSO DL DLX CRJ 50 1.0 1.0 1.0 0.8 0.6 0 0 50 50 50 40 30GSO DL DLX E75 76 0.2 0.4 0 0 0 0 0 15 30
Subtotal 1.0 0.9 1.0 1.0 1.0 1.0 1.0 1.0 1.0 49 50 50 50 50 55 60
Greenville Target Seat Departures (a) 0 0 0 0 31GSP NW 9E CRJ 50 0.0 0.0 0.0 0.0 0 0 0 0 0 0 0GSP NW 9E CR7 70 0.6 0.0 0.0 0.0 0 0 0 0 0 0 0GSP DL DLX CRJ 50 0.6 0 0 0 0 0 0 30
Subtotal 0.6 0.0 0.0 0.0 0.0 0.0 0.0 0.0 0.6 0 0 0 0 0 0 30
Great Falls Target Seat Departures (a) 164 170 184 200 216GTF NW NW D9S 100 0.9 0.1 0.0 0.0 1 0 0 0 0 0 0GTF NW NW 320 148 0.0 0.0 0.0 0.0 2 0 0 0 0 0 0GTF NW NW 319 124 0.9 1.7 1.1 0.0 141 0 0 0 0 0 0GTF NW NW E90 100 0.0 0.0 0.0 0.0 0 0 0 0 0 0 0GTF NW 9E CR7 70 0.0 0.0 0.0 0.0 0 0 0 0 0 0 0GTF NW XJ CR9 76 0.0 0.0 0.0 1.6 0 118 0 0 0 0 0GTF NW 9E CRJ 50 0.1 0.0 0.7 0.5 36 23 0 0 0 0 0GTF SY SY 738 168 0.0 0.0 0.0 0.0 0 0 0 0 0 0 0GTF DL DLX CR9 76 1.7 1.6 1.4 1.0 0.6 0 0 129 122 106 76 46GTF DL DL 319 124 0.3 0.4 0.6 1.0 1.4 0 0 37 50 74 124 174
Subtotal 2.0 1.8 1.9 2.0 2.0 2.0 2.0 2.0 2.0 179 141 166 171 181 200 219
Hayden Target Seat Departures (a) 37 41 48 56 63HDN NW NW 320 148 0.0 0.0 0.0 0.0 0 0 0 0 0 0 0HDN NW NW 319 124 0.3 0.3 0.3 0.3 38 38 0 0 0 0 0HDN DL DL 319 124 0.3 0.3 0.4 0 0 37 37 0 50 0HDN DL DL 738 160 0.3 0.4 0 0 0 0 48 0 64
Subtotal 0.3 0.3 0.3 0.3 0.3 0.3 0.3 0.4 0.4 38 38 37 37 48 50 64
Hibbing Target Seat Departures (a) 60 63 68 74 80HIB NW XJ SF3 33 2.0 2.0 2.0 2.0 66 66 0 0 0 0 0HIB DL DLX SF3 33 2.0 2.0 2.0 1.5 0 0 66 66 66 50 0HIB DL DLX NGT 50 0.5 2.0 0 0 0 0 0 25 100
Subtotal 2.0 2.0 2.0 2.0 2.0 2.0 2.0 2.0 2.0 66 66 66 66 66 75 100
Helena Target Seat Departures (a) 46 49 54 60 66HLN NW 9E CRJ 50 1.0 1.0 1.0 1.0 50 50 0 0 0 0 0HLN NW NW E90 100 0.0 0.0 0.0 0.0 0 0 0 0 0 0 0HLN NW 9E CR7 70 0.0 0.0 0.0 0.0 0 0 0 0 0 0 0HLN DL DLX CRJ 50 1.0 1.0 1.0 0.5 0.2 0 0 50 50 50 25 10HLN DL DLX CR7 70 0.5 0.8 0 0 0 0 0 35 56HLN DL DLX CR9 76 0 0 0 0 0 0 0
Subtotal 1.0 1.0 1.0 1.0 1.0 1.0 1.0 1.0 1.0 50 50 50 50 50 60 66
Honolulu Target Seat Departures (a) 274 287 314 344 376HNL NW NW D10 273 1.6 1.0 0.0 0.0 5 0 0 0 0 0 0HNL NW NW 332 298 0.0 0.0 0.0 0.0 0 0 0 0 0 0 0HNL NW NW 333 298 0.0 0.0 1.0 1.0 292 299 0 0 0 0 0HNL NW NW 747 349 0.0 0.0 0.0 0.0 0 0 0 0 0 0 0HNL NW NW 744 403 0.0 0.0 0.0 0.0 0 0 0 0 0 0 0HNL DL DL 333 298 0.9 1.0 1.0 0 0 268 298 298 0 0HNL DL DL 763 262 0 0 0 0 0 0 0HNL DL DL 764 285 0.2 0 0 0 0 0 0 57HNL DL DL NGC 180 1.9 1.8 0 0 0 0 0 342 324
Subtotal 1.6 1.0 1.0 1.0 0.9 1.0 1.0 1.9 2.0 298 299 268 298 298 342 381
Huron Target Seat Departures (a) 0 0 0 53 59HON NW XJ SF3 33 0.0 0.0 0.0 0.0 0 0 0 0 0 0 0HON DL DLX SF3 33 1.6 0 0 0 0 0 53 0HON DL DLX NGT 50 1.2 0 0 0 0 0 0 60
Subtotal 0.0 0.0 0.0 0.0 0.0 0.0 0.0 1.6 1.2 0 0 0 0 0 53 60
Harlingen Target Seat Departures (a) 67 74 85 98 111HRL SY SY 737 168 0.0 0.0 0.0 0.0 0 0 0 0 0 0 0HRL SY SY 738 168 0.3 0.3 0.4 0.3 0.4 0.4 0.5 0.6 0.7 70 44 67 67 84 101 118
Subtotal 0.3 0.3 0.4 0.3 0.4 0.4 0.5 0.6 0.7 70 44 67 67 84 101 118
HOU - Houston Target Seat Departures (a) 764 833 947 1073 1207
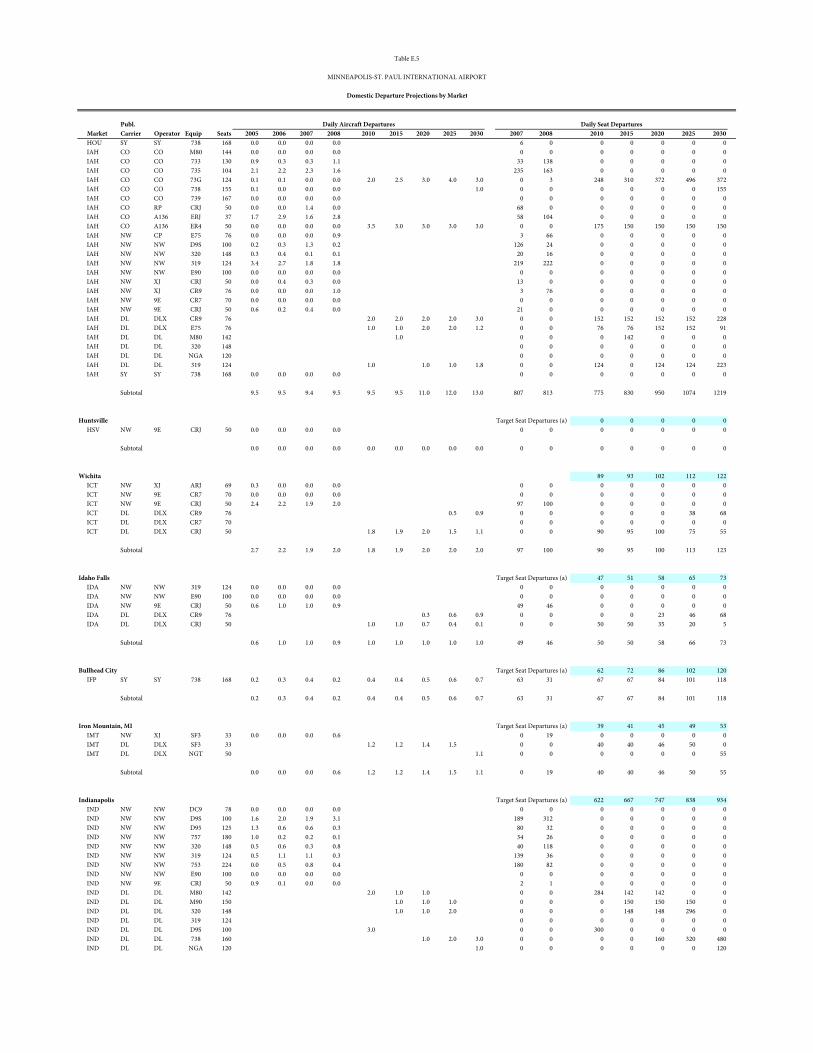
Publ.x Market Carrier Operator Equip Seats 2005 2006 2007 2008 x 2010 2015 2020 2025 2030 x 2007 2008 x 2010 2015 2020 2025 2030
Table E.5
MINNEAPOLIS-ST. PAUL INTERNATIONAL AIRPORT
Domestic Departure Projections by Market
Daily Aircraft Departures Daily Seat Departures
HOU SY SY 738 168 0.0 0.0 0.0 0.0 6 0 0 0 0 0 0IAH CO CO M80 144 0.0 0.0 0.0 0.0 0 0 0 0 0 0 0IAH CO CO 733 130 0.9 0.3 0.3 1.1 33 138 0 0 0 0 0IAH CO CO 735 104 2.1 2.2 2.3 1.6 235 163 0 0 0 0 0IAH CO CO 73G 124 0.1 0.1 0.0 0.0 2.0 2.5 3.0 4.0 3.0 0 3 248 310 372 496 372IAH CO CO 738 155 0.1 0.0 0.0 0.0 1.0 0 0 0 0 0 0 155IAH CO CO 739 167 0.0 0.0 0.0 0.0 0 0 0 0 0 0 0IAH CO RP CRJ 50 0.0 0.0 1.4 0.0 68 0 0 0 0 0 0IAH CO A136 ERJ 37 1.7 2.9 1.6 2.8 58 104 0 0 0 0 0IAH CO A136 ER4 50 0.0 0.0 0.0 0.0 3.5 3.0 3.0 3.0 3.0 0 0 175 150 150 150 150IAH NW CP E75 76 0.0 0.0 0.0 0.9 3 66 0 0 0 0 0IAH NW NW D9S 100 0.2 0.3 1.3 0.2 126 24 0 0 0 0 0IAH NW NW 320 148 0.3 0.4 0.1 0.1 20 16 0 0 0 0 0IAH NW NW 319 124 3.4 2.7 1.8 1.8 219 222 0 0 0 0 0IAH NW NW E90 100 0.0 0.0 0.0 0.0 0 0 0 0 0 0 0IAH NW XJ CRJ 50 0.0 0.4 0.3 0.0 13 0 0 0 0 0 0IAH NW XJ CR9 76 0.0 0.0 0.0 1.0 3 76 0 0 0 0 0IAH NW 9E CR7 70 0.0 0.0 0.0 0.0 0 0 0 0 0 0 0IAH NW 9E CRJ 50 0.6 0.2 0.4 0.0 21 0 0 0 0 0 0IAH DL DLX CR9 76 2.0 2.0 2.0 2.0 3.0 0 0 152 152 152 152 228IAH DL DLX E75 76 1.0 1.0 2.0 2.0 1.2 0 0 76 76 152 152 91IAH DL DL M80 142 1.0 0 0 0 142 0 0 0IAH DL DL 320 148 0 0 0 0 0 0 0IAH DL DL NGA 120 0 0 0 0 0 0 0IAH DL DL 319 124 1.0 1.0 1.0 1.8 0 0 124 0 124 124 223IAH SY SY 738 168 0.0 0.0 0.0 0.0 0 0 0 0 0 0 0
Subtotal 9.5 9.5 9.4 9.5 9.5 9.5 11.0 12.0 13.0 807 813 775 830 950 1074 1219
Huntsville Target Seat Departures (a) 0 0 0 0 0HSV NW 9E CRJ 50 0.0 0.0 0.0 0.0 0 0 0 0 0 0 0
Subtotal 0.0 0.0 0.0 0.0 0.0 0.0 0.0 0.0 0.0 0 0 0 0 0 0 0
Wichita 89 93 102 112 122ICT NW XJ ARJ 69 0.3 0.0 0.0 0.0 0 0 0 0 0 0 0ICT NW 9E CR7 70 0.0 0.0 0.0 0.0 0 0 0 0 0 0 0ICT NW 9E CRJ 50 2.4 2.2 1.9 2.0 97 100 0 0 0 0 0ICT DL DLX CR9 76 0.5 0.9 0 0 0 0 0 38 68ICT DL DLX CR7 70 0 0 0 0 0 0 0ICT DL DLX CRJ 50 1.8 1.9 2.0 1.5 1.1 0 0 90 95 100 75 55
Subtotal 2.7 2.2 1.9 2.0 1.8 1.9 2.0 2.0 2.0 97 100 90 95 100 113 123
Idaho Falls Target Seat Departures (a) 47 51 58 65 73IDA NW NW 319 124 0.0 0.0 0.0 0.0 0 0 0 0 0 0 0IDA NW NW E90 100 0.0 0.0 0.0 0.0 0 0 0 0 0 0 0IDA NW 9E CRJ 50 0.6 1.0 1.0 0.9 49 46 0 0 0 0 0IDA DL DLX CR9 76 0.3 0.6 0.9 0 0 0 0 23 46 68IDA DL DLX CRJ 50 1.0 1.0 0.7 0.4 0.1 0 0 50 50 35 20 5
Subtotal 0.6 1.0 1.0 0.9 1.0 1.0 1.0 1.0 1.0 49 46 50 50 58 66 73
Bullhead City Target Seat Departures (a) 62 72 86 102 120IFP SY SY 738 168 0.2 0.3 0.4 0.2 0.4 0.4 0.5 0.6 0.7 63 31 67 67 84 101 118
Subtotal 0.2 0.3 0.4 0.2 0.4 0.4 0.5 0.6 0.7 63 31 67 67 84 101 118
Iron Mountain, MI Target Seat Departures (a) 39 41 45 49 53IMT NW XJ SF3 33 0.0 0.0 0.0 0.6 0 19 0 0 0 0 0IMT DL DLX SF3 33 1.2 1.2 1.4 1.5 0 0 40 40 46 50 0IMT DL DLX NGT 50 1.1 0 0 0 0 0 0 55
Subtotal 0.0 0.0 0.0 0.6 1.2 1.2 1.4 1.5 1.1 0 19 40 40 46 50 55
Indianapolis Target Seat Departures (a) 622 667 747 838 934IND NW NW DC9 78 0.0 0.0 0.0 0.0 0 0 0 0 0 0 0IND NW NW D9S 100 1.6 2.0 1.9 3.1 189 312 0 0 0 0 0IND NW NW D95 125 1.3 0.6 0.6 0.3 80 32 0 0 0 0 0IND NW NW 757 180 1.0 0.2 0.2 0.1 34 26 0 0 0 0 0IND NW NW 320 148 0.5 0.6 0.3 0.8 40 118 0 0 0 0 0IND NW NW 319 124 0.5 1.1 1.1 0.3 139 36 0 0 0 0 0IND NW NW 753 224 0.0 0.5 0.8 0.4 180 82 0 0 0 0 0IND NW NW E90 100 0.0 0.0 0.0 0.0 0 0 0 0 0 0 0IND NW 9E CRJ 50 0.9 0.1 0.0 0.0 2 1 0 0 0 0 0IND DL DL M80 142 2.0 1.0 1.0 0 0 284 142 142 0 0IND DL DL M90 150 1.0 1.0 1.0 0 0 0 150 150 150 0IND DL DL 320 148 1.0 1.0 2.0 0 0 0 148 148 296 0IND DL DL 319 124 0 0 0 0 0 0 0IND DL DL D9S 100 3.0 0 0 300 0 0 0 0IND DL DL 738 160 1.0 2.0 3.0 0 0 0 0 160 320 480IND DL DL NGA 120 1.0 0 0 0 0 0 0 120
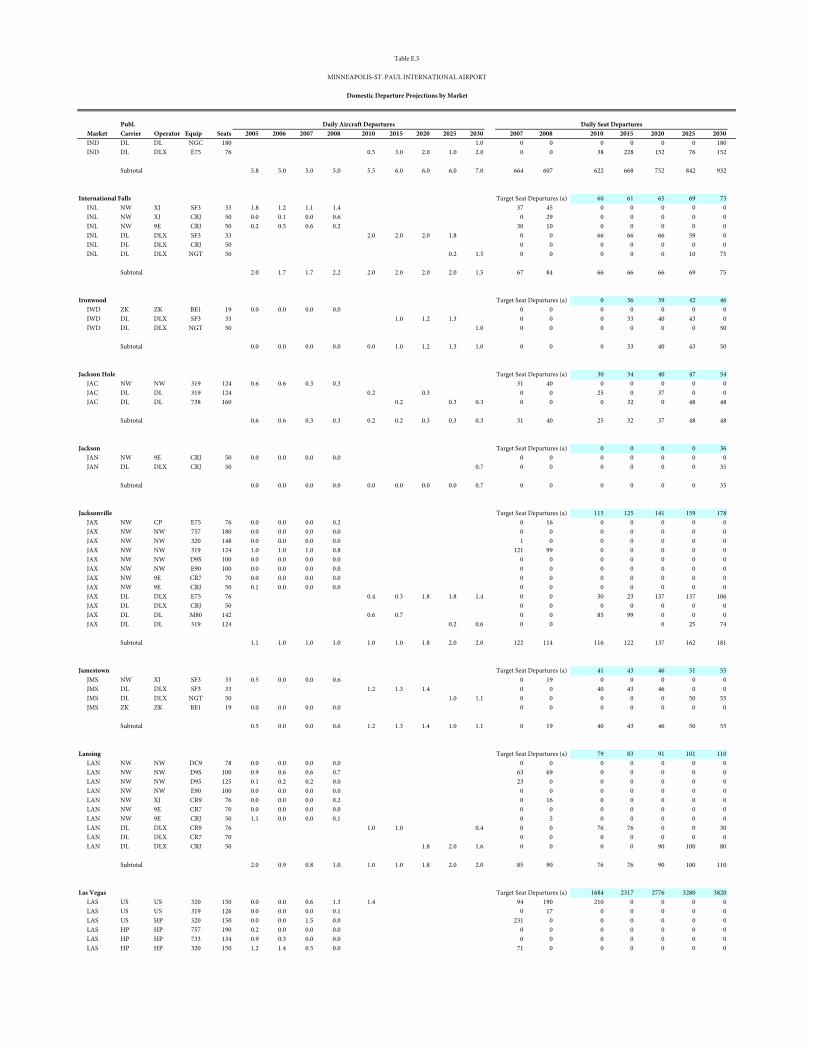
Publ.x Market Carrier Operator Equip Seats 2005 2006 2007 2008 x 2010 2015 2020 2025 2030 x 2007 2008 x 2010 2015 2020 2025 2030
Table E.5
MINNEAPOLIS-ST. PAUL INTERNATIONAL AIRPORT
Domestic Departure Projections by Market
Daily Aircraft Departures Daily Seat Departures
IND DL DL NGC 180 1.0 0 0 0 0 0 0 180IND DL DLX E75 76 0.5 3.0 2.0 1.0 2.0 0 0 38 228 152 76 152
Subtotal 5.8 5.0 5.0 5.0 5.5 6.0 6.0 6.0 7.0 664 607 622 668 752 842 932
International Falls Target Seat Departures (a) 60 61 65 69 73INL NW XJ SF3 33 1.8 1.2 1.1 1.4 37 45 0 0 0 0 0INL NW XJ CRJ 50 0.0 0.1 0.0 0.6 0 29 0 0 0 0 0INL NW 9E CRJ 50 0.2 0.5 0.6 0.2 30 10 0 0 0 0 0INL DL DLX SF3 33 2.0 2.0 2.0 1.8 0 0 66 66 66 59 0INL DL DLX CRJ 50 0 0 0 0 0 0 0INL DL DLX NGT 50 0.2 1.5 0 0 0 0 0 10 75
Subtotal 2.0 1.7 1.7 2.2 2.0 2.0 2.0 2.0 1.5 67 84 66 66 66 69 75
Ironwood Target Seat Departures (a) 0 36 39 42 46IWD ZK ZK BE1 19 0.0 0.0 0.0 0.0 0 0 0 0 0 0 0IWD DL DLX SF3 33 1.0 1.2 1.3 0 0 0 33 40 43 0IWD DL DLX NGT 50 1.0 0 0 0 0 0 0 50
Subtotal 0.0 0.0 0.0 0.0 0.0 1.0 1.2 1.3 1.0 0 0 0 33 40 43 50
Jackson Hole Target Seat Departures (a) 30 34 40 47 54JAC NW NW 319 124 0.6 0.6 0.3 0.3 31 40 0 0 0 0 0JAC DL DL 319 124 0.2 0.3 0 0 25 0 37 0 0JAC DL DL 738 160 0.2 0.3 0.3 0 0 0 32 0 48 48
Subtotal 0.6 0.6 0.3 0.3 0.2 0.2 0.3 0.3 0.3 31 40 25 32 37 48 48
Jackson Target Seat Departures (a) 0 0 0 0 36JAN NW 9E CRJ 50 0.0 0.0 0.0 0.0 0 0 0 0 0 0 0JAN DL DLX CRJ 50 0.7 0 0 0 0 0 0 35
Subtotal 0.0 0.0 0.0 0.0 0.0 0.0 0.0 0.0 0.7 0 0 0 0 0 0 35
Jacksonville Target Seat Departures (a) 115 125 141 159 178JAX NW CP E75 76 0.0 0.0 0.0 0.2 0 16 0 0 0 0 0JAX NW NW 757 180 0.0 0.0 0.0 0.0 0 0 0 0 0 0 0JAX NW NW 320 148 0.0 0.0 0.0 0.0 1 0 0 0 0 0 0JAX NW NW 319 124 1.0 1.0 1.0 0.8 121 99 0 0 0 0 0JAX NW NW D9S 100 0.0 0.0 0.0 0.0 0 0 0 0 0 0 0JAX NW NW E90 100 0.0 0.0 0.0 0.0 0 0 0 0 0 0 0JAX NW 9E CR7 70 0.0 0.0 0.0 0.0 0 0 0 0 0 0 0JAX NW 9E CRJ 50 0.1 0.0 0.0 0.0 0 0 0 0 0 0 0JAX DL DLX E75 76 0.4 0.3 1.8 1.8 1.4 0 0 30 23 137 137 106JAX DL DLX CRJ 50 0 0 0 0 0 0 0JAX DL DL M80 142 0.6 0.7 0 0 85 99 0 0 0JAX DL DL 319 124 0.2 0.6 0 0 0 25 74
Subtotal 1.1 1.0 1.0 1.0 1.0 1.0 1.8 2.0 2.0 122 114 116 122 137 162 181
Jamestown Target Seat Departures (a) 41 43 46 51 55JMS NW XJ SF3 33 0.5 0.0 0.0 0.6 0 19 0 0 0 0 0JMS DL DLX SF3 33 1.2 1.3 1.4 0 0 40 43 46 0 0JMS DL DLX NGT 50 1.0 1.1 0 0 0 0 0 50 55JMS ZK ZK BE1 19 0.0 0.0 0.0 0.0 0 0 0 0 0 0 0
Subtotal 0.5 0.0 0.0 0.6 1.2 1.3 1.4 1.0 1.1 0 19 40 43 46 50 55
Lansing Target Seat Departures (a) 79 83 91 101 110LAN NW NW DC9 78 0.0 0.0 0.0 0.0 0 0 0 0 0 0 0LAN NW NW D9S 100 0.9 0.6 0.6 0.7 63 69 0 0 0 0 0LAN NW NW D95 125 0.1 0.2 0.2 0.0 23 0 0 0 0 0 0LAN NW NW E90 100 0.0 0.0 0.0 0.0 0 0 0 0 0 0 0LAN NW XJ CR9 76 0.0 0.0 0.0 0.2 0 16 0 0 0 0 0LAN NW 9E CR7 70 0.0 0.0 0.0 0.0 0 0 0 0 0 0 0LAN NW 9E CRJ 50 1.1 0.0 0.0 0.1 0 5 0 0 0 0 0LAN DL DLX CR9 76 1.0 1.0 0.4 0 0 76 76 0 0 30LAN DL DLX CR7 70 0 0 0 0 0 0 0LAN DL DLX CRJ 50 1.8 2.0 1.6 0 0 0 0 90 100 80
Subtotal 2.0 0.9 0.8 1.0 1.0 1.0 1.8 2.0 2.0 85 90 76 76 90 100 110
Las Vegas Target Seat Departures (a) 1684 2317 2776 3280 3820LAS US US 320 150 0.0 0.0 0.6 1.3 1.4 94 190 210 0 0 0 0LAS US US 319 126 0.0 0.0 0.0 0.1 0 17 0 0 0 0 0LAS US HP 320 150 0.0 0.0 1.5 0.0 231 0 0 0 0 0 0LAS HP HP 757 190 0.2 0.0 0.0 0.0 0 0 0 0 0 0 0LAS HP HP 733 134 0.9 0.3 0.0 0.0 0 0 0 0 0 0 0LAS HP HP 320 150 1.2 1.4 0.5 0.0 71 0 0 0 0 0 0
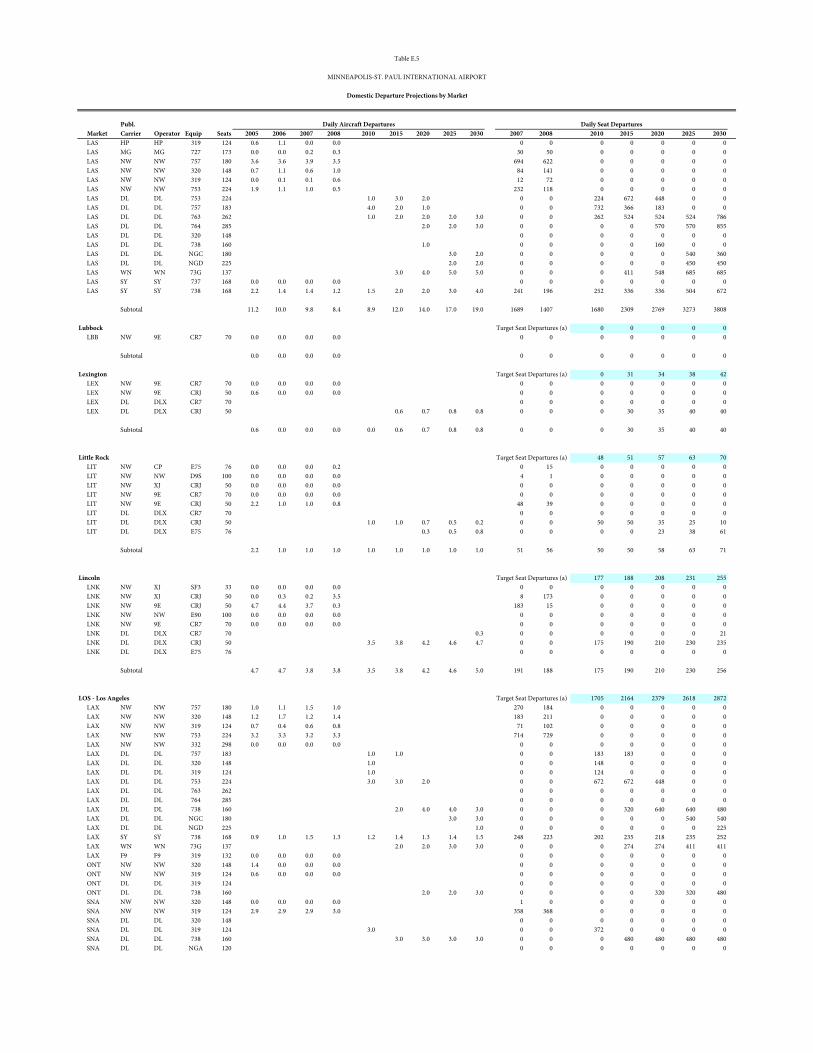
Publ.x Market Carrier Operator Equip Seats 2005 2006 2007 2008 x 2010 2015 2020 2025 2030 x 2007 2008 x 2010 2015 2020 2025 2030
Table E.5
MINNEAPOLIS-ST. PAUL INTERNATIONAL AIRPORT
Domestic Departure Projections by Market
Daily Aircraft Departures Daily Seat Departures
LAS HP HP 319 124 0.6 1.1 0.0 0.0 0 0 0 0 0 0 0LAS MG MG 727 173 0.0 0.0 0.2 0.3 30 50 0 0 0 0 0LAS NW NW 757 180 3.6 3.6 3.9 3.5 694 622 0 0 0 0 0LAS NW NW 320 148 0.7 1.1 0.6 1.0 84 141 0 0 0 0 0LAS NW NW 319 124 0.0 0.1 0.1 0.6 12 72 0 0 0 0 0LAS NW NW 753 224 1.9 1.1 1.0 0.5 232 118 0 0 0 0 0LAS DL DL 753 224 1.0 3.0 2.0 0 0 224 672 448 0 0LAS DL DL 757 183 4.0 2.0 1.0 0 0 732 366 183 0 0LAS DL DL 763 262 1.0 2.0 2.0 2.0 3.0 0 0 262 524 524 524 786LAS DL DL 764 285 2.0 2.0 3.0 0 0 0 0 570 570 855LAS DL DL 320 148 0 0 0 0 0 0 0LAS DL DL 738 160 1.0 0 0 0 0 160 0 0LAS DL DL NGC 180 3.0 2.0 0 0 0 0 0 540 360LAS DL DL NGD 225 2.0 2.0 0 0 0 0 0 450 450LAS WN WN 73G 137 3.0 4.0 5.0 5.0 0 0 0 411 548 685 685LAS SY SY 737 168 0.0 0.0 0.0 0.0 0 0 0 0 0 0 0LAS SY SY 738 168 2.2 1.4 1.4 1.2 1.5 2.0 2.0 3.0 4.0 241 196 252 336 336 504 672
Subtotal 11.2 10.0 9.8 8.4 8.9 12.0 14.0 17.0 19.0 1689 1407 1680 2309 2769 3273 3808
Lubbock Target Seat Departures (a) 0 0 0 0 0LBB NW 9E CR7 70 0.0 0.0 0.0 0.0 0 0 0 0 0 0 0
Subtotal 0.0 0.0 0.0 0.0 0 0 0 0 0 0 0
Lexington Target Seat Departures (a) 0 31 34 38 42LEX NW 9E CR7 70 0.0 0.0 0.0 0.0 0 0 0 0 0 0 0LEX NW 9E CRJ 50 0.6 0.0 0.0 0.0 0 0 0 0 0 0 0LEX DL DLX CR7 70 0 0 0 0 0 0 0LEX DL DLX CRJ 50 0.6 0.7 0.8 0.8 0 0 0 30 35 40 40
Subtotal 0.6 0.0 0.0 0.0 0.0 0.6 0.7 0.8 0.8 0 0 0 30 35 40 40
Little Rock Target Seat Departures (a) 48 51 57 63 70LIT NW CP E75 76 0.0 0.0 0.0 0.2 0 15 0 0 0 0 0LIT NW NW D9S 100 0.0 0.0 0.0 0.0 4 1 0 0 0 0 0LIT NW XJ CRJ 50 0.0 0.0 0.0 0.0 0 0 0 0 0 0 0LIT NW 9E CR7 70 0.0 0.0 0.0 0.0 0 0 0 0 0 0 0LIT NW 9E CRJ 50 2.2 1.0 1.0 0.8 48 39 0 0 0 0 0LIT DL DLX CR7 70 0 0 0 0 0 0 0LIT DL DLX CRJ 50 1.0 1.0 0.7 0.5 0.2 0 0 50 50 35 25 10LIT DL DLX E75 76 0.3 0.5 0.8 0 0 0 0 23 38 61
Subtotal 2.2 1.0 1.0 1.0 1.0 1.0 1.0 1.0 1.0 51 56 50 50 58 63 71
Lincoln Target Seat Departures (a) 177 188 208 231 255LNK NW XJ SF3 33 0.0 0.0 0.0 0.0 0 0 0 0 0 0 0LNK NW XJ CRJ 50 0.0 0.3 0.2 3.5 8 173 0 0 0 0 0LNK NW 9E CRJ 50 4.7 4.4 3.7 0.3 183 15 0 0 0 0 0LNK NW NW E90 100 0.0 0.0 0.0 0.0 0 0 0 0 0 0 0LNK NW 9E CR7 70 0.0 0.0 0.0 0.0 0 0 0 0 0 0 0LNK DL DLX CR7 70 0.3 0 0 0 0 0 0 21LNK DL DLX CRJ 50 3.5 3.8 4.2 4.6 4.7 0 0 175 190 210 230 235LNK DL DLX E75 76 0 0 0 0 0 0 0
Subtotal 4.7 4.7 3.8 3.8 3.5 3.8 4.2 4.6 5.0 191 188 175 190 210 230 256
LOS - Los Angeles Target Seat Departures (a) 1705 2164 2379 2618 2872LAX NW NW 757 180 1.0 1.1 1.5 1.0 270 184 0 0 0 0 0LAX NW NW 320 148 1.2 1.7 1.2 1.4 183 211 0 0 0 0 0LAX NW NW 319 124 0.7 0.4 0.6 0.8 71 102 0 0 0 0 0LAX NW NW 753 224 3.2 3.3 3.2 3.3 714 729 0 0 0 0 0LAX NW NW 332 298 0.0 0.0 0.0 0.0 0 0 0 0 0 0 0LAX DL DL 757 183 1.0 1.0 0 0 183 183 0 0 0LAX DL DL 320 148 1.0 0 0 148 0 0 0 0LAX DL DL 319 124 1.0 0 0 124 0 0 0 0LAX DL DL 753 224 3.0 3.0 2.0 0 0 672 672 448 0 0LAX DL DL 763 262 0 0 0 0 0 0 0LAX DL DL 764 285 0 0 0 0 0 0 0LAX DL DL 738 160 2.0 4.0 4.0 3.0 0 0 0 320 640 640 480LAX DL DL NGC 180 3.0 3.0 0 0 0 0 0 540 540LAX DL DL NGD 225 1.0 0 0 0 0 0 0 225LAX SY SY 738 168 0.9 1.0 1.5 1.3 1.2 1.4 1.3 1.4 1.5 248 223 202 235 218 235 252LAX WN WN 73G 137 2.0 2.0 3.0 3.0 0 0 0 274 274 411 411LAX F9 F9 319 132 0.0 0.0 0.0 0.0 0 0 0 0 0 0 0ONT NW NW 320 148 1.4 0.0 0.0 0.0 0 0 0 0 0 0 0ONT NW NW 319 124 0.6 0.0 0.0 0.0 0 0 0 0 0 0 0ONT DL DL 319 124 0 0 0 0 0 0 0ONT DL DL 738 160 2.0 2.0 3.0 0 0 0 0 320 320 480SNA NW NW 320 148 0.0 0.0 0.0 0.0 1 0 0 0 0 0 0SNA NW NW 319 124 2.9 2.9 2.9 3.0 358 368 0 0 0 0 0SNA DL DL 320 148 0 0 0 0 0 0 0SNA DL DL 319 124 3.0 0 0 372 0 0 0 0SNA DL DL 738 160 3.0 3.0 3.0 3.0 0 0 0 480 480 480 480SNA DL DL NGA 120 0 0 0 0 0 0 0
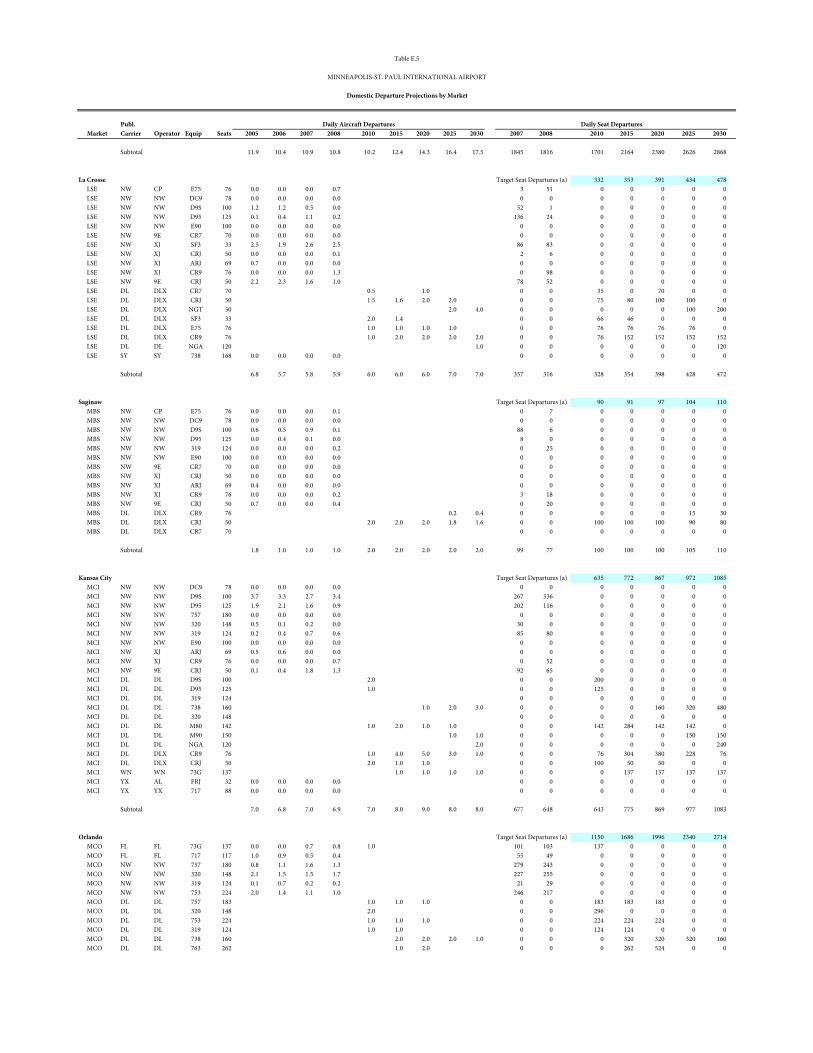
Publ.x Market Carrier Operator Equip Seats 2005 2006 2007 2008 x 2010 2015 2020 2025 2030 x 2007 2008 x 2010 2015 2020 2025 2030
Table E.5
MINNEAPOLIS-ST. PAUL INTERNATIONAL AIRPORT
Domestic Departure Projections by Market
Daily Aircraft Departures Daily Seat Departures
Subtotal 11.9 10.4 10.9 10.8 10.2 12.4 14.3 16.4 17.5 1845 1816 1701 2164 2380 2626 2868
La Crosse Target Seat Departures (a) 332 353 391 434 478LSE NW CP E75 76 0.0 0.0 0.0 0.7 3 51 0 0 0 0 0LSE NW NW DC9 78 0.0 0.0 0.0 0.0 0 0 0 0 0 0 0LSE NW NW D9S 100 1.2 1.2 0.5 0.0 52 1 0 0 0 0 0LSE NW NW D95 125 0.1 0.4 1.1 0.2 136 24 0 0 0 0 0LSE NW NW E90 100 0.0 0.0 0.0 0.0 0 0 0 0 0 0 0LSE NW 9E CR7 70 0.0 0.0 0.0 0.0 0 0 0 0 0 0 0LSE NW XJ SF3 33 2.5 1.9 2.6 2.5 86 83 0 0 0 0 0LSE NW XJ CRJ 50 0.0 0.0 0.0 0.1 2 6 0 0 0 0 0LSE NW XJ ARJ 69 0.7 0.0 0.0 0.0 0 0 0 0 0 0 0LSE NW XJ CR9 76 0.0 0.0 0.0 1.3 0 98 0 0 0 0 0LSE NW 9E CRJ 50 2.2 2.3 1.6 1.0 78 52 0 0 0 0 0LSE DL DLX CR7 70 0.5 1.0 0 0 35 0 70 0 0LSE DL DLX CRJ 50 1.5 1.6 2.0 2.0 0 0 75 80 100 100 0LSE DL DLX NGT 50 2.0 4.0 0 0 0 0 0 100 200LSE DL DLX SF3 33 2.0 1.4 0 0 66 46 0 0 0LSE DL DLX E75 76 1.0 1.0 1.0 1.0 0 0 76 76 76 76 0LSE DL DLX CR9 76 1.0 2.0 2.0 2.0 2.0 0 0 76 152 152 152 152LSE DL DL NGA 120 1.0 0 0 0 0 0 0 120LSE SY SY 738 168 0.0 0.0 0.0 0.0 0 0 0 0 0 0 0
Subtotal 6.8 5.7 5.8 5.9 6.0 6.0 6.0 7.0 7.0 357 316 328 354 398 428 472
Saginaw Target Seat Departures (a) 90 91 97 104 110MBS NW CP E75 76 0.0 0.0 0.0 0.1 0 7 0 0 0 0 0MBS NW NW DC9 78 0.0 0.0 0.0 0.0 0 0 0 0 0 0 0MBS NW NW D9S 100 0.6 0.5 0.9 0.1 88 6 0 0 0 0 0MBS NW NW D95 125 0.0 0.4 0.1 0.0 8 0 0 0 0 0 0MBS NW NW 319 124 0.0 0.0 0.0 0.2 0 25 0 0 0 0 0MBS NW NW E90 100 0.0 0.0 0.0 0.0 0 0 0 0 0 0 0MBS NW 9E CR7 70 0.0 0.0 0.0 0.0 0 0 0 0 0 0 0MBS NW XJ CRJ 50 0.0 0.0 0.0 0.0 0 0 0 0 0 0 0MBS NW XJ ARJ 69 0.4 0.0 0.0 0.0 0 0 0 0 0 0 0MBS NW XJ CR9 76 0.0 0.0 0.0 0.2 3 18 0 0 0 0 0MBS NW 9E CRJ 50 0.7 0.0 0.0 0.4 0 20 0 0 0 0 0MBS DL DLX CR9 76 0.2 0.4 0 0 0 0 0 15 30MBS DL DLX CRJ 50 2.0 2.0 2.0 1.8 1.6 0 0 100 100 100 90 80MBS DL DLX CR7 70 0 0 0 0 0 0 0
Subtotal 1.8 1.0 1.0 1.0 2.0 2.0 2.0 2.0 2.0 99 77 100 100 100 105 110
Kansas City Target Seat Departures (a) 635 772 867 972 1085MCI NW NW DC9 78 0.0 0.0 0.0 0.0 0 0 0 0 0 0 0MCI NW NW D9S 100 3.7 3.3 2.7 3.4 267 336 0 0 0 0 0MCI NW NW D95 125 1.9 2.1 1.6 0.9 202 116 0 0 0 0 0MCI NW NW 757 180 0.0 0.0 0.0 0.0 0 0 0 0 0 0 0MCI NW NW 320 148 0.5 0.1 0.2 0.0 30 0 0 0 0 0 0MCI NW NW 319 124 0.2 0.4 0.7 0.6 85 80 0 0 0 0 0MCI NW NW E90 100 0.0 0.0 0.0 0.0 0 0 0 0 0 0 0MCI NW XJ ARJ 69 0.5 0.6 0.0 0.0 0 0 0 0 0 0 0MCI NW XJ CR9 76 0.0 0.0 0.0 0.7 0 52 0 0 0 0 0MCI NW 9E CRJ 50 0.1 0.4 1.8 1.3 92 65 0 0 0 0 0MCI DL DL D9S 100 2.0 0 0 200 0 0 0 0MCI DL DL D95 125 1.0 0 0 125 0 0 0 0MCI DL DL 319 124 0 0 0 0 0 0 0MCI DL DL 738 160 1.0 2.0 3.0 0 0 0 0 160 320 480MCI DL DL 320 148 0 0 0 0 0 0 0MCI DL DL M80 142 1.0 2.0 1.0 1.0 0 0 142 284 142 142 0MCI DL DL M90 150 1.0 1.0 0 0 0 0 0 150 150MCI DL DL NGA 120 2.0 0 0 0 0 0 0 240MCI DL DLX CR9 76 1.0 4.0 5.0 3.0 1.0 0 0 76 304 380 228 76MCI DL DLX CRJ 50 2.0 1.0 1.0 0 0 100 50 50 0 0MCI WN WN 73G 137 1.0 1.0 1.0 1.0 0 0 0 137 137 137 137MCI YX AL FRJ 32 0.0 0.0 0.0 0.0 0 0 0 0 0 0 0MCI YX YX 717 88 0.0 0.0 0.0 0.0 0 0 0 0 0 0 0
Subtotal 7.0 6.8 7.0 6.9 7.0 8.0 9.0 8.0 8.0 677 648 643 775 869 977 1083
Orlando Target Seat Departures (a) 1150 1686 1996 2340 2714MCO FL FL 73G 137 0.0 0.0 0.7 0.8 1.0 101 103 137 0 0 0 0MCO FL FL 717 117 1.0 0.9 0.5 0.4 55 49 0 0 0 0 0MCO NW NW 757 180 0.8 1.1 1.6 1.3 279 243 0 0 0 0 0MCO NW NW 320 148 2.1 1.5 1.5 1.7 227 255 0 0 0 0 0MCO NW NW 319 124 0.1 0.7 0.2 0.2 21 29 0 0 0 0 0MCO NW NW 753 224 2.0 1.4 1.1 1.0 246 217 0 0 0 0 0MCO DL DL 757 183 1.0 1.0 1.0 0 0 183 183 183 0 0MCO DL DL 320 148 2.0 0 0 296 0 0 0 0MCO DL DL 753 224 1.0 1.0 1.0 0 0 224 224 224 0 0MCO DL DL 319 124 1.0 1.0 0 0 124 124 0 0 0MCO DL DL 738 160 2.0 2.0 2.0 1.0 0 0 0 320 320 320 160MCO DL DL 763 262 1.0 2.0 0 0 0 262 524 0 0
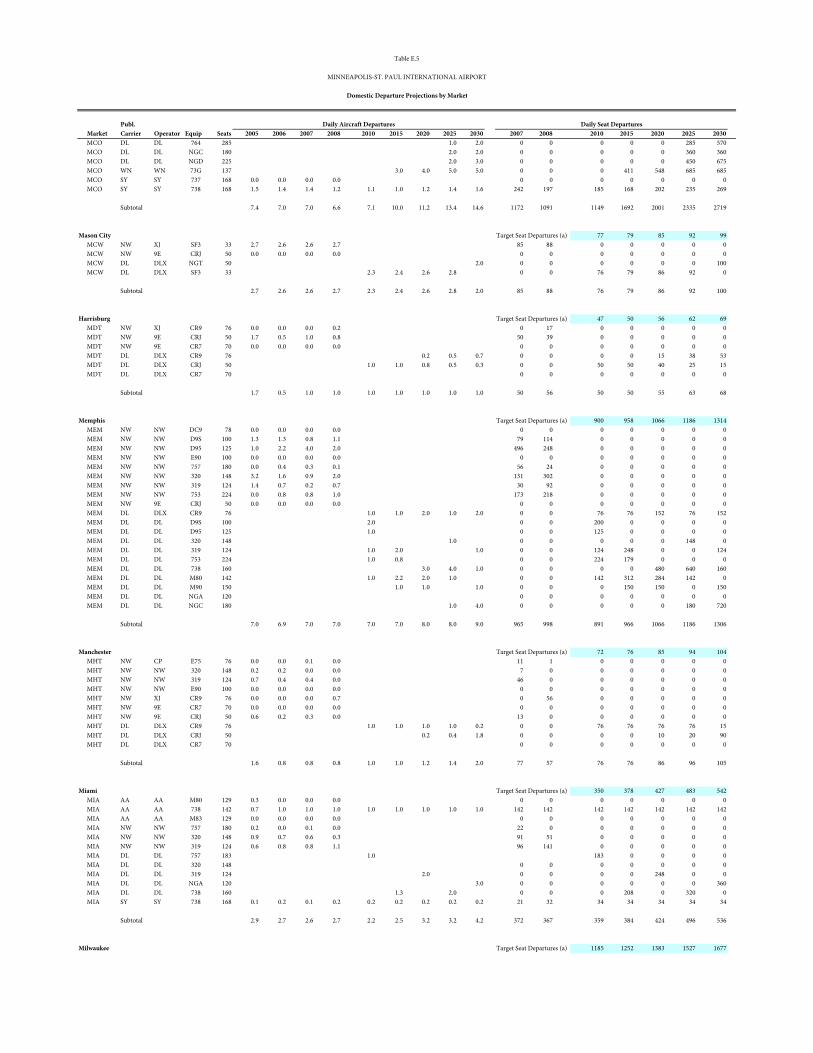
Publ.x Market Carrier Operator Equip Seats 2005 2006 2007 2008 x 2010 2015 2020 2025 2030 x 2007 2008 x 2010 2015 2020 2025 2030
Table E.5
MINNEAPOLIS-ST. PAUL INTERNATIONAL AIRPORT
Domestic Departure Projections by Market
Daily Aircraft Departures Daily Seat Departures
MCO DL DL 764 285 1.0 2.0 0 0 0 0 0 285 570MCO DL DL NGC 180 2.0 2.0 0 0 0 0 0 360 360MCO DL DL NGD 225 2.0 3.0 0 0 0 0 0 450 675MCO WN WN 73G 137 3.0 4.0 5.0 5.0 0 0 0 411 548 685 685MCO SY SY 737 168 0.0 0.0 0.0 0.0 0 0 0 0 0 0 0MCO SY SY 738 168 1.5 1.4 1.4 1.2 1.1 1.0 1.2 1.4 1.6 242 197 185 168 202 235 269
Subtotal 7.4 7.0 7.0 6.6 7.1 10.0 11.2 13.4 14.6 1172 1091 1149 1692 2001 2335 2719
Mason City Target Seat Departures (a) 77 79 85 92 99MCW NW XJ SF3 33 2.7 2.6 2.6 2.7 85 88 0 0 0 0 0MCW NW 9E CRJ 50 0.0 0.0 0.0 0.0 0 0 0 0 0 0 0MCW DL DLX NGT 50 2.0 0 0 0 0 0 0 100MCW DL DLX SF3 33 2.3 2.4 2.6 2.8 0 0 76 79 86 92 0
Subtotal 2.7 2.6 2.6 2.7 2.3 2.4 2.6 2.8 2.0 85 88 76 79 86 92 100
Harrisburg Target Seat Departures (a) 47 50 56 62 69MDT NW XJ CR9 76 0.0 0.0 0.0 0.2 0 17 0 0 0 0 0MDT NW 9E CRJ 50 1.7 0.5 1.0 0.8 50 39 0 0 0 0 0MDT NW 9E CR7 70 0.0 0.0 0.0 0.0 0 0 0 0 0 0 0MDT DL DLX CR9 76 0.2 0.5 0.7 0 0 0 0 15 38 53MDT DL DLX CRJ 50 1.0 1.0 0.8 0.5 0.3 0 0 50 50 40 25 15MDT DL DLX CR7 70 0 0 0 0 0 0 0
Subtotal 1.7 0.5 1.0 1.0 1.0 1.0 1.0 1.0 1.0 50 56 50 50 55 63 68
Memphis Target Seat Departures (a) 900 958 1066 1186 1314MEM NW NW DC9 78 0.0 0.0 0.0 0.0 0 0 0 0 0 0 0MEM NW NW D9S 100 1.3 1.3 0.8 1.1 79 114 0 0 0 0 0MEM NW NW D95 125 1.0 2.2 4.0 2.0 496 248 0 0 0 0 0MEM NW NW E90 100 0.0 0.0 0.0 0.0 0 0 0 0 0 0 0MEM NW NW 757 180 0.0 0.4 0.3 0.1 56 24 0 0 0 0 0MEM NW NW 320 148 3.2 1.6 0.9 2.0 131 302 0 0 0 0 0MEM NW NW 319 124 1.4 0.7 0.2 0.7 30 92 0 0 0 0 0MEM NW NW 753 224 0.0 0.8 0.8 1.0 173 218 0 0 0 0 0MEM NW 9E CRJ 50 0.0 0.0 0.0 0.0 0 0 0 0 0 0 0MEM DL DLX CR9 76 1.0 1.0 2.0 1.0 2.0 0 0 76 76 152 76 152MEM DL DL D9S 100 2.0 0 0 200 0 0 0 0MEM DL DL D95 125 1.0 0 0 125 0 0 0 0MEM DL DL 320 148 1.0 0 0 0 0 0 148 0MEM DL DL 319 124 1.0 2.0 1.0 0 0 124 248 0 0 124MEM DL DL 753 224 1.0 0.8 0 0 224 179 0 0 0MEM DL DL 738 160 3.0 4.0 1.0 0 0 0 0 480 640 160MEM DL DL M80 142 1.0 2.2 2.0 1.0 0 0 142 312 284 142 0MEM DL DL M90 150 1.0 1.0 1.0 0 0 0 150 150 0 150MEM DL DL NGA 120 0 0 0 0 0 0 0MEM DL DL NGC 180 1.0 4.0 0 0 0 0 0 180 720
Subtotal 7.0 6.9 7.0 7.0 7.0 7.0 8.0 8.0 9.0 965 998 891 966 1066 1186 1306
Manchester Target Seat Departures (a) 72 76 85 94 104MHT NW CP E75 76 0.0 0.0 0.1 0.0 11 1 0 0 0 0 0MHT NW NW 320 148 0.2 0.2 0.0 0.0 7 0 0 0 0 0 0MHT NW NW 319 124 0.7 0.4 0.4 0.0 46 0 0 0 0 0 0MHT NW NW E90 100 0.0 0.0 0.0 0.0 0 0 0 0 0 0 0MHT NW XJ CR9 76 0.0 0.0 0.0 0.7 0 56 0 0 0 0 0MHT NW 9E CR7 70 0.0 0.0 0.0 0.0 0 0 0 0 0 0 0MHT NW 9E CRJ 50 0.6 0.2 0.3 0.0 13 0 0 0 0 0 0MHT DL DLX CR9 76 1.0 1.0 1.0 1.0 0.2 0 0 76 76 76 76 15MHT DL DLX CRJ 50 0.2 0.4 1.8 0 0 0 0 10 20 90MHT DL DLX CR7 70 0 0 0 0 0 0 0
Subtotal 1.6 0.8 0.8 0.8 1.0 1.0 1.2 1.4 2.0 77 57 76 76 86 96 105
Miami Target Seat Departures (a) 350 378 427 483 542MIA AA AA M80 129 0.3 0.0 0.0 0.0 0 0 0 0 0 0 0MIA AA AA 738 142 0.7 1.0 1.0 1.0 1.0 1.0 1.0 1.0 1.0 142 142 142 142 142 142 142MIA AA AA M83 129 0.0 0.0 0.0 0.0 0 0 0 0 0 0 0MIA NW NW 757 180 0.2 0.0 0.1 0.0 22 0 0 0 0 0 0MIA NW NW 320 148 0.9 0.7 0.6 0.3 91 51 0 0 0 0 0MIA NW NW 319 124 0.6 0.8 0.8 1.1 96 141 0 0 0 0 0MIA DL DL 757 183 1.0 183 0 0 0 0MIA DL DL 320 148 0 0 0 0 0 0 0MIA DL DL 319 124 2.0 0 0 0 0 248 0 0MIA DL DL NGA 120 3.0 0 0 0 0 0 0 360MIA DL DL 738 160 1.3 2.0 0 0 0 208 0 320 0MIA SY SY 738 168 0.1 0.2 0.1 0.2 0.2 0.2 0.2 0.2 0.2 21 32 34 34 34 34 34
Subtotal 2.9 2.7 2.6 2.7 2.2 2.5 3.2 3.2 4.2 372 367 359 384 424 496 536
Milwaukee Target Seat Departures (a) 1185 1252 1383 1527 1677
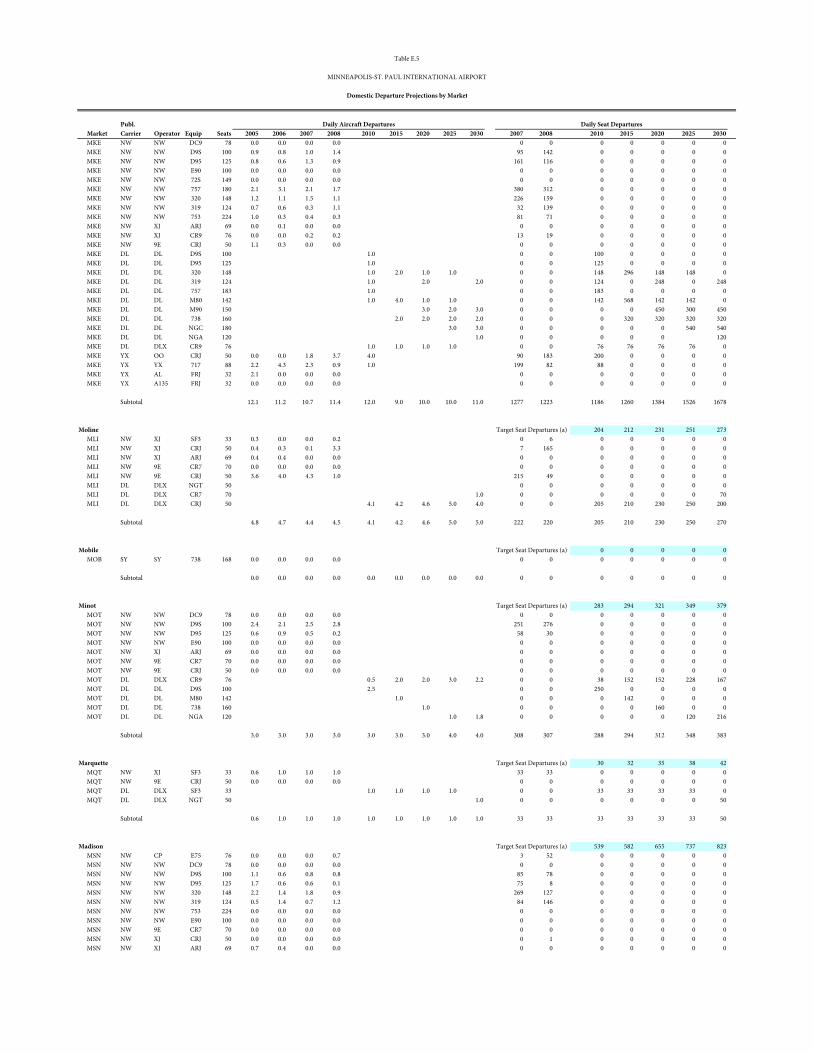
Publ.x Market Carrier Operator Equip Seats 2005 2006 2007 2008 x 2010 2015 2020 2025 2030 x 2007 2008 x 2010 2015 2020 2025 2030
Table E.5
MINNEAPOLIS-ST. PAUL INTERNATIONAL AIRPORT
Domestic Departure Projections by Market
Daily Aircraft Departures Daily Seat Departures
MKE NW NW DC9 78 0.0 0.0 0.0 0.0 0 0 0 0 0 0 0MKE NW NW D9S 100 0.9 0.8 1.0 1.4 95 142 0 0 0 0 0MKE NW NW D95 125 0.8 0.6 1.3 0.9 161 116 0 0 0 0 0MKE NW NW E90 100 0.0 0.0 0.0 0.0 0 0 0 0 0 0 0MKE NW NW 72S 149 0.0 0.0 0.0 0.0 0 0 0 0 0 0 0MKE NW NW 757 180 2.1 3.1 2.1 1.7 380 312 0 0 0 0 0MKE NW NW 320 148 1.2 1.1 1.5 1.1 226 159 0 0 0 0 0MKE NW NW 319 124 0.7 0.6 0.3 1.1 32 139 0 0 0 0 0MKE NW NW 753 224 1.0 0.3 0.4 0.3 81 71 0 0 0 0 0MKE NW XJ ARJ 69 0.0 0.1 0.0 0.0 0 0 0 0 0 0 0MKE NW XJ CR9 76 0.0 0.0 0.2 0.2 13 19 0 0 0 0 0MKE NW 9E CRJ 50 1.1 0.3 0.0 0.0 0 0 0 0 0 0 0MKE DL DL D9S 100 1.0 0 0 100 0 0 0 0MKE DL DL D95 125 1.0 0 0 125 0 0 0 0MKE DL DL 320 148 1.0 2.0 1.0 1.0 0 0 148 296 148 148 0MKE DL DL 319 124 1.0 2.0 2.0 0 0 124 0 248 0 248MKE DL DL 757 183 1.0 0 0 183 0 0 0 0MKE DL DL M80 142 1.0 4.0 1.0 1.0 0 0 142 568 142 142 0MKE DL DL M90 150 3.0 2.0 3.0 0 0 0 0 450 300 450MKE DL DL 738 160 2.0 2.0 2.0 2.0 0 0 0 320 320 320 320MKE DL DL NGC 180 3.0 3.0 0 0 0 0 0 540 540MKE DL DL NGA 120 1.0 0 0 0 0 0 120MKE DL DLX CR9 76 1.0 1.0 1.0 1.0 0 0 76 76 76 76 0MKE YX OO CRJ 50 0.0 0.0 1.8 3.7 4.0 90 183 200 0 0 0 0MKE YX YX 717 88 2.2 4.3 2.3 0.9 1.0 199 82 88 0 0 0 0MKE YX AL FRJ 32 2.1 0.0 0.0 0.0 0 0 0 0 0 0 0MKE YX A135 FRJ 32 0.0 0.0 0.0 0.0 0 0 0 0 0 0 0
Subtotal 12.1 11.2 10.7 11.4 12.0 9.0 10.0 10.0 11.0 1277 1223 1186 1260 1384 1526 1678
Moline Target Seat Departures (a) 204 212 231 251 273MLI NW XJ SF3 33 0.3 0.0 0.0 0.2 0 6 0 0 0 0 0MLI NW XJ CRJ 50 0.4 0.3 0.1 3.3 7 165 0 0 0 0 0MLI NW XJ ARJ 69 0.4 0.4 0.0 0.0 0 0 0 0 0 0 0MLI NW 9E CR7 70 0.0 0.0 0.0 0.0 0 0 0 0 0 0 0MLI NW 9E CRJ 50 3.6 4.0 4.3 1.0 215 49 0 0 0 0 0MLI DL DLX NGT 50 0 0 0 0 0 0 0MLI DL DLX CR7 70 1.0 0 0 0 0 0 0 70MLI DL DLX CRJ 50 4.1 4.2 4.6 5.0 4.0 0 0 205 210 230 250 200
Subtotal 4.8 4.7 4.4 4.5 4.1 4.2 4.6 5.0 5.0 222 220 205 210 230 250 270
Mobile Target Seat Departures (a) 0 0 0 0 0MOB SY SY 738 168 0.0 0.0 0.0 0.0 0 0 0 0 0 0 0
Subtotal 0.0 0.0 0.0 0.0 0.0 0.0 0.0 0.0 0.0 0 0 0 0 0 0 0
Minot Target Seat Departures (a) 283 294 321 349 379MOT NW NW DC9 78 0.0 0.0 0.0 0.0 0 0 0 0 0 0 0MOT NW NW D9S 100 2.4 2.1 2.5 2.8 251 276 0 0 0 0 0MOT NW NW D95 125 0.6 0.9 0.5 0.2 58 30 0 0 0 0 0MOT NW NW E90 100 0.0 0.0 0.0 0.0 0 0 0 0 0 0 0MOT NW XJ ARJ 69 0.0 0.0 0.0 0.0 0 0 0 0 0 0 0MOT NW 9E CR7 70 0.0 0.0 0.0 0.0 0 0 0 0 0 0 0MOT NW 9E CRJ 50 0.0 0.0 0.0 0.0 0 0 0 0 0 0 0MOT DL DLX CR9 76 0.5 2.0 2.0 3.0 2.2 0 0 38 152 152 228 167MOT DL DL D9S 100 2.5 0 0 250 0 0 0 0MOT DL DL M80 142 1.0 0 0 0 142 0 0 0MOT DL DL 738 160 1.0 0 0 0 0 160 0 0MOT DL DL NGA 120 1.0 1.8 0 0 0 0 0 120 216
Subtotal 3.0 3.0 3.0 3.0 3.0 3.0 3.0 4.0 4.0 308 307 288 294 312 348 383
Marquette Target Seat Departures (a) 30 32 35 38 42MQT NW XJ SF3 33 0.6 1.0 1.0 1.0 33 33 0 0 0 0 0MQT NW 9E CRJ 50 0.0 0.0 0.0 0.0 0 0 0 0 0 0 0MQT DL DLX SF3 33 1.0 1.0 1.0 1.0 0 0 33 33 33 33 0MQT DL DLX NGT 50 1.0 0 0 0 0 0 0 50
Subtotal 0.6 1.0 1.0 1.0 1.0 1.0 1.0 1.0 1.0 33 33 33 33 33 33 50
Madison Target Seat Departures (a) 539 582 655 737 823MSN NW CP E75 76 0.0 0.0 0.0 0.7 3 52 0 0 0 0 0MSN NW NW DC9 78 0.0 0.0 0.0 0.0 0 0 0 0 0 0 0MSN NW NW D9S 100 1.1 0.6 0.8 0.8 85 78 0 0 0 0 0MSN NW NW D95 125 1.7 0.6 0.6 0.1 75 8 0 0 0 0 0MSN NW NW 320 148 2.2 1.4 1.8 0.9 269 127 0 0 0 0 0MSN NW NW 319 124 0.5 1.4 0.7 1.2 84 146 0 0 0 0 0MSN NW NW 753 224 0.0 0.0 0.0 0.0 0 0 0 0 0 0 0MSN NW NW E90 100 0.0 0.0 0.0 0.0 0 0 0 0 0 0 0MSN NW 9E CR7 70 0.0 0.0 0.0 0.0 0 0 0 0 0 0 0MSN NW XJ CRJ 50 0.0 0.0 0.0 0.0 0 1 0 0 0 0 0MSN NW XJ ARJ 69 0.7 0.4 0.0 0.0 0 0 0 0 0 0 0
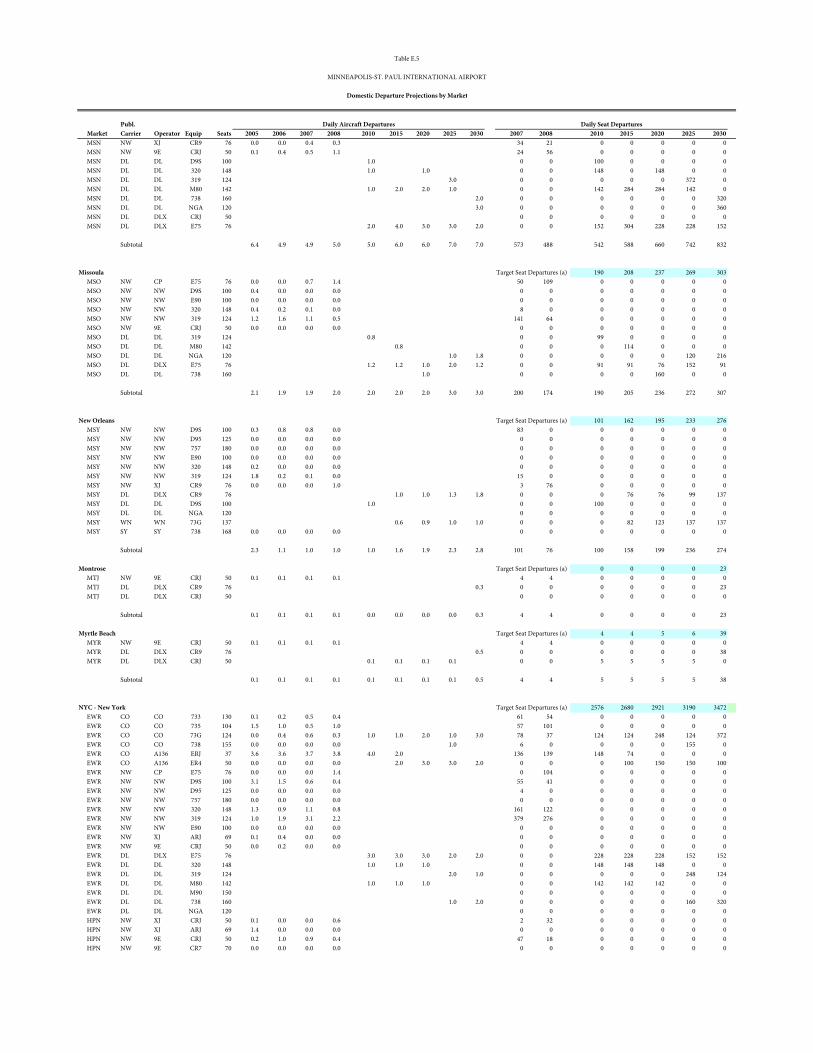
Publ.x Market Carrier Operator Equip Seats 2005 2006 2007 2008 x 2010 2015 2020 2025 2030 x 2007 2008 x 2010 2015 2020 2025 2030
Table E.5
MINNEAPOLIS-ST. PAUL INTERNATIONAL AIRPORT
Domestic Departure Projections by Market
Daily Aircraft Departures Daily Seat Departures
MSN NW XJ CR9 76 0.0 0.0 0.4 0.3 34 21 0 0 0 0 0MSN NW 9E CRJ 50 0.1 0.4 0.5 1.1 24 56 0 0 0 0 0MSN DL DL D9S 100 1.0 0 0 100 0 0 0 0MSN DL DL 320 148 1.0 1.0 0 0 148 0 148 0 0MSN DL DL 319 124 3.0 0 0 0 0 0 372 0MSN DL DL M80 142 1.0 2.0 2.0 1.0 0 0 142 284 284 142 0MSN DL DL 738 160 2.0 0 0 0 0 0 0 320MSN DL DL NGA 120 3.0 0 0 0 0 0 0 360MSN DL DLX CRJ 50 0 0 0 0 0 0 0MSN DL DLX E75 76 2.0 4.0 3.0 3.0 2.0 0 0 152 304 228 228 152
Subtotal 6.4 4.9 4.9 5.0 5.0 6.0 6.0 7.0 7.0 573 488 542 588 660 742 832
Missoula Target Seat Departures (a) 190 208 237 269 303MSO NW CP E75 76 0.0 0.0 0.7 1.4 50 109 0 0 0 0 0MSO NW NW D9S 100 0.4 0.0 0.0 0.0 0 0 0 0 0 0 0MSO NW NW E90 100 0.0 0.0 0.0 0.0 0 0 0 0 0 0 0MSO NW NW 320 148 0.4 0.2 0.1 0.0 8 0 0 0 0 0 0MSO NW NW 319 124 1.2 1.6 1.1 0.5 141 64 0 0 0 0 0MSO NW 9E CRJ 50 0.0 0.0 0.0 0.0 0 0 0 0 0 0 0MSO DL DL 319 124 0.8 0 0 99 0 0 0 0MSO DL DL M80 142 0.8 0 0 0 114 0 0 0MSO DL DL NGA 120 1.0 1.8 0 0 0 0 0 120 216MSO DL DLX E75 76 1.2 1.2 1.0 2.0 1.2 0 0 91 91 76 152 91MSO DL DL 738 160 1.0 0 0 0 0 160 0 0
Subtotal 2.1 1.9 1.9 2.0 2.0 2.0 2.0 3.0 3.0 200 174 190 205 236 272 307
New Orleans Target Seat Departures (a) 101 162 195 233 276MSY NW NW D9S 100 0.3 0.8 0.8 0.0 83 0 0 0 0 0 0MSY NW NW D95 125 0.0 0.0 0.0 0.0 0 0 0 0 0 0 0MSY NW NW 757 180 0.0 0.0 0.0 0.0 0 0 0 0 0 0 0MSY NW NW E90 100 0.0 0.0 0.0 0.0 0 0 0 0 0 0 0MSY NW NW 320 148 0.2 0.0 0.0 0.0 0 0 0 0 0 0 0MSY NW NW 319 124 1.8 0.2 0.1 0.0 15 0 0 0 0 0 0MSY NW XJ CR9 76 0.0 0.0 0.0 1.0 3 76 0 0 0 0 0MSY DL DLX CR9 76 1.0 1.0 1.3 1.8 0 0 0 76 76 99 137MSY DL DL D9S 100 1.0 0 0 100 0 0 0 0MSY DL DL NGA 120 0 0 0 0 0 0 0MSY WN WN 73G 137 0.6 0.9 1.0 1.0 0 0 0 82 123 137 137MSY SY SY 738 168 0.0 0.0 0.0 0.0 0 0 0 0 0 0 0
Subtotal 2.3 1.1 1.0 1.0 1.0 1.6 1.9 2.3 2.8 101 76 100 158 199 236 274
Montrose Target Seat Departures (a) 0 0 0 0 23MTJ NW 9E CRJ 50 0.1 0.1 0.1 0.1 4 4 0 0 0 0 0MTJ DL DLX CR9 76 0.3 0 0 0 0 0 0 23MTJ DL DLX CRJ 50 0 0 0 0 0 0 0
Subtotal 0.1 0.1 0.1 0.1 0.0 0.0 0.0 0.0 0.3 4 4 0 0 0 0 23
Myrtle Beach Target Seat Departures (a) 4 4 5 6 39MYR NW 9E CRJ 50 0.1 0.1 0.1 0.1 4 4 0 0 0 0 0MYR DL DLX CR9 76 0.5 0 0 0 0 0 0 38MYR DL DLX CRJ 50 0.1 0.1 0.1 0.1 0 0 5 5 5 5 0
Subtotal 0.1 0.1 0.1 0.1 0.1 0.1 0.1 0.1 0.5 4 4 5 5 5 5 38
NYC - New York Target Seat Departures (a) 2576 2680 2921 3190 3472EWR CO CO 733 130 0.1 0.2 0.5 0.4 61 54 0 0 0 0 0EWR CO CO 735 104 1.5 1.0 0.5 1.0 57 101 0 0 0 0 0EWR CO CO 73G 124 0.0 0.4 0.6 0.3 1.0 1.0 2.0 1.0 3.0 78 37 124 124 248 124 372EWR CO CO 738 155 0.0 0.0 0.0 0.0 1.0 6 0 0 0 0 155 0EWR CO A136 ERJ 37 3.6 3.6 3.7 3.8 4.0 2.0 136 139 148 74 0 0 0EWR CO A136 ER4 50 0.0 0.0 0.0 0.0 2.0 3.0 3.0 2.0 0 0 0 100 150 150 100EWR NW CP E75 76 0.0 0.0 0.0 1.4 0 104 0 0 0 0 0EWR NW NW D9S 100 3.1 1.5 0.6 0.4 55 41 0 0 0 0 0EWR NW NW D95 125 0.0 0.0 0.0 0.0 4 0 0 0 0 0 0EWR NW NW 757 180 0.0 0.0 0.0 0.0 0 0 0 0 0 0 0EWR NW NW 320 148 1.3 0.9 1.1 0.8 161 122 0 0 0 0 0EWR NW NW 319 124 1.0 1.9 3.1 2.2 379 276 0 0 0 0 0EWR NW NW E90 100 0.0 0.0 0.0 0.0 0 0 0 0 0 0 0EWR NW XJ ARJ 69 0.1 0.4 0.0 0.0 0 0 0 0 0 0 0EWR NW 9E CRJ 50 0.0 0.2 0.0 0.0 0 0 0 0 0 0 0EWR DL DLX E75 76 3.0 3.0 3.0 2.0 2.0 0 0 228 228 228 152 152EWR DL DL 320 148 1.0 1.0 1.0 0 0 148 148 148 0 0EWR DL DL 319 124 2.0 1.0 0 0 0 0 0 248 124EWR DL DL M80 142 1.0 1.0 1.0 0 0 142 142 142 0 0EWR DL DL M90 150 0 0 0 0 0 0 0EWR DL DL 738 160 1.0 2.0 0 0 0 0 0 160 320EWR DL DL NGA 120 0 0 0 0 0 0 0HPN NW XJ CRJ 50 0.1 0.0 0.0 0.6 2 32 0 0 0 0 0HPN NW XJ ARJ 69 1.4 0.0 0.0 0.0 0 0 0 0 0 0 0HPN NW 9E CRJ 50 0.2 1.0 0.9 0.4 47 18 0 0 0 0 0HPN NW 9E CR7 70 0.0 0.0 0.0 0.0 0 0 0 0 0 0 0
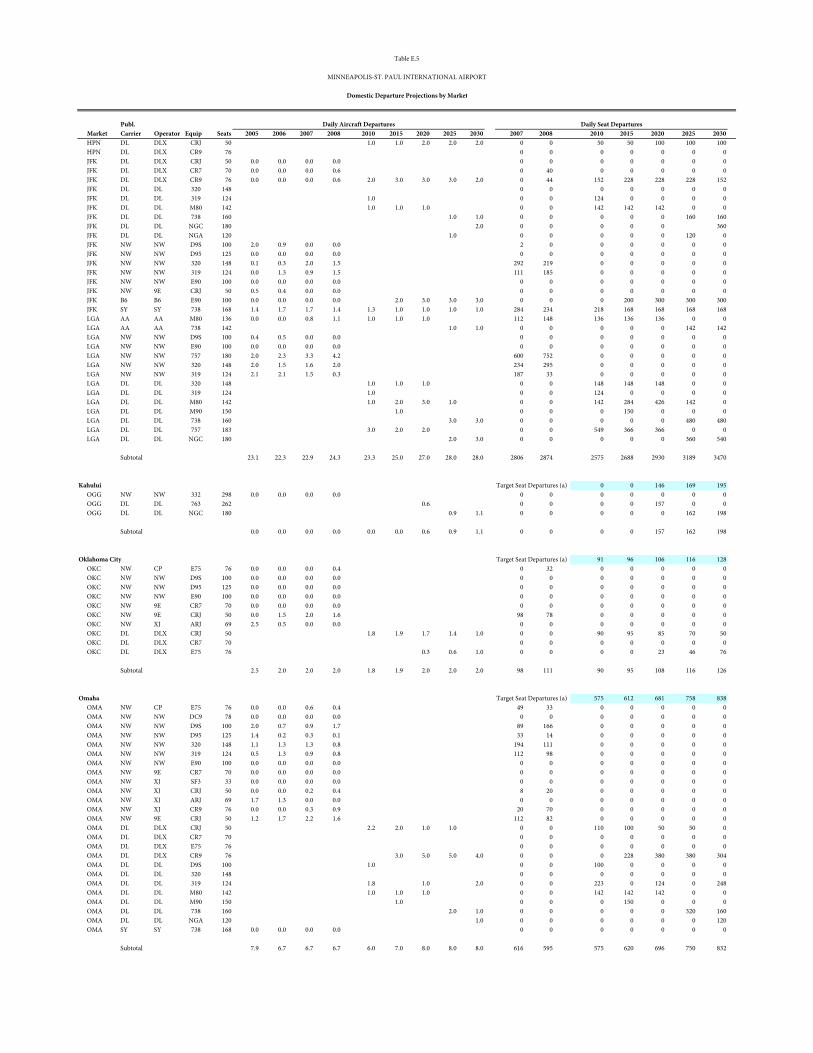
Publ.x Market Carrier Operator Equip Seats 2005 2006 2007 2008 x 2010 2015 2020 2025 2030 x 2007 2008 x 2010 2015 2020 2025 2030
Table E.5
MINNEAPOLIS-ST. PAUL INTERNATIONAL AIRPORT
Domestic Departure Projections by Market
Daily Aircraft Departures Daily Seat Departures
HPN DL DLX CRJ 50 1.0 1.0 2.0 2.0 2.0 0 0 50 50 100 100 100HPN DL DLX CR9 76 0 0 0 0 0 0 0JFK DL DLX CRJ 50 0.0 0.0 0.0 0.0 0 0 0 0 0 0 0JFK DL DLX CR7 70 0.0 0.0 0.0 0.6 0 40 0 0 0 0 0JFK DL DLX CR9 76 0.0 0.0 0.0 0.6 2.0 3.0 3.0 3.0 2.0 0 44 152 228 228 228 152JFK DL DL 320 148 0 0 0 0 0 0 0JFK DL DL 319 124 1.0 0 0 124 0 0 0 0JFK DL DL M80 142 1.0 1.0 1.0 0 0 142 142 142 0 0JFK DL DL 738 160 1.0 1.0 0 0 0 0 0 160 160JFK DL DL NGC 180 2.0 0 0 0 0 0 360JFK DL DL NGA 120 1.0 0 0 0 0 0 120 0JFK NW NW D9S 100 2.0 0.9 0.0 0.0 2 0 0 0 0 0 0JFK NW NW D95 125 0.0 0.0 0.0 0.0 0 0 0 0 0 0 0JFK NW NW 320 148 0.1 0.3 2.0 1.5 292 219 0 0 0 0 0JFK NW NW 319 124 0.0 1.3 0.9 1.5 111 185 0 0 0 0 0JFK NW NW E90 100 0.0 0.0 0.0 0.0 0 0 0 0 0 0 0JFK NW 9E CRJ 50 0.5 0.4 0.0 0.0 0 0 0 0 0 0 0JFK B6 B6 E90 100 0.0 0.0 0.0 0.0 2.0 3.0 3.0 3.0 0 0 0 200 300 300 300JFK SY SY 738 168 1.4 1.7 1.7 1.4 1.3 1.0 1.0 1.0 1.0 284 234 218 168 168 168 168LGA AA AA M80 136 0.0 0.0 0.8 1.1 1.0 1.0 1.0 112 148 136 136 136 0 0LGA AA AA 738 142 1.0 1.0 0 0 0 0 0 142 142LGA NW NW D9S 100 0.4 0.5 0.0 0.0 0 0 0 0 0 0 0LGA NW NW E90 100 0.0 0.0 0.0 0.0 0 0 0 0 0 0 0LGA NW NW 757 180 2.0 2.3 3.3 4.2 600 752 0 0 0 0 0LGA NW NW 320 148 2.0 1.5 1.6 2.0 234 295 0 0 0 0 0LGA NW NW 319 124 2.1 2.1 1.5 0.3 187 33 0 0 0 0 0LGA DL DL 320 148 1.0 1.0 1.0 0 0 148 148 148 0 0LGA DL DL 319 124 1.0 0 0 124 0 0 0 0LGA DL DL M80 142 1.0 2.0 3.0 1.0 0 0 142 284 426 142 0LGA DL DL M90 150 1.0 0 0 0 150 0 0 0LGA DL DL 738 160 3.0 3.0 0 0 0 0 0 480 480LGA DL DL 757 183 3.0 2.0 2.0 0 0 549 366 366 0 0LGA DL DL NGC 180 2.0 3.0 0 0 0 0 0 360 540
Subtotal 23.1 22.3 22.9 24.3 23.3 25.0 27.0 28.0 28.0 2806 2874 2575 2688 2930 3189 3470
Kahului Target Seat Departures (a) 0 0 146 169 195OGG NW NW 332 298 0.0 0.0 0.0 0.0 0 0 0 0 0 0 0OGG DL DL 763 262 0.6 0 0 0 0 157 0 0OGG DL DL NGC 180 0.9 1.1 0 0 0 0 0 162 198
Subtotal 0.0 0.0 0.0 0.0 0.0 0.0 0.6 0.9 1.1 0 0 0 0 157 162 198
Oklahoma City Target Seat Departures (a) 91 96 106 116 128OKC NW CP E75 76 0.0 0.0 0.0 0.4 0 32 0 0 0 0 0OKC NW NW D9S 100 0.0 0.0 0.0 0.0 0 0 0 0 0 0 0OKC NW NW D95 125 0.0 0.0 0.0 0.0 0 0 0 0 0 0 0OKC NW NW E90 100 0.0 0.0 0.0 0.0 0 0 0 0 0 0 0OKC NW 9E CR7 70 0.0 0.0 0.0 0.0 0 0 0 0 0 0 0OKC NW 9E CRJ 50 0.0 1.5 2.0 1.6 98 78 0 0 0 0 0OKC NW XJ ARJ 69 2.5 0.5 0.0 0.0 0 0 0 0 0 0 0OKC DL DLX CRJ 50 1.8 1.9 1.7 1.4 1.0 0 0 90 95 85 70 50OKC DL DLX CR7 70 0 0 0 0 0 0 0OKC DL DLX E75 76 0.3 0.6 1.0 0 0 0 0 23 46 76
Subtotal 2.5 2.0 2.0 2.0 1.8 1.9 2.0 2.0 2.0 98 111 90 95 108 116 126
Omaha Target Seat Departures (a) 575 612 681 758 838OMA NW CP E75 76 0.0 0.0 0.6 0.4 49 33 0 0 0 0 0OMA NW NW DC9 78 0.0 0.0 0.0 0.0 0 0 0 0 0 0 0OMA NW NW D9S 100 2.0 0.7 0.9 1.7 89 166 0 0 0 0 0OMA NW NW D95 125 1.4 0.2 0.3 0.1 33 14 0 0 0 0 0OMA NW NW 320 148 1.1 1.3 1.3 0.8 194 111 0 0 0 0 0OMA NW NW 319 124 0.5 1.3 0.9 0.8 112 98 0 0 0 0 0OMA NW NW E90 100 0.0 0.0 0.0 0.0 0 0 0 0 0 0 0OMA NW 9E CR7 70 0.0 0.0 0.0 0.0 0 0 0 0 0 0 0OMA NW XJ SF3 33 0.0 0.0 0.0 0.0 0 0 0 0 0 0 0OMA NW XJ CRJ 50 0.0 0.0 0.2 0.4 8 20 0 0 0 0 0OMA NW XJ ARJ 69 1.7 1.3 0.0 0.0 0 0 0 0 0 0 0OMA NW XJ CR9 76 0.0 0.0 0.3 0.9 20 70 0 0 0 0 0OMA NW 9E CRJ 50 1.2 1.7 2.2 1.6 112 82 0 0 0 0 0OMA DL DLX CRJ 50 2.2 2.0 1.0 1.0 0 0 110 100 50 50 0OMA DL DLX CR7 70 0 0 0 0 0 0 0OMA DL DLX E75 76 0 0 0 0 0 0 0OMA DL DLX CR9 76 3.0 5.0 5.0 4.0 0 0 0 228 380 380 304OMA DL DL D9S 100 1.0 0 0 100 0 0 0 0OMA DL DL 320 148 0 0 0 0 0 0 0OMA DL DL 319 124 1.8 1.0 2.0 0 0 223 0 124 0 248OMA DL DL M80 142 1.0 1.0 1.0 0 0 142 142 142 0 0OMA DL DL M90 150 1.0 0 0 0 150 0 0 0OMA DL DL 738 160 2.0 1.0 0 0 0 0 0 320 160OMA DL DL NGA 120 1.0 0 0 0 0 0 0 120OMA SY SY 738 168 0.0 0.0 0.0 0.0 0 0 0 0 0 0 0
Subtotal 7.9 6.7 6.7 6.7 6.0 7.0 8.0 8.0 8.0 616 595 575 620 696 750 832
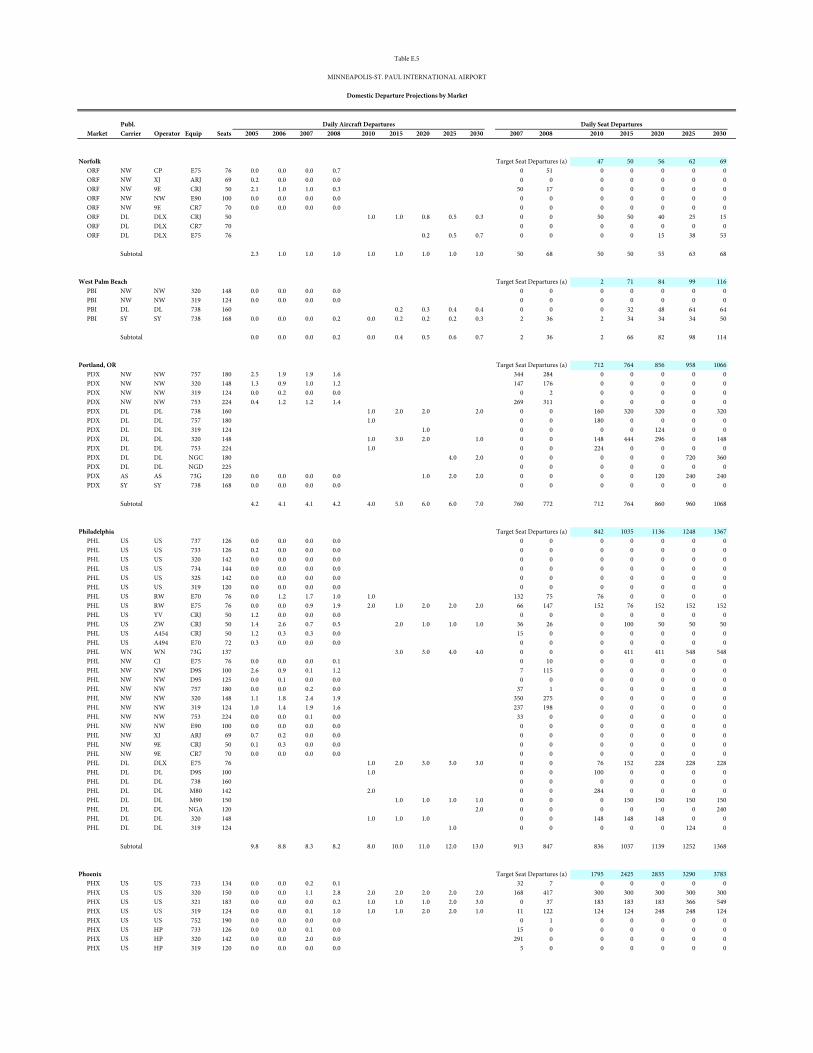
Publ.x Market Carrier Operator Equip Seats 2005 2006 2007 2008 x 2010 2015 2020 2025 2030 x 2007 2008 x 2010 2015 2020 2025 2030
Table E.5
MINNEAPOLIS-ST. PAUL INTERNATIONAL AIRPORT
Domestic Departure Projections by Market
Daily Aircraft Departures Daily Seat Departures
Norfolk Target Seat Departures (a) 47 50 56 62 69ORF NW CP E75 76 0.0 0.0 0.0 0.7 0 51 0 0 0 0 0ORF NW XJ ARJ 69 0.2 0.0 0.0 0.0 0 0 0 0 0 0 0ORF NW 9E CRJ 50 2.1 1.0 1.0 0.3 50 17 0 0 0 0 0ORF NW NW E90 100 0.0 0.0 0.0 0.0 0 0 0 0 0 0 0ORF NW 9E CR7 70 0.0 0.0 0.0 0.0 0 0 0 0 0 0 0ORF DL DLX CRJ 50 1.0 1.0 0.8 0.5 0.3 0 0 50 50 40 25 15ORF DL DLX CR7 70 0 0 0 0 0 0 0ORF DL DLX E75 76 0.2 0.5 0.7 0 0 0 0 15 38 53
Subtotal 2.3 1.0 1.0 1.0 1.0 1.0 1.0 1.0 1.0 50 68 50 50 55 63 68
West Palm Beach Target Seat Departures (a) 2 71 84 99 116PBI NW NW 320 148 0.0 0.0 0.0 0.0 0 0 0 0 0 0 0PBI NW NW 319 124 0.0 0.0 0.0 0.0 0 0 0 0 0 0 0PBI DL DL 738 160 0.2 0.3 0.4 0.4 0 0 0 32 48 64 64PBI SY SY 738 168 0.0 0.0 0.0 0.2 0.0 0.2 0.2 0.2 0.3 2 36 2 34 34 34 50
Subtotal 0.0 0.0 0.0 0.2 0.0 0.4 0.5 0.6 0.7 2 36 2 66 82 98 114
Portland, OR Target Seat Departures (a) 712 764 856 958 1066PDX NW NW 757 180 2.5 1.9 1.9 1.6 344 284 0 0 0 0 0PDX NW NW 320 148 1.3 0.9 1.0 1.2 147 176 0 0 0 0 0PDX NW NW 319 124 0.0 0.2 0.0 0.0 0 2 0 0 0 0 0PDX NW NW 753 224 0.4 1.2 1.2 1.4 269 311 0 0 0 0 0PDX DL DL 738 160 1.0 2.0 2.0 2.0 0 0 160 320 320 0 320PDX DL DL 757 180 1.0 0 0 180 0 0 0 0PDX DL DL 319 124 1.0 0 0 0 0 124 0 0PDX DL DL 320 148 1.0 3.0 2.0 1.0 0 0 148 444 296 0 148PDX DL DL 753 224 1.0 0 0 224 0 0 0 0PDX DL DL NGC 180 4.0 2.0 0 0 0 0 0 720 360PDX DL DL NGD 225 0 0 0 0 0 0 0PDX AS AS 73G 120 0.0 0.0 0.0 0.0 1.0 2.0 2.0 0 0 0 0 120 240 240PDX SY SY 738 168 0.0 0.0 0.0 0.0 0 0 0 0 0 0 0
Subtotal 4.2 4.1 4.1 4.2 4.0 5.0 6.0 6.0 7.0 760 772 712 764 860 960 1068
Philadelphia Target Seat Departures (a) 842 1035 1136 1248 1367PHL US US 737 126 0.0 0.0 0.0 0.0 0 0 0 0 0 0 0PHL US US 733 126 0.2 0.0 0.0 0.0 0 0 0 0 0 0 0PHL US US 320 142 0.0 0.0 0.0 0.0 0 0 0 0 0 0 0PHL US US 734 144 0.0 0.0 0.0 0.0 0 0 0 0 0 0 0PHL US US 32S 142 0.0 0.0 0.0 0.0 0 0 0 0 0 0 0PHL US US 319 120 0.0 0.0 0.0 0.0 0 0 0 0 0 0 0PHL US RW E70 76 0.0 1.2 1.7 1.0 1.0 132 75 76 0 0 0 0PHL US RW E75 76 0.0 0.0 0.9 1.9 2.0 1.0 2.0 2.0 2.0 66 147 152 76 152 152 152PHL US YV CRJ 50 1.2 0.0 0.0 0.0 0 0 0 0 0 0 0PHL US ZW CRJ 50 1.4 2.6 0.7 0.5 2.0 1.0 1.0 1.0 36 26 0 100 50 50 50PHL US A454 CRJ 50 1.2 0.3 0.3 0.0 15 0 0 0 0 0 0PHL US A494 E70 72 0.3 0.0 0.0 0.0 0 0 0 0 0 0 0PHL WN WN 73G 137 3.0 3.0 4.0 4.0 0 0 0 411 411 548 548PHL NW CJ E75 76 0.0 0.0 0.0 0.1 0 10 0 0 0 0 0PHL NW NW D9S 100 2.6 0.9 0.1 1.2 7 115 0 0 0 0 0PHL NW NW D95 125 0.0 0.1 0.0 0.0 0 0 0 0 0 0 0PHL NW NW 757 180 0.0 0.0 0.2 0.0 37 1 0 0 0 0 0PHL NW NW 320 148 1.1 1.8 2.4 1.9 350 275 0 0 0 0 0PHL NW NW 319 124 1.0 1.4 1.9 1.6 237 198 0 0 0 0 0PHL NW NW 753 224 0.0 0.0 0.1 0.0 33 0 0 0 0 0 0PHL NW NW E90 100 0.0 0.0 0.0 0.0 0 0 0 0 0 0 0PHL NW XJ ARJ 69 0.7 0.2 0.0 0.0 0 0 0 0 0 0 0PHL NW 9E CRJ 50 0.1 0.3 0.0 0.0 0 0 0 0 0 0 0PHL NW 9E CR7 70 0.0 0.0 0.0 0.0 0 0 0 0 0 0 0PHL DL DLX E75 76 1.0 2.0 3.0 3.0 3.0 0 0 76 152 228 228 228PHL DL DL D9S 100 1.0 0 0 100 0 0 0 0PHL DL DL 738 160 0 0 0 0 0 0 0PHL DL DL M80 142 2.0 0 0 284 0 0 0 0PHL DL DL M90 150 1.0 1.0 1.0 1.0 0 0 0 150 150 150 150PHL DL DL NGA 120 2.0 0 0 0 0 0 0 240PHL DL DL 320 148 1.0 1.0 1.0 0 0 148 148 148 0 0PHL DL DL 319 124 1.0 0 0 0 0 0 124 0
Subtotal 9.8 8.8 8.3 8.2 8.0 10.0 11.0 12.0 13.0 913 847 836 1037 1139 1252 1368
Phoenix Target Seat Departures (a) 1795 2425 2835 3290 3783PHX US US 733 134 0.0 0.0 0.2 0.1 32 7 0 0 0 0 0PHX US US 320 150 0.0 0.0 1.1 2.8 2.0 2.0 2.0 2.0 2.0 168 417 300 300 300 300 300PHX US US 321 183 0.0 0.0 0.0 0.2 1.0 1.0 1.0 2.0 3.0 0 37 183 183 183 366 549PHX US US 319 124 0.0 0.0 0.1 1.0 1.0 1.0 2.0 2.0 1.0 11 122 124 124 248 248 124PHX US US 752 190 0.0 0.0 0.0 0.0 0 1 0 0 0 0 0PHX US HP 733 126 0.0 0.0 0.1 0.0 15 0 0 0 0 0 0PHX US HP 320 142 0.0 0.0 2.0 0.0 291 0 0 0 0 0 0PHX US HP 319 120 0.0 0.0 0.0 0.0 5 0 0 0 0 0 0
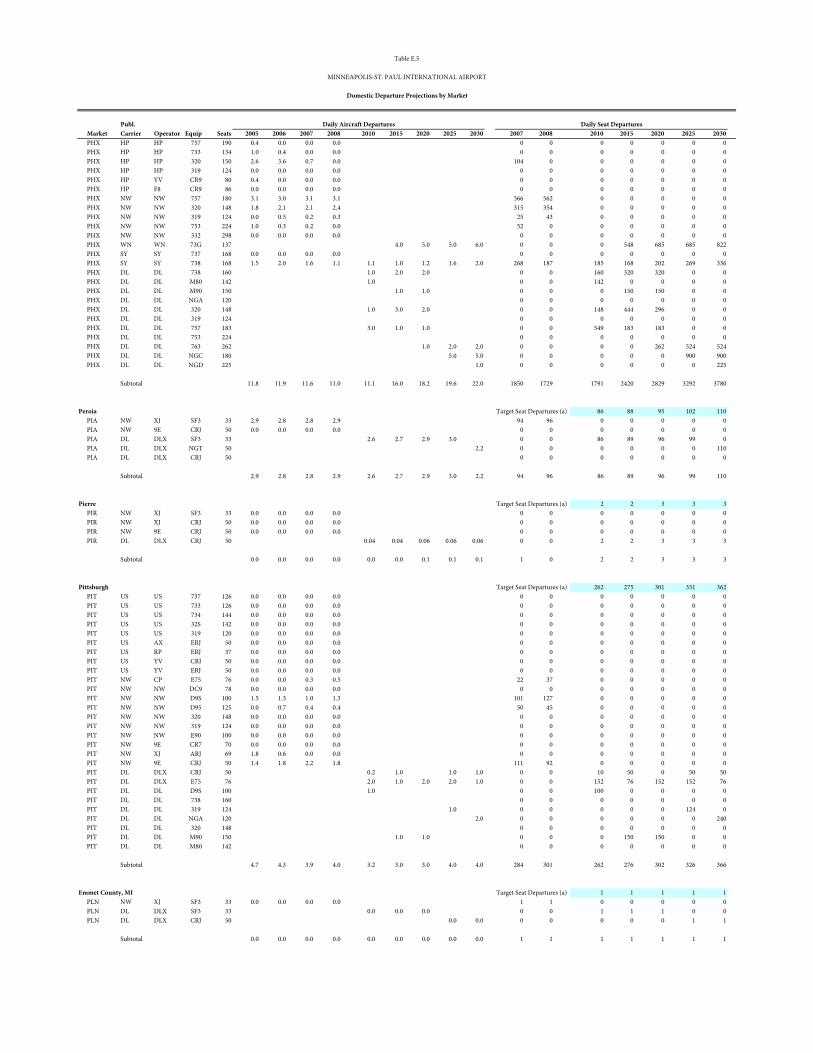
Publ.x Market Carrier Operator Equip Seats 2005 2006 2007 2008 x 2010 2015 2020 2025 2030 x 2007 2008 x 2010 2015 2020 2025 2030
Table E.5
MINNEAPOLIS-ST. PAUL INTERNATIONAL AIRPORT
Domestic Departure Projections by Market
Daily Aircraft Departures Daily Seat Departures
PHX HP HP 757 190 0.4 0.0 0.0 0.0 0 0 0 0 0 0 0PHX HP HP 733 134 1.0 0.4 0.0 0.0 0 0 0 0 0 0 0PHX HP HP 320 150 2.6 3.6 0.7 0.0 104 0 0 0 0 0 0PHX HP HP 319 124 0.0 0.0 0.0 0.0 0 0 0 0 0 0 0PHX HP YV CR9 80 0.4 0.0 0.0 0.0 0 0 0 0 0 0 0PHX HP F8 CR9 86 0.0 0.0 0.0 0.0 0 0 0 0 0 0 0PHX NW NW 757 180 3.1 3.0 3.1 3.1 566 562 0 0 0 0 0PHX NW NW 320 148 1.8 2.1 2.1 2.4 315 354 0 0 0 0 0PHX NW NW 319 124 0.0 0.5 0.2 0.3 25 43 0 0 0 0 0PHX NW NW 753 224 1.0 0.3 0.2 0.0 52 0 0 0 0 0 0PHX NW NW 332 298 0.0 0.0 0.0 0.0 0 0 0 0 0 0 0PHX WN WN 73G 137 4.0 5.0 5.0 6.0 0 0 0 548 685 685 822PHX SY SY 737 168 0.0 0.0 0.0 0.0 0 0 0 0 0 0 0PHX SY SY 738 168 1.5 2.0 1.6 1.1 1.1 1.0 1.2 1.6 2.0 268 187 185 168 202 269 336PHX DL DL 738 160 1.0 2.0 2.0 0 0 160 320 320 0 0PHX DL DL M80 142 1.0 0 0 142 0 0 0 0PHX DL DL M90 150 1.0 1.0 0 0 0 150 150 0 0PHX DL DL NGA 120 0 0 0 0 0 0 0PHX DL DL 320 148 1.0 3.0 2.0 0 0 148 444 296 0 0PHX DL DL 319 124 0 0 0 0 0 0 0PHX DL DL 757 183 3.0 1.0 1.0 0 0 549 183 183 0 0PHX DL DL 753 224 0 0 0 0 0 0 0PHX DL DL 763 262 1.0 2.0 2.0 0 0 0 0 262 524 524PHX DL DL NGC 180 5.0 5.0 0 0 0 0 0 900 900PHX DL DL NGD 225 1.0 0 0 0 0 0 0 225
Subtotal 11.8 11.9 11.6 11.0 11.1 16.0 18.2 19.6 22.0 1850 1729 1791 2420 2829 3292 3780
Peroia Target Seat Departures (a) 86 88 95 102 110PIA NW XJ SF3 33 2.9 2.8 2.8 2.9 94 96 0 0 0 0 0PIA NW 9E CRJ 50 0.0 0.0 0.0 0.0 0 0 0 0 0 0 0PIA DL DLX SF3 33 2.6 2.7 2.9 3.0 0 0 86 89 96 99 0PIA DL DLX NGT 50 2.2 0 0 0 0 0 0 110PIA DL DLX CRJ 50 0 0 0 0 0 0 0
Subtotal 2.9 2.8 2.8 2.9 2.6 2.7 2.9 3.0 2.2 94 96 86 89 96 99 110
Pierre Target Seat Departures (a) 2 2 3 3 3PIR NW XJ SF3 33 0.0 0.0 0.0 0.0 0 0 0 0 0 0 0PIR NW XJ CRJ 50 0.0 0.0 0.0 0.0 0 0 0 0 0 0 0PIR NW 9E CRJ 50 0.0 0.0 0.0 0.0 0 0 0 0 0 0 0PIR DL DLX CRJ 50 0.04 0.04 0.06 0.06 0.06 0 0 2 2 3 3 3
Subtotal 0.0 0.0 0.0 0.0 0.0 0.0 0.1 0.1 0.1 1 0 2 2 3 3 3
Pittsburgh Target Seat Departures (a) 262 275 301 331 362PIT US US 737 126 0.0 0.0 0.0 0.0 0 0 0 0 0 0 0PIT US US 733 126 0.0 0.0 0.0 0.0 0 0 0 0 0 0 0PIT US US 734 144 0.0 0.0 0.0 0.0 0 0 0 0 0 0 0PIT US US 32S 142 0.0 0.0 0.0 0.0 0 0 0 0 0 0 0PIT US US 319 120 0.0 0.0 0.0 0.0 0 0 0 0 0 0 0PIT US AX ERJ 50 0.0 0.0 0.0 0.0 0 0 0 0 0 0 0PIT US RP ERJ 37 0.0 0.0 0.0 0.0 0 0 0 0 0 0 0PIT US YV CRJ 50 0.0 0.0 0.0 0.0 0 0 0 0 0 0 0PIT US YV ERJ 50 0.0 0.0 0.0 0.0 0 0 0 0 0 0 0PIT NW CP E75 76 0.0 0.0 0.3 0.5 22 37 0 0 0 0 0PIT NW NW DC9 78 0.0 0.0 0.0 0.0 0 0 0 0 0 0 0PIT NW NW D9S 100 1.5 1.3 1.0 1.3 101 127 0 0 0 0 0PIT NW NW D95 125 0.0 0.7 0.4 0.4 50 45 0 0 0 0 0PIT NW NW 320 148 0.0 0.0 0.0 0.0 0 0 0 0 0 0 0PIT NW NW 319 124 0.0 0.0 0.0 0.0 0 0 0 0 0 0 0PIT NW NW E90 100 0.0 0.0 0.0 0.0 0 0 0 0 0 0 0PIT NW 9E CR7 70 0.0 0.0 0.0 0.0 0 0 0 0 0 0 0PIT NW XJ ARJ 69 1.8 0.6 0.0 0.0 0 0 0 0 0 0 0PIT NW 9E CRJ 50 1.4 1.8 2.2 1.8 111 92 0 0 0 0 0PIT DL DLX CRJ 50 0.2 1.0 1.0 1.0 0 0 10 50 0 50 50PIT DL DLX E75 76 2.0 1.0 2.0 2.0 1.0 0 0 152 76 152 152 76PIT DL DL D9S 100 1.0 0 0 100 0 0 0 0PIT DL DL 738 160 0 0 0 0 0 0 0PIT DL DL 319 124 1.0 0 0 0 0 0 124 0PIT DL DL NGA 120 2.0 0 0 0 0 0 0 240PIT DL DL 320 148 0 0 0 0 0 0 0PIT DL DL M90 150 1.0 1.0 0 0 0 150 150 0 0PIT DL DL M80 142 0 0 0 0 0 0 0
Subtotal 4.7 4.3 3.9 4.0 3.2 3.0 3.0 4.0 4.0 284 301 262 276 302 326 366
Emmet County, MI Target Seat Departures (a) 1 1 1 1 1PLN NW XJ SF3 33 0.0 0.0 0.0 0.0 1 1 0 0 0 0 0PLN DL DLX SF3 33 0.0 0.0 0.0 0 0 1 1 1 0 0PLN DL DLX CRJ 50 0.0 0.0 0 0 0 0 0 1 1
Subtotal 0.0 0.0 0.0 0.0 0.0 0.0 0.0 0.0 0.0 1 1 1 1 1 1 1
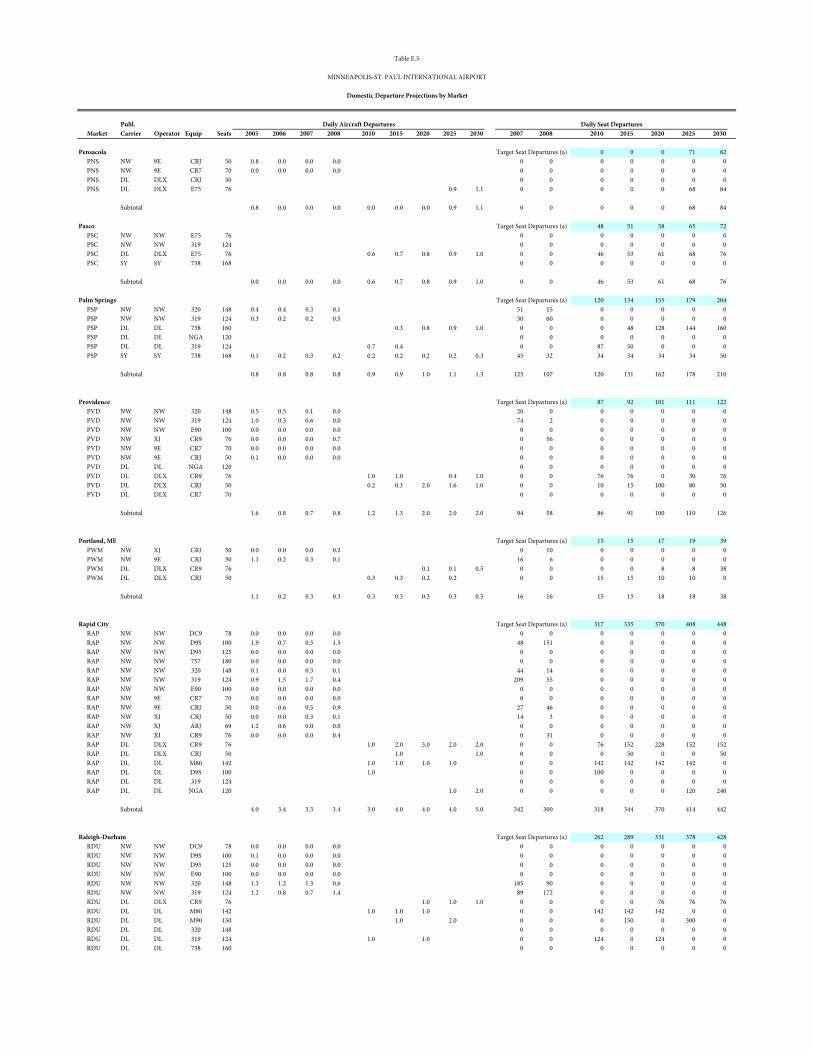
Publ.x Market Carrier Operator Equip Seats 2005 2006 2007 2008 x 2010 2015 2020 2025 2030 x 2007 2008 x 2010 2015 2020 2025 2030
Table E.5
MINNEAPOLIS-ST. PAUL INTERNATIONAL AIRPORT
Domestic Departure Projections by Market
Daily Aircraft Departures Daily Seat Departures
Pensacola Target Seat Departures (a) 0 0 0 71 82PNS NW 9E CRJ 50 0.8 0.0 0.0 0.0 0 0 0 0 0 0 0PNS NW 9E CR7 70 0.0 0.0 0.0 0.0 0 0 0 0 0 0 0PNS DL DLX CRJ 50 0 0 0 0 0 0 0PNS DL DLX E75 76 0.9 1.1 0 0 0 0 0 68 84
Subtotal 0.8 0.0 0.0 0.0 0.0 0.0 0.0 0.9 1.1 0 0 0 0 0 68 84
Pasco Target Seat Departures (a) 48 51 58 65 72PSC NW NW E75 76 0 0 0 0 0 0 0PSC NW NW 319 124 0 0 0 0 0 0 0PSC DL DLX E75 76 0.6 0.7 0.8 0.9 1.0 0 0 46 53 61 68 76PSC SY SY 738 168 0 0 0 0 0 0 0
Subtotal 0.0 0.0 0.0 0.0 0.6 0.7 0.8 0.9 1.0 0 0 46 53 61 68 76
Palm Springs Target Seat Departures (a) 120 134 155 179 204PSP NW NW 320 148 0.4 0.4 0.3 0.1 51 15 0 0 0 0 0PSP NW NW 319 124 0.3 0.2 0.2 0.5 30 60 0 0 0 0 0PSP DL DL 738 160 0.3 0.8 0.9 1.0 0 0 0 48 128 144 160PSP DL DL NGA 120 0 0 0 0 0 0 0PSP DL DL 319 124 0.7 0.4 0 0 87 50 0 0 0PSP SY SY 738 168 0.1 0.2 0.3 0.2 0.2 0.2 0.2 0.2 0.3 45 32 34 34 34 34 50
Subtotal 0.8 0.8 0.8 0.8 0.9 0.9 1.0 1.1 1.3 125 107 120 131 162 178 210
Providence Target Seat Departures (a) 87 92 101 111 122PVD NW NW 320 148 0.5 0.5 0.1 0.0 20 0 0 0 0 0 0PVD NW NW 319 124 1.0 0.3 0.6 0.0 74 2 0 0 0 0 0PVD NW NW E90 100 0.0 0.0 0.0 0.0 0 0 0 0 0 0 0PVD NW XJ CR9 76 0.0 0.0 0.0 0.7 0 56 0 0 0 0 0PVD NW 9E CR7 70 0.0 0.0 0.0 0.0 0 0 0 0 0 0 0PVD NW 9E CRJ 50 0.1 0.0 0.0 0.0 0 0 0 0 0 0 0PVD DL DL NGA 120 0 0 0 0 0 0 0PVD DL DLX CR9 76 1.0 1.0 0.4 1.0 0 0 76 76 0 30 76PVD DL DLX CRJ 50 0.2 0.3 2.0 1.6 1.0 0 0 10 15 100 80 50PVD DL DLX CR7 70 0 0 0 0 0 0 0
Subtotal 1.6 0.8 0.7 0.8 1.2 1.3 2.0 2.0 2.0 94 58 86 91 100 110 126
Portland, ME Target Seat Departures (a) 15 15 17 19 39PWM NW XJ CRJ 50 0.0 0.0 0.0 0.2 0 10 0 0 0 0 0PWM NW 9E CRJ 50 1.1 0.2 0.3 0.1 16 6 0 0 0 0 0PWM DL DLX CR9 76 0.1 0.1 0.5 0 0 0 0 8 8 38PWM DL DLX CRJ 50 0.3 0.3 0.2 0.2 0 0 15 15 10 10 0
Subtotal 1.1 0.2 0.3 0.3 0.3 0.3 0.3 0.3 0.5 16 16 15 15 18 18 38
Rapid City Target Seat Departures (a) 317 335 370 408 448RAP NW NW DC9 78 0.0 0.0 0.0 0.0 0 0 0 0 0 0 0RAP NW NW D9S 100 1.9 0.7 0.5 1.5 48 151 0 0 0 0 0RAP NW NW D95 125 0.0 0.0 0.0 0.0 0 0 0 0 0 0 0RAP NW NW 757 180 0.0 0.0 0.0 0.0 0 0 0 0 0 0 0RAP NW NW 320 148 0.1 0.0 0.3 0.1 44 14 0 0 0 0 0RAP NW NW 319 124 0.9 1.5 1.7 0.4 209 55 0 0 0 0 0RAP NW NW E90 100 0.0 0.0 0.0 0.0 0 0 0 0 0 0 0RAP NW 9E CR7 70 0.0 0.0 0.0 0.0 0 0 0 0 0 0 0RAP NW 9E CRJ 50 0.0 0.6 0.5 0.9 27 46 0 0 0 0 0RAP NW XJ CRJ 50 0.0 0.0 0.3 0.1 14 3 0 0 0 0 0RAP NW XJ ARJ 69 1.2 0.6 0.0 0.0 0 0 0 0 0 0 0RAP NW XJ CR9 76 0.0 0.0 0.0 0.4 0 31 0 0 0 0 0RAP DL DLX CR9 76 1.0 2.0 3.0 2.0 2.0 0 0 76 152 228 152 152RAP DL DLX CRJ 50 1.0 1.0 0 0 0 50 0 0 50RAP DL DL M80 142 1.0 1.0 1.0 1.0 0 0 142 142 142 142 0RAP DL DL D9S 100 1.0 0 0 100 0 0 0 0RAP DL DL 319 124 0 0 0 0 0 0 0RAP DL DL NGA 120 1.0 2.0 0 0 0 0 0 120 240
Subtotal 4.0 3.4 3.3 3.4 3.0 4.0 4.0 4.0 5.0 342 300 318 344 370 414 442
Raleigh-Durham Target Seat Departures (a) 262 289 331 378 428RDU NW NW DC9 78 0.0 0.0 0.0 0.0 0 0 0 0 0 0 0RDU NW NW D9S 100 0.1 0.0 0.0 0.0 0 0 0 0 0 0 0RDU NW NW D95 125 0.0 0.0 0.0 0.0 0 0 0 0 0 0 0RDU NW NW E90 100 0.0 0.0 0.0 0.0 0 0 0 0 0 0 0RDU NW NW 320 148 1.3 1.2 1.3 0.6 185 90 0 0 0 0 0RDU NW NW 319 124 1.2 0.8 0.7 1.4 89 172 0 0 0 0 0RDU DL DLX CR9 76 1.0 1.0 1.0 0 0 0 0 76 76 76RDU DL DL M80 142 1.0 1.0 1.0 0 0 142 142 142 0 0RDU DL DL M90 150 1.0 2.0 0 0 0 150 0 300 0RDU DL DL 320 148 0 0 0 0 0 0 0RDU DL DL 319 124 1.0 1.0 0 0 124 0 124 0 0RDU DL DL 738 160 0 0 0 0 0 0 0
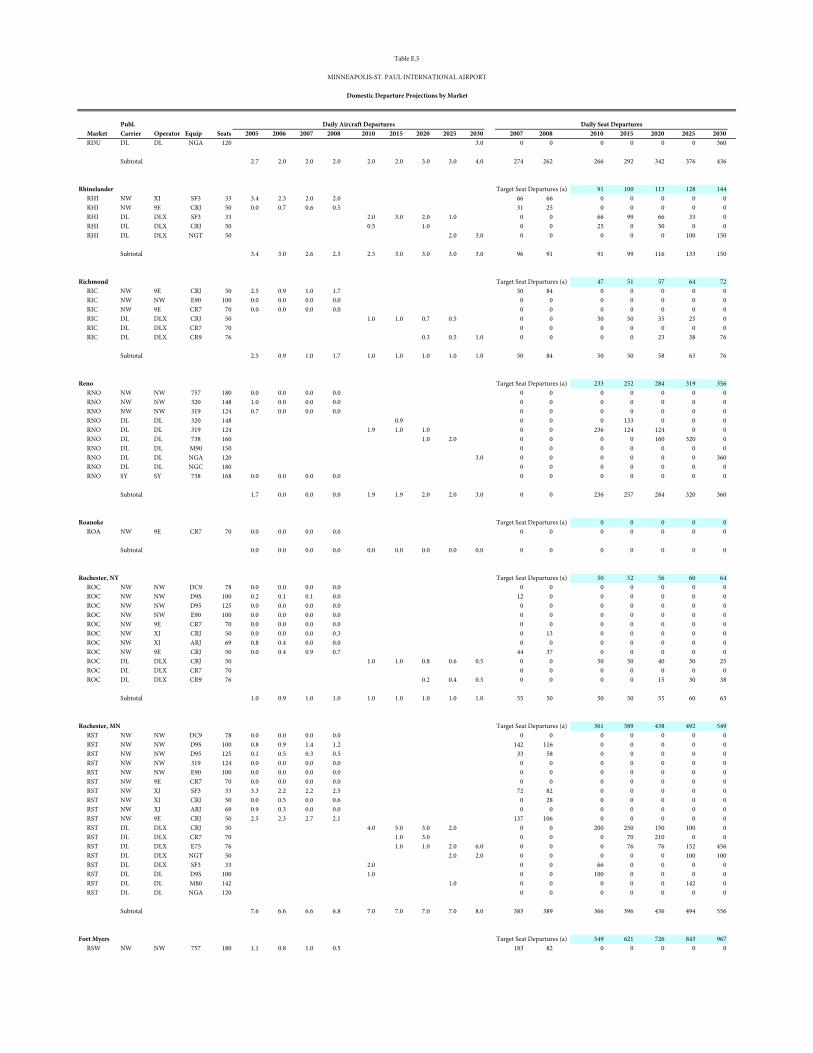
Publ.x Market Carrier Operator Equip Seats 2005 2006 2007 2008 x 2010 2015 2020 2025 2030 x 2007 2008 x 2010 2015 2020 2025 2030
Table E.5
MINNEAPOLIS-ST. PAUL INTERNATIONAL AIRPORT
Domestic Departure Projections by Market
Daily Aircraft Departures Daily Seat Departures
RDU DL DL NGA 120 3.0 0 0 0 0 0 0 360
Subtotal 2.7 2.0 2.0 2.0 2.0 2.0 3.0 3.0 4.0 274 262 266 292 342 376 436
Rhinelander Target Seat Departures (a) 91 100 113 128 144RHI NW XJ SF3 33 3.4 2.3 2.0 2.0 66 66 0 0 0 0 0RHI NW 9E CRJ 50 0.0 0.7 0.6 0.5 31 25 0 0 0 0 0RHI DL DLX SF3 33 2.0 3.0 2.0 1.0 0 0 66 99 66 33 0RHI DL DLX CRJ 50 0.5 1.0 0 0 25 0 50 0 0RHI DL DLX NGT 50 2.0 3.0 0 0 0 0 0 100 150
Subtotal 3.4 3.0 2.6 2.5 2.5 3.0 3.0 3.0 3.0 96 91 91 99 116 133 150
Richmond Target Seat Departures (a) 47 51 57 64 72RIC NW 9E CRJ 50 2.5 0.9 1.0 1.7 50 84 0 0 0 0 0RIC NW NW E90 100 0.0 0.0 0.0 0.0 0 0 0 0 0 0 0RIC NW 9E CR7 70 0.0 0.0 0.0 0.0 0 0 0 0 0 0 0RIC DL DLX CRJ 50 1.0 1.0 0.7 0.5 0 0 50 50 35 25 0RIC DL DLX CR7 70 0 0 0 0 0 0 0RIC DL DLX CR9 76 0.3 0.5 1.0 0 0 0 0 23 38 76
Subtotal 2.5 0.9 1.0 1.7 1.0 1.0 1.0 1.0 1.0 50 84 50 50 58 63 76
Reno Target Seat Departures (a) 233 252 284 319 356RNO NW NW 757 180 0.0 0.0 0.0 0.0 0 0 0 0 0 0 0RNO NW NW 320 148 1.0 0.0 0.0 0.0 0 0 0 0 0 0 0RNO NW NW 319 124 0.7 0.0 0.0 0.0 0 0 0 0 0 0 0RNO DL DL 320 148 0.9 0 0 0 133 0 0 0RNO DL DL 319 124 1.9 1.0 1.0 0 0 236 124 124 0 0RNO DL DL 738 160 1.0 2.0 0 0 0 0 160 320 0RNO DL DL M90 150 0 0 0 0 0 0 0RNO DL DL NGA 120 3.0 0 0 0 0 0 0 360RNO DL DL NGC 180 0 0 0 0 0 0 0RNO SY SY 738 168 0.0 0.0 0.0 0.0 0 0 0 0 0 0 0
Subtotal 1.7 0.0 0.0 0.0 1.9 1.9 2.0 2.0 3.0 0 0 236 257 284 320 360
Roanoke Target Seat Departures (a) 0 0 0 0 0ROA NW 9E CR7 70 0.0 0.0 0.0 0.0 0 0 0 0 0 0 0
Subtotal 0.0 0.0 0.0 0.0 0.0 0.0 0.0 0.0 0.0 0 0 0 0 0 0 0
Rochester, NY Target Seat Departures (a) 50 52 56 60 64ROC NW NW DC9 78 0.0 0.0 0.0 0.0 0 0 0 0 0 0 0ROC NW NW D9S 100 0.2 0.1 0.1 0.0 12 0 0 0 0 0 0ROC NW NW D95 125 0.0 0.0 0.0 0.0 0 0 0 0 0 0 0ROC NW NW E90 100 0.0 0.0 0.0 0.0 0 0 0 0 0 0 0ROC NW 9E CR7 70 0.0 0.0 0.0 0.0 0 0 0 0 0 0 0ROC NW XJ CRJ 50 0.0 0.0 0.0 0.3 0 13 0 0 0 0 0ROC NW XJ ARJ 69 0.8 0.4 0.0 0.0 0 0 0 0 0 0 0ROC NW 9E CRJ 50 0.0 0.4 0.9 0.7 44 37 0 0 0 0 0ROC DL DLX CRJ 50 1.0 1.0 0.8 0.6 0.5 0 0 50 50 40 30 25ROC DL DLX CR7 70 0 0 0 0 0 0 0ROC DL DLX CR9 76 0.2 0.4 0.5 0 0 0 0 15 30 38
Subtotal 1.0 0.9 1.0 1.0 1.0 1.0 1.0 1.0 1.0 55 50 50 50 55 60 63
Rochester, MN Target Seat Departures (a) 361 389 438 492 549RST NW NW DC9 78 0.0 0.0 0.0 0.0 0 0 0 0 0 0 0RST NW NW D9S 100 0.8 0.9 1.4 1.2 142 116 0 0 0 0 0RST NW NW D95 125 0.1 0.5 0.3 0.5 33 58 0 0 0 0 0RST NW NW 319 124 0.0 0.0 0.0 0.0 0 0 0 0 0 0 0RST NW NW E90 100 0.0 0.0 0.0 0.0 0 0 0 0 0 0 0RST NW 9E CR7 70 0.0 0.0 0.0 0.0 0 0 0 0 0 0 0RST NW XJ SF3 33 3.3 2.2 2.2 2.5 72 82 0 0 0 0 0RST NW XJ CRJ 50 0.0 0.5 0.0 0.6 0 28 0 0 0 0 0RST NW XJ ARJ 69 0.9 0.3 0.0 0.0 0 0 0 0 0 0 0RST NW 9E CRJ 50 2.5 2.3 2.7 2.1 137 106 0 0 0 0 0RST DL DLX CRJ 50 4.0 5.0 3.0 2.0 0 0 200 250 150 100 0RST DL DLX CR7 70 1.0 3.0 0 0 0 70 210 0 0RST DL DLX E75 76 1.0 1.0 2.0 6.0 0 0 0 76 76 152 456RST DL DLX NGT 50 2.0 2.0 0 0 0 0 0 100 100RST DL DLX SF3 33 2.0 0 0 66 0 0 0 0RST DL DL D9S 100 1.0 0 0 100 0 0 0 0RST DL DL M80 142 1.0 0 0 0 0 0 142 0RST DL DL NGA 120 0 0 0 0 0 0 0
Subtotal 7.6 6.6 6.6 6.8 7.0 7.0 7.0 7.0 8.0 383 389 366 396 436 494 556
Fort Myers Target Seat Departures (a) 549 621 726 843 967RSW NW NW 757 180 1.1 0.8 1.0 0.5 183 82 0 0 0 0 0
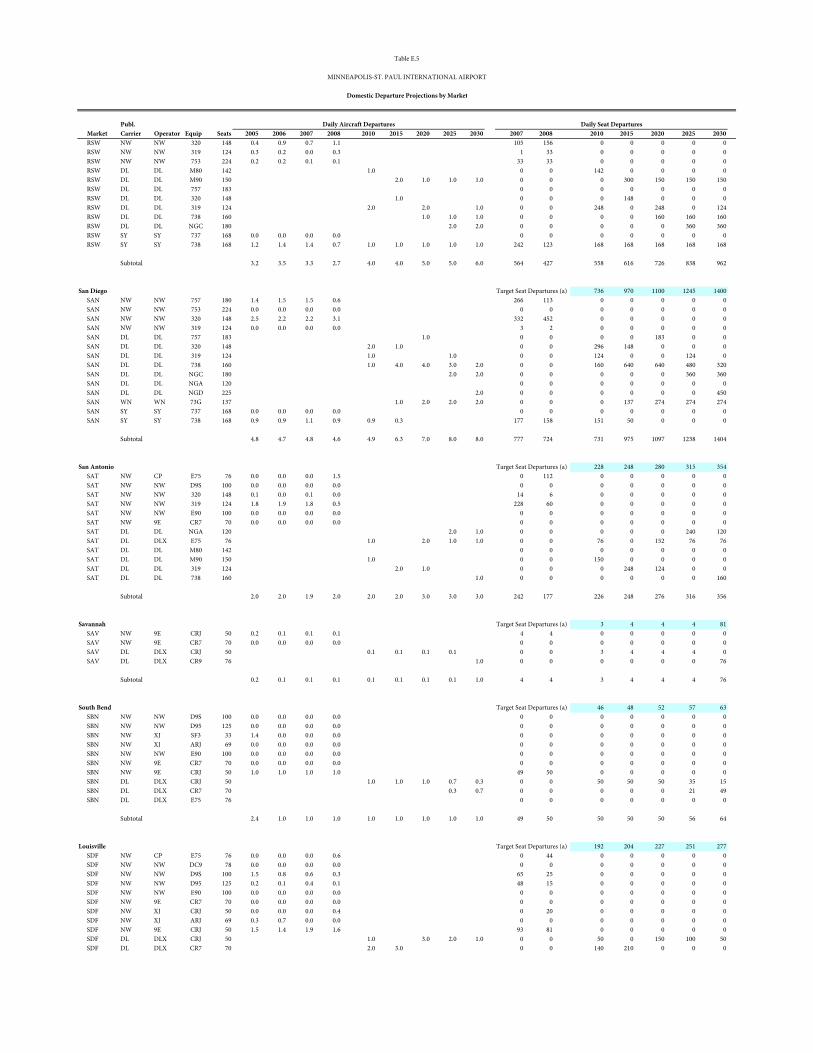
Publ.x Market Carrier Operator Equip Seats 2005 2006 2007 2008 x 2010 2015 2020 2025 2030 x 2007 2008 x 2010 2015 2020 2025 2030
Table E.5
MINNEAPOLIS-ST. PAUL INTERNATIONAL AIRPORT
Domestic Departure Projections by Market
Daily Aircraft Departures Daily Seat Departures
RSW NW NW 320 148 0.4 0.9 0.7 1.1 105 156 0 0 0 0 0RSW NW NW 319 124 0.3 0.2 0.0 0.3 1 33 0 0 0 0 0RSW NW NW 753 224 0.2 0.2 0.1 0.1 33 33 0 0 0 0 0RSW DL DL M80 142 1.0 0 0 142 0 0 0 0RSW DL DL M90 150 2.0 1.0 1.0 1.0 0 0 0 300 150 150 150RSW DL DL 757 183 0 0 0 0 0 0 0RSW DL DL 320 148 1.0 0 0 0 148 0 0 0RSW DL DL 319 124 2.0 2.0 1.0 0 0 248 0 248 0 124RSW DL DL 738 160 1.0 1.0 1.0 0 0 0 0 160 160 160RSW DL DL NGC 180 2.0 2.0 0 0 0 0 0 360 360RSW SY SY 737 168 0.0 0.0 0.0 0.0 0 0 0 0 0 0 0RSW SY SY 738 168 1.2 1.4 1.4 0.7 1.0 1.0 1.0 1.0 1.0 242 123 168 168 168 168 168
Subtotal 3.2 3.5 3.3 2.7 4.0 4.0 5.0 5.0 6.0 564 427 558 616 726 838 962
San Diego Target Seat Departures (a) 736 970 1100 1245 1400SAN NW NW 757 180 1.4 1.5 1.5 0.6 266 113 0 0 0 0 0SAN NW NW 753 224 0.0 0.0 0.0 0.0 0 0 0 0 0 0 0SAN NW NW 320 148 2.5 2.2 2.2 3.1 332 452 0 0 0 0 0SAN NW NW 319 124 0.0 0.0 0.0 0.0 3 2 0 0 0 0 0SAN DL DL 757 183 1.0 0 0 0 0 183 0 0SAN DL DL 320 148 2.0 1.0 0 0 296 148 0 0 0SAN DL DL 319 124 1.0 1.0 0 0 124 0 0 124 0SAN DL DL 738 160 1.0 4.0 4.0 3.0 2.0 0 0 160 640 640 480 320SAN DL DL NGC 180 2.0 2.0 0 0 0 0 0 360 360SAN DL DL NGA 120 0 0 0 0 0 0 0SAN DL DL NGD 225 2.0 0 0 0 0 0 0 450SAN WN WN 73G 137 1.0 2.0 2.0 2.0 0 0 0 137 274 274 274SAN SY SY 737 168 0.0 0.0 0.0 0.0 0 0 0 0 0 0 0SAN SY SY 738 168 0.9 0.9 1.1 0.9 0.9 0.3 177 158 151 50 0 0 0
Subtotal 4.8 4.7 4.8 4.6 4.9 6.3 7.0 8.0 8.0 777 724 731 975 1097 1238 1404
San Antonio Target Seat Departures (a) 228 248 280 315 354SAT NW CP E75 76 0.0 0.0 0.0 1.5 0 112 0 0 0 0 0SAT NW NW D9S 100 0.0 0.0 0.0 0.0 0 0 0 0 0 0 0SAT NW NW 320 148 0.1 0.0 0.1 0.0 14 6 0 0 0 0 0SAT NW NW 319 124 1.8 1.9 1.8 0.5 228 60 0 0 0 0 0SAT NW NW E90 100 0.0 0.0 0.0 0.0 0 0 0 0 0 0 0SAT NW 9E CR7 70 0.0 0.0 0.0 0.0 0 0 0 0 0 0 0SAT DL DL NGA 120 2.0 1.0 0 0 0 0 0 240 120SAT DL DLX E75 76 1.0 2.0 1.0 1.0 0 0 76 0 152 76 76SAT DL DL M80 142 0 0 0 0 0 0 0SAT DL DL M90 150 1.0 0 0 150 0 0 0 0SAT DL DL 319 124 2.0 1.0 0 0 0 248 124 0 0SAT DL DL 738 160 1.0 0 0 0 0 0 0 160
Subtotal 2.0 2.0 1.9 2.0 2.0 2.0 3.0 3.0 3.0 242 177 226 248 276 316 356
Savannah Target Seat Departures (a) 3 4 4 4 81SAV NW 9E CRJ 50 0.2 0.1 0.1 0.1 4 4 0 0 0 0 0SAV NW 9E CR7 70 0.0 0.0 0.0 0.0 0 0 0 0 0 0 0SAV DL DLX CRJ 50 0.1 0.1 0.1 0.1 0 0 3 4 4 4 0SAV DL DLX CR9 76 1.0 0 0 0 0 0 0 76
Subtotal 0.2 0.1 0.1 0.1 0.1 0.1 0.1 0.1 1.0 4 4 3 4 4 4 76
South Bend Target Seat Departures (a) 46 48 52 57 63SBN NW NW D9S 100 0.0 0.0 0.0 0.0 0 0 0 0 0 0 0SBN NW NW D95 125 0.0 0.0 0.0 0.0 0 0 0 0 0 0 0SBN NW XJ SF3 33 1.4 0.0 0.0 0.0 0 0 0 0 0 0 0SBN NW XJ ARJ 69 0.0 0.0 0.0 0.0 0 0 0 0 0 0 0SBN NW NW E90 100 0.0 0.0 0.0 0.0 0 0 0 0 0 0 0SBN NW 9E CR7 70 0.0 0.0 0.0 0.0 0 0 0 0 0 0 0SBN NW 9E CRJ 50 1.0 1.0 1.0 1.0 49 50 0 0 0 0 0SBN DL DLX CRJ 50 1.0 1.0 1.0 0.7 0.3 0 0 50 50 50 35 15SBN DL DLX CR7 70 0.3 0.7 0 0 0 0 0 21 49SBN DL DLX E75 76 0 0 0 0 0 0 0
Subtotal 2.4 1.0 1.0 1.0 1.0 1.0 1.0 1.0 1.0 49 50 50 50 50 56 64
Louisville Target Seat Departures (a) 192 204 227 251 277SDF NW CP E75 76 0.0 0.0 0.0 0.6 0 44 0 0 0 0 0SDF NW NW DC9 78 0.0 0.0 0.0 0.0 0 0 0 0 0 0 0SDF NW NW D9S 100 1.5 0.8 0.6 0.3 65 25 0 0 0 0 0SDF NW NW D95 125 0.2 0.1 0.4 0.1 48 15 0 0 0 0 0SDF NW NW E90 100 0.0 0.0 0.0 0.0 0 0 0 0 0 0 0SDF NW 9E CR7 70 0.0 0.0 0.0 0.0 0 0 0 0 0 0 0SDF NW XJ CRJ 50 0.0 0.0 0.0 0.4 0 20 0 0 0 0 0SDF NW XJ ARJ 69 0.3 0.7 0.0 0.0 0 0 0 0 0 0 0SDF NW 9E CRJ 50 1.5 1.4 1.9 1.6 93 81 0 0 0 0 0SDF DL DLX CRJ 50 1.0 3.0 2.0 1.0 0 0 50 0 150 100 50SDF DL DLX CR7 70 2.0 3.0 0 0 140 210 0 0 0
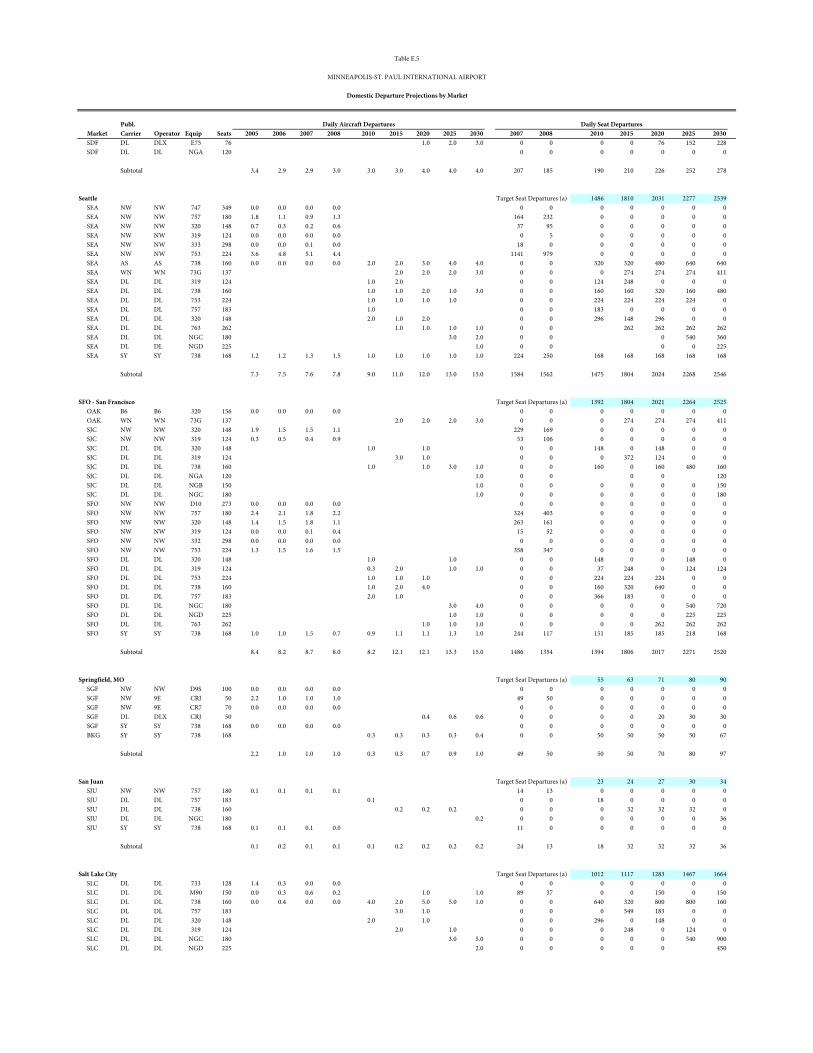
Publ.x Market Carrier Operator Equip Seats 2005 2006 2007 2008 x 2010 2015 2020 2025 2030 x 2007 2008 x 2010 2015 2020 2025 2030
Table E.5
MINNEAPOLIS-ST. PAUL INTERNATIONAL AIRPORT
Domestic Departure Projections by Market
Daily Aircraft Departures Daily Seat Departures
SDF DL DLX E75 76 1.0 2.0 3.0 0 0 0 0 76 152 228SDF DL DL NGA 120 0 0 0 0 0 0 0
Subtotal 3.4 2.9 2.9 3.0 3.0 3.0 4.0 4.0 4.0 207 185 190 210 226 252 278
Seattle Target Seat Departures (a) 1486 1810 2031 2277 2539SEA NW NW 747 349 0.0 0.0 0.0 0.0 0 0 0 0 0 0 0SEA NW NW 757 180 1.8 1.1 0.9 1.3 164 232 0 0 0 0 0SEA NW NW 320 148 0.7 0.3 0.2 0.6 37 95 0 0 0 0 0SEA NW NW 319 124 0.0 0.0 0.0 0.0 0 5 0 0 0 0 0SEA NW NW 333 298 0.0 0.0 0.1 0.0 18 0 0 0 0 0 0SEA NW NW 753 224 3.6 4.8 5.1 4.4 1141 979 0 0 0 0 0SEA AS AS 738 160 0.0 0.0 0.0 0.0 2.0 2.0 3.0 4.0 4.0 0 0 320 320 480 640 640SEA WN WN 73G 137 2.0 2.0 2.0 3.0 0 0 0 274 274 274 411SEA DL DL 319 124 1.0 2.0 0 0 124 248 0 0 0SEA DL DL 738 160 1.0 1.0 2.0 1.0 3.0 0 0 160 160 320 160 480SEA DL DL 753 224 1.0 1.0 1.0 1.0 0 0 224 224 224 224 0SEA DL DL 757 183 1.0 0 0 183 0 0 0 0SEA DL DL 320 148 2.0 1.0 2.0 0 0 296 148 296 0 0SEA DL DL 763 262 1.0 1.0 1.0 1.0 0 0 262 262 262 262SEA DL DL NGC 180 3.0 2.0 0 0 0 540 360SEA DL DL NGD 225 1.0 0 0 0 0 225SEA SY SY 738 168 1.2 1.2 1.3 1.5 1.0 1.0 1.0 1.0 1.0 224 250 168 168 168 168 168
Subtotal 7.3 7.5 7.6 7.8 9.0 11.0 12.0 13.0 15.0 1584 1562 1475 1804 2024 2268 2546
SFO - San Francisco Target Seat Departures (a) 1392 1804 2021 2264 2525OAK B6 B6 320 156 0.0 0.0 0.0 0.0 0 0 0 0 0 0 0OAK WN WN 73G 137 2.0 2.0 2.0 3.0 0 0 0 274 274 274 411SJC NW NW 320 148 1.9 1.5 1.5 1.1 229 169 0 0 0 0 0SJC NW NW 319 124 0.3 0.5 0.4 0.9 53 106 0 0 0 0 0SJC DL DL 320 148 1.0 1.0 0 0 148 0 148 0 0SJC DL DL 319 124 3.0 1.0 0 0 0 372 124 0 0SJC DL DL 738 160 1.0 1.0 3.0 1.0 0 0 160 0 160 480 160SJC DL DL NGA 120 1.0 0 0 0 0 120SJC DL DL NGB 150 1.0 0 0 0 0 0 0 150SJC DL DL NGC 180 1.0 0 0 0 0 0 0 180SFO NW NW D10 273 0.0 0.0 0.0 0.0 0 0 0 0 0 0 0SFO NW NW 757 180 2.4 2.1 1.8 2.2 324 403 0 0 0 0 0SFO NW NW 320 148 1.4 1.5 1.8 1.1 263 161 0 0 0 0 0SFO NW NW 319 124 0.0 0.0 0.1 0.4 15 52 0 0 0 0 0SFO NW NW 332 298 0.0 0.0 0.0 0.0 0 0 0 0 0 0 0SFO NW NW 753 224 1.3 1.5 1.6 1.5 358 347 0 0 0 0 0SFO DL DL 320 148 1.0 1.0 0 0 148 0 0 148 0SFO DL DL 319 124 0.3 2.0 1.0 1.0 0 0 37 248 0 124 124SFO DL DL 753 224 1.0 1.0 1.0 0 0 224 224 224 0 0SFO DL DL 738 160 1.0 2.0 4.0 0 0 160 320 640 0 0SFO DL DL 757 183 2.0 1.0 0 0 366 183 0 0 0SFO DL DL NGC 180 3.0 4.0 0 0 0 0 0 540 720SFO DL DL NGD 225 1.0 1.0 0 0 0 0 0 225 225SFO DL DL 763 262 1.0 1.0 1.0 0 0 0 0 262 262 262SFO SY SY 738 168 1.0 1.0 1.5 0.7 0.9 1.1 1.1 1.3 1.0 244 117 151 185 185 218 168
Subtotal 8.4 8.2 8.7 8.0 8.2 12.1 12.1 13.3 15.0 1486 1354 1394 1806 2017 2271 2520
Springfield, MO Target Seat Departures (a) 55 63 71 80 90SGF NW NW D9S 100 0.0 0.0 0.0 0.0 0 0 0 0 0 0 0SGF NW 9E CRJ 50 2.2 1.0 1.0 1.0 49 50 0 0 0 0 0SGF NW 9E CR7 70 0.0 0.0 0.0 0.0 0 0 0 0 0 0 0SGF DL DLX CRJ 50 0.4 0.6 0.6 0 0 0 0 20 30 30SGF SY SY 738 168 0.0 0.0 0.0 0.0 0 0 0 0 0 0 0BKG SY SY 738 168 0.3 0.3 0.3 0.3 0.4 0 0 50 50 50 50 67
Subtotal 2.2 1.0 1.0 1.0 0.3 0.3 0.7 0.9 1.0 49 50 50 50 70 80 97
San Juan Target Seat Departures (a) 23 24 27 30 34SJU NW NW 757 180 0.1 0.1 0.1 0.1 14 13 0 0 0 0 0SJU DL DL 757 183 0.1 0 0 18 0 0 0 0SJU DL DL 738 160 0.2 0.2 0.2 0 0 0 32 32 32 0SJU DL DL NGC 180 0.2 0 0 0 0 0 0 36SJU SY SY 738 168 0.1 0.1 0.1 0.0 11 0 0 0 0 0 0
Subtotal 0.1 0.2 0.1 0.1 0.1 0.2 0.2 0.2 0.2 24 13 18 32 32 32 36
Salt Lake City Target Seat Departures (a) 1012 1117 1283 1467 1664SLC DL DL 733 128 1.4 0.3 0.0 0.0 0 0 0 0 0 0 0SLC DL DL M90 150 0.0 0.3 0.6 0.2 1.0 1.0 89 37 0 0 150 0 150SLC DL DL 738 160 0.0 0.4 0.0 0.0 4.0 2.0 5.0 5.0 1.0 0 0 640 320 800 800 160SLC DL DL 757 183 3.0 1.0 0 0 0 549 183 0 0SLC DL DL 320 148 2.0 1.0 0 0 296 0 148 0 0SLC DL DL 319 124 2.0 1.0 0 0 0 248 0 124 0SLC DL DL NGC 180 3.0 5.0 0 0 0 0 0 540 900SLC DL DL NGD 225 2.0 0 0 0 0 0 450
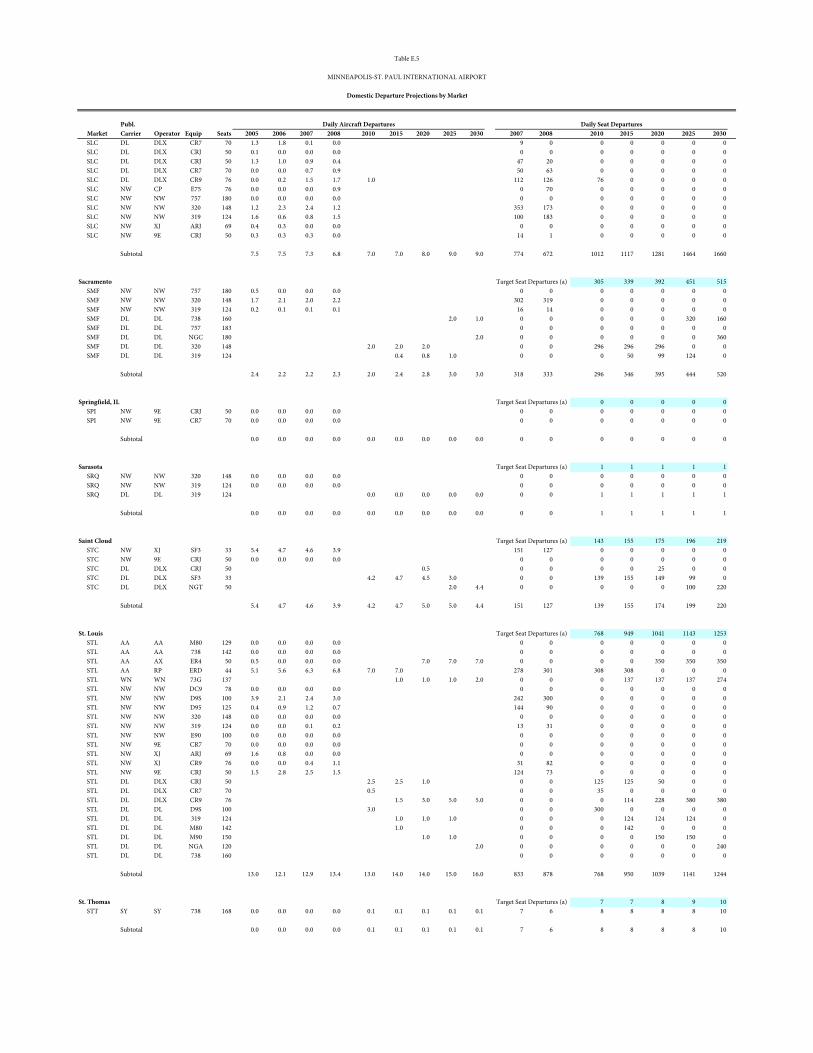
Publ.x Market Carrier Operator Equip Seats 2005 2006 2007 2008 x 2010 2015 2020 2025 2030 x 2007 2008 x 2010 2015 2020 2025 2030
Table E.5
MINNEAPOLIS-ST. PAUL INTERNATIONAL AIRPORT
Domestic Departure Projections by Market
Daily Aircraft Departures Daily Seat Departures
SLC DL DLX CR7 70 1.3 1.8 0.1 0.0 9 0 0 0 0 0 0SLC DL DLX CRJ 50 0.1 0.0 0.0 0.0 0 0 0 0 0 0 0SLC DL DLX CRJ 50 1.3 1.0 0.9 0.4 47 20 0 0 0 0 0SLC DL DLX CR7 70 0.0 0.0 0.7 0.9 50 63 0 0 0 0 0SLC DL DLX CR9 76 0.0 0.2 1.5 1.7 1.0 112 126 76 0 0 0 0SLC NW CP E75 76 0.0 0.0 0.0 0.9 0 70 0 0 0 0 0SLC NW NW 757 180 0.0 0.0 0.0 0.0 0 0 0 0 0 0 0SLC NW NW 320 148 1.2 2.3 2.4 1.2 353 173 0 0 0 0 0SLC NW NW 319 124 1.6 0.6 0.8 1.5 100 183 0 0 0 0 0SLC NW XJ ARJ 69 0.4 0.3 0.0 0.0 0 0 0 0 0 0 0SLC NW 9E CRJ 50 0.3 0.3 0.3 0.0 14 1 0 0 0 0 0
Subtotal 7.5 7.5 7.3 6.8 7.0 7.0 8.0 9.0 9.0 774 672 1012 1117 1281 1464 1660
Sacramento Target Seat Departures (a) 305 339 392 451 515SMF NW NW 757 180 0.5 0.0 0.0 0.0 0 0 0 0 0 0 0SMF NW NW 320 148 1.7 2.1 2.0 2.2 302 319 0 0 0 0 0SMF NW NW 319 124 0.2 0.1 0.1 0.1 16 14 0 0 0 0 0SMF DL DL 738 160 2.0 1.0 0 0 0 0 0 320 160SMF DL DL 757 183 0 0 0 0 0 0 0SMF DL DL NGC 180 2.0 0 0 0 0 0 0 360SMF DL DL 320 148 2.0 2.0 2.0 0 0 296 296 296 0 0SMF DL DL 319 124 0.4 0.8 1.0 0 0 0 50 99 124 0
Subtotal 2.4 2.2 2.2 2.3 2.0 2.4 2.8 3.0 3.0 318 333 296 346 395 444 520
Springfield, IL Target Seat Departures (a) 0 0 0 0 0SPI NW 9E CRJ 50 0.0 0.0 0.0 0.0 0 0 0 0 0 0 0SPI NW 9E CR7 70 0.0 0.0 0.0 0.0 0 0 0 0 0 0 0
Subtotal 0.0 0.0 0.0 0.0 0.0 0.0 0.0 0.0 0.0 0 0 0 0 0 0 0
Sarasota Target Seat Departures (a) 1 1 1 1 1SRQ NW NW 320 148 0.0 0.0 0.0 0.0 0 0 0 0 0 0 0SRQ NW NW 319 124 0.0 0.0 0.0 0.0 0 0 0 0 0 0 0SRQ DL DL 319 124 0.0 0.0 0.0 0.0 0.0 0 0 1 1 1 1 1
Subtotal 0.0 0.0 0.0 0.0 0.0 0.0 0.0 0.0 0.0 0 0 1 1 1 1 1
Saint Cloud Target Seat Departures (a) 143 155 175 196 219STC NW XJ SF3 33 5.4 4.7 4.6 3.9 151 127 0 0 0 0 0STC NW 9E CRJ 50 0.0 0.0 0.0 0.0 0 0 0 0 0 0 0STC DL DLX CRJ 50 0.5 0 0 0 0 25 0 0STC DL DLX SF3 33 4.2 4.7 4.5 3.0 0 0 139 155 149 99 0STC DL DLX NGT 50 2.0 4.4 0 0 0 0 0 100 220
Subtotal 5.4 4.7 4.6 3.9 4.2 4.7 5.0 5.0 4.4 151 127 139 155 174 199 220
St. Louis Target Seat Departures (a) 768 949 1041 1143 1253STL AA AA M80 129 0.0 0.0 0.0 0.0 0 0 0 0 0 0 0STL AA AA 738 142 0.0 0.0 0.0 0.0 0 0 0 0 0 0 0STL AA AX ER4 50 0.5 0.0 0.0 0.0 7.0 7.0 7.0 0 0 0 0 350 350 350STL AA RP ERD 44 5.1 5.6 6.3 6.8 7.0 7.0 278 301 308 308 0 0 0STL WN WN 73G 137 1.0 1.0 1.0 2.0 0 0 0 137 137 137 274STL NW NW DC9 78 0.0 0.0 0.0 0.0 0 0 0 0 0 0 0STL NW NW D9S 100 3.9 2.1 2.4 3.0 242 300 0 0 0 0 0STL NW NW D95 125 0.4 0.9 1.2 0.7 144 90 0 0 0 0 0STL NW NW 320 148 0.0 0.0 0.0 0.0 0 0 0 0 0 0 0STL NW NW 319 124 0.0 0.0 0.1 0.2 13 31 0 0 0 0 0STL NW NW E90 100 0.0 0.0 0.0 0.0 0 0 0 0 0 0 0STL NW 9E CR7 70 0.0 0.0 0.0 0.0 0 0 0 0 0 0 0STL NW XJ ARJ 69 1.6 0.8 0.0 0.0 0 0 0 0 0 0 0STL NW XJ CR9 76 0.0 0.0 0.4 1.1 31 82 0 0 0 0 0STL NW 9E CRJ 50 1.5 2.8 2.5 1.5 124 73 0 0 0 0 0STL DL DLX CRJ 50 2.5 2.5 1.0 0 0 125 125 50 0 0STL DL DLX CR7 70 0.5 0 0 35 0 0 0 0STL DL DLX CR9 76 1.5 3.0 5.0 5.0 0 0 0 114 228 380 380STL DL DL D9S 100 3.0 0 0 300 0 0 0 0STL DL DL 319 124 1.0 1.0 1.0 0 0 0 124 124 124 0STL DL DL M80 142 1.0 0 0 0 142 0 0 0STL DL DL M90 150 1.0 1.0 0 0 0 0 150 150 0STL DL DL NGA 120 2.0 0 0 0 0 0 0 240STL DL DL 738 160 0 0 0 0 0 0 0
Subtotal 13.0 12.1 12.9 13.4 13.0 14.0 14.0 15.0 16.0 833 878 768 950 1039 1141 1244
St. Thomas Target Seat Departures (a) 7 7 8 9 10STT SY SY 738 168 0.0 0.0 0.0 0.0 0.1 0.1 0.1 0.1 0.1 7 6 8 8 8 8 10
Subtotal 0.0 0.0 0.0 0.0 0.1 0.1 0.1 0.1 0.1 7 6 8 8 8 8 10
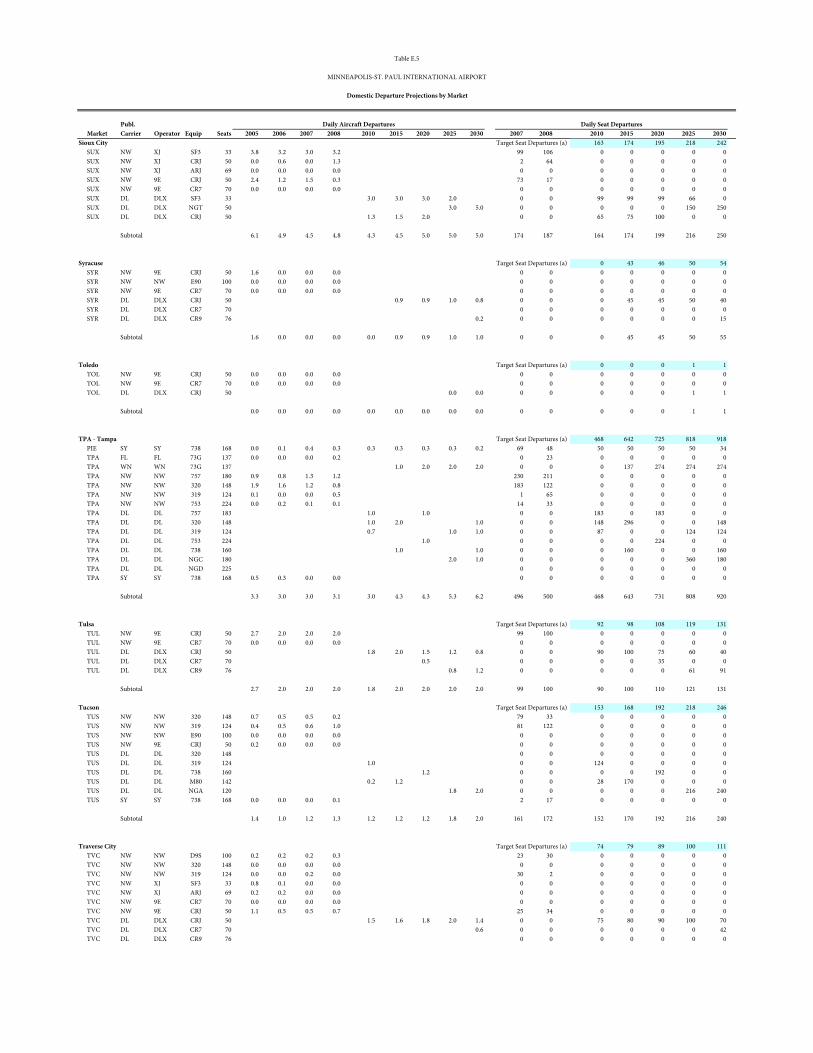
Publ.x Market Carrier Operator Equip Seats 2005 2006 2007 2008 x 2010 2015 2020 2025 2030 x 2007 2008 x 2010 2015 2020 2025 2030
Table E.5
MINNEAPOLIS-ST. PAUL INTERNATIONAL AIRPORT
Domestic Departure Projections by Market
Daily Aircraft Departures Daily Seat Departures
Sioux City Target Seat Departures (a) 163 174 195 218 242SUX NW XJ SF3 33 3.8 3.2 3.0 3.2 99 106 0 0 0 0 0SUX NW XJ CRJ 50 0.0 0.6 0.0 1.3 2 64 0 0 0 0 0SUX NW XJ ARJ 69 0.0 0.0 0.0 0.0 0 0 0 0 0 0 0SUX NW 9E CRJ 50 2.4 1.2 1.5 0.3 73 17 0 0 0 0 0SUX NW 9E CR7 70 0.0 0.0 0.0 0.0 0 0 0 0 0 0 0SUX DL DLX SF3 33 3.0 3.0 3.0 2.0 0 0 99 99 99 66 0SUX DL DLX NGT 50 3.0 5.0 0 0 0 0 0 150 250SUX DL DLX CRJ 50 1.3 1.5 2.0 0 0 65 75 100 0 0
Subtotal 6.1 4.9 4.5 4.8 4.3 4.5 5.0 5.0 5.0 174 187 164 174 199 216 250
Syracuse Target Seat Departures (a) 0 43 46 50 54SYR NW 9E CRJ 50 1.6 0.0 0.0 0.0 0 0 0 0 0 0 0SYR NW NW E90 100 0.0 0.0 0.0 0.0 0 0 0 0 0 0 0SYR NW 9E CR7 70 0.0 0.0 0.0 0.0 0 0 0 0 0 0 0SYR DL DLX CRJ 50 0.9 0.9 1.0 0.8 0 0 0 45 45 50 40SYR DL DLX CR7 70 0 0 0 0 0 0 0SYR DL DLX CR9 76 0.2 0 0 0 0 0 0 15
Subtotal 1.6 0.0 0.0 0.0 0.0 0.9 0.9 1.0 1.0 0 0 0 45 45 50 55
Toledo Target Seat Departures (a) 0 0 0 1 1TOL NW 9E CRJ 50 0.0 0.0 0.0 0.0 0 0 0 0 0 0 0TOL NW 9E CR7 70 0.0 0.0 0.0 0.0 0 0 0 0 0 0 0TOL DL DLX CRJ 50 0.0 0.0 0 0 0 0 0 1 1
Subtotal 0.0 0.0 0.0 0.0 0.0 0.0 0.0 0.0 0.0 0 0 0 0 0 1 1
TPA - Tampa Target Seat Departures (a) 468 642 725 818 918PIE SY SY 738 168 0.0 0.1 0.4 0.3 0.3 0.3 0.3 0.3 0.2 69 48 50 50 50 50 34TPA FL FL 73G 137 0.0 0.0 0.0 0.2 0 23 0 0 0 0 0TPA WN WN 73G 137 1.0 2.0 2.0 2.0 0 0 0 137 274 274 274TPA NW NW 757 180 0.9 0.8 1.3 1.2 230 211 0 0 0 0 0TPA NW NW 320 148 1.9 1.6 1.2 0.8 183 122 0 0 0 0 0TPA NW NW 319 124 0.1 0.0 0.0 0.5 1 65 0 0 0 0 0TPA NW NW 753 224 0.0 0.2 0.1 0.1 14 33 0 0 0 0 0TPA DL DL 757 183 1.0 1.0 0 0 183 0 183 0 0TPA DL DL 320 148 1.0 2.0 1.0 0 0 148 296 0 0 148TPA DL DL 319 124 0.7 1.0 1.0 0 0 87 0 0 124 124TPA DL DL 753 224 1.0 0 0 0 0 224 0 0TPA DL DL 738 160 1.0 1.0 0 0 0 160 0 0 160TPA DL DL NGC 180 2.0 1.0 0 0 0 0 0 360 180TPA DL DL NGD 225 0 0 0 0 0 0 0TPA SY SY 738 168 0.5 0.3 0.0 0.0 0 0 0 0 0 0 0
Subtotal 3.3 3.0 3.0 3.1 3.0 4.3 4.3 5.3 6.2 496 500 468 643 731 808 920
Tulsa Target Seat Departures (a) 92 98 108 119 131TUL NW 9E CRJ 50 2.7 2.0 2.0 2.0 99 100 0 0 0 0 0TUL NW 9E CR7 70 0.0 0.0 0.0 0.0 0 0 0 0 0 0 0TUL DL DLX CRJ 50 1.8 2.0 1.5 1.2 0.8 0 0 90 100 75 60 40TUL DL DLX CR7 70 0.5 0 0 0 0 35 0 0TUL DL DLX CR9 76 0.8 1.2 0 0 0 0 0 61 91
Subtotal 2.7 2.0 2.0 2.0 1.8 2.0 2.0 2.0 2.0 99 100 90 100 110 121 131
Tucson Target Seat Departures (a) 153 168 192 218 246TUS NW NW 320 148 0.7 0.5 0.5 0.2 79 33 0 0 0 0 0TUS NW NW 319 124 0.4 0.5 0.6 1.0 81 122 0 0 0 0 0TUS NW NW E90 100 0.0 0.0 0.0 0.0 0 0 0 0 0 0 0TUS NW 9E CRJ 50 0.2 0.0 0.0 0.0 0 0 0 0 0 0 0TUS DL DL 320 148 0 0 0 0 0 0 0TUS DL DL 319 124 1.0 0 0 124 0 0 0 0TUS DL DL 738 160 1.2 0 0 0 0 192 0 0TUS DL DL M80 142 0.2 1.2 0 0 28 170 0 0 0TUS DL DL NGA 120 1.8 2.0 0 0 0 0 0 216 240TUS SY SY 738 168 0.0 0.0 0.0 0.1 2 17 0 0 0 0 0
Subtotal 1.4 1.0 1.2 1.3 1.2 1.2 1.2 1.8 2.0 161 172 152 170 192 216 240
Traverse City Target Seat Departures (a) 74 79 89 100 111TVC NW NW D9S 100 0.2 0.2 0.2 0.3 23 30 0 0 0 0 0TVC NW NW 320 148 0.0 0.0 0.0 0.0 0 0 0 0 0 0 0TVC NW NW 319 124 0.0 0.0 0.2 0.0 30 2 0 0 0 0 0TVC NW XJ SF3 33 0.8 0.1 0.0 0.0 0 0 0 0 0 0 0TVC NW XJ ARJ 69 0.2 0.2 0.0 0.0 0 0 0 0 0 0 0TVC NW 9E CR7 70 0.0 0.0 0.0 0.0 0 0 0 0 0 0 0TVC NW 9E CRJ 50 1.1 0.5 0.5 0.7 25 34 0 0 0 0 0TVC DL DLX CRJ 50 1.5 1.6 1.8 2.0 1.4 0 0 75 80 90 100 70TVC DL DLX CR7 70 0.6 0 0 0 0 0 0 42TVC DL DLX CR9 76 0 0 0 0 0 0 0
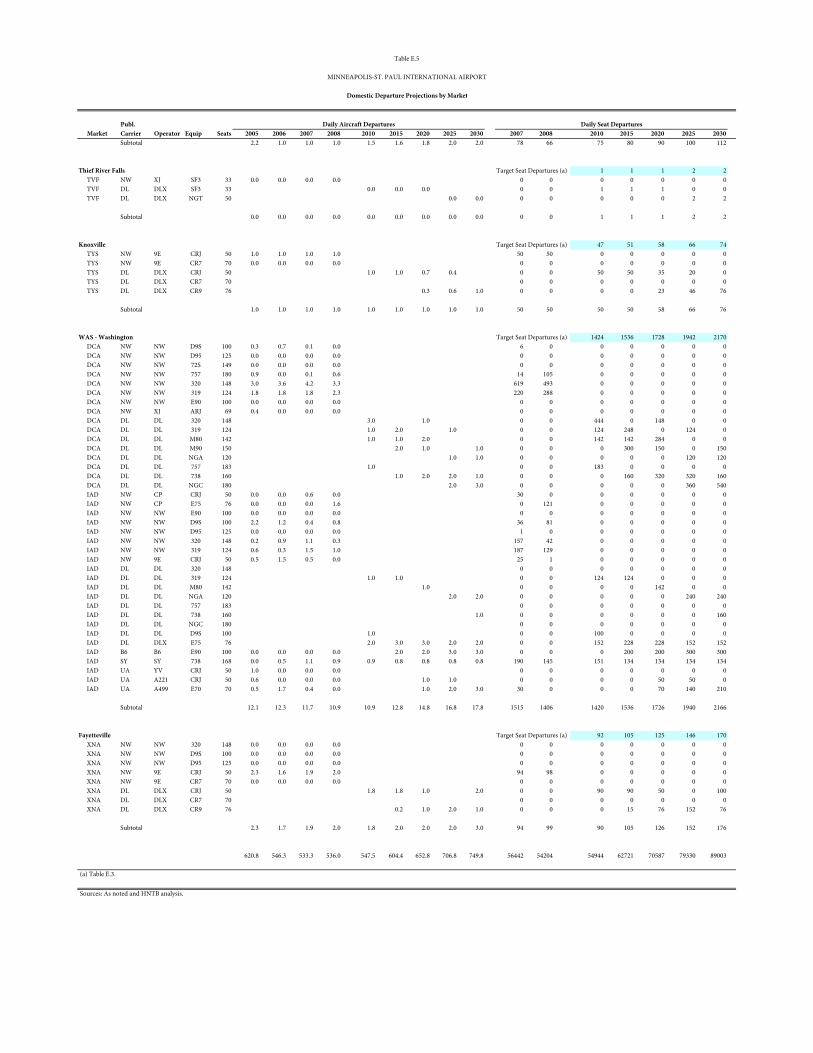
Publ.x Market Carrier Operator Equip Seats 2005 2006 2007 2008 x 2010 2015 2020 2025 2030 x 2007 2008 x 2010 2015 2020 2025 2030
Table E.5
MINNEAPOLIS-ST. PAUL INTERNATIONAL AIRPORT
Domestic Departure Projections by Market
Daily Aircraft Departures Daily Seat Departures
Subtotal 2.2 1.0 1.0 1.0 1.5 1.6 1.8 2.0 2.0 78 66 75 80 90 100 112
Thief River Falls Target Seat Departures (a) 1 1 1 2 2TVF NW XJ SF3 33 0.0 0.0 0.0 0.0 0 0 0 0 0 0 0TVF DL DLX SF3 33 0.0 0.0 0.0 0 0 1 1 1 0 0TVF DL DLX NGT 50 0.0 0.0 0 0 0 0 0 2 2
Subtotal 0.0 0.0 0.0 0.0 0.0 0.0 0.0 0.0 0.0 0 0 1 1 1 2 2
Knoxville Target Seat Departures (a) 47 51 58 66 74TYS NW 9E CRJ 50 1.0 1.0 1.0 1.0 50 50 0 0 0 0 0TYS NW 9E CR7 70 0.0 0.0 0.0 0.0 0 0 0 0 0 0 0TYS DL DLX CRJ 50 1.0 1.0 0.7 0.4 0 0 50 50 35 20 0TYS DL DLX CR7 70 0 0 0 0 0 0 0TYS DL DLX CR9 76 0.3 0.6 1.0 0 0 0 0 23 46 76
Subtotal 1.0 1.0 1.0 1.0 1.0 1.0 1.0 1.0 1.0 50 50 50 50 58 66 76
WAS - Washington Target Seat Departures (a) 1424 1536 1728 1942 2170DCA NW NW D9S 100 0.3 0.7 0.1 0.0 6 0 0 0 0 0 0DCA NW NW D95 125 0.0 0.0 0.0 0.0 0 0 0 0 0 0 0DCA NW NW 72S 149 0.0 0.0 0.0 0.0 0 0 0 0 0 0 0DCA NW NW 757 180 0.9 0.0 0.1 0.6 14 105 0 0 0 0 0DCA NW NW 320 148 3.0 3.6 4.2 3.3 619 493 0 0 0 0 0DCA NW NW 319 124 1.8 1.8 1.8 2.3 220 288 0 0 0 0 0DCA NW NW E90 100 0.0 0.0 0.0 0.0 0 0 0 0 0 0 0DCA NW XJ ARJ 69 0.4 0.0 0.0 0.0 0 0 0 0 0 0 0DCA DL DL 320 148 3.0 1.0 0 0 444 0 148 0 0DCA DL DL 319 124 1.0 2.0 1.0 0 0 124 248 0 124 0DCA DL DL M80 142 1.0 1.0 2.0 0 0 142 142 284 0 0DCA DL DL M90 150 2.0 1.0 1.0 0 0 0 300 150 0 150DCA DL DL NGA 120 1.0 1.0 0 0 0 0 0 120 120DCA DL DL 757 183 1.0 0 0 183 0 0 0 0DCA DL DL 738 160 1.0 2.0 2.0 1.0 0 0 0 160 320 320 160DCA DL DL NGC 180 2.0 3.0 0 0 0 0 0 360 540IAD NW CP CRJ 50 0.0 0.0 0.6 0.0 30 0 0 0 0 0 0IAD NW CP E75 76 0.0 0.0 0.0 1.6 0 121 0 0 0 0 0IAD NW NW E90 100 0.0 0.0 0.0 0.0 0 0 0 0 0 0 0IAD NW NW D9S 100 2.2 1.2 0.4 0.8 36 81 0 0 0 0 0IAD NW NW D95 125 0.0 0.0 0.0 0.0 1 0 0 0 0 0 0IAD NW NW 320 148 0.2 0.9 1.1 0.3 157 42 0 0 0 0 0IAD NW NW 319 124 0.6 0.3 1.5 1.0 187 129 0 0 0 0 0IAD NW 9E CRJ 50 0.5 1.5 0.5 0.0 25 1 0 0 0 0 0IAD DL DL 320 148 0 0 0 0 0 0 0IAD DL DL 319 124 1.0 1.0 0 0 124 124 0 0 0IAD DL DL M80 142 1.0 0 0 0 0 142 0 0IAD DL DL NGA 120 2.0 2.0 0 0 0 0 0 240 240IAD DL DL 757 183 0 0 0 0 0 0 0IAD DL DL 738 160 1.0 0 0 0 0 0 0 160IAD DL DL NGC 180 0 0 0 0 0 0 0IAD DL DL D9S 100 1.0 0 0 100 0 0 0 0IAD DL DLX E75 76 2.0 3.0 3.0 2.0 2.0 0 0 152 228 228 152 152IAD B6 B6 E90 100 0.0 0.0 0.0 0.0 2.0 2.0 3.0 3.0 0 0 0 200 200 300 300IAD SY SY 738 168 0.0 0.5 1.1 0.9 0.9 0.8 0.8 0.8 0.8 190 145 151 134 134 134 134IAD UA YV CRJ 50 1.0 0.0 0.0 0.0 0 0 0 0 0 0 0IAD UA A221 CRJ 50 0.6 0.0 0.0 0.0 1.0 1.0 0 0 0 0 50 50 0IAD UA A499 E70 70 0.5 1.7 0.4 0.0 1.0 2.0 3.0 30 0 0 0 70 140 210
Subtotal 12.1 12.3 11.7 10.9 10.9 12.8 14.8 16.8 17.8 1515 1406 1420 1536 1726 1940 2166
Fayetteville Target Seat Departures (a) 92 105 125 146 170XNA NW NW 320 148 0.0 0.0 0.0 0.0 0 0 0 0 0 0 0XNA NW NW D9S 100 0.0 0.0 0.0 0.0 0 0 0 0 0 0 0XNA NW NW D95 125 0.0 0.0 0.0 0.0 0 0 0 0 0 0 0XNA NW 9E CRJ 50 2.3 1.6 1.9 2.0 94 98 0 0 0 0 0XNA NW 9E CR7 70 0.0 0.0 0.0 0.0 0 0 0 0 0 0 0XNA DL DLX CRJ 50 1.8 1.8 1.0 2.0 0 0 90 90 50 0 100XNA DL DLX CR7 70 0 0 0 0 0 0 0XNA DL DLX CR9 76 0.2 1.0 2.0 1.0 0 0 0 15 76 152 76
Subtotal 2.3 1.7 1.9 2.0 1.8 2.0 2.0 2.0 3.0 94 99 90 105 126 152 176
620.8 546.3 533.3 536.0 547.5 604.4 652.8 706.8 749.8 56442 54204 54944 62721 70587 79330 89003
(a) Table E.3.
Sources: As noted and HNTB analysis.
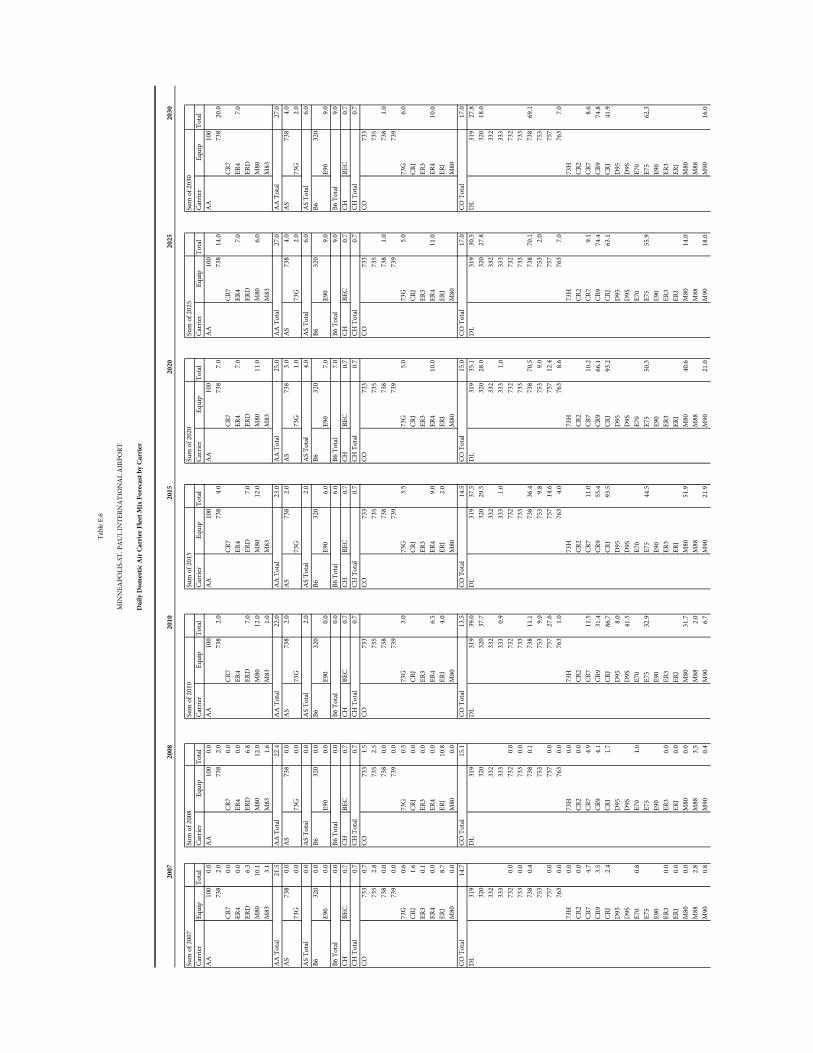
2007
2008
2010
2015
2020
2025
2030
Sum
of 2
007
Sum
of 2
008
Sum
of 2
010
Sum
of 2
015
Sum
of 2
020
Sum
of 2
025
Sum
of 2
030
Carr
ier
Equi
pTo
tal
Carr
ier
Equi
pTo
tal
Carr
ier
Equi
pTo
tal
Carr
ier
Equi
pTo
tal
Carr
ier
Equi
pTo
tal
Carr
ier
Equi
pTo
tal
Carr
ier
Equi
pTo
tal
AA
100
0.0
AA
100
0.0
AA
100
AA
100
AA
100
AA
100
AA
100
738
2.0
738
2.0
738
2.0
738
4.0
738
7.0
738
14.0
738
20.0
CR7
0.0
CR7
0.0
CR7
CR7
CR7
CR7
CR7
ER4
0.0
ER4
0.0
ER4
ER4
ER4
7.0
ER4
7.0
ER4
7.0
ERD
6.3
ERD
6.8
ERD
7.0
ERD
7.0
ERD
ERD
ERD
M80
10.1
M80
12.0
M80
12.0
M80
12.0
M80
11.0
M80
6.0
M80
M83
3.1
M83
1.6
M83
1.0
M83
M83
M83
M83
AA
Tot
a l21
.5A
A T
otal
22.4
AA
Tot
al22
.0A
A T
otal
23.0
AA
Tot
al25
.0A
A T
otal
27.0
AA
Tot
al27
.0A
S73
80.
0A
S73
80.
0A
S73
82.
0A
S73
82.
0A
S73
83.
0A
S73
84.
0A
S73
84.
073
G0.
073
G0.
073
G73
G73
G1.
073
G2.
073
G2.
0A
S To
tal
0.0
AS
Tota
l0.
0A
S To
tal
2.0
AS
Tota
l2.
0A
S To
tal
4.0
AS
Tota
l6.
0A
S To
tal
6.0
B632
00.
0B6
320
0.0
B632
0B6
320
B632
0B6
320
B632
0E9
00.
0E9
00.
0E9
00.
0E9
06.
0E9
07.
0E9
09.
0E9
09.
0B6
Tot
a l0.
0B6
Tot
al0.
0B6
Tot
al0.
0B6
Tot
al6.
0B6
Tot
al7.
0B6
Tot
al9.
0B6
Tot
al9.
0CH
BEC
0.7
CHBE
C0.
7CH
BEC
0.7
CHBE
C0.
7CH
BEC
0.7
CHBE
C0.
7CH
BEC
0.7
CH T
ota l
0.7
CH T
otal
0.7
CH T
otal
0.7
CH T
otal
0.7
CH T
otal
0.7
CH T
otal
0.7
CH T
otal
0.7
CO73
30.
7CO
733
1.5
CO73
3CO
733
CO73
3CO
733
CO73
373
52.
873
52.
573
573
573
573
573
573
80.
073
80.
073
873
873
873
81.
073
81.
073
90.
073
90.
073
973
973
973
973
973
G0.
673
G0.
373
G3.
073
G3.
573
G5.
073
G5.
073
G6.
0CR
J1.
6CR
J0.
0CR
JCR
JCR
JCR
JCR
JER
30.
1ER
30.
0ER
3ER
3ER
3ER
3ER
3ER
40.
0ER
40.
0ER
46.
5ER
49.
0ER
410
.0ER
411
.0ER
410
.0ER
J8.
7ER
J10
.8ER
J4.
0ER
J2.
0ER
JER
JER
JM
800.
0M
800.
0M
80M
80M
80M
80M
80CO
Tot
a l14
.7CO
Tot
al15
.1CO
Tot
al13
.5CO
Tot
al14
.5CO
Tot
al15
.0CO
Tot
al17
.0CO
Tot
al17
.0D
L31
9D
L31
9D
L31
939
.0D
L31
937
.5D
L31
935
.1D
L31
930
.5D
L31
927
.832
032
032
037
.732
029
.532
028
.032
027
.832
018
.033
233
233
233
233
233
233
233
333
333
30.
933
31.
033
31.
033
333
373
20.
073
20.
073
273
273
273
273
273
30.
073
30.
073
373
373
373
373
373
80.
473
80.
173
811
.173
836
.473
870
.573
870
.173
869
.175
375
375
39.
075
39.
875
39.
075
32.
075
375
70.
075
70.
075
727
.675
714
.675
712
.475
775
776
30.
076
30.
076
31.
076
34.
076
38.
676
37.
076
37.
073
H0.
073
H0.
073
H73
H73
H73
H73
HCR
20.
0CR
20.
0CR
2CR
2CR
2CR
2CR
2CR
74.
7CR
74.
9CR
711
.5CR
711
.0CR
710
.2CR
79.
1CR
78.
6CR
93.
5CR
94.
1CR
931
.4CR
955
.4CR
966
.1CR
974
.4CR
974
.8CR
J2.
4CR
J1.
7CR
J86
.7CR
J93
.5CR
J93
.2CR
J63
.1CR
J41
.9D
95D
95D
958.
0D
95D
95D
95D
95D
9SD
9SD
9S41
.5D
9SD
9SD
9SD
9SE7
00.
8E7
01.
0E7
0E7
0E7
0E7
0E7
0E7
5E7
5E7
532
.9E7
544
.5E7
550
.3E7
555
.9E7
562
.3E9
0E9
0E9
0E9
0E9
0E9
0E9
0ER
30.
0ER
30.
0ER
3ER
3ER
3ER
3ER
3ER
J0.
0ER
J0.
0ER
JER
JER
JER
JER
JM
800.
0M
800.
0M
8031
.7M
8051
.9M
8040
.6M
8014
.0M
80M
882.
8M
883.
5M
882.
0M
88M
88M
88M
88M
900.
8M
900.
4M
906.
7M
9021
.9M
9021
.0M
9018
.0M
9016
.0
Tabl
e E.6
MIN
NEA
POLI
S-ST
. PA
UL
INTE
RNA
TIO
NA
L A
IRPO
RT
Dai
ly D
omes
tic A
ir C
arri
er F
leet
Mix
For
ecas
t by
Carr
ier
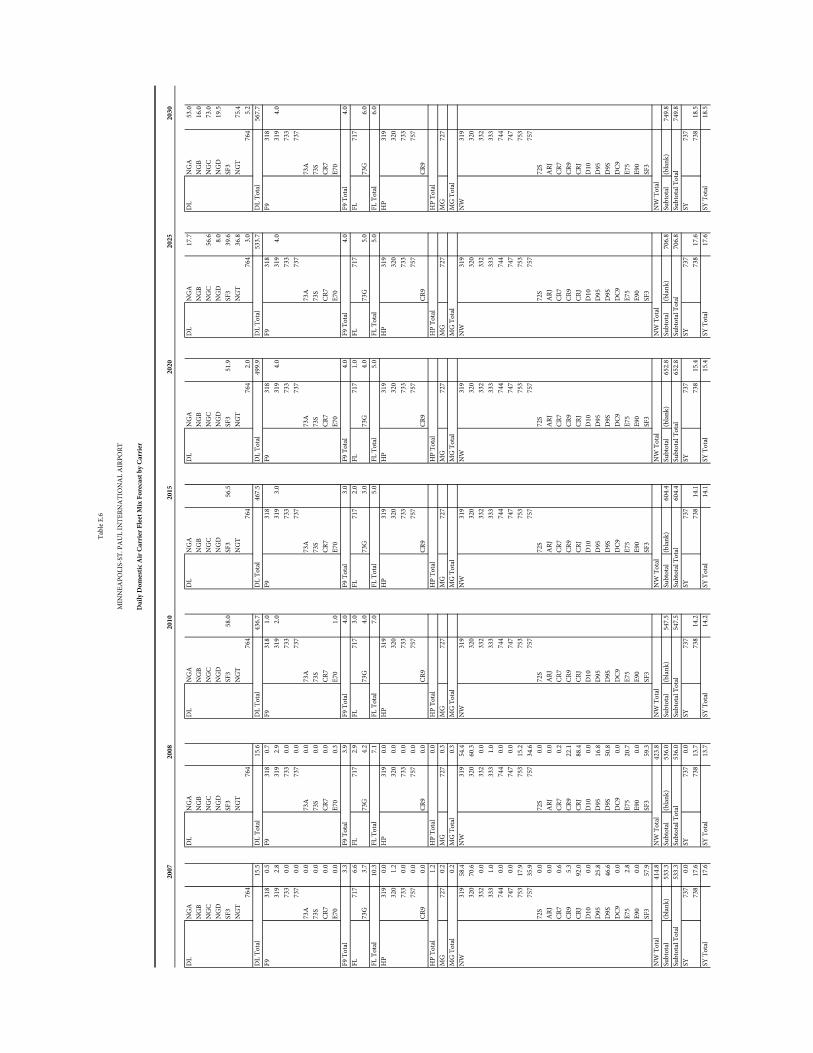
2007
2008
2010
2015
2020
2025
2030
Tabl
e E.6
MIN
NEA
POLI
S-ST
. PA
UL
INTE
RNA
TIO
NA
L A
IRPO
RT
Dai
ly D
omes
tic A
ir C
arri
er F
leet
Mix
For
ecas
t by
Carr
ier
DL
NG
AD
LN
GA
DL
NG
AD
LN
GA
DL
NG
AD
LN
GA
17.7
DL
NG
A53
.0N
GB
NG
BN
GB
NG
BN
GB
NG
BN
GB
16.0
NG
CN
GC
NG
CN
GC
NG
CN
GC
56.6
NG
C73
.0N
GD
NG
DN
GD
NG
DN
GD
NG
D8.
0N
GD
19.5
SF3
SF3
SF3
58.0
SF3
56.5
SF3
51.9
SF3
39.6
SF3
NG
TN
GT
NG
TN
GT
NG
TN
GT
36.8
NG
T75
.476
476
476
476
476
42.
076
43.
076
45.
2D
L To
tal
15.5
DL
Tota
l15
.6D
L To
tal
436.
7D
L To
tal
467.
5D
L To
tal
499.
9D
L To
tal
533.
7D
L To
tal
567.
7F9
318
0.5
F931
80.
7F9
318
1.0
F931
8F9
318
F931
8F9
318
319
2.8
319
2.9
319
2.0
319
3.0
319
4.0
319
4.0
319
4.0
733
0.0
733
0.0
733
733
733
733
733
737
0.0
737
0.0
737
737
737
737
737
73A
0.0
73A
0.0
73A
73A
73A
73A
73A
73S
0.0
73S
0.0
73S
73S
73S
73S
73S
CR7
0.0
CR7
0.0
CR7
CR7
CR7
CR7
CR7
E70
0.0
E70
0.3
E70
1.0
E70
E70
E70
E70
F9 T
ota l
3.3
F9 T
otal
3.9
F9 T
otal
4.0
F9 T
otal
3.0
F9 T
otal
4.0
F9 T
otal
4.0
F9 T
otal
4.0
FL71
76.
6FL
717
2.9
FL71
73.
0FL
717
2.0
FL71
71.
0FL
717
FL71
773
G3.
773
G4.
273
G4.
073
G3.
073
G4.
073
G5.
073
G6.
0FL
Tot
a l10
.3FL
Tot
al7.
1FL
Tot
al7.
0FL
Tot
al5.
0FL
Tot
al5.
0FL
Tot
al5.
0FL
Tot
al6.
0H
P31
90.
0H
P31
90.
0H
P31
9H
P31
9H
P31
9H
P31
9H
P31
932
01.
232
00.
032
032
032
032
032
073
30.
073
30.
073
373
373
373
373
375
70.
075
70.
075
775
775
775
775
7CR
90.
0CR
90.
0CR
9CR
9CR
9CR
9CR
9H
P To
tal
1.2
HP
Tota
l0.
0H
P To
tal
HP
Tota
lH
P To
tal
HP
Tota
lH
P To
tal
MG
727
0.2
MG
727
0.3
MG
727
MG
727
MG
727
MG
727
MG
727
MG
Tot
a l0.
2M
G T
otal
0.3
MG
Tot
alM
G T
otal
MG
Tot
alM
G T
otal
MG
Tot
alN
W31
958
.4N
W31
954
.4N
W31
9N
W31
9N
W31
9N
W31
9N
W31
932
070
.632
060
.332
032
032
032
032
033
20.
033
20.
033
233
233
233
233
233
31.
033
31.
033
333
333
333
333
374
40.
074
40.
074
474
474
474
474
474
70.
074
70.
074
774
774
774
774
775
317
.975
315
.275
375
375
375
375
375
735
.975
734
.675
775
775
775
775
772
S0.
072
S0.
072
S72
S72
S72
S72
SA
R J0.
0A
RJ0.
0A
RJA
RJA
RJA
RJA
RJCR
70.
6CR
70.
2CR
7CR
7CR
7CR
7CR
7CR
95.
3CR
922
.1CR
9CR
9CR
9CR
9CR
9CR
J92
.0CR
J88
.4CR
JCR
JCR
JCR
JCR
JD
100.
0D
100.
0D
10D
10D
10D
10D
10D
9525
.8D
9516
.8D
95D
95D
95D
95D
95D
9S46
.6D
9S50
.8D
9SD
9SD
9SD
9SD
9SD
C90.
0D
C90.
0D
C9D
C9D
C9D
C9D
C9E7
52.
8E7
520
.7E7
5E7
5E7
5E7
5E7
5E9
00.
0E9
00.
0E9
0E9
0E9
0E9
0E9
0SF
357
.9SF
359
.3SF
3SF
3SF
3SF
3SF
3N
W T
ota l
414.
8N
W T
otal
423.
8N
W T
otal
NW
Tot
alN
W T
otal
NW
Tot
alN
W T
otal
Subt
otal
(bla
nk)
533.
3Su
btot
al(b
lank
)53
6.0
Subt
otal
(bla
nk)
547.
5Su
btot
al(b
lank
)60
4.4
Subt
otal
(bla
nk)
652.
8Su
btot
al(b
lank
)70
6.8
Subt
otal
(bla
nk)
749.
8Su
btot
al T
ota l
533.
3Su
btot
al T
otal
536.
0Su
btot
al T
otal
547.
5Su
btot
al T
otal
604.
4Su
btot
al T
otal
652.
8Su
btot
al T
otal
706.
8Su
btot
al T
otal
749.
8SY
737
0.0
SY73
70.
0SY
737
SY73
7SY
737
SY73
7SY
737
738
17.6
738
13.7
738
14.2
738
14.1
738
15.4
738
17.6
738
18.5
SY T
ota l
17.6
SY T
otal
13.7
SY T
otal
14.2
SY T
otal
14.1
SY T
otal
15.4
SY T
otal
17.6
SY T
otal
18.5
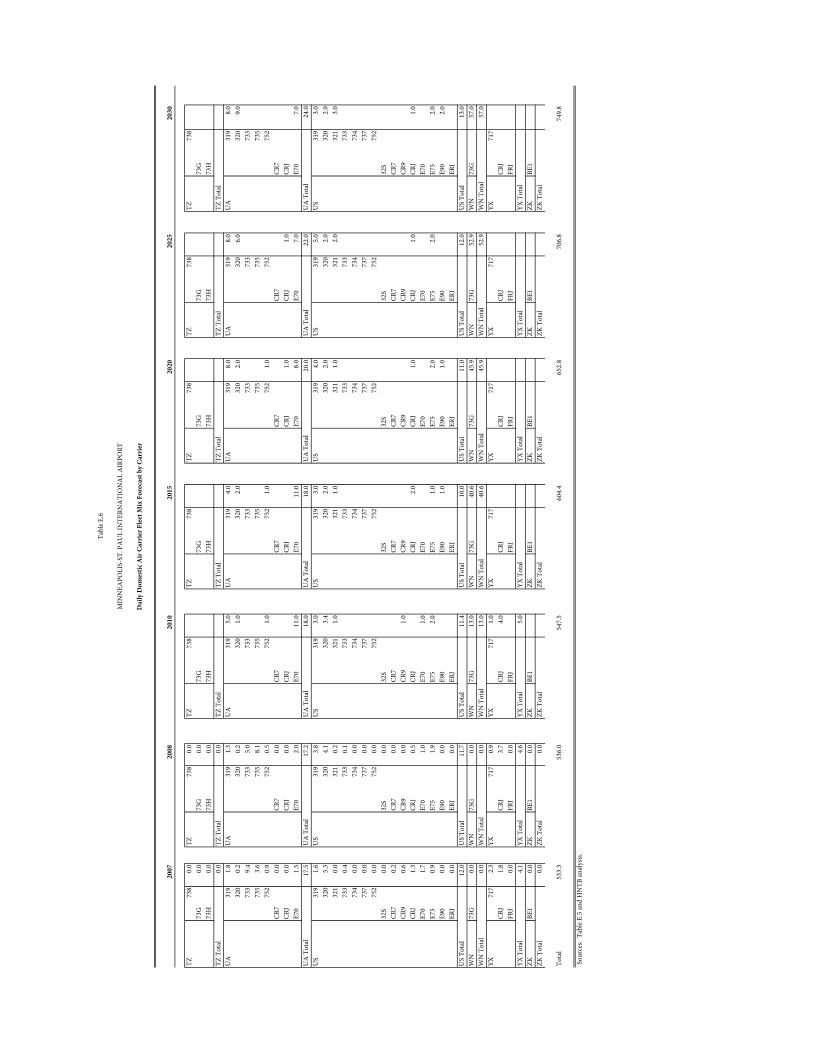
2007
2008
2010
2015
2020
2025
2030
Tabl
e E.6
MIN
NEA
POLI
S-ST
. PA
UL
INTE
RNA
TIO
NA
L A
IRPO
RT
Dai
ly D
omes
tic A
ir C
arri
er F
leet
Mix
For
ecas
t by
Carr
ier
TZ73
80.
0TZ
738
0.0
TZ73
8TZ
738
TZ73
8TZ
738
TZ73
873
G0.
073
G0.
073
G73
G73
G73
G73
G73
H0.
073
H0.
073
H73
H73
H73
H73
HTZ
Tot
a l0.
0TZ
Tot
al0.
0TZ
Tot
alTZ
Tot
alTZ
Tot
alTZ
Tot
alTZ
Tot
alU
A31
91.
8U
A31
91.
3U
A31
95.
0U
A31
94.
0U
A31
98.
0U
A31
98.
0U
A31
98.
032
00.
232
00.
232
01.
032
02.
032
02.
032
06.
032
09.
073
39.
473
35.
073
373
373
373
373
373
53.
673
58.
173
573
573
573
573
575
20.
975
20.
575
21.
075
21.
075
21.
075
275
2CR
70.
0CR
70.
0CR
7CR
7CR
7CR
7CR
7CR
J0.
0CR
J0.
0CR
JCR
JCR
J1.
0CR
J1.
0CR
JE7
01.
5E7
02.
0E7
011
.0E7
011
.0E7
08.
0E7
07.
0E7
07.
0U
A T
ota l
17.5
UA
Tot
al17
.2U
A T
otal
18.0
UA
Tot
al18
.0U
A T
otal
20.0
UA
Tot
al22
.0U
A T
otal
24.0
US
319
1.6
US
319
3.8
US
319
3.0
US
319
3.0
US
319
4.0
US
319
5.0
US
319
3.0
320
5.3
320
4.1
320
3.4
320
2.0
320
2.0
320
2.0
320
2.0
321
0.0
321
0.2
321
1.0
321
1.0
321
1.0
321
2.0
321
3.0
733
0.4
733
0.1
733
733
733
733
733
734
0.0
734
0.0
734
734
734
734
734
737
0.0
737
0.0
737
737
737
737
737
752
0.0
752
0.0
752
752
752
752
752
32S
0.0
32S
0.0
32S
32S
32S
32S
32S
CR7
0.2
CR7
0.0
CR7
CR7
CR7
CR7
CR7
CR9
0.6
CR9
0.0
CR9
1.0
CR9
CR9
CR9
CR9
CRJ
1.3
CRJ
0.5
CRJ
CRJ
2.0
CRJ
1.0
CRJ
1.0
CRJ
1.0
E70
1.7
E70
1.0
E70
1.0
E70
E70
E70
E70
E75
0.9
E75
1.9
E75
2.0
E75
1.0
E75
2.0
E75
2.0
E75
2.0
E90
0.0
E90
0.0
E90
E90
1.0
E90
1.0
E90
E90
2.0
ERJ
0.0
ERJ
0.0
ERJ
ERJ
ERJ
ERJ
ERJ
US
Tota
l12
.0U
S To
tal
11.7
US
Tota
l11
.4U
S To
tal
10.0
US
Tota
l11
.0U
S To
tal
12.0
US
Tota
l13
.0W
N73
G0.
0W
N73
G0.
0W
N73
G13
.0W
N73
G40
.6W
N73
G45
.9W
N73
G52
.9W
N73
G57
.0W
N T
ota l
0.0
WN
Tot
al0.
0W
N T
otal
13.0
WN
Tot
al40
.6W
N T
otal
45.9
WN
Tot
al52
.9W
N T
otal
57.0
YX71
72.
3YX
717
0.9
YX71
71.
0YX
717
YX71
7YX
717
YX71
7CR
J1.
8CR
J3.
7CR
J4.
0CR
JCR
JCR
JCR
JFR
J0.
0FR
J0.
0FR
JFR
JFR
JFR
JFR
JYX
Tot
a l4.
1YX
Tot
al4.
6YX
Tot
al5.
0YX
Tot
alYX
Tot
alYX
Tot
alYX
Tot
alZK
BE1
0.0
ZKBE
10.
0ZK
BE1
ZKBE
1ZK
BE1
ZKBE
1ZK
BE1
ZK T
otal
0.0
ZK T
otal
0.0
ZK T
otal
ZK T
otal
ZK T
otal
ZK T
otal
ZK T
otal
Tota
l53
3.3
536.
054
7.5
604.
465
2.8
706.
874
9.8
Sou
rces
: Ta
ble E
.5 an
d H
NTB
anal
ysis.
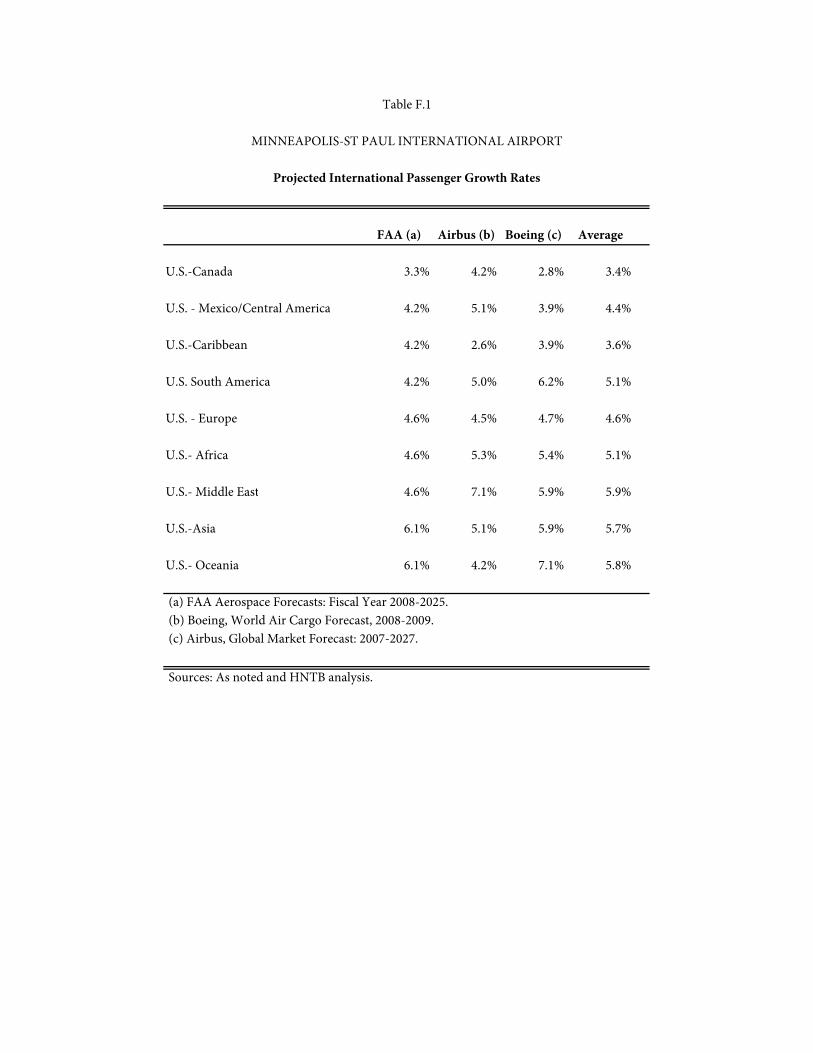
FAA (a) Airbus (b) Boeing (c) Average
U.S.-Canada 3.3% 4.2% 2.8% 3.4%
U.S. - Mexico/Central America 4.2% 5.1% 3.9% 4.4%
U.S.-Caribbean 4.2% 2.6% 3.9% 3.6%
U.S. South America 4.2% 5.0% 6.2% 5.1%
U.S. - Europe 4.6% 4.5% 4.7% 4.6%
U.S.- Africa 4.6% 5.3% 5.4% 5.1%
U.S.- Middle East 4.6% 7.1% 5.9% 5.9%
U.S.-Asia 6.1% 5.1% 5.9% 5.7%
U.S.- Oceania 6.1% 4.2% 7.1% 5.8%
(a) FAA Aerospace Forecasts: Fiscal Year 2008-2025. (b) Boeing, World Air Cargo Forecast, 2008-2009. (c) Airbus, Global Market Forecast: 2007-2027.
Sources: As noted and HNTB analysis.
MINNEAPOLIS-ST PAUL INTERNATIONAL AIRPORT
Table F.1
Projected International Passenger Growth Rates
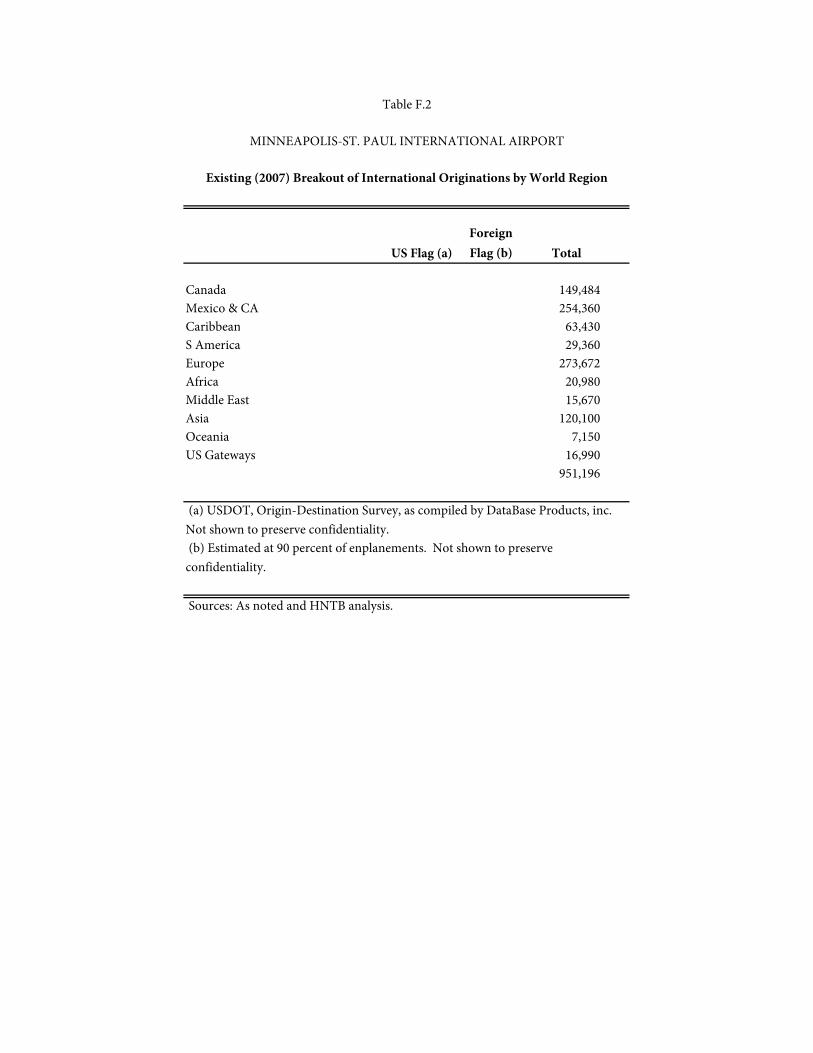
US Flag (a)Foreign Flag (b) Total
Canada 129,100 20384 149,484 Mexico & CA 254,360 254,360 Caribbean 63,430 63,430 S America 29,360 29,360 Europe 241,500 32172 273,672 Africa 20,980 20,980 Middle East 15,670 15,670 Asia 120,100 120,100 Oceania 7,150 7,150 US Gateways 16,790 200 16,990
951,196
Sources: As noted and HNTB analysis.
(b) Estimated at 90 percent of enplanements. Not shown to preserve confidentiality.
Table F.2
MINNEAPOLIS-ST. PAUL INTERNATIONAL AIRPORT
Existing (2007) Breakout of International Originations by World Region
(a) USDOT, Origin-Destination Survey, as compiled by DataBase Products, inc. Not shown to preserve confidentiality.
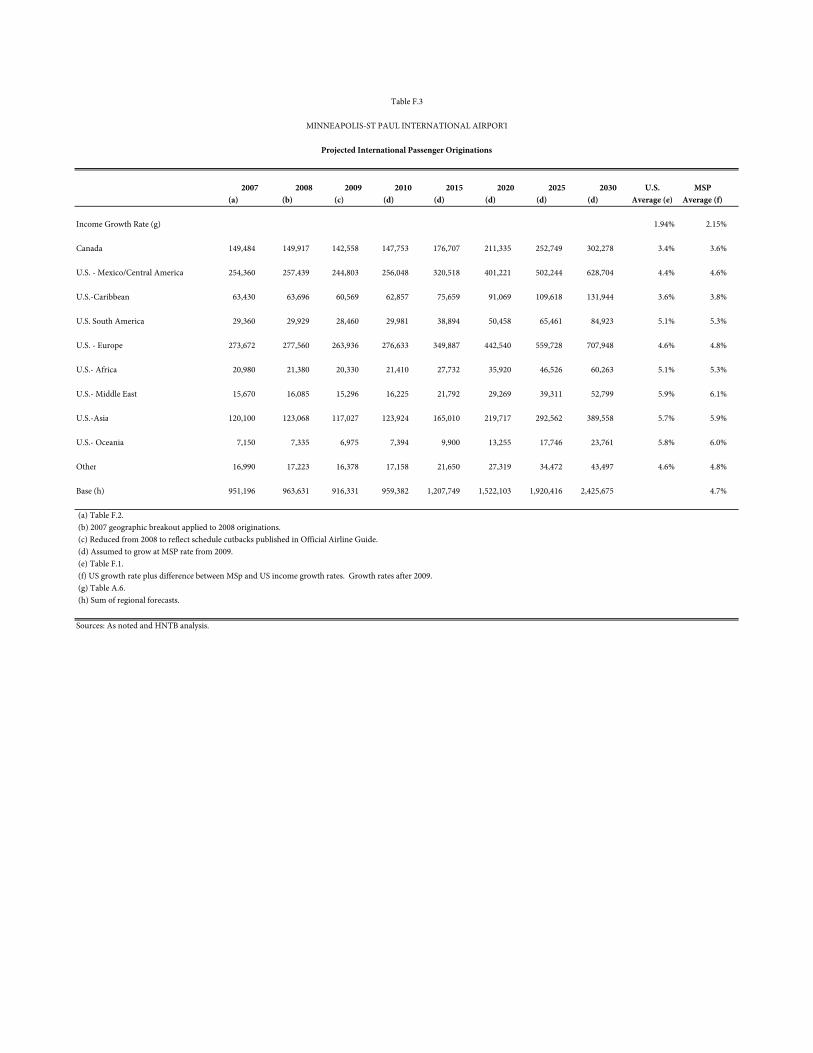
2007 2008 2009 2010 2015 2020 2025 2030 U.S. MSP(a) (b) (c) (d) (d) (d) (d) (d) Average (e) Average (f)
Income Growth Rate (g) 1.94% 2.15%
Canada 149,484 149,917 142,558 147,753 176,707 211,335 252,749 302,278 3.4% 3.6%
U.S. - Mexico/Central America 254,360 257,439 244,803 256,048 320,518 401,221 502,244 628,704 4.4% 4.6%
U.S.-Caribbean 63,430 63,696 60,569 62,857 75,659 91,069 109,618 131,944 3.6% 3.8%
U.S. South America 29,360 29,929 28,460 29,981 38,894 50,458 65,461 84,923 5.1% 5.3%
U.S. - Europe 273,672 277,560 263,936 276,633 349,887 442,540 559,728 707,948 4.6% 4.8%
U.S.- Africa 20,980 21,380 20,330 21,410 27,732 35,920 46,526 60,263 5.1% 5.3%
U.S.- Middle East 15,670 16,085 15,296 16,225 21,792 29,269 39,311 52,799 5.9% 6.1%
U.S.-Asia 120,100 123,068 117,027 123,924 165,010 219,717 292,562 389,558 5.7% 5.9%
U.S.- Oceania 7,150 7,335 6,975 7,394 9,900 13,255 17,746 23,761 5.8% 6.0%
Other 16,990 17,223 16,378 17,158 21,650 27,319 34,472 43,497 4.6% 4.8%
Base (h) 951,196 963,631 916,331 959,382 1,207,749 1,522,103 1,920,416 2,425,675 4.7%
(a) Table F.2. (b) 2007 geographic breakout applied to 2008 originations. (c) Reduced from 2008 to reflect schedule cutbacks published in Official Airline Guide. (d) Assumed to grow at MSP rate from 2009. (e) Table F.1. (f) US growth rate plus difference between MSp and US income growth rates. Growth rates after 2009. (g) Table A.6. (h) Sum of regional forecasts.
Sources: As noted and HNTB analysis.
Table F.3
MINNEAPOLIS-ST PAUL INTERNATIONAL AIRPORT
Projected International Passenger Originations
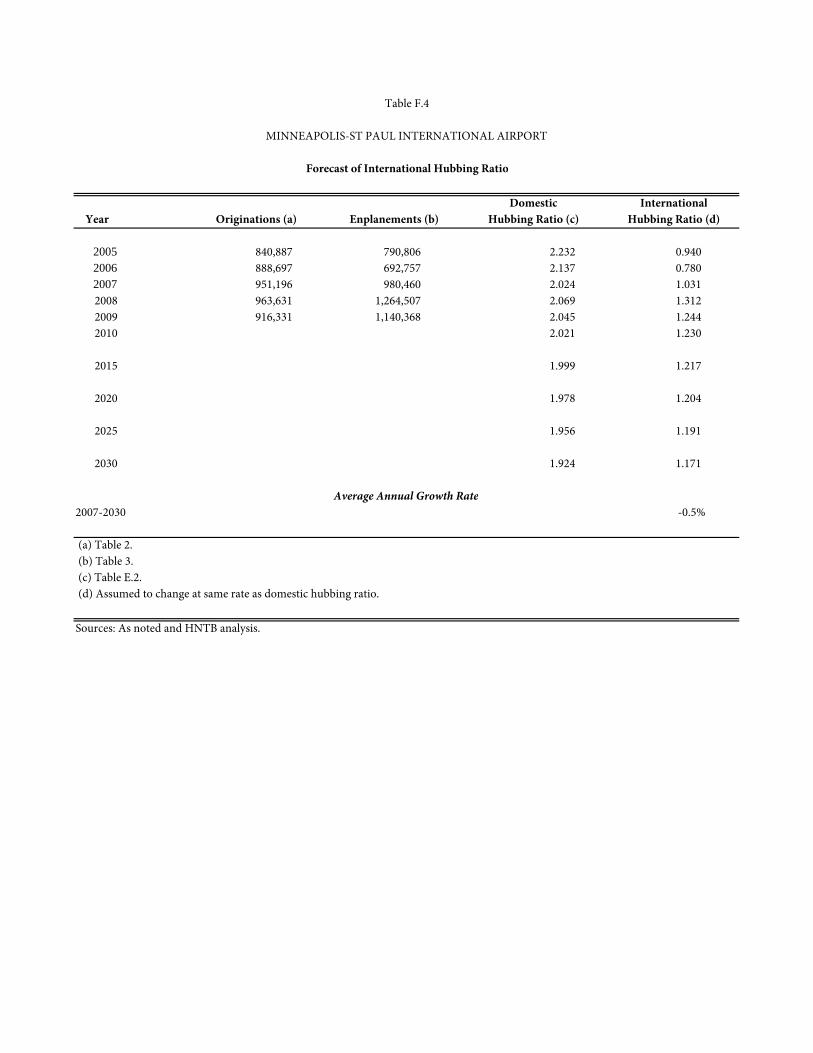
Domestic InternationalYear Originations (a) Enplanements (b) Hubbing Ratio (c) Hubbing Ratio (d)
2005 840,887 790,806 2.232 0.940 2006 888,697 692,757 2.137 0.780 2007 951,196 980,460 2.024 1.031 2008 963,631 1,264,507 2.069 1.312 2009 916,331 1,140,368 2.045 1.244 2010 2.021 1.230
2015 1.999 1.217
2020 1.978 1.204
2025 1.956 1.191
2030 1.924 1.171
2007-2030 -0.5%
(a) Table 2. (b) Table 3. (c) Table E.2. (d) Assumed to change at same rate as domestic hubbing ratio.
Sources: As noted and HNTB analysis.
MINNEAPOLIS-ST PAUL INTERNATIONAL AIRPORT
Forecast of International Hubbing Ratio
Table F.4
Average Annual Growth Rate
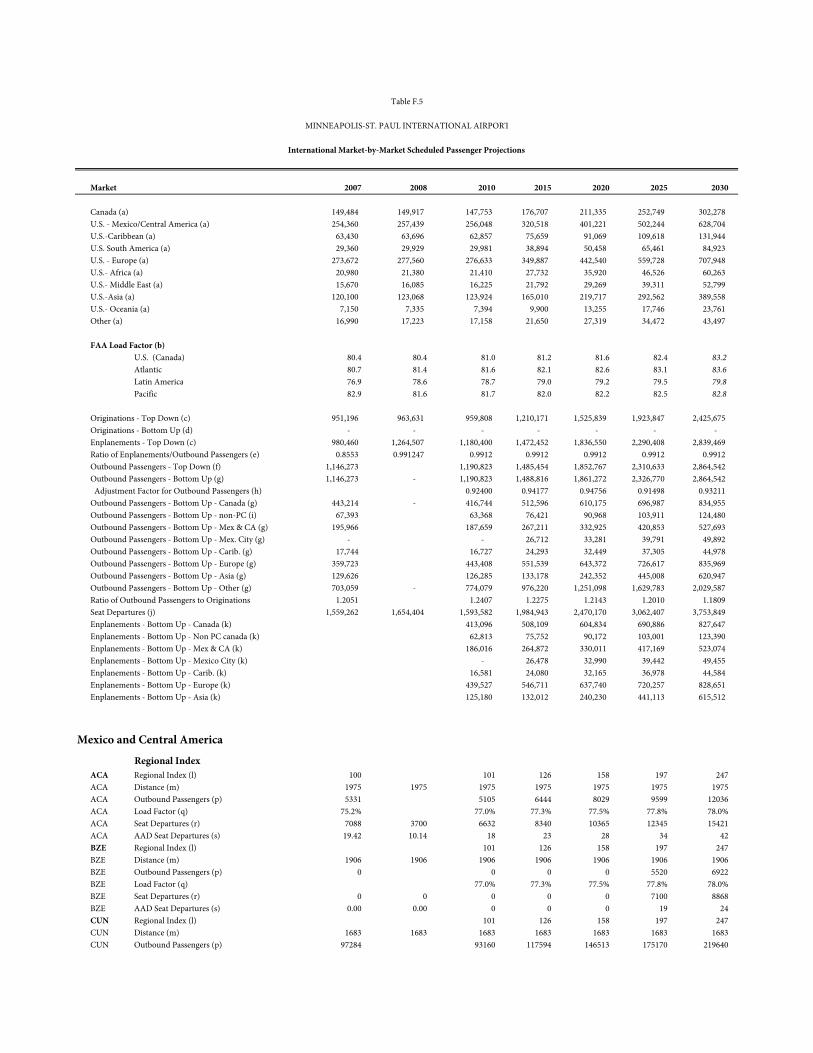
Market 2007 2008 2010 2015 2020 2025 2030
Canada (a) 149,484 149,917 147,753 176,707 211,335 252,749 302,278 U.S. - Mexico/Central America (a) 254,360 257,439 256,048 320,518 401,221 502,244 628,704 U.S.-Caribbean (a) 63,430 63,696 62,857 75,659 91,069 109,618 131,944 U.S. South America (a) 29,360 29,929 29,981 38,894 50,458 65,461 84,923 U.S. - Europe (a) 273,672 277,560 276,633 349,887 442,540 559,728 707,948 U.S.- Africa (a) 20,980 21,380 21,410 27,732 35,920 46,526 60,263 U.S.- Middle East (a) 15,670 16,085 16,225 21,792 29,269 39,311 52,799 U.S.-Asia (a) 120,100 123,068 123,924 165,010 219,717 292,562 389,558 U.S.- Oceania (a) 7,150 7,335 7,394 9,900 13,255 17,746 23,761 Other (a) 16,990 17,223 17,158 21,650 27,319 34,472 43,497
FAA Load Factor (b)U.S. (Canada) 80.4 80.4 81.0 81.2 81.6 82.4 83.2Atlantic 80.7 81.4 81.6 82.1 82.6 83.1 83.6Latin America 76.9 78.6 78.7 79.0 79.2 79.5 79.8Pacific 82.9 81.6 81.7 82.0 82.2 82.5 82.8
Originations - Top Down (c) 951,196 963,631 959,808 1,210,171 1,525,839 1,923,847 2,425,675 Originations - Bottom Up (d) - - - - - - - Enplanements - Top Down (c) 980,460 1,264,507 1,180,400 1,472,452 1,836,550 2,290,408 2,839,469 Ratio of Enplanements/Outbound Passengers (e) 0.8553 0.991247 0.9912 0.9912 0.9912 0.9912 0.9912 Outbound Passengers - Top Down (f) 1,146,273 1,190,823 1,485,454 1,852,767 2,310,633 2,864,542 Outbound Passengers - Bottom Up (g) 1,146,273 - 1,190,823 1,488,816 1,861,272 2,326,770 2,864,542 Adjustment Factor for Outbound Passengers (h) 0.92400 0.94177 0.94756 0.91498 0.93211 Outbound Passengers - Bottom Up - Canada (g) 443,214 - 416,744 512,596 610,175 696,987 834,955 Outbound Passengers - Bottom Up - non-PC (i) 67,393 63,368 76,421 90,968 103,911 124,480 Outbound Passengers - Bottom Up - Mex & CA (g) 195,966 187,659 267,211 332,925 420,853 527,693 Outbound Passengers - Bottom Up - Mex. City (g) - - 26,712 33,281 39,791 49,892 Outbound Passengers - Bottom Up - Carib. (g) 17,744 16,727 24,293 32,449 37,305 44,978 Outbound Passengers - Bottom Up - Europe (g) 359,723 443,408 551,539 643,372 726,617 835,969 Outbound Passengers - Bottom Up - Asia (g) 129,626 126,285 133,178 242,352 445,008 620,947 Outbound Passengers - Bottom Up - Other (g) 703,059 - 774,079 976,220 1,251,098 1,629,783 2,029,587 Ratio of Outbound Passengers to Originations 1.2051 1.2407 1.2275 1.2143 1.2010 1.1809 Seat Departures (j) 1,559,262 1,654,404 1,593,582 1,984,943 2,470,170 3,062,407 3,753,849 Enplanements - Bottom Up - Canada (k) 413,096 508,109 604,834 690,886 827,647 Enplanements - Bottom Up - Non PC canada (k) 62,813 75,752 90,172 103,001 123,390 Enplanements - Bottom Up - Mex & CA (k) 186,016 264,872 330,011 417,169 523,074 Enplanements - Bottom Up - Mexico City (k) - 26,478 32,990 39,442 49,455 Enplanements - Bottom Up - Carib. (k) 16,581 24,080 32,165 36,978 44,584 Enplanements - Bottom Up - Europe (k) 439,527 546,711 637,740 720,257 828,651 Enplanements - Bottom Up - Asia (k) 125,180 132,012 240,230 441,113 615,512
Regional IndexACA Regional Index (l) 100 101 126 158 197 247ACA Distance (m) 1975 1975 1975 1975 1975 1975 1975ACA Outbound Passengers (p) 5331 5105 6444 8029 9599 12036ACA Load Factor (q) 75.2% 77.0% 77.3% 77.5% 77.8% 78.0%ACA Seat Departures (r) 7088 3700 6632 8340 10365 12345 15421ACA AAD Seat Departures (s) 19.42 10.14 18 23 28 34 42BZE Regional Index (l) 101 126 158 197 247BZE Distance (m) 1906 1906 1906 1906 1906 1906 1906BZE Outbound Passengers (p) 0 0 0 0 5520 6922BZE Load Factor (q) 77.0% 77.3% 77.5% 77.8% 78.0%BZE Seat Departures (r) 0 0 0 0 0 7100 8868BZE AAD Seat Departures (s) 0.00 0.00 0 0 0 19 24CUN Regional Index (l) 101 126 158 197 247CUN Distance (m) 1683 1683 1683 1683 1683 1683 1683CUN Outbound Passengers (p) 97284 93160 117594 146513 175170 219640
Table F.5
MINNEAPOLIS-ST. PAUL INTERNATIONAL AIRPORT
International Market-by-Market Scheduled Passenger Projections
Mexico and Central America
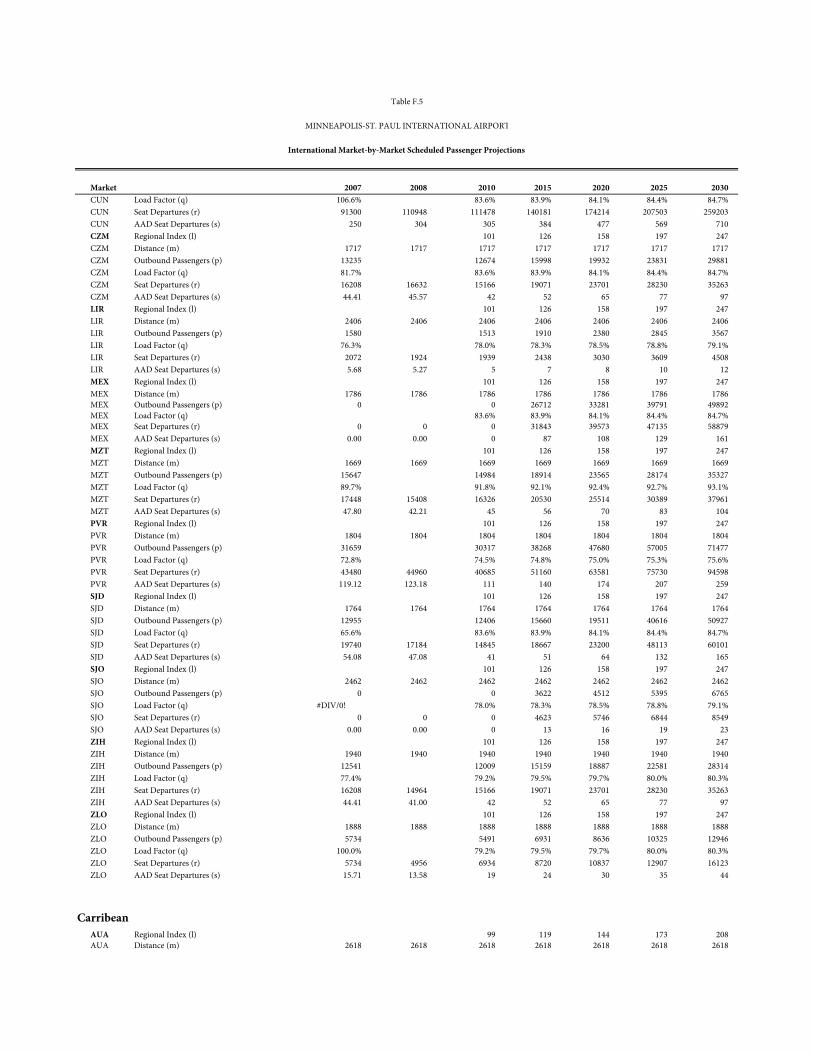
Market 2007 2008 2010 2015 2020 2025 2030
Table F.5
MINNEAPOLIS-ST. PAUL INTERNATIONAL AIRPORT
International Market-by-Market Scheduled Passenger Projections
CUN Load Factor (q) 106.6% 83.6% 83.9% 84.1% 84.4% 84.7%CUN Seat Departures (r) 91300 110948 111478 140181 174214 207503 259203CUN AAD Seat Departures (s) 250 304 305 384 477 569 710CZM Regional Index (l) 101 126 158 197 247CZM Distance (m) 1717 1717 1717 1717 1717 1717 1717CZM Outbound Passengers (p) 13235 12674 15998 19932 23831 29881CZM Load Factor (q) 81.7% 83.6% 83.9% 84.1% 84.4% 84.7%CZM Seat Departures (r) 16208 16632 15166 19071 23701 28230 35263CZM AAD Seat Departures (s) 44.41 45.57 42 52 65 77 97LIR Regional Index (l) 101 126 158 197 247LIR Distance (m) 2406 2406 2406 2406 2406 2406 2406LIR Outbound Passengers (p) 1580 1513 1910 2380 2845 3567LIR Load Factor (q) 76.3% 78.0% 78.3% 78.5% 78.8% 79.1%LIR Seat Departures (r) 2072 1924 1939 2438 3030 3609 4508LIR AAD Seat Departures (s) 5.68 5.27 5 7 8 10 12MEX Regional Index (l) 101 126 158 197 247MEX Distance (m) 1786 1786 1786 1786 1786 1786 1786MEX Outbound Passengers (p) 0 0 26712 33281 39791 49892MEX Load Factor (q) 83.6% 83.9% 84.1% 84.4% 84.7%MEX Seat Departures (r) 0 0 0 31843 39573 47135 58879MEX AAD Seat Departures (s) 0.00 0.00 0 87 108 129 161MZT Regional Index (l) 101 126 158 197 247MZT Distance (m) 1669 1669 1669 1669 1669 1669 1669MZT Outbound Passengers (p) 15647 14984 18914 23565 28174 35327MZT Load Factor (q) 89.7% 91.8% 92.1% 92.4% 92.7% 93.1%MZT Seat Departures (r) 17448 15408 16326 20530 25514 30389 37961MZT AAD Seat Departures (s) 47.80 42.21 45 56 70 83 104PVR Regional Index (l) 101 126 158 197 247PVR Distance (m) 1804 1804 1804 1804 1804 1804 1804PVR Outbound Passengers (p) 31659 30317 38268 47680 57005 71477PVR Load Factor (q) 72.8% 74.5% 74.8% 75.0% 75.3% 75.6%PVR Seat Departures (r) 43480 44960 40685 51160 63581 75730 94598PVR AAD Seat Departures (s) 119.12 123.18 111 140 174 207 259SJD Regional Index (l) 101 126 158 197 247SJD Distance (m) 1764 1764 1764 1764 1764 1764 1764SJD Outbound Passengers (p) 12955 12406 15660 19511 40616 50927SJD Load Factor (q) 65.6% 83.6% 83.9% 84.1% 84.4% 84.7%SJD Seat Departures (r) 19740 17184 14845 18667 23200 48113 60101SJD AAD Seat Departures (s) 54.08 47.08 41 51 64 132 165SJO Regional Index (l) 101 126 158 197 247SJO Distance (m) 2462 2462 2462 2462 2462 2462 2462SJO Outbound Passengers (p) 0 0 3622 4512 5395 6765SJO Load Factor (q) #DIV/0! 78.0% 78.3% 78.5% 78.8% 79.1%SJO Seat Departures (r) 0 0 0 4623 5746 6844 8549SJO AAD Seat Departures (s) 0.00 0.00 0 13 16 19 23ZIH Regional Index (l) 101 126 158 197 247ZIH Distance (m) 1940 1940 1940 1940 1940 1940 1940ZIH Outbound Passengers (p) 12541 12009 15159 18887 22581 28314ZIH Load Factor (q) 77.4% 79.2% 79.5% 79.7% 80.0% 80.3%ZIH Seat Departures (r) 16208 14964 15166 19071 23701 28230 35263ZIH AAD Seat Departures (s) 44.41 41.00 42 52 65 77 97ZLO Regional Index (l) 101 126 158 197 247ZLO Distance (m) 1888 1888 1888 1888 1888 1888 1888ZLO Outbound Passengers (p) 5734 5491 6931 8636 10325 12946ZLO Load Factor (q) 100.0% 79.2% 79.5% 79.7% 80.0% 80.3%ZLO Seat Departures (r) 5734 4956 6934 8720 10837 12907 16123ZLO AAD Seat Departures (s) 15.71 13.58 19 24 30 35 44
AUA Regional Index (l) 99 119 144 173 208AUA Distance (m) 2618 2618 2618 2618 2618 2618 2618
Carribean
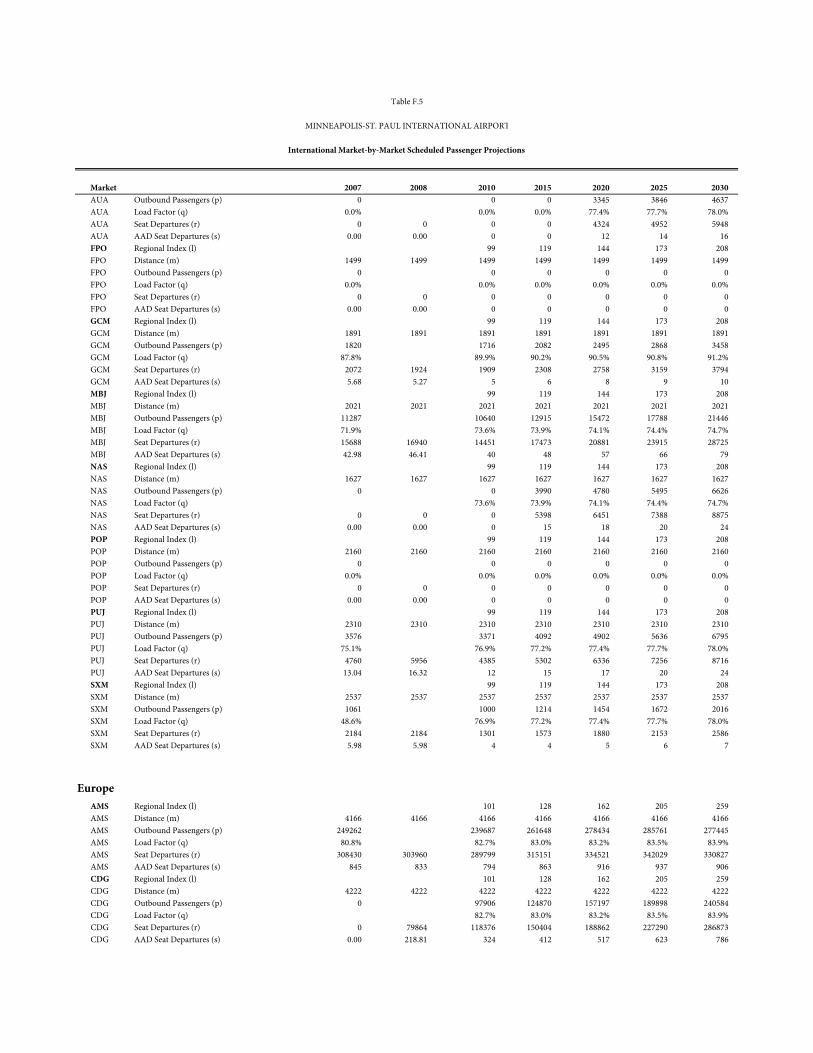
Market 2007 2008 2010 2015 2020 2025 2030
Table F.5
MINNEAPOLIS-ST. PAUL INTERNATIONAL AIRPORT
International Market-by-Market Scheduled Passenger Projections
AUA Outbound Passengers (p) 0 0 0 3345 3846 4637AUA Load Factor (q) 0.0% 0.0% 0.0% 77.4% 77.7% 78.0%AUA Seat Departures (r) 0 0 0 0 4324 4952 5948AUA AAD Seat Departures (s) 0.00 0.00 0 0 12 14 16FPO Regional Index (l) 99 119 144 173 208FPO Distance (m) 1499 1499 1499 1499 1499 1499 1499FPO Outbound Passengers (p) 0 0 0 0 0 0FPO Load Factor (q) 0.0% 0.0% 0.0% 0.0% 0.0% 0.0%FPO Seat Departures (r) 0 0 0 0 0 0 0FPO AAD Seat Departures (s) 0.00 0.00 0 0 0 0 0GCM Regional Index (l) 99 119 144 173 208GCM Distance (m) 1891 1891 1891 1891 1891 1891 1891GCM Outbound Passengers (p) 1820 1716 2082 2495 2868 3458GCM Load Factor (q) 87.8% 89.9% 90.2% 90.5% 90.8% 91.2%GCM Seat Departures (r) 2072 1924 1909 2308 2758 3159 3794GCM AAD Seat Departures (s) 5.68 5.27 5 6 8 9 10MBJ Regional Index (l) 99 119 144 173 208MBJ Distance (m) 2021 2021 2021 2021 2021 2021 2021MBJ Outbound Passengers (p) 11287 10640 12915 15472 17788 21446MBJ Load Factor (q) 71.9% 73.6% 73.9% 74.1% 74.4% 74.7%MBJ Seat Departures (r) 15688 16940 14451 17473 20881 23915 28725MBJ AAD Seat Departures (s) 42.98 46.41 40 48 57 66 79NAS Regional Index (l) 99 119 144 173 208NAS Distance (m) 1627 1627 1627 1627 1627 1627 1627NAS Outbound Passengers (p) 0 0 3990 4780 5495 6626NAS Load Factor (q) 73.6% 73.9% 74.1% 74.4% 74.7%NAS Seat Departures (r) 0 0 0 5398 6451 7388 8875NAS AAD Seat Departures (s) 0.00 0.00 0 15 18 20 24POP Regional Index (l) 99 119 144 173 208POP Distance (m) 2160 2160 2160 2160 2160 2160 2160POP Outbound Passengers (p) 0 0 0 0 0 0POP Load Factor (q) 0.0% 0.0% 0.0% 0.0% 0.0% 0.0%POP Seat Departures (r) 0 0 0 0 0 0 0POP AAD Seat Departures (s) 0.00 0.00 0 0 0 0 0PUJ Regional Index (l) 99 119 144 173 208PUJ Distance (m) 2310 2310 2310 2310 2310 2310 2310PUJ Outbound Passengers (p) 3576 3371 4092 4902 5636 6795PUJ Load Factor (q) 75.1% 76.9% 77.2% 77.4% 77.7% 78.0%PUJ Seat Departures (r) 4760 5956 4385 5302 6336 7256 8716PUJ AAD Seat Departures (s) 13.04 16.32 12 15 17 20 24SXM Regional Index (l) 99 119 144 173 208SXM Distance (m) 2537 2537 2537 2537 2537 2537 2537SXM Outbound Passengers (p) 1061 1000 1214 1454 1672 2016SXM Load Factor (q) 48.6% 76.9% 77.2% 77.4% 77.7% 78.0%SXM Seat Departures (r) 2184 2184 1301 1573 1880 2153 2586SXM AAD Seat Departures (s) 5.98 5.98 4 4 5 6 7
AMS Regional Index (l) 101 128 162 205 259AMS Distance (m) 4166 4166 4166 4166 4166 4166 4166AMS Outbound Passengers (p) 249262 239687 261648 278434 285761 277445AMS Load Factor (q) 80.8% 82.7% 83.0% 83.2% 83.5% 83.9%AMS Seat Departures (r) 308430 303960 289799 315151 334521 342029 330827AMS AAD Seat Departures (s) 845 833 794 863 916 937 906CDG Regional Index (l) 101 128 162 205 259CDG Distance (m) 4222 4222 4222 4222 4222 4222 4222CDG Outbound Passengers (p) 0 97906 124870 157197 189898 240584CDG Load Factor (q) 82.7% 83.0% 83.2% 83.5% 83.9%CDG Seat Departures (r) 0 79864 118376 150404 188862 227290 286873CDG AAD Seat Departures (s) 0.00 218.81 324 412 517 623 786
Europe
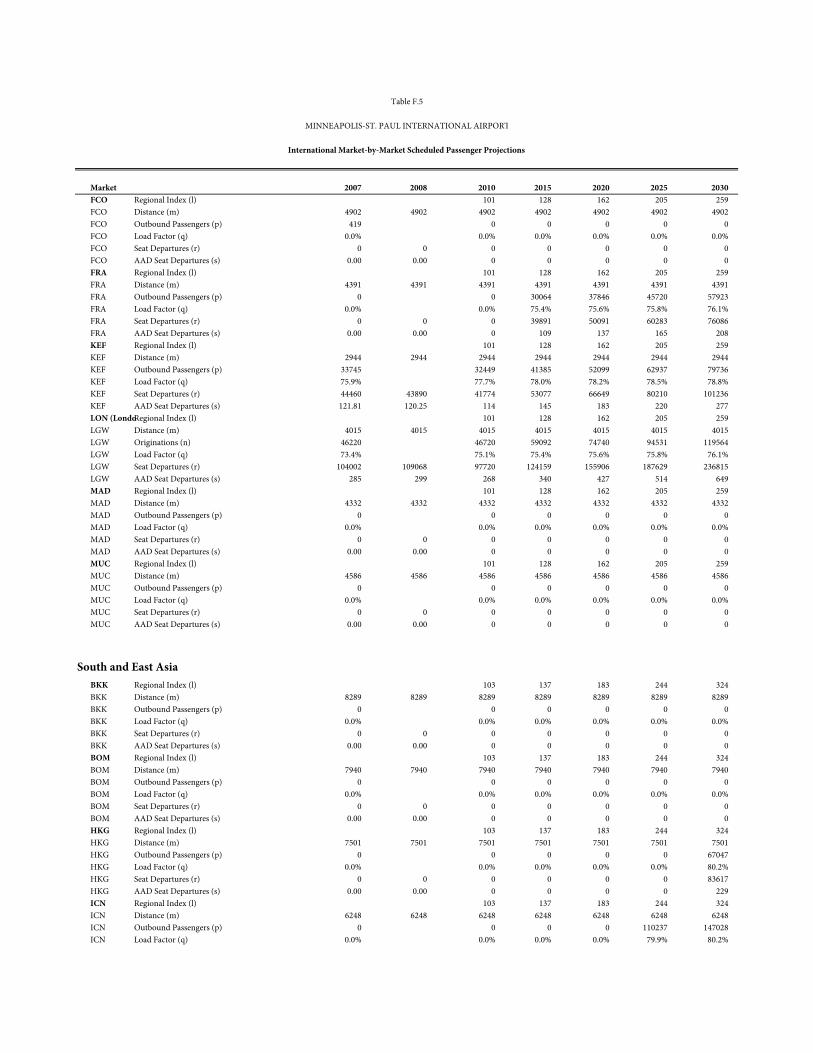
Market 2007 2008 2010 2015 2020 2025 2030
Table F.5
MINNEAPOLIS-ST. PAUL INTERNATIONAL AIRPORT
International Market-by-Market Scheduled Passenger Projections
FCO Regional Index (l) 101 128 162 205 259FCO Distance (m) 4902 4902 4902 4902 4902 4902 4902FCO Outbound Passengers (p) 419 0 0 0 0 0FCO Load Factor (q) 0.0% 0.0% 0.0% 0.0% 0.0% 0.0%FCO Seat Departures (r) 0 0 0 0 0 0 0FCO AAD Seat Departures (s) 0.00 0.00 0 0 0 0 0FRA Regional Index (l) 101 128 162 205 259FRA Distance (m) 4391 4391 4391 4391 4391 4391 4391FRA Outbound Passengers (p) 0 0 30064 37846 45720 57923FRA Load Factor (q) 0.0% 0.0% 75.4% 75.6% 75.8% 76.1%FRA Seat Departures (r) 0 0 0 39891 50091 60283 76086FRA AAD Seat Departures (s) 0.00 0.00 0 109 137 165 208KEF Regional Index (l) 101 128 162 205 259KEF Distance (m) 2944 2944 2944 2944 2944 2944 2944KEF Outbound Passengers (p) 33745 32449 41385 52099 62937 79736KEF Load Factor (q) 75.9% 77.7% 78.0% 78.2% 78.5% 78.8%KEF Seat Departures (r) 44460 43890 41774 53077 66649 80210 101236KEF AAD Seat Departures (s) 121.81 120.25 114 145 183 220 277LON (LondoRegional Index (l) 101 128 162 205 259LGW Distance (m) 4015 4015 4015 4015 4015 4015 4015LGW Originations (n) 46220 46720 59092 74740 94531 119564LGW Load Factor (q) 73.4% 75.1% 75.4% 75.6% 75.8% 76.1%LGW Seat Departures (r) 104002 109068 97720 124159 155906 187629 236815LGW AAD Seat Departures (s) 285 299 268 340 427 514 649MAD Regional Index (l) 101 128 162 205 259MAD Distance (m) 4332 4332 4332 4332 4332 4332 4332MAD Outbound Passengers (p) 0 0 0 0 0 0MAD Load Factor (q) 0.0% 0.0% 0.0% 0.0% 0.0% 0.0%MAD Seat Departures (r) 0 0 0 0 0 0 0MAD AAD Seat Departures (s) 0.00 0.00 0 0 0 0 0MUC Regional Index (l) 101 128 162 205 259MUC Distance (m) 4586 4586 4586 4586 4586 4586 4586MUC Outbound Passengers (p) 0 0 0 0 0 0MUC Load Factor (q) 0.0% 0.0% 0.0% 0.0% 0.0% 0.0%MUC Seat Departures (r) 0 0 0 0 0 0 0MUC AAD Seat Departures (s) 0.00 0.00 0 0 0 0 0
BKK Regional Index (l) 103 137 183 244 324BKK Distance (m) 8289 8289 8289 8289 8289 8289 8289BKK Outbound Passengers (p) 0 0 0 0 0 0BKK Load Factor (q) 0.0% 0.0% 0.0% 0.0% 0.0% 0.0%BKK Seat Departures (r) 0 0 0 0 0 0 0BKK AAD Seat Departures (s) 0.00 0.00 0 0 0 0 0BOM Regional Index (l) 103 137 183 244 324BOM Distance (m) 7940 7940 7940 7940 7940 7940 7940BOM Outbound Passengers (p) 0 0 0 0 0 0BOM Load Factor (q) 0.0% 0.0% 0.0% 0.0% 0.0% 0.0%BOM Seat Departures (r) 0 0 0 0 0 0 0BOM AAD Seat Departures (s) 0.00 0.00 0 0 0 0 0HKG Regional Index (l) 103 137 183 244 324HKG Distance (m) 7501 7501 7501 7501 7501 7501 7501HKG Outbound Passengers (p) 0 0 0 0 0 67047HKG Load Factor (q) 0.0% 0.0% 0.0% 0.0% 0.0% 80.2%HKG Seat Departures (r) 0 0 0 0 0 0 83617HKG AAD Seat Departures (s) 0.00 0.00 0 0 0 0 229ICN Regional Index (l) 103 137 183 244 324ICN Distance (m) 6248 6248 6248 6248 6248 6248 6248ICN Outbound Passengers (p) 0 0 0 0 110237 147028ICN Load Factor (q) 0.0% 0.0% 0.0% 0.0% 79.9% 80.2%
South and East Asia
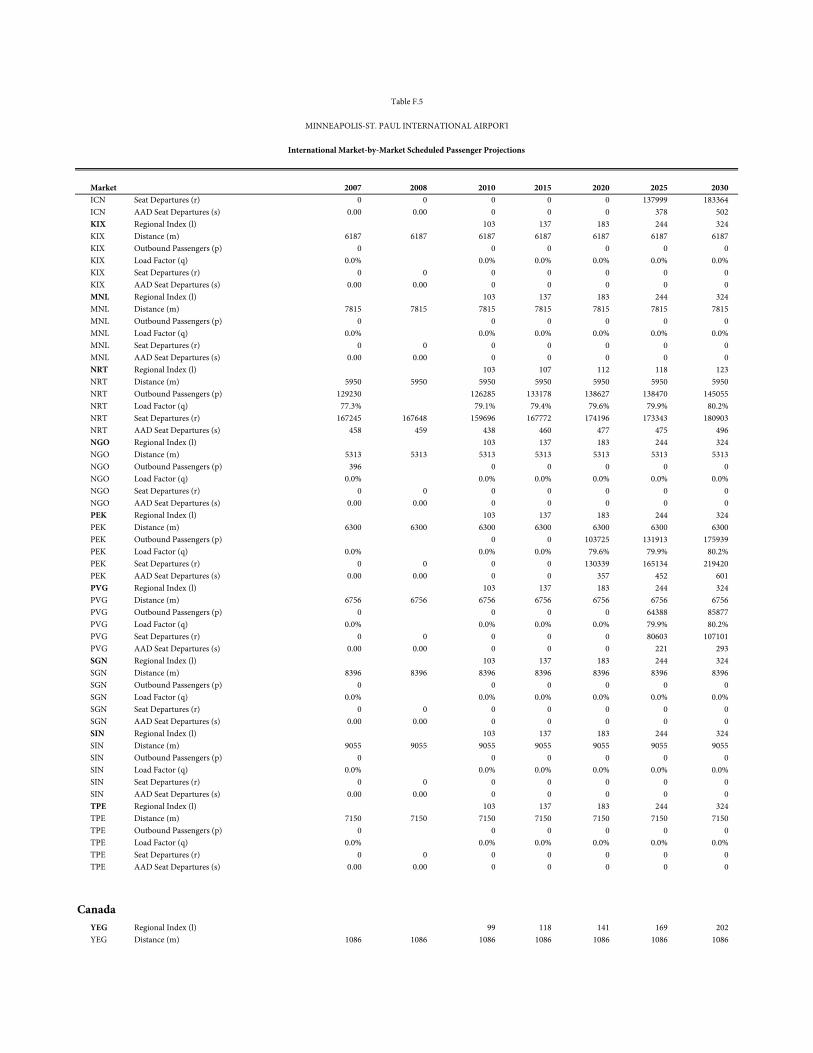
Market 2007 2008 2010 2015 2020 2025 2030
Table F.5
MINNEAPOLIS-ST. PAUL INTERNATIONAL AIRPORT
International Market-by-Market Scheduled Passenger Projections
ICN Seat Departures (r) 0 0 0 0 0 137999 183364ICN AAD Seat Departures (s) 0.00 0.00 0 0 0 378 502KIX Regional Index (l) 103 137 183 244 324KIX Distance (m) 6187 6187 6187 6187 6187 6187 6187KIX Outbound Passengers (p) 0 0 0 0 0 0KIX Load Factor (q) 0.0% 0.0% 0.0% 0.0% 0.0% 0.0%KIX Seat Departures (r) 0 0 0 0 0 0 0KIX AAD Seat Departures (s) 0.00 0.00 0 0 0 0 0MNL Regional Index (l) 103 137 183 244 324MNL Distance (m) 7815 7815 7815 7815 7815 7815 7815MNL Outbound Passengers (p) 0 0 0 0 0 0MNL Load Factor (q) 0.0% 0.0% 0.0% 0.0% 0.0% 0.0%MNL Seat Departures (r) 0 0 0 0 0 0 0MNL AAD Seat Departures (s) 0.00 0.00 0 0 0 0 0NRT Regional Index (l) 103 107 112 118 123NRT Distance (m) 5950 5950 5950 5950 5950 5950 5950NRT Outbound Passengers (p) 129230 126285 133178 138627 138470 145055NRT Load Factor (q) 77.3% 79.1% 79.4% 79.6% 79.9% 80.2%NRT Seat Departures (r) 167245 167648 159696 167772 174196 173343 180903NRT AAD Seat Departures (s) 458 459 438 460 477 475 496NGO Regional Index (l) 103 137 183 244 324NGO Distance (m) 5313 5313 5313 5313 5313 5313 5313NGO Outbound Passengers (p) 396 0 0 0 0 0NGO Load Factor (q) 0.0% 0.0% 0.0% 0.0% 0.0% 0.0%NGO Seat Departures (r) 0 0 0 0 0 0 0NGO AAD Seat Departures (s) 0.00 0.00 0 0 0 0 0PEK Regional Index (l) 103 137 183 244 324PEK Distance (m) 6300 6300 6300 6300 6300 6300 6300PEK Outbound Passengers (p) 0 0 103725 131913 175939PEK Load Factor (q) 0.0% 0.0% 0.0% 79.6% 79.9% 80.2%PEK Seat Departures (r) 0 0 0 0 130339 165134 219420PEK AAD Seat Departures (s) 0.00 0.00 0 0 357 452 601PVG Regional Index (l) 103 137 183 244 324PVG Distance (m) 6756 6756 6756 6756 6756 6756 6756PVG Outbound Passengers (p) 0 0 0 0 64388 85877PVG Load Factor (q) 0.0% 0.0% 0.0% 0.0% 79.9% 80.2%PVG Seat Departures (r) 0 0 0 0 0 80603 107101PVG AAD Seat Departures (s) 0.00 0.00 0 0 0 221 293SGN Regional Index (l) 103 137 183 244 324SGN Distance (m) 8396 8396 8396 8396 8396 8396 8396SGN Outbound Passengers (p) 0 0 0 0 0 0SGN Load Factor (q) 0.0% 0.0% 0.0% 0.0% 0.0% 0.0%SGN Seat Departures (r) 0 0 0 0 0 0 0SGN AAD Seat Departures (s) 0.00 0.00 0 0 0 0 0SIN Regional Index (l) 103 137 183 244 324SIN Distance (m) 9055 9055 9055 9055 9055 9055 9055SIN Outbound Passengers (p) 0 0 0 0 0 0SIN Load Factor (q) 0.0% 0.0% 0.0% 0.0% 0.0% 0.0%SIN Seat Departures (r) 0 0 0 0 0 0 0SIN AAD Seat Departures (s) 0.00 0.00 0 0 0 0 0TPE Regional Index (l) 103 137 183 244 324TPE Distance (m) 7150 7150 7150 7150 7150 7150 7150TPE Outbound Passengers (p) 0 0 0 0 0 0TPE Load Factor (q) 0.0% 0.0% 0.0% 0.0% 0.0% 0.0%TPE Seat Departures (r) 0 0 0 0 0 0 0TPE AAD Seat Departures (s) 0.00 0.00 0 0 0 0 0
YEG Regional Index (l) 99 118 141 169 202YEG Distance (m) 1086 1086 1086 1086 1086 1086 1086
Canada
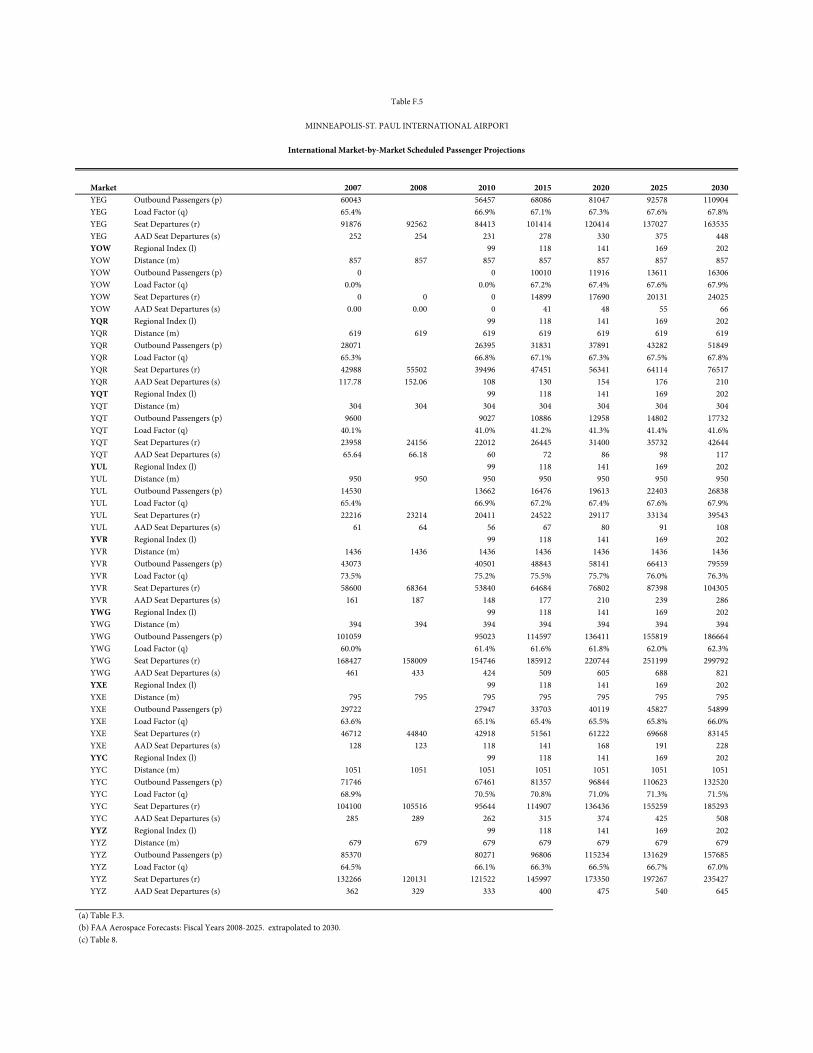
Market 2007 2008 2010 2015 2020 2025 2030
Table F.5
MINNEAPOLIS-ST. PAUL INTERNATIONAL AIRPORT
International Market-by-Market Scheduled Passenger Projections
YEG Outbound Passengers (p) 60043 56457 68086 81047 92578 110904YEG Load Factor (q) 65.4% 66.9% 67.1% 67.3% 67.6% 67.8%YEG Seat Departures (r) 91876 92562 84413 101414 120414 137027 163535YEG AAD Seat Departures (s) 252 254 231 278 330 375 448YOW Regional Index (l) 99 118 141 169 202YOW Distance (m) 857 857 857 857 857 857 857YOW Outbound Passengers (p) 0 0 10010 11916 13611 16306YOW Load Factor (q) 0.0% 0.0% 67.2% 67.4% 67.6% 67.9%YOW Seat Departures (r) 0 0 0 14899 17690 20131 24025YOW AAD Seat Departures (s) 0.00 0.00 0 41 48 55 66YQR Regional Index (l) 99 118 141 169 202YQR Distance (m) 619 619 619 619 619 619 619YQR Outbound Passengers (p) 28071 26395 31831 37891 43282 51849YQR Load Factor (q) 65.3% 66.8% 67.1% 67.3% 67.5% 67.8%YQR Seat Departures (r) 42988 55502 39496 47451 56341 64114 76517YQR AAD Seat Departures (s) 117.78 152.06 108 130 154 176 210YQT Regional Index (l) 99 118 141 169 202YQT Distance (m) 304 304 304 304 304 304 304YQT Outbound Passengers (p) 9600 9027 10886 12958 14802 17732YQT Load Factor (q) 40.1% 41.0% 41.2% 41.3% 41.4% 41.6%YQT Seat Departures (r) 23958 24156 22012 26445 31400 35732 42644YQT AAD Seat Departures (s) 65.64 66.18 60 72 86 98 117YUL Regional Index (l) 99 118 141 169 202YUL Distance (m) 950 950 950 950 950 950 950YUL Outbound Passengers (p) 14530 13662 16476 19613 22403 26838YUL Load Factor (q) 65.4% 66.9% 67.2% 67.4% 67.6% 67.9%YUL Seat Departures (r) 22216 23214 20411 24522 29117 33134 39543YUL AAD Seat Departures (s) 61 64 56 67 80 91 108YVR Regional Index (l) 99 118 141 169 202YVR Distance (m) 1436 1436 1436 1436 1436 1436 1436YVR Outbound Passengers (p) 43073 40501 48843 58141 66413 79559YVR Load Factor (q) 73.5% 75.2% 75.5% 75.7% 76.0% 76.3%YVR Seat Departures (r) 58600 68364 53840 64684 76802 87398 104305YVR AAD Seat Departures (s) 161 187 148 177 210 239 286YWG Regional Index (l) 99 118 141 169 202YWG Distance (m) 394 394 394 394 394 394 394YWG Outbound Passengers (p) 101059 95023 114597 136411 155819 186664YWG Load Factor (q) 60.0% 61.4% 61.6% 61.8% 62.0% 62.3%YWG Seat Departures (r) 168427 158009 154746 185912 220744 251199 299792YWG AAD Seat Departures (s) 461 433 424 509 605 688 821YXE Regional Index (l) 99 118 141 169 202YXE Distance (m) 795 795 795 795 795 795 795YXE Outbound Passengers (p) 29722 27947 33703 40119 45827 54899YXE Load Factor (q) 63.6% 65.1% 65.4% 65.5% 65.8% 66.0%YXE Seat Departures (r) 46712 44840 42918 51561 61222 69668 83145YXE AAD Seat Departures (s) 128 123 118 141 168 191 228YYC Regional Index (l) 99 118 141 169 202YYC Distance (m) 1051 1051 1051 1051 1051 1051 1051YYC Outbound Passengers (p) 71746 67461 81357 96844 110623 132520YYC Load Factor (q) 68.9% 70.5% 70.8% 71.0% 71.3% 71.5%YYC Seat Departures (r) 104100 105516 95644 114907 136436 155259 185293YYC AAD Seat Departures (s) 285 289 262 315 374 425 508YYZ Regional Index (l) 99 118 141 169 202YYZ Distance (m) 679 679 679 679 679 679 679YYZ Outbound Passengers (p) 85370 80271 96806 115234 131629 157685YYZ Load Factor (q) 64.5% 66.1% 66.3% 66.5% 66.7% 67.0%YYZ Seat Departures (r) 132266 120131 121522 145997 173350 197267 235427YYZ AAD Seat Departures (s) 362 329 333 400 475 540 645
(a) Table F.3. (b) FAA Aerospace Forecasts: Fiscal Years 2008-2025. extrapolated to 2030. (c) Table 8.
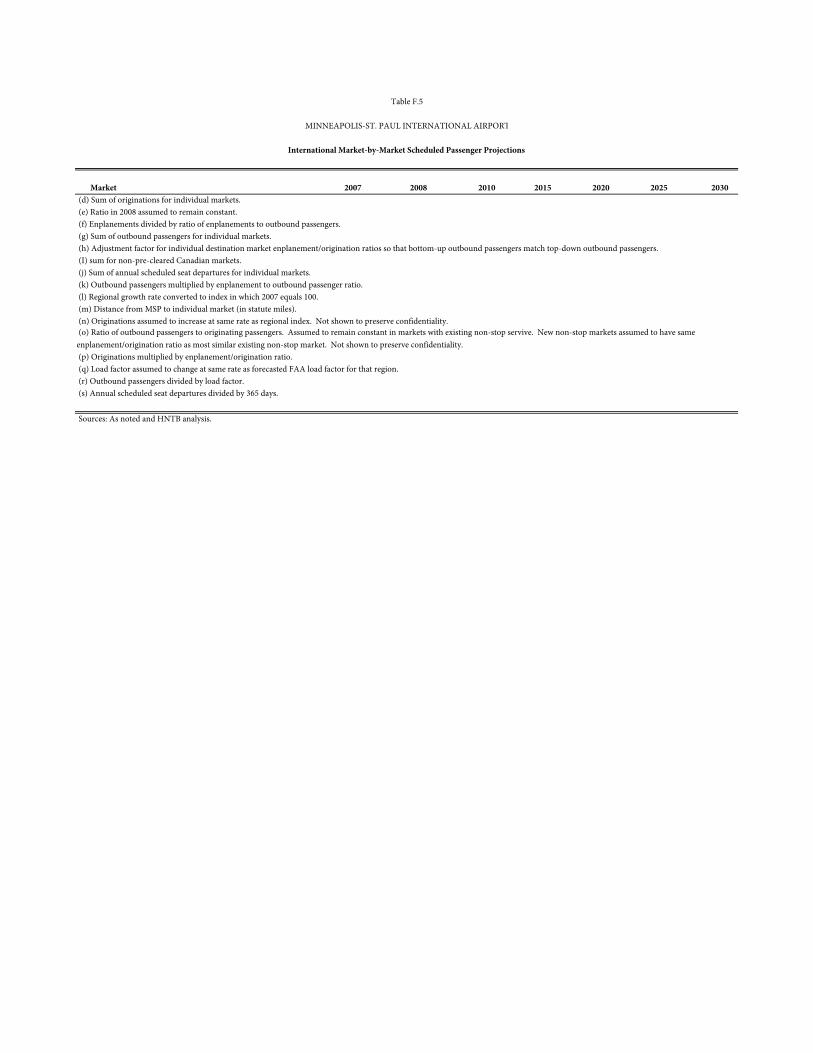
Market 2007 2008 2010 2015 2020 2025 2030
Table F.5
MINNEAPOLIS-ST. PAUL INTERNATIONAL AIRPORT
International Market-by-Market Scheduled Passenger Projections
(d) Sum of originations for individual markets. (e) Ratio in 2008 assumed to remain constant. (f) Enplanements divided by ratio of enplanements to outbound passengers. (g) Sum of outbound passengers for individual markets. (h) Adjustment factor for individual destination market enplanement/origination ratios so that bottom-up outbound passengers match top-down outbound passengers. (I) sum for non-pre-cleared Canadian markets. (j) Sum of annual scheduled seat departures for individual markets. (k) Outbound passengers multiplied by enplanement to outbound passenger ratio. (l) Regional growth rate converted to index in which 2007 equals 100. (m) Distance from MSP to individual market (in statute miles). (n) Originations assumed to increase at same rate as regional index. Not shown to preserve confidentiality.
(p) Originations multiplied by enplanement/origination ratio. (q) Load factor assumed to change at same rate as forecasted FAA load factor for that region. (r) Outbound passengers divided by load factor. (s) Annual scheduled seat departures divided by 365 days.
Sources: As noted and HNTB analysis.
(o) Ratio of outbound passengers to originating passengers. Assumed to remain constant in markets with existing non-stop servive. New non-stop markets assumed to have same enplanement/origination ratio as most similar existing non-stop market. Not shown to preserve confidentiality.
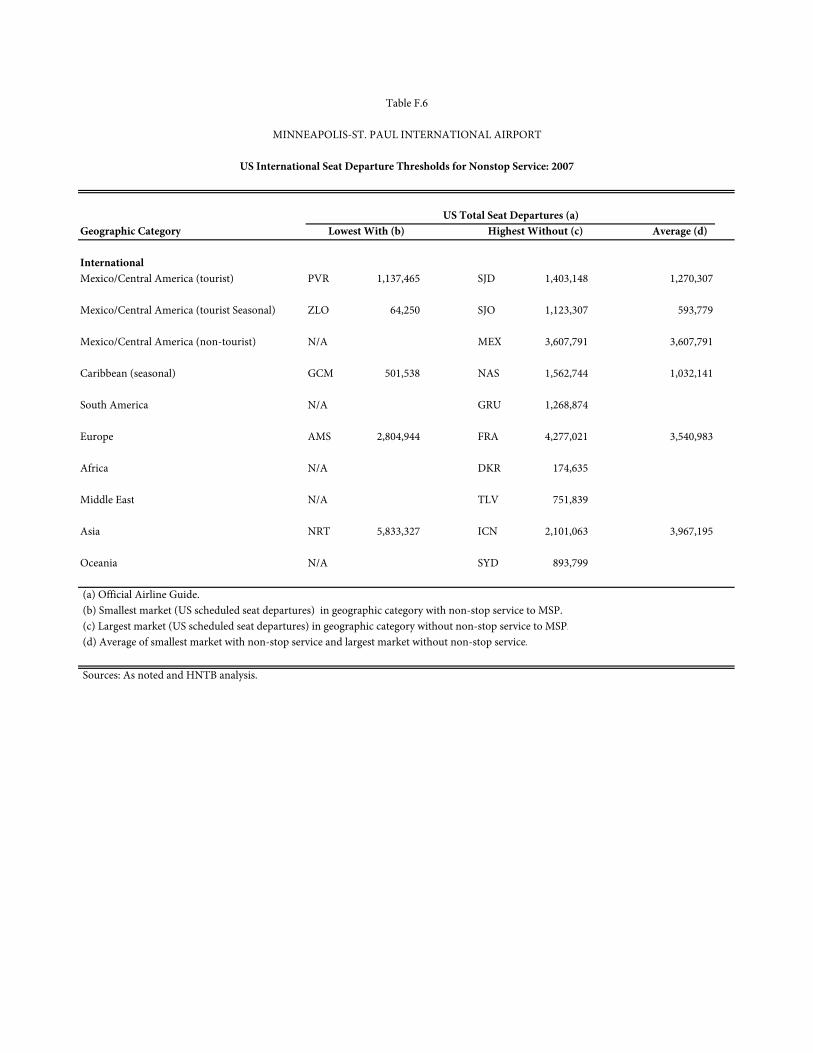
Geographic Category Average (d)
InternationalMexico/Central America (tourist) PVR 1,137,465 SJD 1,403,148 1,270,307
Mexico/Central America (tourist Seasonal) ZLO 64,250 SJO 1,123,307 593,779
Mexico/Central America (non-tourist) N/A MEX 3,607,791 3,607,791
Caribbean (seasonal) GCM 501,538 NAS 1,562,744 1,032,141
South America N/A GRU 1,268,874
Europe AMS 2,804,944 FRA 4,277,021 3,540,983
Africa N/A DKR 174,635
Middle East N/A TLV 751,839
Asia NRT 5,833,327 ICN 2,101,063 3,967,195
Oceania N/A SYD 893,799
(a) Official Airline Guide. (b) Smallest market (US scheduled seat departures) in geographic category with non-stop service to MSP. (c) Largest market (US scheduled seat departures) in geographic category without non-stop service to MSP. (d) Average of smallest market with non-stop service and largest market without non-stop service.
Sources: As noted and HNTB analysis.
Table F.6
US International Seat Departure Thresholds for Nonstop Service: 2007
Lowest With (b) Highest Without (c)
MINNEAPOLIS-ST. PAUL INTERNATIONAL AIRPORT
US Total Seat Departures (a)
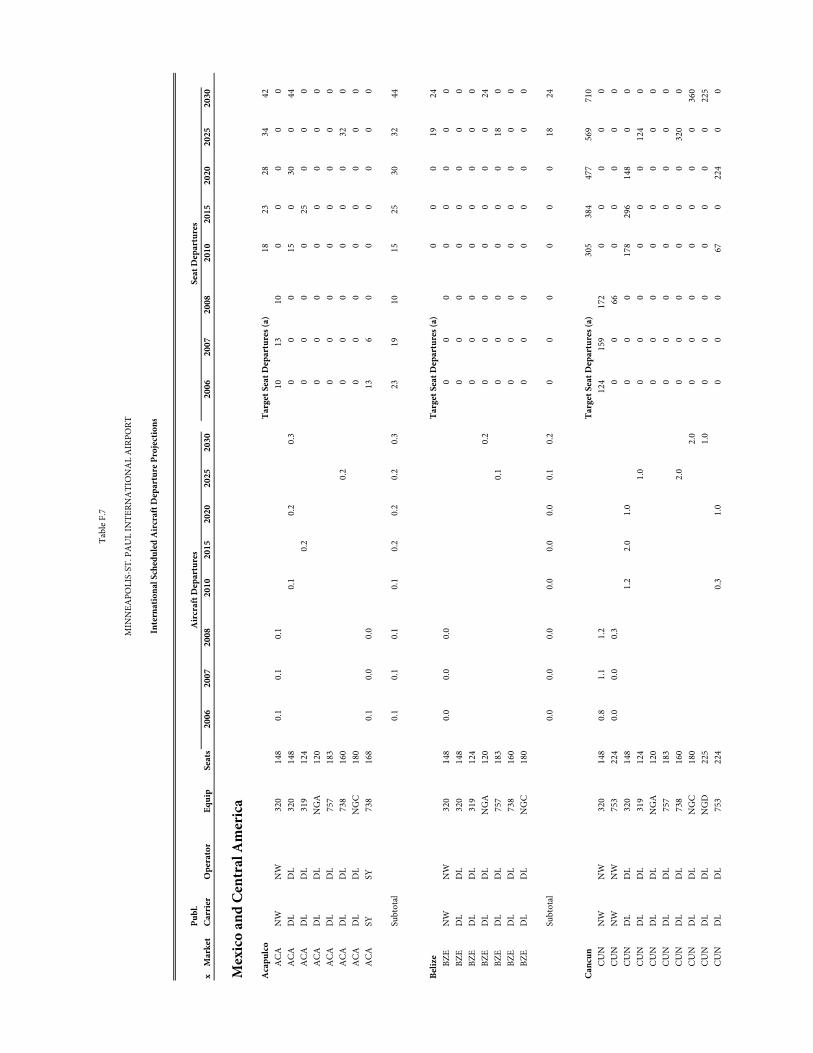
Pub
l.x
Mar
ket
Carr
ier
Ope
rato
rEq
uip
Seat
s20
0620
0720
08x
2010
2015
2020
2025
2030
x20
0620
0720
08x
2010
2015
2020
2025
2030
Mex
ico
and
Cent
ral A
mer
ica
Aca
pulc
oTa
rget
Sea
t Dep
artu
res (
a)18
2328
3442
ACA
NW
NW
320
148
0.1
0.1
0.1
1013
100
00
00
ACA
DL
DL
320
148
0.1
0.2
0.3
00
015
030
044
ACA
DL
DL
319
124
0.2
00
00
250
00
ACA
DL
DL
NG
A12
00
00
00
00
0A
CAD
LD
L75
718
30
00
00
00
0A
CAD
LD
L73
816
00.
20
00
00
032
0A
CAD
LD
LN
GC
180
00
00
00
00
ACA
SYSY
738
168
0.1
0.0
0.0
136
00
00
00
Subt
otal
0.1
0.1
0.1
0.1
0.2
0.2
0.2
0.3
2319
1015
2530
3244
Beliz
eTa
rget
Sea
t Dep
artu
res (
a)0
00
1924
BZE
NW
NW
320
148
0.0
0.0
0.0
00
00
00
00
BZE
DL
DL
320
148
00
00
00
00
BZE
DL
DL
319
124
00
00
00
00
BZE
DL
DL
NG
A12
00.
20
00
00
00
24BZ
ED
LD
L75
718
30.
10
00
00
018
0BZ
ED
LD
L73
816
00
00
00
00
0BZ
ED
LD
LN
GC
180
00
00
00
00
Subt
otal
0.0
0.0
0.0
0.0
0.0
0.0
0.1
0.2
00
00
00
1824
Canc
unTa
rget
Sea
t Dep
artu
res (
a)30
538
447
756
971
0CU
NN
WN
W32
014
80.
81.
11.
212
415
917
20
00
00
CUN
NW
NW
753
224
0.0
0.0
0.3
00
660
00
00
CUN
DL
DL
320
148
1.2
2.0
1.0
00
017
829
614
80
0CU
ND
LD
L31
912
41.
00
00
00
012
40
CUN
DL
DL
NG
A12
00
00
00
00
0CU
ND
LD
L75
718
30
00
00
00
0CU
ND
LD
L73
816
02.
00
00
00
032
00
CUN
DL
DL
NG
C18
02.
00
00
00
00
360
CUN
DL
DL
NG
D22
51.
00
00
00
00
225
CUN
DL
DL
753
224
0.3
1.0
00
067
022
40
0
Tabl
e F.7
MIN
NEA
POLI
S-ST
. PA
UL
INTE
RNA
TIO
NA
L A
IRPO
RT
Inte
rnat
iona
l Sch
edul
ed A
ircr
aft D
epar
ture
Pro
ject
ions
Air
craf
t Dep
artu
res
Seat
Dep
artu
res
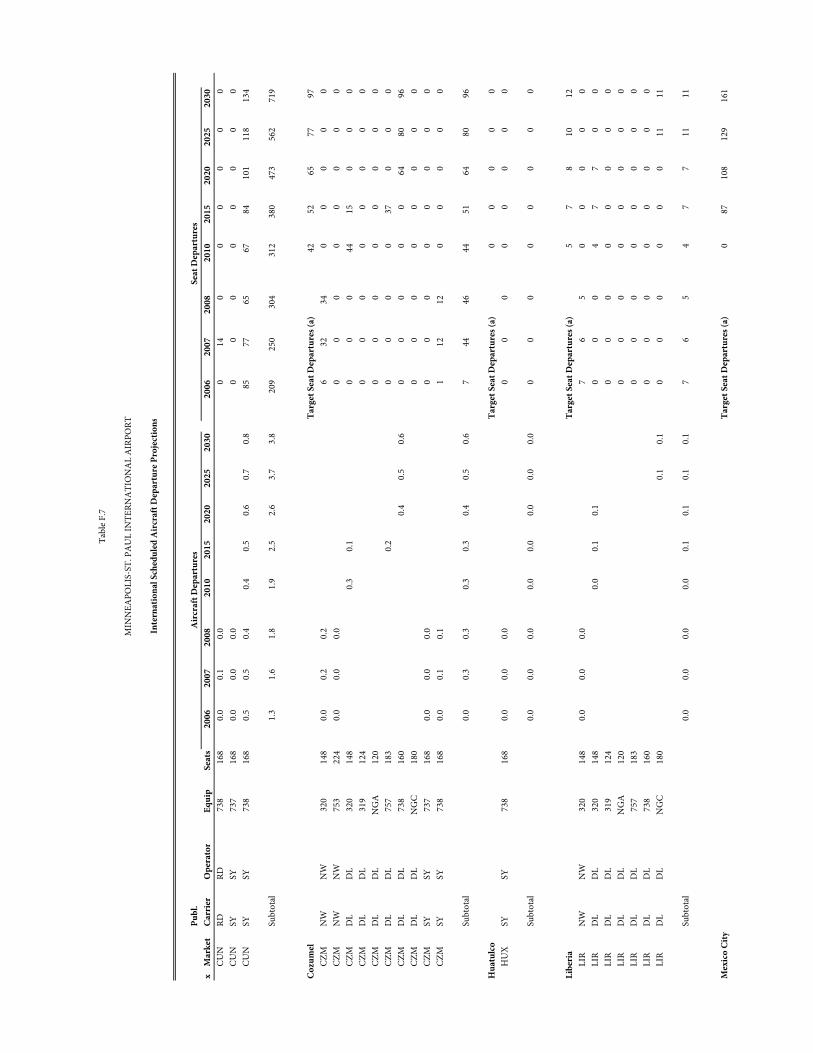
Pub
l.x
Mar
ket
Carr
ier
Ope
rato
rEq
uip
Seat
s20
0620
0720
08x
2010
2015
2020
2025
2030
x20
0620
0720
08x
2010
2015
2020
2025
2030
Tabl
e F.7
MIN
NEA
POLI
S-ST
. PA
UL
INTE
RNA
TIO
NA
L A
IRPO
RT
Inte
rnat
iona
l Sch
edul
ed A
ircr
aft D
epar
ture
Pro
ject
ion s
Air
craf
t Dep
artu
res
Seat
Dep
artu
res
CUN
RDRD
738
168
0.0
0.1
0.0
014
00
00
00
CUN
SYSY
737
168
0.0
0.0
0.0
00
00
00
00
CUN
SYSY
738
168
0.5
0.5
0.4
0.4
0.5
0.6
0.7
0.8
8577
6567
8410
111
813
4
Subt
otal
1.3
1.6
1.8
1.9
2.5
2.6
3.7
3.8
209
250
304
312
380
473
562
719
Cozu
mel
Targ
et S
eat D
epar
ture
s (a)
4252
6577
97CZ
MN
WN
W32
014
80.
00.
20.
26
3234
00
00
0CZ
MN
WN
W75
322
40.
00.
00.
00
00
00
00
0CZ
MD
LD
L32
014
80.
30.
10
00
4415
00
0CZ
MD
LD
L31
912
40
00
00
00
0CZ
MD
LD
LN
GA
120
00
00
00
00
CZM
DL
DL
757
183
0.2
00
00
370
00
CZM
DL
DL
738
160
0.4
0.5
0.6
00
00
064
8096
CZM
DL
DL
NG
C18
00
00
00
00
0CZ
MSY
SY73
716
80.
00.
00.
00
00
00
00
0CZ
MSY
SY73
816
80.
00.
10.
11
1212
00
00
0
Subt
otal
0.0
0.3
0.3
0.3
0.3
0.4
0.5
0.6
744
4644
5164
8096
Hua
tulc
oTa
rget
Sea
t Dep
artu
res (
a)0
00
00
HU
XSY
SY73
816
80.
00.
00.
00
00
00
00
0
Subt
otal
0.0
0.0
0.0
0.0
0.0
0.0
0.0
0.0
00
00
00
00
Libe
ria
Targ
et S
eat D
epar
ture
s (a)
57
810
12LI
RN
WN
W32
014
80.
00.
00.
07
65
00
00
0LI
RD
LD
L32
014
80.
00.
10.
10
00
47
70
0LI
RD
LD
L31
912
40
00
00
00
0LI
RD
LD
LN
GA
120
00
00
00
00
LIR
DL
DL
757
183
00
00
00
00
LIR
DL
DL
738
160
00
00
00
00
LIR
DL
DL
NG
C18
00.
10.
10
00
00
011
11
Subt
otal
0.0
0.0
0.0
0.0
0.1
0.1
0.1
0.1
76
54
77
1111
Mex
ico
City
Targ
et S
eat D
epar
ture
s (a)
087
108
129
161
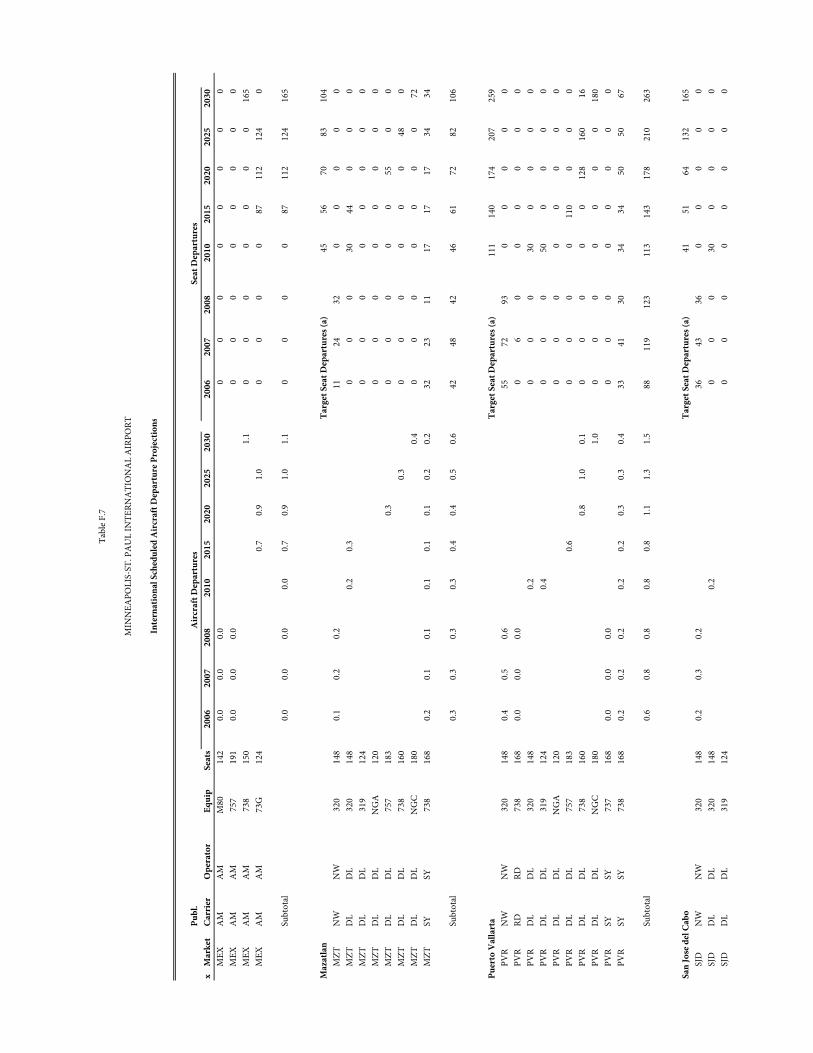
Pub
l.x
Mar
ket
Carr
ier
Ope
rato
rEq
uip
Seat
s20
0620
0720
08x
2010
2015
2020
2025
2030
x20
0620
0720
08x
2010
2015
2020
2025
2030
Tabl
e F.7
MIN
NEA
POLI
S-ST
. PA
UL
INTE
RNA
TIO
NA
L A
IRPO
RT
Inte
rnat
iona
l Sch
edul
ed A
ircr
aft D
epar
ture
Pro
ject
ion s
Air
craf
t Dep
artu
res
Seat
Dep
artu
res
MEX
AM
A
M
M80
142
0.0
0.0
0.0
00
00
00
00
MEX
AM
A
M
757
191
0.0
0.0
0.0
00
00
00
00
MEX
AM
A
M
738
150
1.1
00
00
00
016
5M
EXA
M
AM
73
G12
40.
70.
91.
00
00
087
112
124
0
Subt
otal
0.0
0.0
0.0
0.0
0.7
0.9
1.0
1.1
00
00
8711
212
416
5
Maz
atla
nTa
rget
Sea
t Dep
artu
res (
a)45
5670
8310
4M
ZTN
WN
W32
014
80.
10.
20.
211
2432
00
00
0M
ZTD
LD
L32
014
80.
20.
30
00
3044
00
0M
ZTD
LD
L31
912
40
00
00
00
0M
ZTD
LD
LN
GA
120
00
00
00
00
MZT
DL
DL
757
183
0.3
00
00
055
00
MZT
DL
DL
738
160
0.3
00
00
00
480
MZT
DL
DL
NG
C18
00.
40
00
00
00
72M
ZTSY
SY73
816
80.
20.
10.
10.
10.
10.
10.
20.
232
2311
1717
1734
34
Subt
otal
0.3
0.3
0.3
0.3
0.4
0.4
0.5
0.6
4248
4246
6172
8210
6
Puer
to V
alla
rta
Targ
et S
eat D
epar
ture
s (a)
111
140
174
207
259
PVR
NW
NW
320
148
0.4
0.5
0.6
5572
930
00
00
PVR
RDRD
738
168
0.0
0.0
0.0
06
00
00
00
PVR
DL
DL
320
148
0.2
00
030
00
00
PVR
DL
DL
319
124
0.4
00
050
00
00
PVR
DL
DL
NG
A12
00
00
00
00
0PV
RD
LD
L75
718
30.
60
00
011
00
00
PVR
DL
DL
738
160
0.8
1.0
0.1
00
00
012
816
016
PVR
DL
DL
NG
C18
01.
00
00
00
00
180
PVR
SYSY
737
168
0.0
0.0
0.0
00
00
00
00
PVR
SYSY
738
168
0.2
0.2
0.2
0.2
0.2
0.3
0.3
0.4
3341
3034
3450
5067
Subt
otal
0.6
0.8
0.8
0.8
0.8
1.1
1.3
1.5
8811
912
311
314
317
821
026
3
San
Jose
del
Cab
oTa
rget
Sea
t Dep
artu
res (
a)41
5164
132
165
SJD
NW
NW
320
148
0.2
0.3
0.2
3643
360
00
00
SJD
DL
DL
320
148
0.2
00
030
00
00
SJD
DL
DL
319
124
00
00
00
00
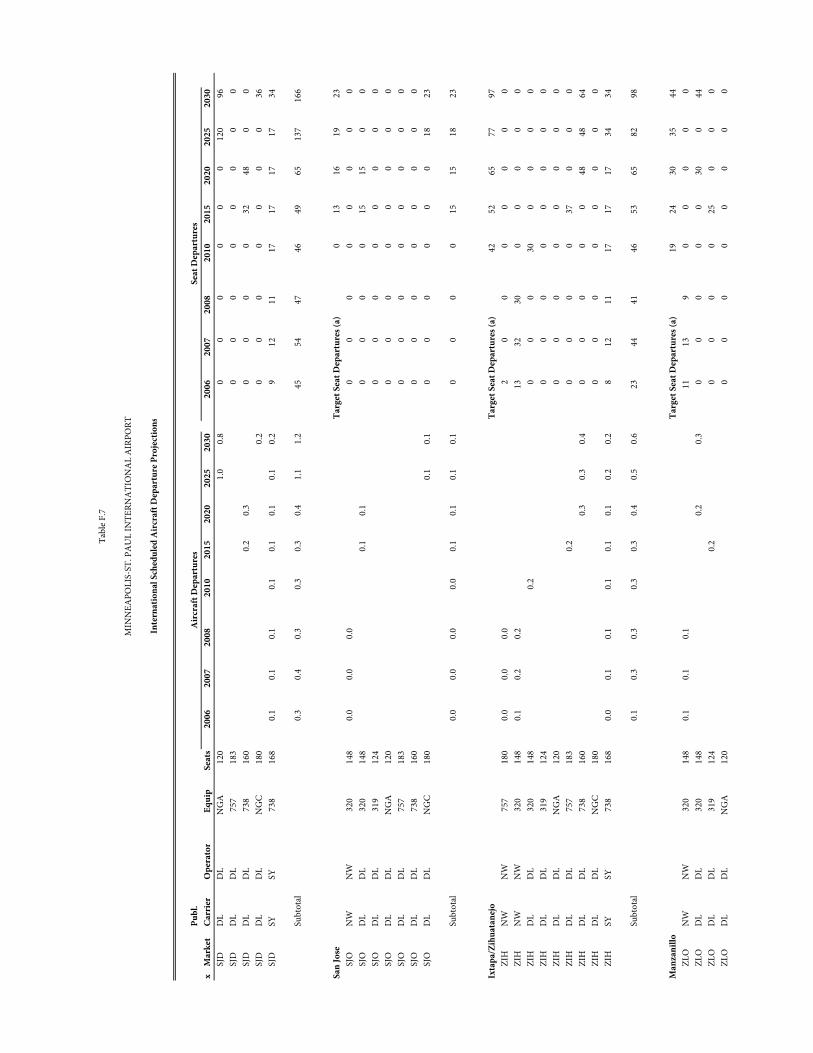
Pub
l.x
Mar
ket
Carr
ier
Ope
rato
rEq
uip
Seat
s20
0620
0720
08x
2010
2015
2020
2025
2030
x20
0620
0720
08x
2010
2015
2020
2025
2030
Tabl
e F.7
MIN
NEA
POLI
S-ST
. PA
UL
INTE
RNA
TIO
NA
L A
IRPO
RT
Inte
rnat
iona
l Sch
edul
ed A
ircr
aft D
epar
ture
Pro
ject
ion s
Air
craf
t Dep
artu
res
Seat
Dep
artu
res
SJD
DL
DL
NG
A12
01.
00.
80
00
00
012
096
SJD
DL
DL
757
183
00
00
00
00
SJD
DL
DL
738
160
0.2
0.3
00
00
3248
00
SJD
DL
DL
NG
C18
00.
20
00
00
00
36SJ
DSY
SY73
816
80.
10.
10.
10.
10.
10.
10.
10.
29
1211
1717
1717
34
Subt
otal
0.3
0.4
0.3
0.3
0.3
0.4
1.1
1.2
4554
4746
4965
137
166
San
Jose
Targ
et S
eat D
epar
ture
s (a)
013
1619
23SJ
ON
WN
W32
014
80.
00.
00.
00
00
00
00
0SJ
OD
LD
L32
014
80.
10.
10
00
015
150
0SJ
OD
LD
L31
912
40
00
00
00
0SJ
OD
LD
LN
GA
120
00
00
00
00
SJO
DL
DL
757
183
00
00
00
00
SJO
DL
DL
738
160
00
00
00
00
SJO
DL
DL
NG
C18
00.
10.
10
00
00
018
23
Subt
otal
0.0
0.0
0.0
0.0
0.1
0.1
0.1
0.1
00
00
1515
1823
Ixta
pa/Z
ihua
tane
joTa
rget
Sea
t Dep
artu
res (
a)42
5265
7797
ZIH
NW
NW
757
180
0.0
0.0
0.0
20
00
00
00
ZIH
NW
NW
320
148
0.1
0.2
0.2
1332
300
00
00
ZIH
DL
DL
320
148
0.2
00
030
00
00
ZIH
DL
DL
319
124
00
00
00
00
ZIH
DL
DL
NG
A12
00
00
00
00
0ZI
HD
LD
L75
718
30.
20
00
037
00
0ZI
HD
LD
L73
816
00.
30.
30.
40
00
00
4848
64ZI
HD
LD
LN
GC
180
00
00
00
00
ZIH
SYSY
738
168
0.0
0.1
0.1
0.1
0.1
0.1
0.2
0.2
812
1117
1717
3434
Subt
otal
0.1
0.3
0.3
0.3
0.3
0.4
0.5
0.6
2344
4146
5365
8298
Man
zani
lloTa
rget
Sea
t Dep
artu
res (
a)19
2430
3544
ZLO
NW
NW
320
148
0.1
0.1
0.1
1113
90
00
00
ZLO
DL
DL
320
148
0.2
0.3
00
00
030
044
ZLO
DL
DL
319
124
0.2
00
00
250
00
ZLO
DL
DL
NG
A12
00
00
00
00
0
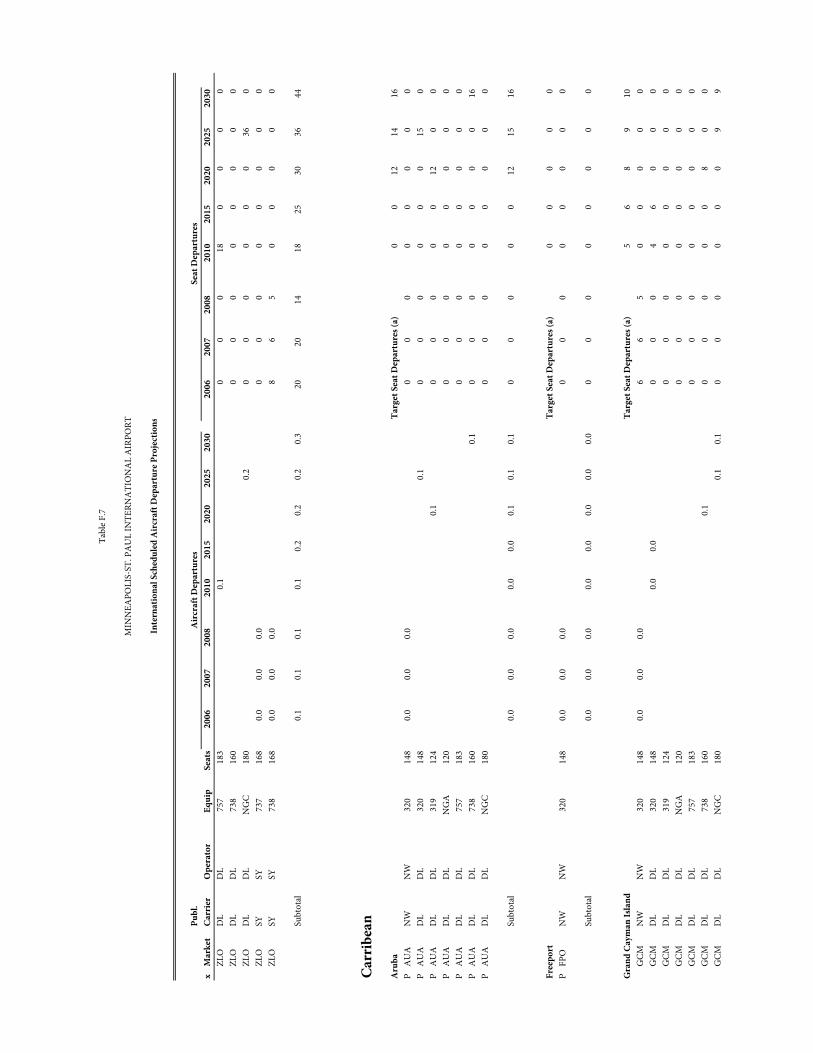
Pub
l.x
Mar
ket
Carr
ier
Ope
rato
rEq
uip
Seat
s20
0620
0720
08x
2010
2015
2020
2025
2030
x20
0620
0720
08x
2010
2015
2020
2025
2030
Tabl
e F.7
MIN
NEA
POLI
S-ST
. PA
UL
INTE
RNA
TIO
NA
L A
IRPO
RT
Inte
rnat
iona
l Sch
edul
ed A
ircr
aft D
epar
ture
Pro
ject
ion s
Air
craf
t Dep
artu
res
Seat
Dep
artu
res
ZLO
DL
DL
757
183
0.1
00
018
00
00
ZLO
DL
DL
738
160
00
00
00
00
ZLO
DL
DL
NG
C18
00.
20
00
00
036
0ZL
OSY
SY73
716
80.
00.
00.
00
00
00
00
0ZL
OSY
SY73
816
80.
00.
00.
08
65
00
00
0
Subt
otal
0.1
0.1
0.1
0.1
0.2
0.2
0.2
0.3
2020
1418
2530
3644
Carr
ibea
n
Aru
baTa
rget
Sea
t Dep
artu
res (
a)0
012
1416
PA
UA
NW
NW
320
148
0.0
0.0
0.0
00
00
00
00
PA
UA
DL
DL
320
148
0.1
00
00
00
150
PA
UA
DL
DL
319
124
0.1
00
00
012
00
PA
UA
DL
DL
NG
A12
00
00
00
00
0P
AU
AD
LD
L75
718
30
00
00
00
0P
AU
AD
LD
L73
816
00.
10
00
00
00
16P
AU
AD
LD
LN
GC
180
00
00
00
00
Subt
otal
0.0
0.0
0.0
0.0
0.0
0.1
0.1
0.1
00
00
012
1516
Free
port
Targ
et S
eat D
epar
ture
s (a)
00
00
0P
FPO
NW
NW
320
148
0.0
0.0
0.0
00
00
00
00
Subt
otal
0.0
0.0
0.0
0.0
0.0
0.0
0.0
0.0
00
00
00
00
Gra
nd C
aym
an Is
land
Targ
et S
eat D
epar
ture
s (a)
56
89
10G
CMN
WN
W32
014
80.
00.
00.
06
65
00
00
0G
CMD
LD
L32
014
80.
00.
00
00
46
00
0G
CMD
LD
L31
912
40
00
00
00
0G
CMD
LD
LN
GA
120
00
00
00
00
GCM
DL
DL
757
183
00
00
00
00
GCM
DL
DL
738
160
0.1
00
00
08
00
GCM
DL
DL
NG
C18
00.
10.
10
00
00
09
9
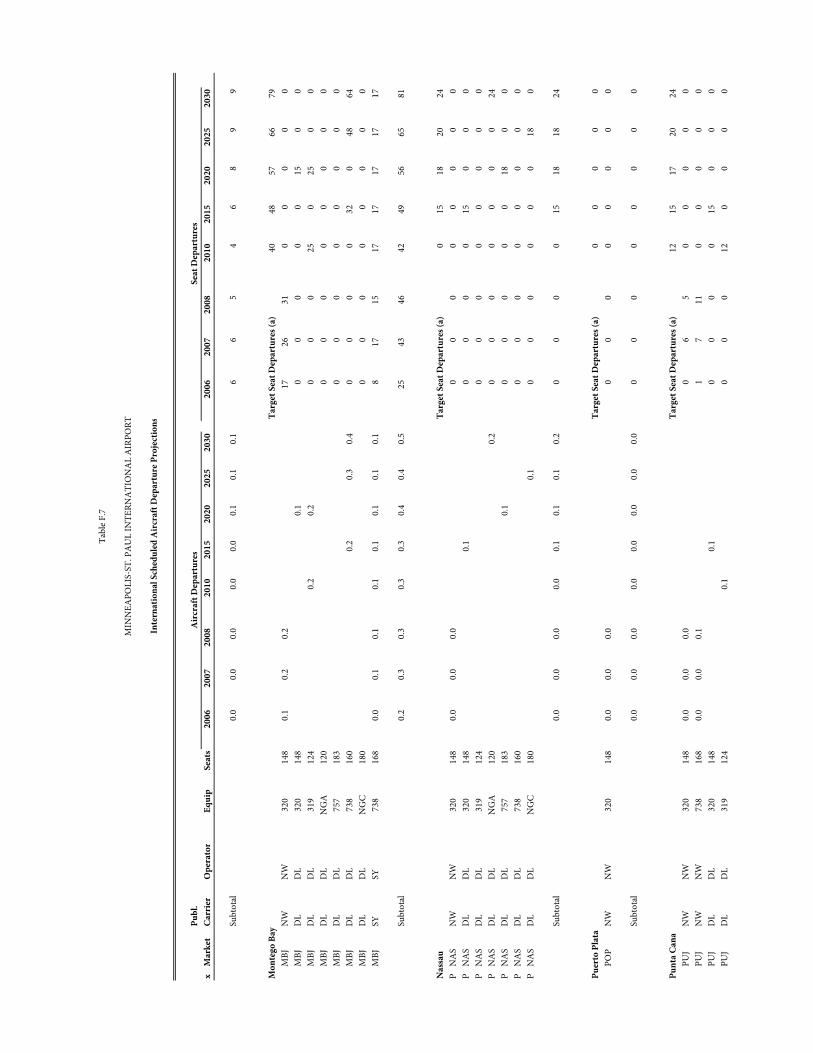
Pub
l.x
Mar
ket
Carr
ier
Ope
rato
rEq
uip
Seat
s20
0620
0720
08x
2010
2015
2020
2025
2030
x20
0620
0720
08x
2010
2015
2020
2025
2030
Tabl
e F.7
MIN
NEA
POLI
S-ST
. PA
UL
INTE
RNA
TIO
NA
L A
IRPO
RT
Inte
rnat
iona
l Sch
edul
ed A
ircr
aft D
epar
ture
Pro
ject
ion s
Air
craf
t Dep
artu
res
Seat
Dep
artu
res
Subt
otal
0.0
0.0
0.0
0.0
0.0
0.1
0.1
0.1
66
54
68
99
Mon
tego
Bay
Targ
et S
eat D
epar
ture
s (a)
4048
5766
79M
BJN
WN
W32
014
80.
10.
20.
217
2631
00
00
0M
BJD
LD
L32
014
80.
10
00
00
150
0M
BJD
LD
L31
912
40.
20.
20
00
250
250
0M
BJD
LD
LN
GA
120
00
00
00
00
MBJ
DL
DL
757
183
00
00
00
00
MBJ
DL
DL
738
160
0.2
0.3
0.4
00
00
320
4864
MBJ
DL
DL
NG
C18
00
00
00
00
0M
BJSY
SY73
816
80.
00.
10.
10.
10.
10.
10.
10.
18
1715
1717
1717
17
Subt
otal
0.2
0.3
0.3
0.3
0.3
0.4
0.4
0.5
2543
4642
4956
6581
Nas
sau
Targ
et S
eat D
epar
ture
s (a)
015
1820
24P
NA
SN
WN
W32
014
80.
00.
00.
00
00
00
00
0P
NA
SD
LD
L32
014
80.
10
00
015
00
0P
NA
SD
LD
L31
912
40
00
00
00
0P
NA
SD
LD
LN
GA
120
0.2
00
00
00
024
PN
AS
DL
DL
757
183
0.1
00
00
018
00
PN
AS
DL
DL
738
160
00
00
00
00
PN
AS
DL
DL
NG
C18
00.
10
00
00
018
0
Subt
otal
0.0
0.0
0.0
0.0
0.1
0.1
0.1
0.2
00
00
1518
1824
Puer
to P
lata
Targ
et S
eat D
epar
ture
s (a)
00
00
0PO
PN
WN
W32
014
80.
00.
00.
00
00
00
00
0
Subt
otal
0.0
0.0
0.0
0.0
0.0
0.0
0.0
0.0
00
00
00
00
Punt
a Ca
naTa
rget
Sea
t Dep
artu
res (
a)12
1517
2024
PUJ
NW
NW
320
148
0.0
0.0
0.0
06
50
00
00
PUJ
NW
NW
738
168
0.0
0.0
0.1
17
110
00
00
PUJ
DL
DL
320
148
0.1
00
00
150
00
PUJ
DL
DL
319
124
0.1
00
012
00
00
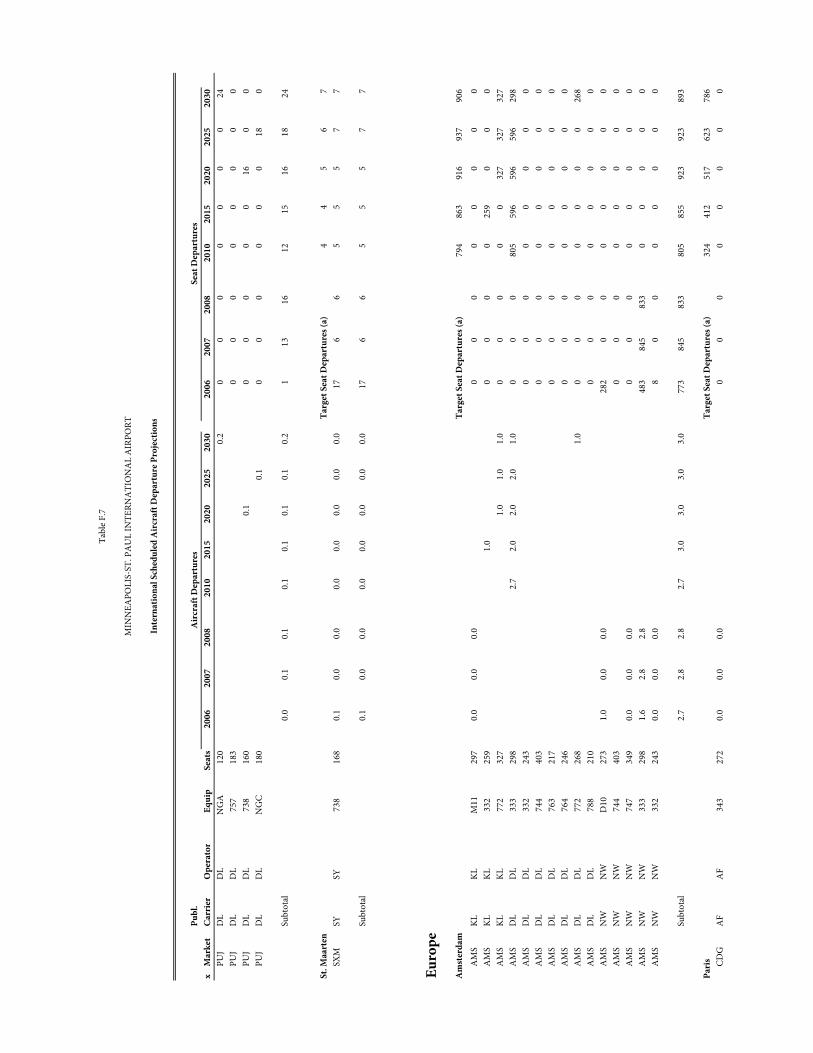
Pub
l.x
Mar
ket
Carr
ier
Ope
rato
rEq
uip
Seat
s20
0620
0720
08x
2010
2015
2020
2025
2030
x20
0620
0720
08x
2010
2015
2020
2025
2030
Tabl
e F.7
MIN
NEA
POLI
S-ST
. PA
UL
INTE
RNA
TIO
NA
L A
IRPO
RT
Inte
rnat
iona
l Sch
edul
ed A
ircr
aft D
epar
ture
Pro
ject
ion s
Air
craf
t Dep
artu
res
Seat
Dep
artu
res
PUJ
DL
DL
NG
A12
00.
20
00
00
00
24PU
JD
LD
L75
718
30
00
00
00
0PU
JD
LD
L73
816
00.
10
00
00
160
0PU
JD
LD
LN
GC
180
0.1
00
00
00
180
Subt
otal
0.0
0.1
0.1
0.1
0.1
0.1
0.1
0.2
113
1612
1516
1824
St. M
aart
enTa
rget
Sea
t Dep
artu
res (
a)4
45
67
SXM
SYSY
738
168
0.1
0.0
0.0
0.0
0.0
0.0
0.0
0.0
176
65
55
77
Subt
otal
0.1
0.0
0.0
0.0
0.0
0.0
0.0
0.0
176
65
55
77
Euro
pe
Am
ster
dam
Targ
et S
eat D
epar
ture
s (a)
794
863
916
937
906
AM
SKL
KLM
1129
70.
00.
00.
00
00
00
00
0A
MS
KLKL
332
259
1.0
00
00
259
00
0A
MS
KLKL
772
327
1.0
1.0
1.0
00
00
032
732
732
7A
MS
DL
DL
333
298
2.7
2.0
2.0
2.0
1.0
00
080
559
659
659
629
8A
MS
DL
DL
332
243
00
00
00
00
AM
SD
LD
L74
440
30
00
00
00
0A
MS
DL
DL
763
217
00
00
00
00
AM
SD
LD
L76
424
60
00
00
00
0A
MS
DL
DL
772
268
1.0
00
00
00
026
8A
MS
DL
DL
788
210
00
00
00
00
AM
SN
WN
WD
1027
31.
00.
00.
028
20
00
00
00
AM
SN
WN
W74
440
30
00
00
00
0A
MS
NW
NW
747
349
0.0
0.0
0.0
00
00
00
00
AM
SN
WN
W33
329
81.
62.
82.
848
384
583
30
00
00
AM
SN
WN
W33
224
30.
00.
00.
08
00
00
00
0
Subt
otal
2.7
2.8
2.8
2.7
3.0
3.0
3.0
3.0
773
845
833
805
855
923
923
893
Pari
sTa
rget
Sea
t Dep
artu
res (
a)32
441
251
762
378
6CD
GA
F A
F34
327
20.
00.
00.
00
00
00
00
0
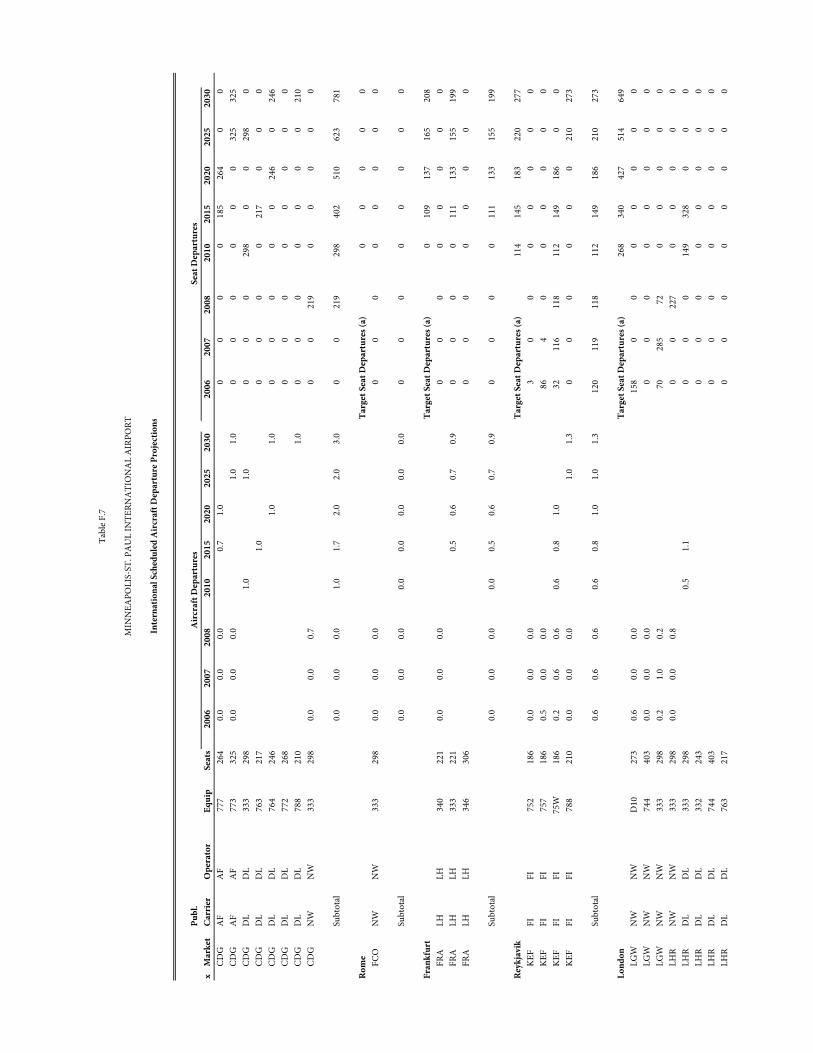
Pub
l.x
Mar
ket
Carr
ier
Ope
rato
rEq
uip
Seat
s20
0620
0720
08x
2010
2015
2020
2025
2030
x20
0620
0720
08x
2010
2015
2020
2025
2030
Tabl
e F.7
MIN
NEA
POLI
S-ST
. PA
UL
INTE
RNA
TIO
NA
L A
IRPO
RT
Inte
rnat
iona
l Sch
edul
ed A
ircr
aft D
epar
ture
Pro
ject
ion s
Air
craf
t Dep
artu
res
Seat
Dep
artu
res
CDG
AF
AF
777
264
0.0
0.0
0.0
0.7
1.0
00
00
185
264
00
CDG
AF
AF
773
325
0.0
0.0
0.0
1.0
1.0
00
00
00
325
325
CDG
DL
DL
333
298
1.0
1.0
00
029
80
029
80
CDG
DL
DL
763
217
1.0
00
00
217
00
0CD
GD
LD
L76
424
61.
01.
00
00
00
246
024
6CD
GD
LD
L77
226
80
00
00
00
0CD
GD
LD
L78
821
01.
00
00
00
00
210
CDG
NW
NW
333
298
0.0
0.0
0.7
00
219
00
00
0
Subt
otal
0.0
0.0
0.0
1.0
1.7
2.0
2.0
3.0
00
219
298
402
510
623
781
Rom
eTa
rget
Sea
t Dep
artu
res (
a)0
00
00
FCO
NW
NW
333
298
0.0
0.0
0.0
00
00
00
00
Subt
otal
0.0
0.0
0.0
0.0
0.0
0.0
0.0
0.0
00
00
00
00
Fran
kfur
tTa
rget
Sea
t Dep
artu
res (
a)0
109
137
165
208
FRA
LH
LH34
022
10.
00.
00.
00
00
00
00
0FR
ALH
LH
333
221
0.5
0.6
0.7
0.9
00
00
111
133
155
199
FRA
LH
LH34
630
60
00
00
00
0
Subt
otal
0.0
0.0
0.0
0.0
0.5
0.6
0.7
0.9
00
00
111
133
155
199
Reyk
javi
kTa
rget
Sea
t Dep
artu
res (
a)11
414
518
322
027
7KE
FFI
FI75
218
60.
00.
00.
03
00
00
00
0KE
FFI
FI75
718
60.
50.
00.
086
40
00
00
0KE
FFI
FI75
W18
60.
20.
60.
60.
60.
81.
032
116
118
112
149
186
00
KEF
FIFI
788
210
0.0
0.0
0.0
1.0
1.3
00
00
00
210
273
Subt
otal
0.6
0.6
0.6
0.6
0.8
1.0
1.0
1.3
120
119
118
112
149
186
210
273
Lond
onTa
rget
Sea
t Dep
artu
res (
a)26
834
042
751
464
9LG
WN
WN
WD
1027
30.
60.
00.
015
80
00
00
00
LGW
NW
NW
744
403
0.0
0.0
0.0
00
00
00
00
LGW
NW
NW
333
298
0.2
1.0
0.2
7028
572
00
00
0LH
RN
WN
W33
329
80.
00.
00.
80
022
70
00
00
LHR
DL
DL
333
298
0.5
1.1
00
014
932
80
00
LHR
DL
DL
332
243
00
00
00
00
LHR
DL
DL
744
403
00
00
00
00
LHR
DL
DL
763
217
00
00
00
00
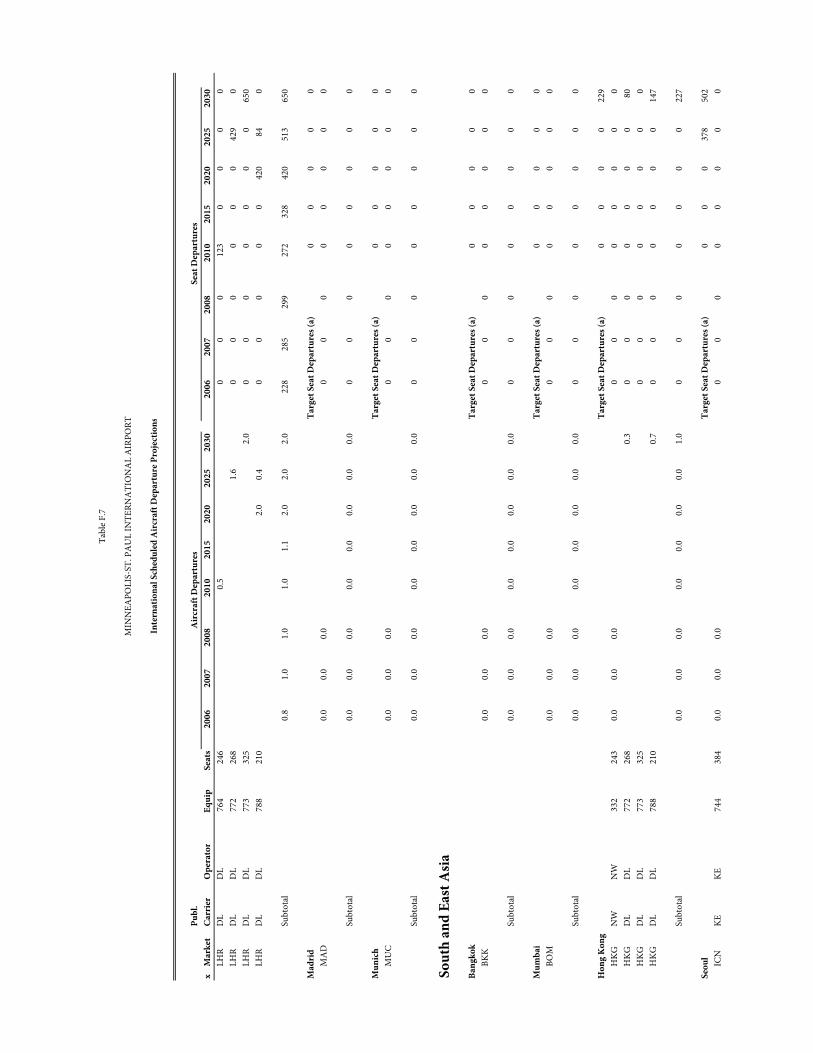
Pub
l.x
Mar
ket
Carr
ier
Ope
rato
rEq
uip
Seat
s20
0620
0720
08x
2010
2015
2020
2025
2030
x20
0620
0720
08x
2010
2015
2020
2025
2030
Tabl
e F.7
MIN
NEA
POLI
S-ST
. PA
UL
INTE
RNA
TIO
NA
L A
IRPO
RT
Inte
rnat
iona
l Sch
edul
ed A
ircr
aft D
epar
ture
Pro
ject
ion s
Air
craf
t Dep
artu
res
Seat
Dep
artu
res
LHR
DL
DL
764
246
0.5
00
012
30
00
0LH
RD
LD
L77
226
81.
60
00
00
042
90
LHR
DL
DL
773
325
2.0
00
00
00
065
0LH
RD
LD
L78
821
02.
00.
40
00
00
420
840
Subt
otal
0.8
1.0
1.0
1.0
1.1
2.0
2.0
2.0
228
285
299
272
328
420
513
650
Mad
rid
Targ
et S
eat D
epar
ture
s (a)
00
00
0M
AD
0.0
0.0
0.0
00
00
00
00
Subt
otal
0.0
0.0
0.0
0.0
0.0
0.0
0.0
0.0
00
00
00
00
Mun
ich
Targ
et S
eat D
epar
ture
s (a)
00
00
0M
UC
0.0
0.0
0.0
00
00
00
00
Subt
otal
0.0
0.0
0.0
0.0
0.0
0.0
0.0
0.0
00
00
00
00
Sout
h an
d Ea
st A
sia
Bang
kok
Targ
et S
eat D
epar
ture
s (a)
00
00
0BK
K0.
00.
00.
00
00
00
00
0
Subt
otal
0.0
0.0
0.0
0.0
0.0
0.0
0.0
0.0
00
00
00
00
Mum
bai
Targ
et S
eat D
epar
ture
s (a)
00
00
0BO
M0.
00.
00.
00
00
00
00
0
Subt
otal
0.0
0.0
0.0
0.0
0.0
0.0
0.0
0.0
00
00
00
00
Hon
g K
ong
Targ
et S
eat D
epar
ture
s (a)
00
00
229
HKG
NW
NW
332
243
0.0
0.0
0.0
00
00
00
00
HKG
DL
DL
772
268
0.3
00
00
00
080
HKG
DL
DL
773
325
00
00
00
00
HKG
DL
DL
788
210
0.7
00
00
00
014
7
Subt
otal
0.0
0.0
0.0
0.0
0.0
0.0
0.0
1.0
00
00
00
022
7
Seou
lTa
rget
Sea
t Dep
artu
res (
a)0
00
378
502
ICN
KE
KE74
438
40.
00.
00.
00
00
00
00
0
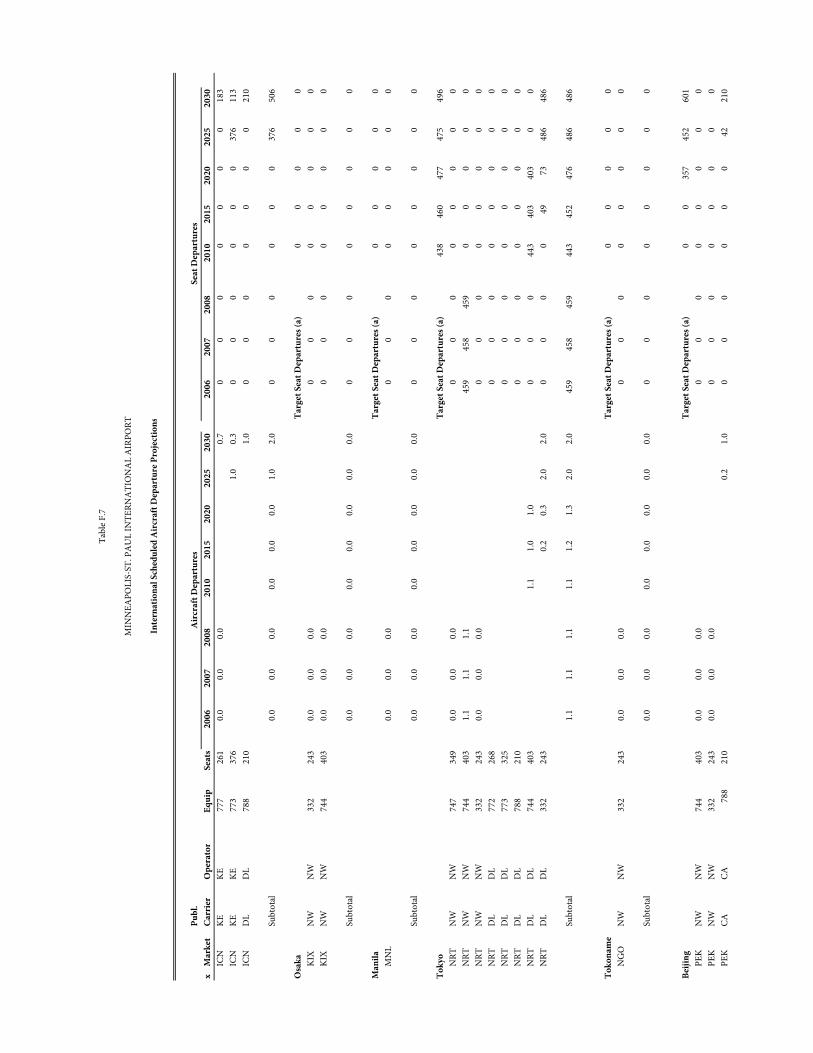
Pub
l.x
Mar
ket
Carr
ier
Ope
rato
rEq
uip
Seat
s20
0620
0720
08x
2010
2015
2020
2025
2030
x20
0620
0720
08x
2010
2015
2020
2025
2030
Tabl
e F.7
MIN
NEA
POLI
S-ST
. PA
UL
INTE
RNA
TIO
NA
L A
IRPO
RT
Inte
rnat
iona
l Sch
edul
ed A
ircr
aft D
epar
ture
Pro
ject
ion s
Air
craf
t Dep
artu
res
Seat
Dep
artu
res
ICN
KE
KE77
726
10.
00.
00.
00.
70
00
00
00
183
ICN
KE
KE77
337
61.
00.
30
00
00
037
611
3IC
ND
LD
L78
821
01.
00
00
00
00
210
Subt
otal
0.0
0.0
0.0
0.0
0.0
0.0
1.0
2.0
00
00
00
376
506
Osa
kaTa
rget
Sea
t Dep
artu
res (
a)0
00
00
KIX
NW
NW
332
243
0.0
0.0
0.0
00
00
00
00
KIX
NW
NW
744
403
0.0
0.0
0.0
00
00
00
00
Subt
otal
0.0
0.0
0.0
0.0
0.0
0.0
0.0
0.0
00
00
00
00
Man
ilaTa
rget
Sea
t Dep
artu
res (
a)0
00
00
MN
L0.
00.
00.
00
00
00
00
0
Subt
otal
0.0
0.0
0.0
0.0
0.0
0.0
0.0
0.0
00
00
00
00
Toky
oTa
rget
Sea
t Dep
artu
res (
a)43
846
047
747
549
6N
RTN
WN
W74
734
90.
00.
00.
00
00
00
00
0N
RTN
WN
W74
440
31.
11.
11.
145
945
845
90
00
00
NRT
NW
NW
332
243
0.0
0.0
0.0
00
00
00
00
NRT
DL
DL
772
268
00
00
00
00
NRT
DL
DL
773
325
00
00
00
00
NRT
DL
DL
788
210
00
00
00
00
NRT
DL
DL
744
403
1.1
1.0
1.0
00
044
340
340
30
0N
RTD
LD
L33
224
30.
20.
32.
02.
00
00
049
7348
648
6
Subt
otal
1.1
1.1
1.1
1.1
1.2
1.3
2.0
2.0
459
458
459
443
452
476
486
486
Toko
nam
eTa
rget
Sea
t Dep
artu
res (
a)0
00
00
NG
ON
WN
W33
224
30.
00.
00.
00
00
00
00
0
Subt
otal
0.0
0.0
0.0
0.0
0.0
0.0
0.0
0.0
00
00
00
00
Beiji
ngTa
rget
Sea
t Dep
artu
res (
a)0
035
745
260
1PE
KN
WN
W74
440
30.
00.
00.
00
00
00
00
0PE
KN
WN
W33
224
30.
00.
00.
00
00
00
00
0PE
KCA
CA78
821
00.
21.
00
00
00
042
210
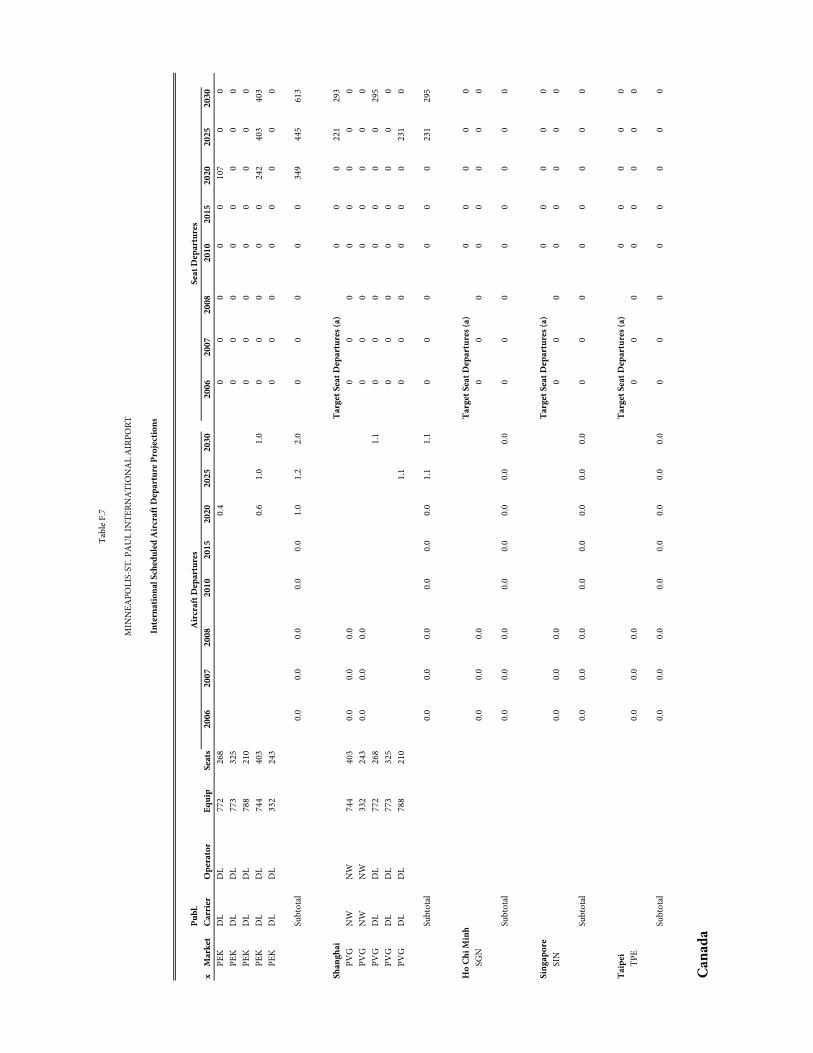
Pub
l.x
Mar
ket
Carr
ier
Ope
rato
rEq
uip
Seat
s20
0620
0720
08x
2010
2015
2020
2025
2030
x20
0620
0720
08x
2010
2015
2020
2025
2030
Tabl
e F.7
MIN
NEA
POLI
S-ST
. PA
UL
INTE
RNA
TIO
NA
L A
IRPO
RT
Inte
rnat
iona
l Sch
edul
ed A
ircr
aft D
epar
ture
Pro
ject
ion s
Air
craf
t Dep
artu
res
Seat
Dep
artu
res
PEK
DL
DL
772
268
0.4
00
00
010
70
0PE
KD
LD
L77
332
50
00
00
00
0PE
KD
LD
L78
821
00
00
00
00
0PE
KD
LD
L74
440
30.
61.
01.
00
00
00
242
403
403
PEK
DL
DL
332
243
00
00
00
00
Subt
otal
0.0
0.0
0.0
0.0
0.0
1.0
1.2
2.0
00
00
034
944
561
3
Shan
ghai
Targ
et S
eat D
epar
ture
s (a)
00
022
129
3PV
GN
WN
W74
440
30.
00.
00.
00
00
00
00
0PV
GN
WN
W33
224
30.
00.
00.
00
00
00
00
0PV
GD
LD
L77
226
81.
10
00
00
00
295
PVG
DL
DL
773
325
00
00
00
00
PVG
DL
DL
788
210
1.1
00
00
00
231
0
Subt
otal
0.0
0.0
0.0
0.0
0.0
0.0
1.1
1.1
00
00
00
231
295
Ho
Chi M
inh
Targ
et S
eat D
epar
ture
s (a)
00
00
0SG
N0.
00.
00.
00
00
00
00
0
Subt
otal
0.0
0.0
0.0
0.0
0.0
0.0
0.0
0.0
00
00
00
00
Sing
apor
eTa
rget
Sea
t Dep
artu
res (
a)0
00
00
SIN
0.0
0.0
0.0
00
00
00
00
Subt
otal
0.0
0.0
0.0
0.0
0.0
0.0
0.0
0.0
00
00
00
00
Taip
eiTa
rget
Sea
t Dep
artu
res (
a)0
00
00
TPE
0.0
0.0
0.0
00
00
00
00
Subt
otal
0.0
0.0
0.0
0.0
0.0
0.0
0.0
0.0
00
00
00
00
Cana
da
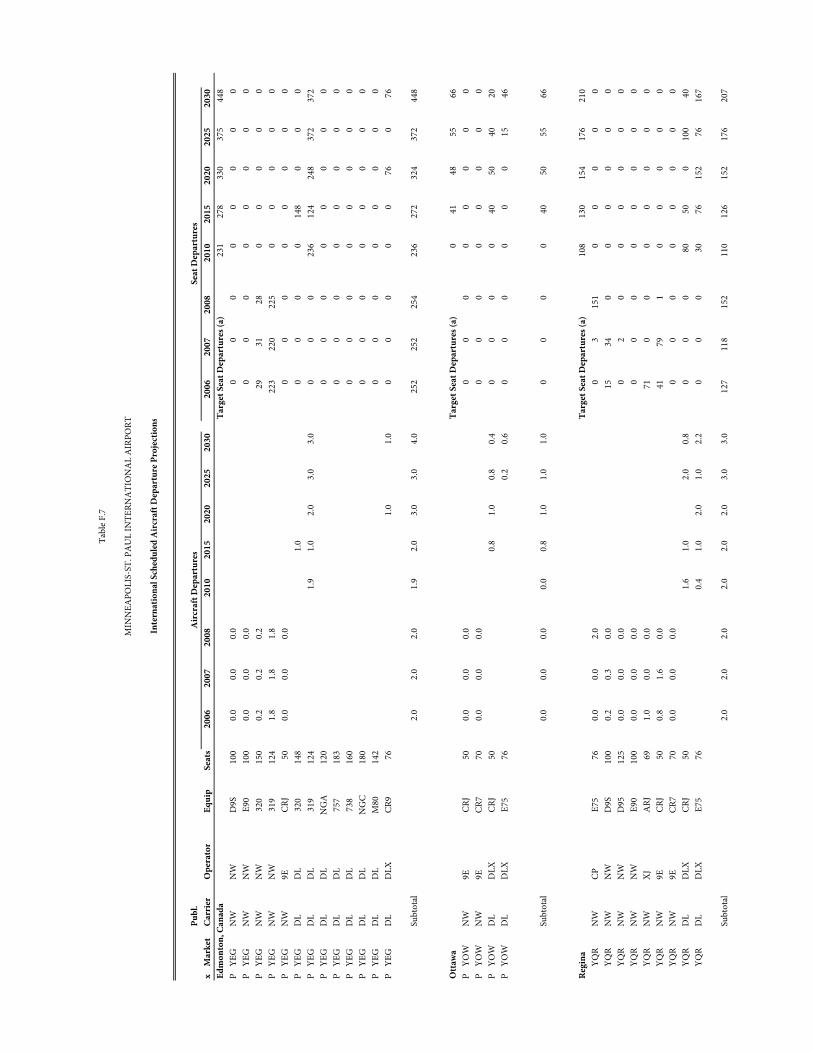
Pub
l.x
Mar
ket
Carr
ier
Ope
rato
rEq
uip
Seat
s20
0620
0720
08x
2010
2015
2020
2025
2030
x20
0620
0720
08x
2010
2015
2020
2025
2030
Tabl
e F.7
MIN
NEA
POLI
S-ST
. PA
UL
INTE
RNA
TIO
NA
L A
IRPO
RT
Inte
rnat
iona
l Sch
edul
ed A
ircr
aft D
epar
ture
Pro
ject
ion s
Air
craf
t Dep
artu
res
Seat
Dep
artu
res
Edm
onto
n, C
anad
aTa
rget
Sea
t Dep
artu
res (
a)23
127
833
037
544
8P
YEG
NW
NW
D9S
100
0.0
0.0
0.0
00
00
00
00
PYE
GN
WN
WE9
010
00.
00.
00.
00
00
00
00
0P
YEG
NW
NW
320
150
0.2
0.2
0.2
2931
280
00
00
PYE
GN
WN
W31
912
41.
81.
81.
822
322
022
50
00
00
PYE
GN
W9E
CRJ
500.
00.
00.
00
00
00
00
0P
YEG
DL
DL
320
148
1.0
00
00
148
00
0P
YEG
DL
DL
319
124
1.9
1.0
2.0
3.0
3.0
00
023
612
424
837
237
2P
YEG
DL
DL
NG
A12
00
00
00
00
0P
YEG
DL
DL
757
183
00
00
00
00
PYE
GD
LD
L73
816
00
00
00
00
0P
YEG
DL
DL
NG
C18
00
00
00
00
0P
YEG
DL
DL
M80
142
00
00
00
00
PYE
GD
LD
LXCR
976
1.0
1.0
00
00
076
076
Subt
otal
2.0
2.0
2.0
1.9
2.0
3.0
3.0
4.0
252
252
254
236
272
324
372
448
Otta
wa
Targ
et S
eat D
epar
ture
s (a)
041
4855
66P
YOW
NW
9ECR
J50
0.0
0.0
0.0
00
00
00
00
PYO
WN
W9E
CR7
700.
00.
00.
00
00
00
00
0P
YOW
DL
DLX
CRJ
500.
81.
00.
80.
40
00
040
5040
20P
YOW
DL
DLX
E75
760.
20.
60
00
00
015
46
Subt
otal
0.0
0.0
0.0
0.0
0.8
1.0
1.0
1.0
00
00
4050
5566
Regi
naTa
rget
Sea
t Dep
artu
res (
a)10
813
015
417
621
0YQ
RN
WCP
E7
576
0.0
0.0
2.0
03
151
00
00
0YQ
RN
WN
WD
9S10
00.
20.
30.
015
340
00
00
0YQ
RN
WN
WD
9512
50.
00.
00.
00
20
00
00
0YQ
RN
WN
WE9
010
00.
00.
00.
00
00
00
00
0YQ
RN
WXJ
ARJ
691.
00.
00.
071
00
00
00
0YQ
RN
W9E
CRJ
500.
81.
60.
041
791
00
00
0YQ
RN
W9E
CR7
700.
00.
00.
00
00
00
00
0YQ
RD
LD
LXCR
J50
1.6
1.0
2.0
0.8
00
080
500
100
40YQ
RD
LD
LXE7
576
0.4
1.0
2.0
1.0
2.2
00
030
7615
276
167
Subt
otal
2.0
2.0
2.0
2.0
2.0
2.0
3.0
3.0
127
118
152
110
126
152
176
207
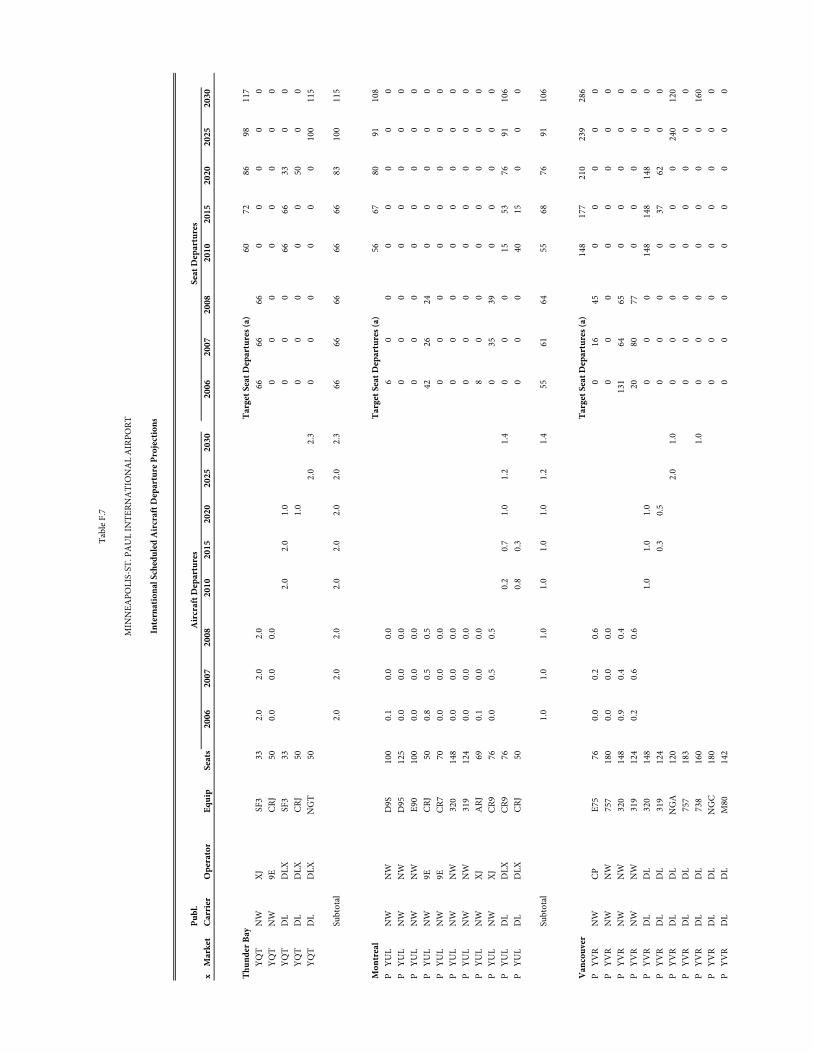
Pub
l.x
Mar
ket
Carr
ier
Ope
rato
rEq
uip
Seat
s20
0620
0720
08x
2010
2015
2020
2025
2030
x20
0620
0720
08x
2010
2015
2020
2025
2030
Tabl
e F.7
MIN
NEA
POLI
S-ST
. PA
UL
INTE
RNA
TIO
NA
L A
IRPO
RT
Inte
rnat
iona
l Sch
edul
ed A
ircr
aft D
epar
ture
Pro
ject
ion s
Air
craf
t Dep
artu
res
Seat
Dep
artu
res
Thun
der B
ayTa
rget
Sea
t Dep
artu
res (
a)60
7286
9811
7YQ
TN
WXJ
SF3
332.
02.
02.
066
6666
00
00
0YQ
TN
W9E
CRJ
500.
00.
00.
00
00
00
00
0YQ
TD
LD
LXSF
333
2.0
2.0
1.0
00
066
6633
00
YQT
DL
DLX
CRJ
501.
00
00
00
500
0YQ
TD
LD
LXN
GT
502.
02.
30
00
00
010
011
5
Subt
otal
2.0
2.0
2.0
2.0
2.0
2.0
2.0
2.3
6666
6666
6683
100
115
Mon
trea
lTa
rget
Sea
t Dep
artu
res (
a)56
6780
9110
8P
YUL
NW
NW
D9S
100
0.1
0.0
0.0
60
00
00
00
PYU
LN
WN
WD
9512
50.
00.
00.
00
00
00
00
0P
YUL
NW
NW
E90
100
0.0
0.0
0.0
00
00
00
00
PYU
LN
W9E
CRJ
500.
80.
50.
542
2624
00
00
0P
YUL
NW
9ECR
770
0.0
0.0
0.0
00
00
00
00
PYU
LN
WN
W32
014
80.
00.
00.
00
00
00
00
0P
YUL
NW
NW
319
124
0.0
0.0
0.0
00
00
00
00
PYU
LN
WXJ
ARJ
690.
10.
00.
08
00
00
00
0P
YUL
NW
XJCR
976
0.0
0.5
0.5
035
390
00
00
PYU
LD
LD
LXCR
976
0.2
0.7
1.0
1.2
1.4
00
015
5376
9110
6P
YUL
DL
DLX
CRJ
500.
80.
30
00
4015
00
0
Subt
otal
1.0
1.0
1.0
1.0
1.0
1.0
1.2
1.4
5561
6455
6876
9110
6
Van
couv
erTa
rget
Sea
t Dep
artu
res (
a)14
817
721
023
928
6P
YVR
NW
CPE7
576
0.0
0.2
0.6
016
450
00
00
PYV
RN
WN
W75
718
00.
00.
00.
00
00
00
00
0P
YVR
NW
NW
320
148
0.9
0.4
0.4
131
6465
00
00
0P
YVR
NW
NW
319
124
0.2
0.6
0.6
2080
770
00
00
PYV
RD
LD
L32
014
81.
01.
01.
00
00
148
148
148
00
PYV
RD
LD
L31
912
40.
30.
50
00
037
620
0P
YVR
DL
DL
NG
A12
02.
01.
00
00
00
024
012
0P
YVR
DL
DL
757
183
00
00
00
00
PYV
RD
LD
L73
816
01.
00
00
00
00
160
PYV
RD
LD
LN
GC
180
00
00
00
00
PYV
RD
LD
LM
8014
20
00
00
00
0
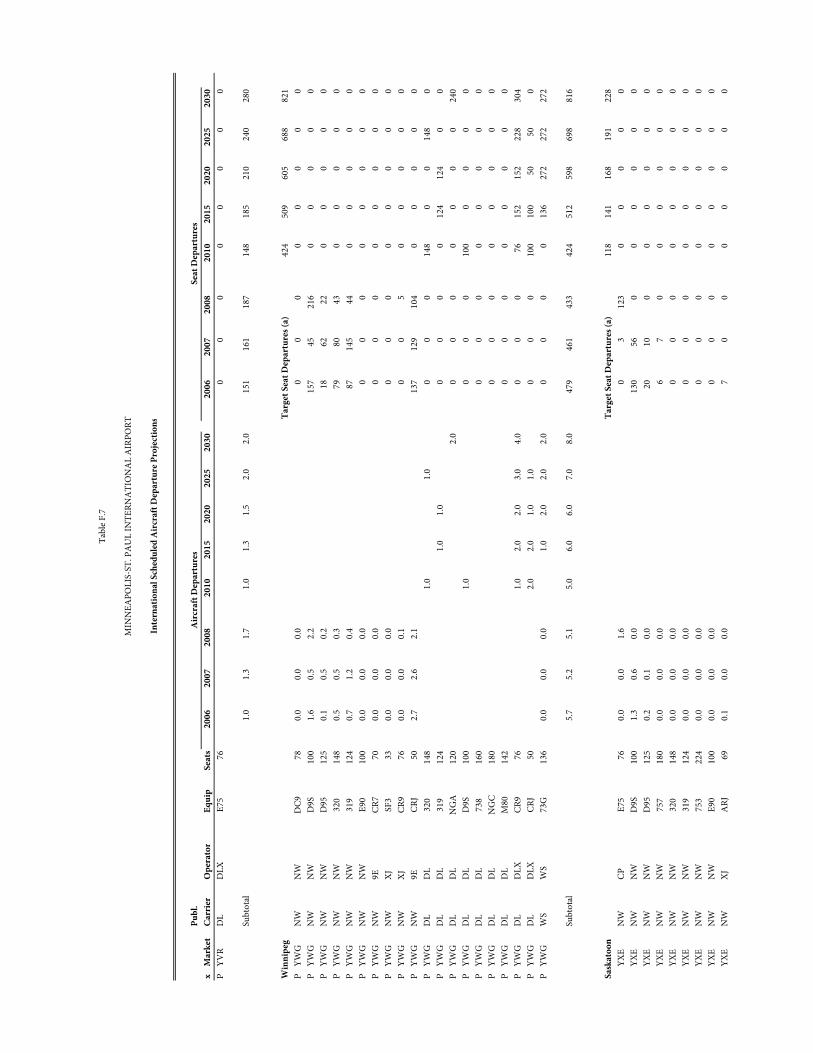
Pub
l.x
Mar
ket
Carr
ier
Ope
rato
rEq
uip
Seat
s20
0620
0720
08x
2010
2015
2020
2025
2030
x20
0620
0720
08x
2010
2015
2020
2025
2030
Tabl
e F.7
MIN
NEA
POLI
S-ST
. PA
UL
INTE
RNA
TIO
NA
L A
IRPO
RT
Inte
rnat
iona
l Sch
edul
ed A
ircr
aft D
epar
ture
Pro
ject
ion s
Air
craf
t Dep
artu
res
Seat
Dep
artu
res
PYV
RD
LD
LXE7
576
00
00
00
00
Subt
otal
1.0
1.3
1.7
1.0
1.3
1.5
2.0
2.0
151
161
187
148
185
210
240
280
Win
nipe
gTa
rget
Sea
t Dep
artu
res (
a)42
450
960
568
882
1P
YWG
NW
NW
DC9
780.
00.
00.
00
00
00
00
0P
YWG
NW
NW
D9S
100
1.6
0.5
2.2
157
4521
60
00
00
PYW
GN
WN
WD
9512
50.
10.
50.
218
6222
00
00
0P
YWG
NW
NW
320
148
0.5
0.5
0.3
7980
430
00
00
PYW
GN
WN
W31
912
40.
71.
20.
487
145
440
00
00
PYW
GN
WN
WE9
010
00.
00.
00.
00
00
00
00
0P
YWG
NW
9ECR
770
0.0
0.0
0.0
00
00
00
00
PYW
GN
WXJ
SF3
330.
00.
00.
00
00
00
00
0P
YWG
NW
XJCR
976
0.0
0.0
0.1
00
50
00
00
PYW
GN
W9E
CRJ
502.
72.
62.
113
712
910
40
00
00
PYW
GD
LD
L32
014
81.
01.
00
00
148
00
148
0P
YWG
DL
DL
319
124
1.0
1.0
00
00
124
124
00
PYW
GD
LD
LN
GA
120
2.0
00
00
00
024
0P
YWG
DL
DL
D9S
100
1.0
00
010
00
00
0P
YWG
DL
DL
738
160
00
00
00
00
PYW
GD
LD
LN
GC
180
00
00
00
00
PYW
GD
LD
LM
8014
20
00
00
00
0P
YWG
DL
DLX
CR9
761.
02.
02.
03.
04.
00
00
7615
215
222
830
4P
YWG
DL
DLX
CRJ
502.
02.
01.
01.
00
00
100
100
5050
0P
YWG
WS
WS
73G
136
0.0
0.0
0.0
1.0
2.0
2.0
2.0
00
00
136
272
272
272
Subt
otal
5.7
5.2
5.1
5.0
6.0
6.0
7.0
8.0
479
461
433
424
512
598
698
816
Sask
atoo
nTa
rget
Sea
t Dep
artu
res (
a)11
814
116
819
122
8YX
EN
WCP
E75
760.
00.
01.
60
312
30
00
00
YXE
NW
NW
D9S
100
1.3
0.6
0.0
130
560
00
00
0YX
EN
WN
WD
9512
50.
20.
10.
020
100
00
00
0YX
EN
WN
W75
718
00.
00.
00.
06
70
00
00
0YX
EN
WN
W32
014
80.
00.
00.
00
00
00
00
0YX
EN
WN
W31
912
40.
00.
00.
00
00
00
00
0YX
EN
WN
W75
322
40.
00.
00.
00
00
00
00
0YX
EN
WN
WE9
010
00.
00.
00.
00
00
00
00
0YX
EN
WXJ
ARJ
690.
10.
00.
07
00
00
00
0
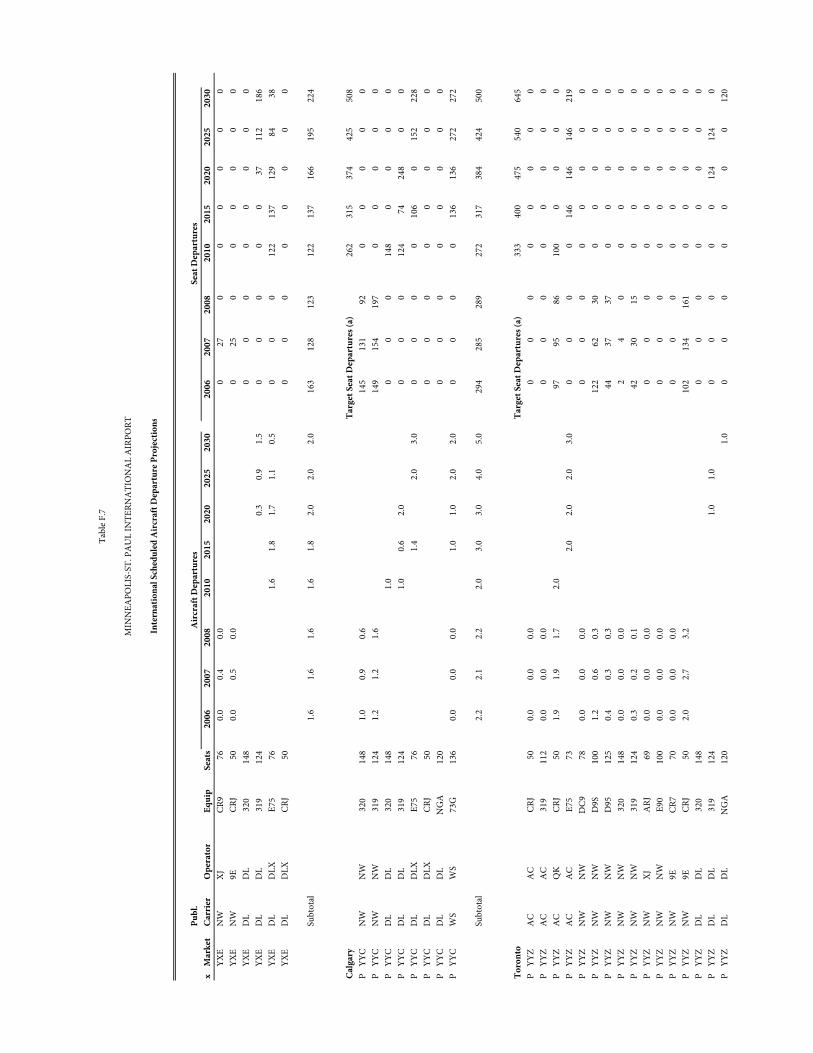
Pub
l.x
Mar
ket
Carr
ier
Ope
rato
rEq
uip
Seat
s20
0620
0720
08x
2010
2015
2020
2025
2030
x20
0620
0720
08x
2010
2015
2020
2025
2030
Tabl
e F.7
MIN
NEA
POLI
S-ST
. PA
UL
INTE
RNA
TIO
NA
L A
IRPO
RT
Inte
rnat
iona
l Sch
edul
ed A
ircr
aft D
epar
ture
Pro
ject
ion s
Air
craf
t Dep
artu
res
Seat
Dep
artu
res
YXE
NW
XJCR
976
0.0
0.4
0.0
027
00
00
00
YXE
NW
9ECR
J50
0.0
0.5
0.0
025
00
00
00
YXE
DL
DL
320
148
00
00
00
00
YXE
DL
DL
319
124
0.3
0.9
1.5
00
00
037
112
186
YXE
DL
DLX
E75
761.
61.
81.
71.
10.
50
00
122
137
129
8438
YXE
DL
DLX
CRJ
500
00
00
00
0
Subt
otal
1.6
1.6
1.6
1.6
1.8
2.0
2.0
2.0
163
128
123
122
137
166
195
224
Calg
ary
Targ
et S
eat D
epar
ture
s (a)
262
315
374
425
508
PYY
CN
WN
W32
014
81.
00.
90.
614
513
192
00
00
0P
YYC
NW
NW
319
124
1.2
1.2
1.6
149
154
197
00
00
0P
YYC
DL
DL
320
148
1.0
00
014
80
00
0P
YYC
DL
DL
319
124
1.0
0.6
2.0
00
012
474
248
00
PYY
CD
LD
LXE7
576
1.4
2.0
3.0
00
00
106
015
222
8P
YYC
DL
DLX
CRJ
500
00
00
00
0P
YYC
DL
DL
NG
A12
00
00
00
00
0P
YYC
WS
WS
73G
136
0.0
0.0
0.0
1.0
1.0
2.0
2.0
00
00
136
136
272
272
Subt
otal
2.2
2.1
2.2
2.0
3.0
3.0
4.0
5.0
294
285
289
272
317
384
424
500
Toro
nto
Targ
et S
eat D
epar
ture
s (a)
333
400
475
540
645
PYY
ZA
CA
CCR
J50
0.0
0.0
0.0
00
00
00
00
PYY
ZA
CA
C31
911
20.
00.
00.
00
00
00
00
0P
YYZ
AC
QK
CRJ
501.
91.
91.
72.
097
9586
100
00
00
PYY
ZA
CA
CE7
573
2.0
2.0
2.0
3.0
00
00
146
146
146
219
PYY
ZN
WN
WD
C978
0.0
0.0
0.0
00
00
00
00
PYY
ZN
WN
WD
9S10
01.
20.
60.
312
262
300
00
00
PYY
ZN
WN
WD
9512
50.
40.
30.
344
3737
00
00
0P
YYZ
NW
NW
320
148
0.0
0.0
0.0
24
00
00
00
PYY
ZN
WN
W31
912
40.
30.
20.
142
3015
00
00
0P
YYZ
NW
XJA
RJ69
0.0
0.0
0.0
00
00
00
00
PYY
ZN
WN
WE9
010
00.
00.
00.
00
00
00
00
0P
YYZ
NW
9ECR
770
0.0
0.0
0.0
00
00
00
00
PYY
ZN
W9E
CRJ
502.
02.
73.
210
213
416
10
00
00
PYY
ZD
LD
L32
014
80
00
00
00
0P
YYZ
DL
DL
319
124
1.0
1.0
00
00
012
412
40
PYY
ZD
LD
LN
GA
120
1.0
00
00
00
012
0
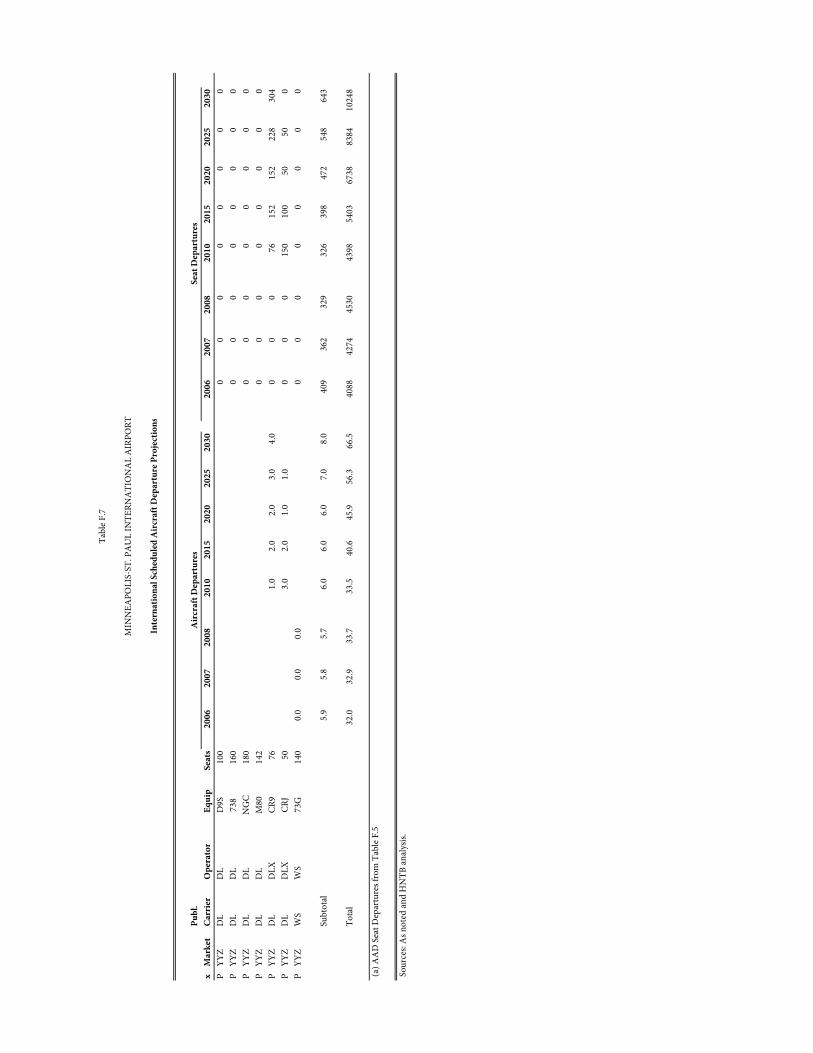
Pub
l.x
Mar
ket
Carr
ier
Ope
rato
rEq
uip
Seat
s20
0620
0720
08x
2010
2015
2020
2025
2030
x20
0620
0720
08x
2010
2015
2020
2025
2030
Tabl
e F.7
MIN
NEA
POLI
S-ST
. PA
UL
INTE
RNA
TIO
NA
L A
IRPO
RT
Inte
rnat
iona
l Sch
edul
ed A
ircr
aft D
epar
ture
Pro
ject
ion s
Air
craf
t Dep
artu
res
Seat
Dep
artu
res
PYY
ZD
LD
LD
9S10
00
00
00
00
0P
YYZ
DL
DL
738
160
00
00
00
00
PYY
ZD
LD
LN
GC
180
00
00
00
00
PYY
ZD
LD
LM
8014
20
00
00
00
0P
YYZ
DL
DLX
CR9
761.
02.
02.
03.
04.
00
00
7615
215
222
830
4P
YYZ
DL
DLX
CRJ
503.
02.
01.
01.
00
00
150
100
5050
0P
YYZ
WS
WS
73G
140
0.0
0.0
0.0
00
00
00
00
Subt
otal
5.9
5.8
5.7
6.0
6.0
6.0
7.0
8.0
409
362
329
326
398
472
548
643
Tota
l32
.032
.933
.733
.540
.645
.956
.366
.540
8842
7445
3043
9854
0367
3883
8410
248
(a) A
AD
Sea
t Dep
artu
res f
rom
Tab
le F
.5
Sou
rces
: As n
oted
and
HN
TB an
alys
is.
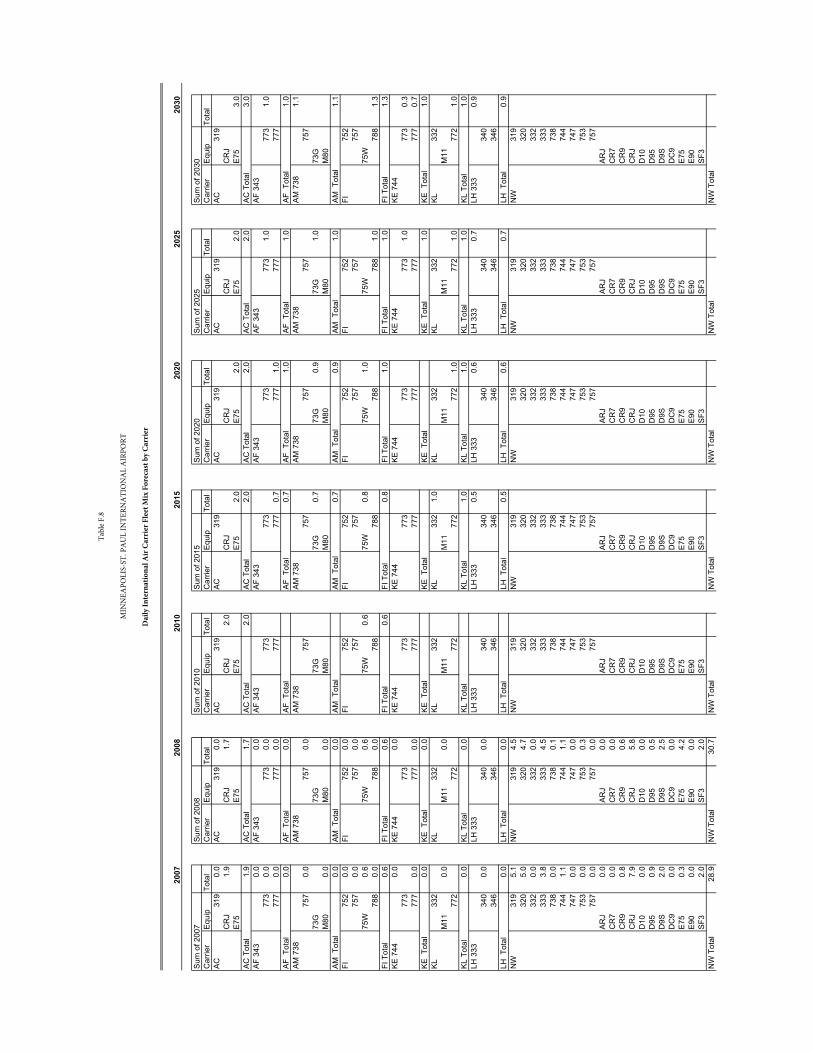
2007
2008
2010
2015
2020
2025
2030
Sum
of 2
007
Sum
of 2
008
Sum
of 2
010
Sum
of 2
015
Sum
of 2
020
Sum
of 2
025
Sum
of 2
030
Car
rier
Equ
ipTo
tal
Car
rier
Equ
ipTo
tal
Car
rier
Equ
ipTo
tal
Car
rier
Equ
ipTo
tal
Car
rier
Equ
ipTo
tal
Car
rier
Equ
ipTo
tal
Car
rier
Equ
ipTo
tal
AC
319
0.0
AC
319
0.0
AC
319
AC
319
AC
319
AC
319
AC
319
CR
J1.
9C
RJ
1.7
CR
J2.
0C
RJ
CR
JC
RJ
CR
JE
75E
75E
75E
752.
0E
752.
0E
752.
0E
753.
0A
C T
otal
1.9
AC
Tot
al1.
7A
C T
otal
2.0
AC
Tot
al2.
0A
C T
otal
2.0
AC
Tot
al2.
0A
C T
otal
3.0
AF
343
0.0
AF
343
0.0
AF
343
AF
343
AF
343
AF
343
AF
343
773
0.0
773
0.0
773
773
773
773
1.0
773
1.0
777
0.0
777
0.0
777
777
0.7
777
1.0
777
777
AF
Tot
al0.
0A
F T
otal
0.0
AF
Tot
alA
F T
otal
0.7
AF
Tot
al1.
0A
F T
otal
1.0
AF
Tot
al1.
0A
M 7
38A
M 7
38A
M 7
38A
M 7
38A
M 7
38A
M 7
38A
M 7
381.
175
70.
075
70.
075
775
775
775
775
773
G73
G73
G73
G0.
773
G0.
973
G1.
073
GM
800.
0M
800.
0M
80M
80M
80M
80M
80A
M T
otal
0.0
AM
Tot
al0.
0A
M T
otal
AM
Tot
al0.
7A
M T
otal
0.9
AM
Tot
al1.
0A
M T
otal
1.1
FI75
20.
0FI
752
0.0
FI75
2FI
752
FI75
2FI
752
FI75
275
70.
075
70.
075
775
775
775
775
775
W0.
675
W0.
675
W0.
675
W0.
875
W1.
075
W75
W78
80.
078
80.
078
878
878
878
81.
078
81.
3FI
Tot
al0.
6FI
Tot
al0.
6FI
Tot
al0.
6FI
Tot
al0.
8FI
Tot
al1.
0FI
Tot
al1.
0FI
Tot
al1.
3K
E 7
440.
0K
E 7
440.
0K
E 7
44K
E 7
44K
E 7
44K
E 7
44K
E 7
4477
377
377
377
377
377
31.
077
30.
377
70.
077
70.
077
777
777
777
777
70.
7K
E T
otal
0.0
KE
Tot
al0.
0K
E T
otal
KE
Tot
alK
E T
otal
KE
Tot
al1.
0K
E T
otal
1.0
KL
332
KL
332
KL
332
KL
332
1.0
KL
332
KL
332
KL
332
M11
0.0
M11
0.0
M11
M11
M11
M11
M11
772
772
772
772
772
1.0
772
1.0
772
1.0
KL
Tota
l0.
0K
L To
tal
0.0
KL
Tota
lK
L To
tal
1.0
KL
Tota
l1.
0K
L To
tal
1.0
KL
Tota
l1.
0LH
333
LH 3
33LH
333
LH 3
330.
5LH
333
0.6
LH 3
330.
7LH
333
0.9
340
0.0
340
0.0
340
340
340
340
340
346
346
346
346
346
346
346
LH T
otal
0.0
LH T
otal
0.0
LH T
otal
LH T
otal
0.5
LH T
otal
0.6
LH T
otal
0.7
LH T
otal
0.9
NW
319
5.1
NW
319
4.5
NW
319
NW
319
NW
319
NW
319
NW
319
320
5.0
320
4.7
320
320
320
320
320
332
0.0
332
0.0
332
332
332
332
332
333
3.8
333
4.5
333
333
333
333
333
738
0.0
738
0.1
738
738
738
738
738
744
1.1
744
1.1
744
744
744
744
744
747
0.0
747
0.0
747
747
747
747
747
753
0.0
753
0.3
753
753
753
753
753
757
0.0
757
0.0
757
757
757
757
757
AR
J0.
0A
RJ
0.0
AR
JA
RJ
AR
JA
RJ
AR
JC
R7
0.0
CR
70.
0C
R7
CR
7C
R7
CR
7C
R7
CR
90.
8C
R9
0.6
CR
9C
R9
CR
9C
R9
CR
9C
RJ
7.9
CR
J5.
8C
RJ
CR
JC
RJ
CR
JC
RJ
D10
0.0
D10
0.0
D10
D10
D10
D10
D10
D95
0.9
D95
0.5
D95
D95
D95
D95
D95
D9S
2.0
D9S
2.5
D9S
D9S
D9S
D9S
D9S
DC
90.
0D
C9
0.0
DC
9D
C9
DC
9D
C9
DC
9E
750.
3E
754.
2E
75E
75E
75E
75E
75E
900.
0E
900.
0E
90E
90E
90E
90E
90S
F32.
0S
F32.
0S
F3S
F3S
F3S
F3S
F3N
W T
otal
28.9
NW
Tot
al30
.7N
W T
otal
NW
Tot
alN
W T
otal
NW
Tot
alN
W T
otal
Tabl
e F.8
MIN
NEA
POLI
S-ST
. PA
UL
INTE
RNA
TIO
NA
L A
IRPO
RT
Dai
ly In
tern
atio
nal A
ir C
arri
er F
leet
Mix
For
ecas
t by
Carr
ier
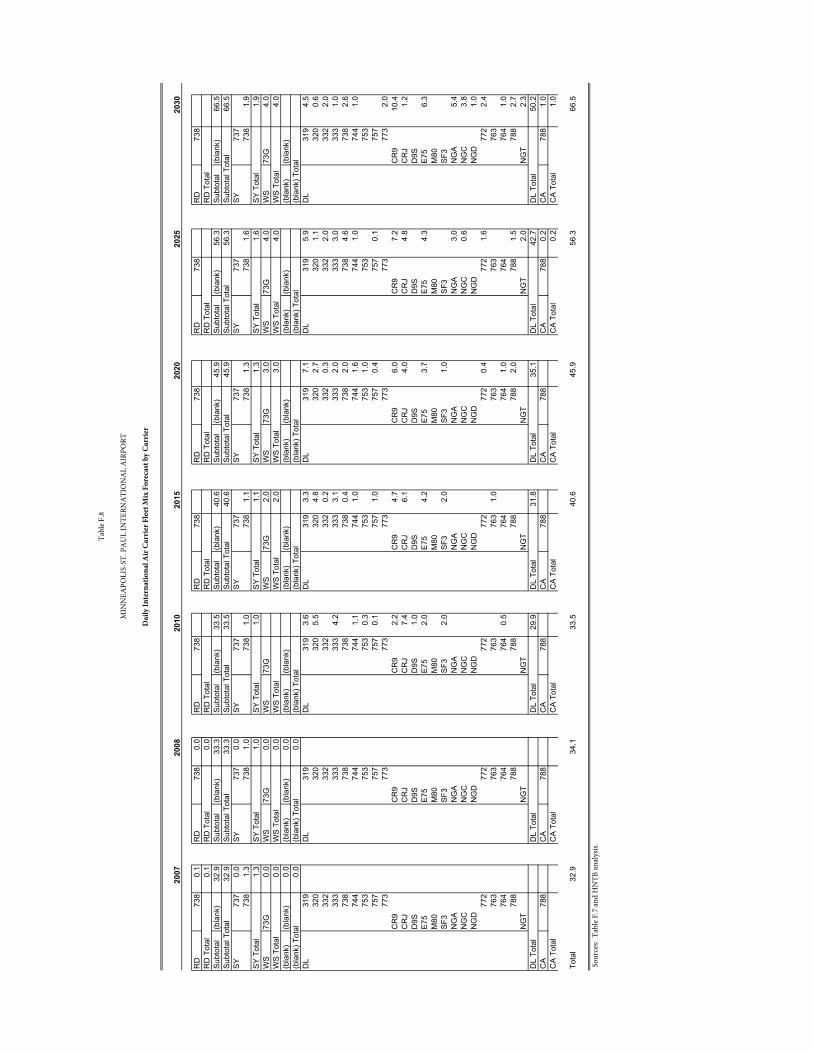
2007
2008
2010
2015
2020
2025
2030
Tabl
e F.8
MIN
NEA
POLI
S-ST
. PA
UL
INTE
RNA
TIO
NA
L A
IRPO
RT
Dai
ly In
tern
atio
nal A
ir C
arri
er F
leet
Mix
For
ecas
t by
Carr
ier
RD
738
0.1
RD
738
0.0
RD
738
RD
738
RD
738
RD
738
RD
738
RD
Tot
al0.
1R
D T
otal
0.0
RD
Tot
alR
D T
otal
RD
Tot
alR
D T
otal
RD
Tot
alS
ubto
tal
(bla
nk)
32.9
Sub
tota
l(b
lank
)33
.3S
ubto
tal
(bla
nk)
33.5
Sub
tota
l(b
lank
)40
.6S
ubto
tal
(bla
nk)
45.9
Sub
tota
l(b
lank
)56
.3S
ubto
tal
(bla
nk)
66.5
Sub
tota
l Tot
al32
.9S
ubto
tal T
otal
33.3
Sub
tota
l Tot
al33
.5S
ubto
tal T
otal
40.6
Sub
tota
l Tot
al45
.9S
ubto
tal T
otal
56.3
Sub
tota
l Tot
al66
.5S
Y73
70.
0S
Y73
70.
0S
Y73
7S
Y73
7S
Y73
7S
Y73
7S
Y73
773
81.
373
81.
073
81.
073
81.
173
81.
373
81.
673
81.
9S
Y T
otal
1.3
SY
Tot
al1.
0S
Y T
otal
1.0
SY
Tot
al1.
1S
Y T
otal
1.3
SY
Tot
al1.
6S
Y T
otal
1.9
WS
73G
0.0
WS
73G
0.0
WS
73G
WS
73G
2.0
WS
73G
3.0
WS
73G
4.0
WS
73G
4.0
WS
Tot
al0.
0W
S T
otal
0.0
WS
Tot
alW
S T
otal
2.0
WS
Tot
al3.
0W
S T
otal
4.0
WS
Tot
al4.
0(b
lank
)(b
lank
)0.
0(b
lank
)(b
lank
)0.
0(b
lank
)(b
lank
)(b
lank
)(b
lank
)(b
lank
)(b
lank
)(b
lank
)(b
lank
)(b
lank
)(b
lank
)(b
lank
) Tot
al0.
0(b
lank
) Tot
al0.
0(b
lank
) Tot
al(b
lank
) Tot
al(b
lank
) Tot
al(b
lank
) Tot
al(b
lank
) Tot
alD
L31
9D
L31
9D
L31
93.
6D
L31
93.
3D
L31
97.
1D
L31
95.
9D
L31
94.
532
032
032
05.
532
04.
832
02.
732
01.
132
00.
633
233
233
233
20.
233
20.
333
22.
033
22.
033
333
333
34.
233
33.
133
32.
033
33.
033
31.
073
873
873
873
80.
473
82.
073
84.
673
82.
674
474
474
41.
174
41.
074
41.
674
41.
074
41.
075
375
375
30.
375
375
31.
075
375
375
775
775
70.
175
71.
075
70.
475
70.
175
777
377
377
377
377
377
377
32.
0C
R9
CR
9C
R9
2.2
CR
94.
7C
R9
6.0
CR
97.
2C
R9
10.4
CR
JC
RJ
CR
J7.
4C
RJ
6.1
CR
J4.
0C
RJ
4.8
CR
J1.
2D
9SD
9SD
9S1.
0D
9SD
9SD
9SD
9SE
75E
75E
752.
0E
754.
2E
753.
7E
754.
3E
756.
3M
80M
80M
80M
80M
80M
80M
80S
F3S
F3S
F32.
0S
F32.
0S
F31.
0S
F3S
F3N
GA
NG
AN
GA
NG
AN
GA
NG
A3.
0N
GA
5.4
NG
CN
GC
NG
CN
GC
NG
CN
GC
0.6
NG
C3.
8N
GD
NG
DN
GD
NG
DN
GD
NG
DN
GD
1.0
772
772
772
772
772
0.4
772
1.6
772
2.4
763
763
763
763
1.0
763
763
763
764
764
764
0.5
764
764
1.0
764
764
1.0
788
788
788
788
788
2.0
788
1.5
788
2.7
NG
TN
GT
NG
TN
GT
NG
TN
GT
2.0
NG
T2.
3D
L To
tal
DL
Tota
lD
L To
tal
29.9
DL
Tota
l31
.8D
L To
tal
35.1
DL
Tota
l42
.7D
L To
tal
50.2
CA
788
CA
788
CA
788
CA
788
CA
788
CA
788
0.2
CA
788
1.0
CA
Tot
alC
A T
otal
CA
Tot
alC
A T
otal
CA
Tot
alC
A T
otal
0.2
CA
Tot
al1.
0
Tota
l32
.934
.133
.540
.645
.956
.366
.5
Sou
rces
: Ta
ble F
.7 an
d H
NTB
anal
ysis.
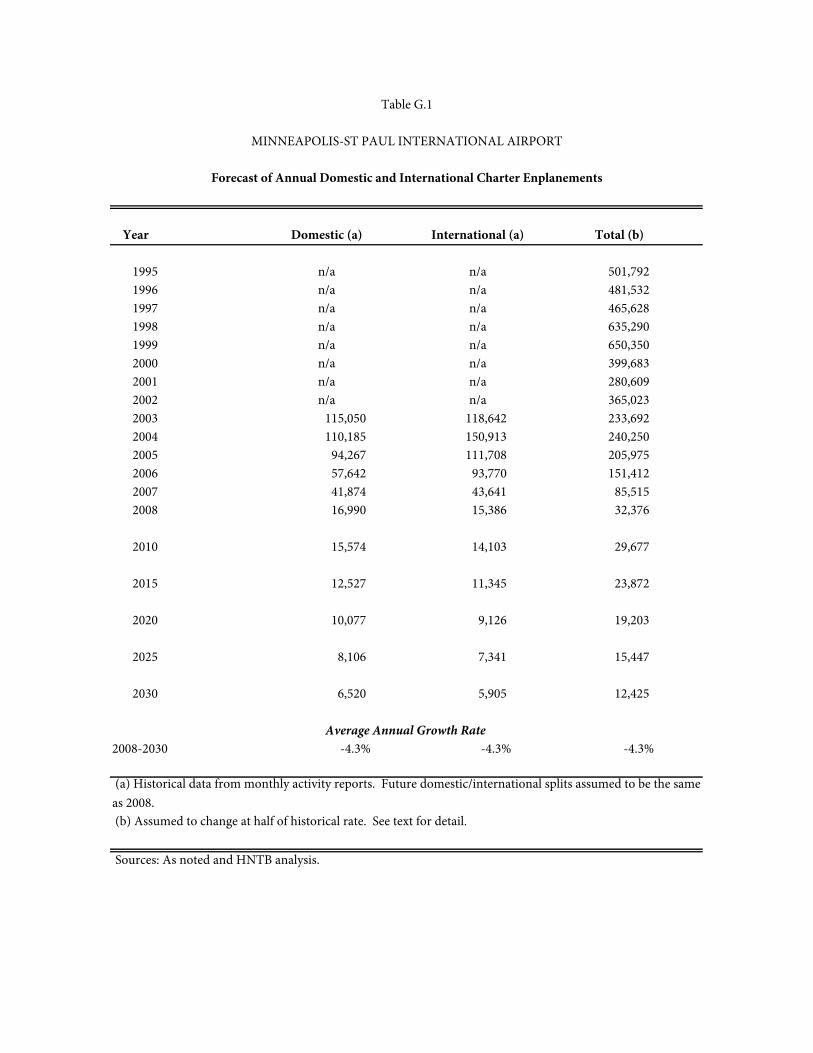
Year Domestic (a) International (a) Total (b)
1995 n/a n/a 501,792 1996 n/a n/a 481,532 1997 n/a n/a 465,628 1998 n/a n/a 635,290 1999 n/a n/a 650,350 2000 n/a n/a 399,683 2001 n/a n/a 280,609 2002 n/a n/a 365,023 2003 115,050 118,642 233,692 2004 110,185 150,913 240,250 2005 94,267 111,708 205,975 2006 57,642 93,770 151,412 2007 41,874 43,641 85,515 2008 16,990 15,386 32,376
2010 15,574 14,103 29,677
2015 12,527 11,345 23,872
2020 10,077 9,126 19,203
2025 8,106 7,341 15,447
2030 6,520 5,905 12,425
2008-2030 -4.3% -4.3% -4.3%
(b) Assumed to change at half of historical rate. See text for detail.
Sources: As noted and HNTB analysis.
(a) Historical data from monthly activity reports. Future domestic/international splits assumed to be the same as 2008.
MINNEAPOLIS-ST PAUL INTERNATIONAL AIRPORT
Forecast of Annual Domestic and International Charter Enplanements
Table G.1
Average Annual Growth Rate
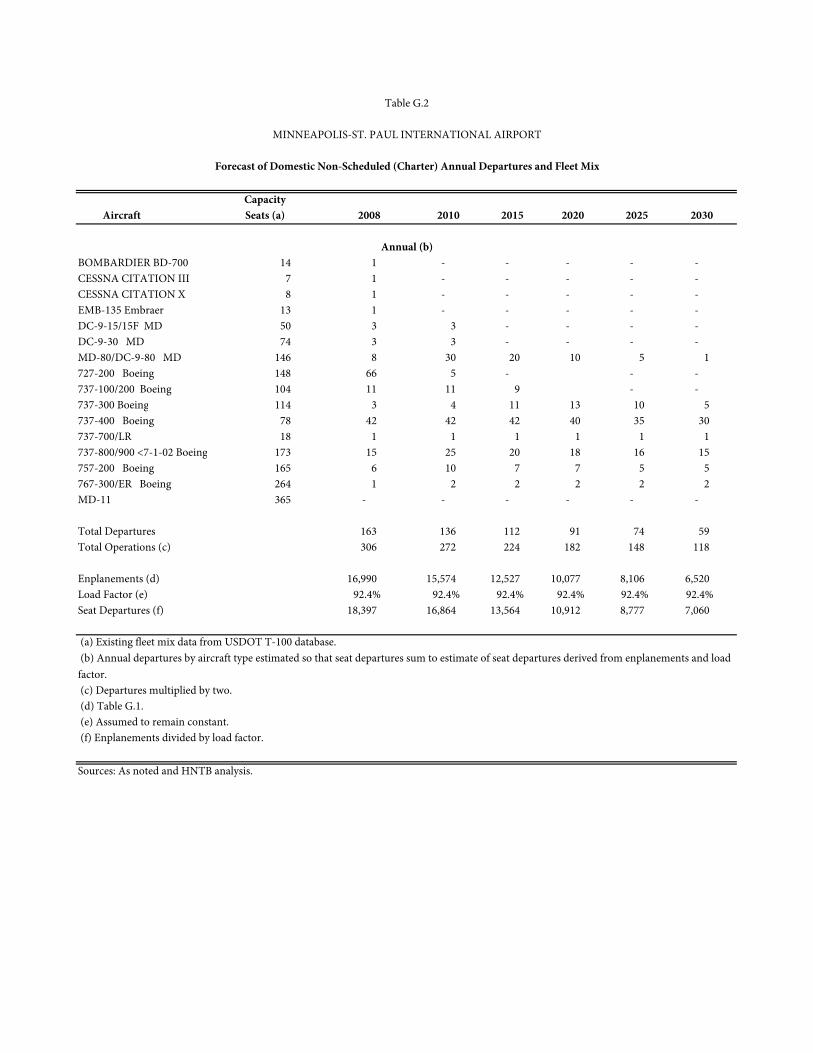
CapacityAircraft Seats (a) 2008 2010 2015 2020 2025 2030
BOMBARDIER BD-700 14 1 - - - - - CESSNA CITATION III 7 1 - - - - - CESSNA CITATION X 8 1 - - - - - EMB-135 Embraer 13 1 - - - - - DC-9-15/15F MD 50 3 3 - - - - DC-9-30 MD 74 3 3 - - - - MD-80/DC-9-80 MD 146 8 30 20 10 5 1 727-200 Boeing 148 66 5 - - - 737-100/200 Boeing 104 11 11 9 - - 737-300 Boeing 114 3 4 11 13 10 5 737-400 Boeing 78 42 42 42 40 35 30 737-700/LR 18 1 1 1 1 1 1 737-800/900 <7-1-02 Boeing 173 15 25 20 18 16 15 757-200 Boeing 165 6 10 7 7 5 5 767-300/ER Boeing 264 1 2 2 2 2 2 MD-11 365 - - - - - -
Total Departures 163 136 112 91 74 59 Total Operations (c) 306 272 224 182 148 118
Enplanements (d) 16,990 15,574 12,527 10,077 8,106 6,520 Load Factor (e) 92.4% 92.4% 92.4% 92.4% 92.4% 92.4%Seat Departures (f) 18,397 16,864 13,564 10,912 8,777 7,060
(a) Existing fleet mix data from USDOT T-100 database.
(c) Departures multiplied by two. (d) Table G.1. (e) Assumed to remain constant. (f) Enplanements divided by load factor.
Sources: As noted and HNTB analysis.
(b) Annual departures by aircraft type estimated so that seat departures sum to estimate of seat departures derived from enplanements and load factor.
MINNEAPOLIS-ST. PAUL INTERNATIONAL AIRPORT
Table G.2
Forecast of Domestic Non-Scheduled (Charter) Annual Departures and Fleet Mix
Annual (b)
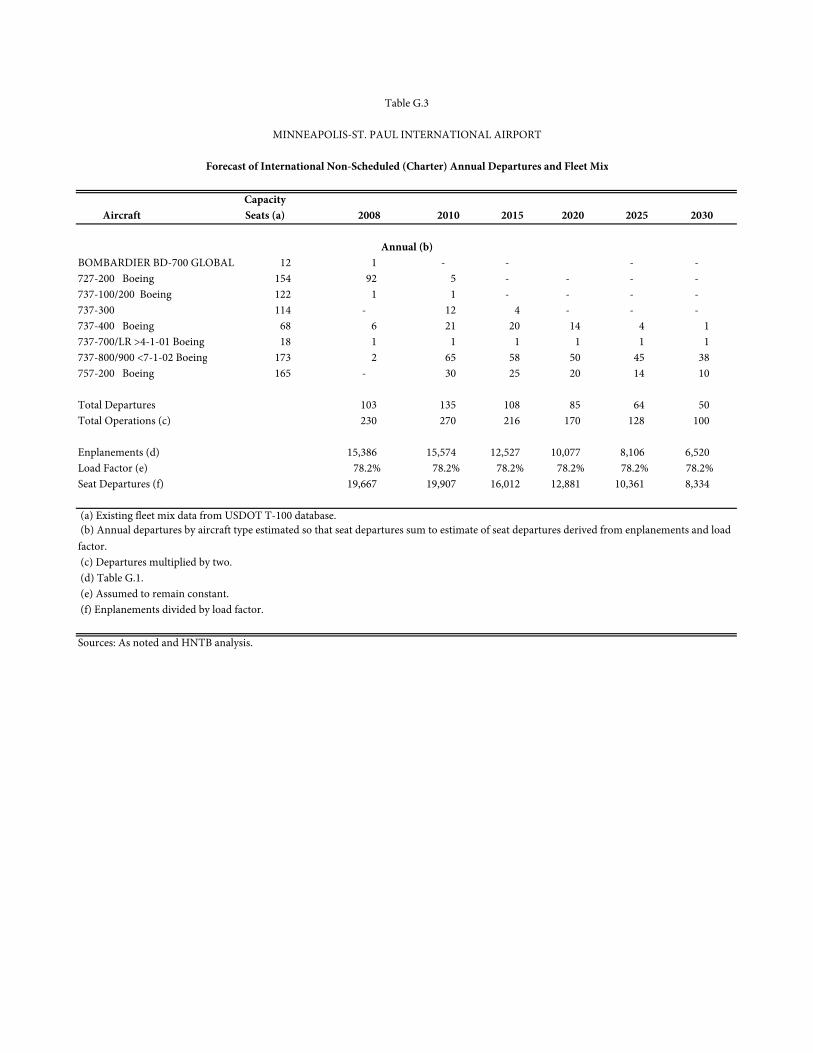
CapacityAircraft Seats (a) 2008 2010 2015 2020 2025 2030
BOMBARDIER BD-700 GLOBAL 12 1 - - - - 727-200 Boeing 154 92 5 - - - - 737-100/200 Boeing 122 1 1 - - - - 737-300 114 - 12 4 - - - 737-400 Boeing 68 6 21 20 14 4 1 737-700/LR >4-1-01 Boeing 18 1 1 1 1 1 1 737-800/900 <7-1-02 Boeing 173 2 65 58 50 45 38 757-200 Boeing 165 - 30 25 20 14 10
Total Departures 103 135 108 85 64 50 Total Operations (c) 230 270 216 170 128 100
Enplanements (d) 15,386 15,574 12,527 10,077 8,106 6,520 Load Factor (e) 78.2% 78.2% 78.2% 78.2% 78.2% 78.2%Seat Departures (f) 19,667 19,907 16,012 12,881 10,361 8,334
(a) Existing fleet mix data from USDOT T-100 database.
(c) Departures multiplied by two. (d) Table G.1. (e) Assumed to remain constant. (f) Enplanements divided by load factor.
Sources: As noted and HNTB analysis.
(b) Annual departures by aircraft type estimated so that seat departures sum to estimate of seat departures derived from enplanements and load factor.
MINNEAPOLIS-ST. PAUL INTERNATIONAL AIRPORT
Table G.3
Forecast of International Non-Scheduled (Charter) Annual Departures and Fleet Mix
Annual (b)
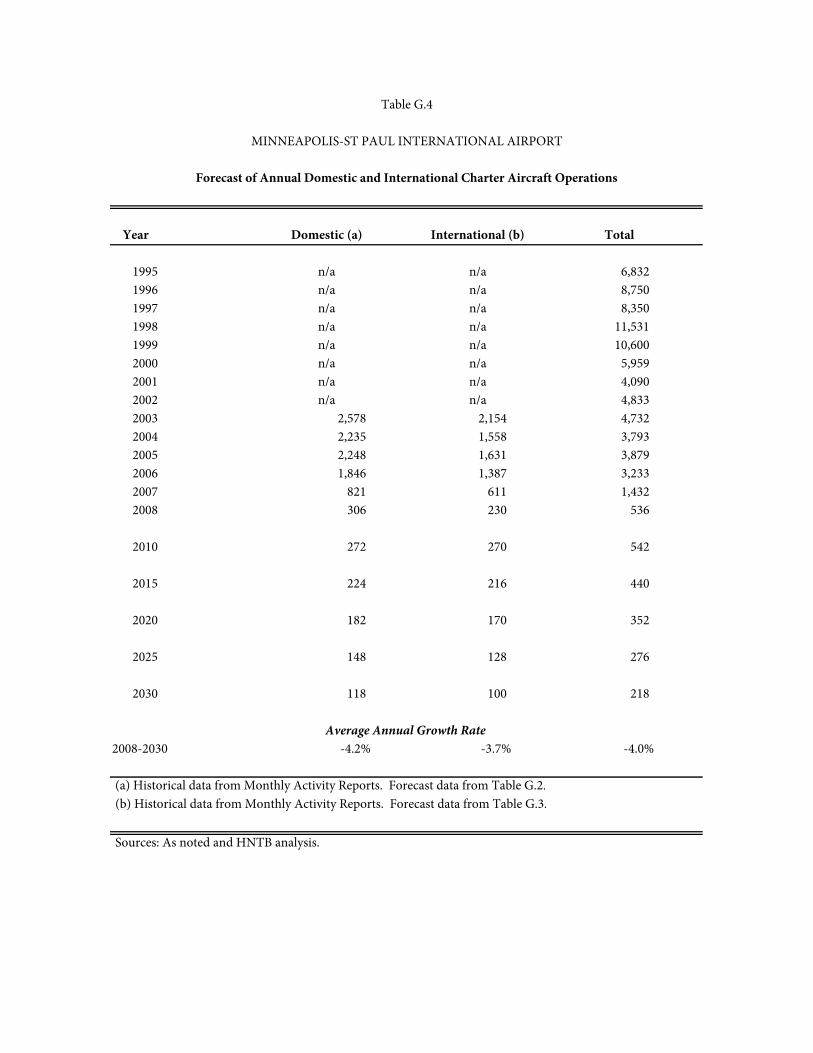
Year Domestic (a) International (b) Total
1995 n/a n/a 6,832 1996 n/a n/a 8,750 1997 n/a n/a 8,350 1998 n/a n/a 11,531 1999 n/a n/a 10,600 2000 n/a n/a 5,959 2001 n/a n/a 4,090 2002 n/a n/a 4,833 2003 2,578 2,154 4,732 2004 2,235 1,558 3,793 2005 2,248 1,631 3,879 2006 1,846 1,387 3,233 2007 821 611 1,432 2008 306 230 536
2010 272 270 542
2015 224 216 440
2020 182 170 352
2025 148 128 276
2030 118 100 218
2008-2030 -4.2% -3.7% -4.0%
(a) Historical data from Monthly Activity Reports. Forecast data from Table G.2. (b) Historical data from Monthly Activity Reports. Forecast data from Table G.3.
Sources: As noted and HNTB analysis.
MINNEAPOLIS-ST PAUL INTERNATIONAL AIRPORT
Forecast of Annual Domestic and International Charter Aircraft Operations
Table G.4
Average Annual Growth Rate
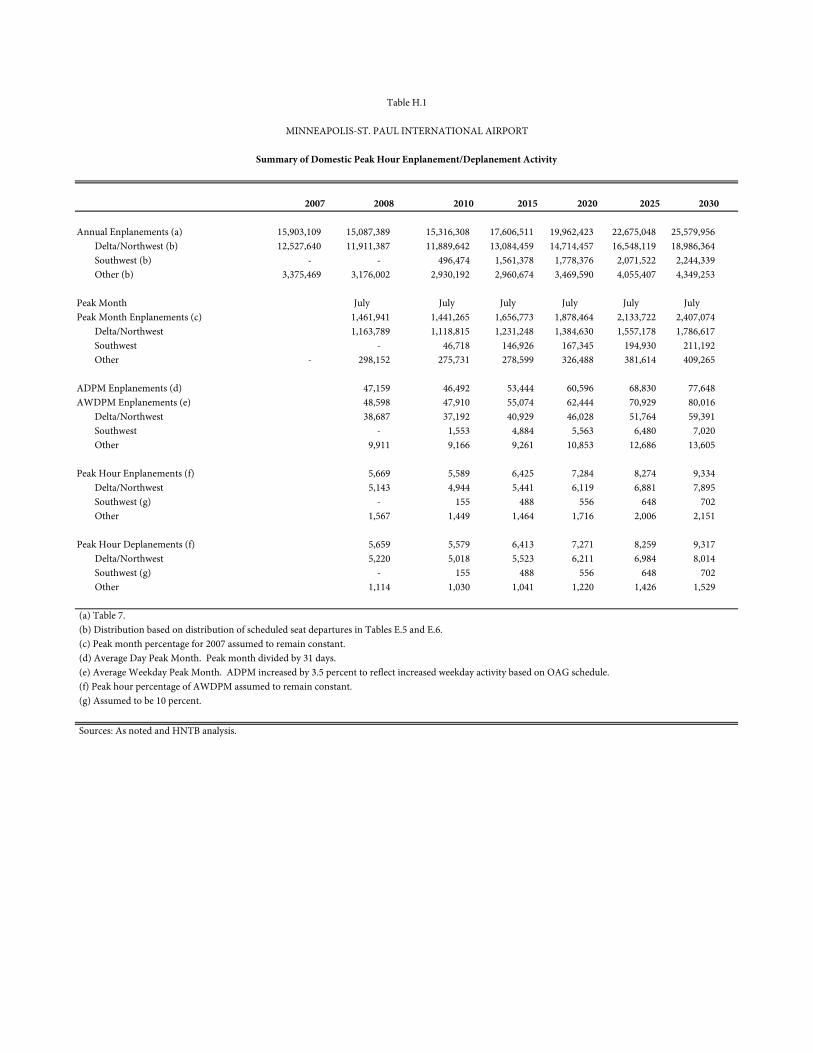
2007 2008 2010 2015 2020 2025 2030
Annual Enplanements (a) 15,903,109 15,087,389 # 15,316,308 17,606,511 19,962,423 22,675,048 25,579,956Delta/Northwest (b) 12,527,640 11,911,387 11,889,642 13,084,459 14,714,457 16,548,119 18,986,364Southwest (b) - - 496,474 1,561,378 1,778,376 2,071,522 2,244,339 Other (b) 3,375,469 3,176,002 2,930,192 2,960,674 3,469,590 4,055,407 4,349,253
Peak Month July July July July July JulyPeak Month Enplanements (c) 1,461,941 1,441,265 1,656,773 1,878,464 2,133,722 2,407,074
Delta/Northwest 1,163,789 1,118,815 1,231,248 1,384,630 1,557,178 1,786,617 Southwest - 46,718 146,926 167,345 194,930 211,192 Other - 298,152 275,731 278,599 326,488 381,614 409,265
ADPM Enplanements (d) 47,159 46,492 53,444 60,596 68,830 77,648 AWDPM Enplanements (e) 48,598 47,910 55,074 62,444 70,929 80,016
Delta/Northwest 38,687 37,192 40,929 46,028 51,764 59,391 Southwest - 1,553 4,884 5,563 6,480 7,020 Other 9,911 9,166 9,261 10,853 12,686 13,605
Peak Hour Enplanements (f) 5,669 5,589 6,425 7,284 8,274 9,334 Delta/Northwest 5,143 4,944 5,441 6,119 6,881 7,895 Southwest (g) - 155 488 556 648 702 Other 1,567 1,449 1,464 1,716 2,006 2,151
Peak Hour Deplanements (f) 5,659 5,579 6,413 7,271 8,259 9,317 Delta/Northwest 5,220 5,018 5,523 6,211 6,984 8,014 Southwest (g) - 155 488 556 648 702 Other 1,114 1,030 1,041 1,220 1,426 1,529
(a) Table 7. (b) Distribution based on distribution of scheduled seat departures in Tables E.5 and E.6. (c) Peak month percentage for 2007 assumed to remain constant. (d) Average Day Peak Month. Peak month divided by 31 days. (e) Average Weekday Peak Month. ADPM increased by 3.5 percent to reflect increased weekday activity based on OAG schedule. (f) Peak hour percentage of AWDPM assumed to remain constant. (g) Assumed to be 10 percent.
Sources: As noted and HNTB analysis.
Table H.1
MINNEAPOLIS-ST. PAUL INTERNATIONAL AIRPORT
Summary of Domestic Peak Hour Enplanement/Deplanement Activity
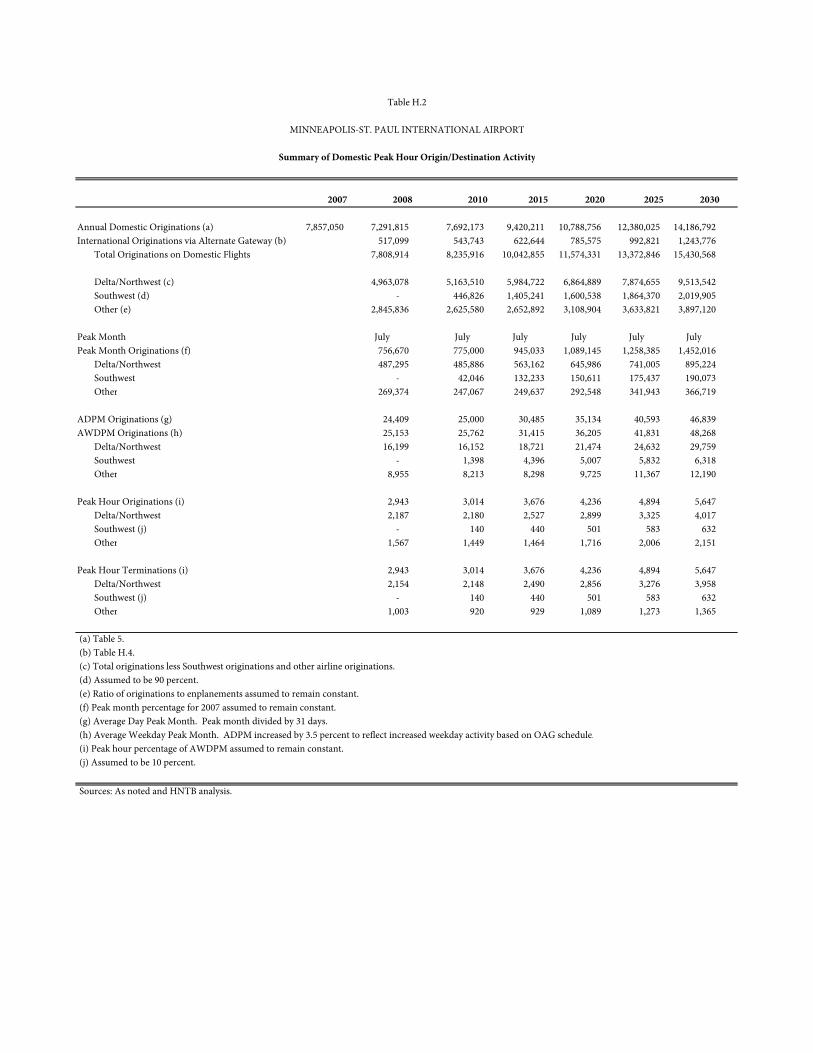
2007 2008 2010 2015 2020 2025 2030
Annual Domestic Originations (a) 7,857,050 7,291,815 7,692,173 9,420,211 10,788,756 12,380,025 14,186,792International Originations via Alternate Gateway (b) 517,099 543,743 622,644 785,575 992,821 1,243,776
Total Originations on Domestic Flights 7,808,914 8,235,916 10,042,855 11,574,331 13,372,846 15,430,568
Delta/Northwest (c) 4,963,078 5,163,510 5,984,722 6,864,889 7,874,655 9,513,542 Southwest (d) - 446,826 1,405,241 1,600,538 1,864,370 2,019,905 Other (e) 2,845,836 2,625,580 2,652,892 3,108,904 3,633,821 3,897,120
Peak Month July July July July July JulyPeak Month Originations (f) 756,670 775,000 945,033 1,089,145 1,258,385 1,452,016
Delta/Northwest 487,295 485,886 563,162 645,986 741,005 895,224 Southwest - 42,046 132,233 150,611 175,437 190,073 Other 269,374 247,067 249,637 292,548 341,943 366,719
ADPM Originations (g) 24,409 25,000 30,485 35,134 40,593 46,839 AWDPM Originations (h) 25,153 25,762 31,415 36,205 41,831 48,268
Delta/Northwest 16,199 16,152 18,721 21,474 24,632 29,759 Southwest - 1,398 4,396 5,007 5,832 6,318 Other 8,955 8,213 8,298 9,725 11,367 12,190
Peak Hour Originations (i) 2,943 3,014 3,676 4,236 4,894 5,647 Delta/Northwest 2,187 2,180 2,527 2,899 3,325 4,017 Southwest (j) - 140 440 501 583 632 Other 1,567 1,449 1,464 1,716 2,006 2,151
Peak Hour Terminations (i) 2,943 3,014 3,676 4,236 4,894 5,647 Delta/Northwest 2,154 2,148 2,490 2,856 3,276 3,958 Southwest (j) - 140 440 501 583 632 Other 1,003 920 929 1,089 1,273 1,365
(a) Table 5. (b) Table H.4. (c) Total originations less Southwest originations and other airline originations. (d) Assumed to be 90 percent. (e) Ratio of originations to enplanements assumed to remain constant. (f) Peak month percentage for 2007 assumed to remain constant. (g) Average Day Peak Month. Peak month divided by 31 days. (h) Average Weekday Peak Month. ADPM increased by 3.5 percent to reflect increased weekday activity based on OAG schedule. (i) Peak hour percentage of AWDPM assumed to remain constant. (j) Assumed to be 10 percent.
Sources: As noted and HNTB analysis.
Table H.2
MINNEAPOLIS-ST. PAUL INTERNATIONAL AIRPORT
Summary of Domestic Peak Hour Origin/Destination Activity
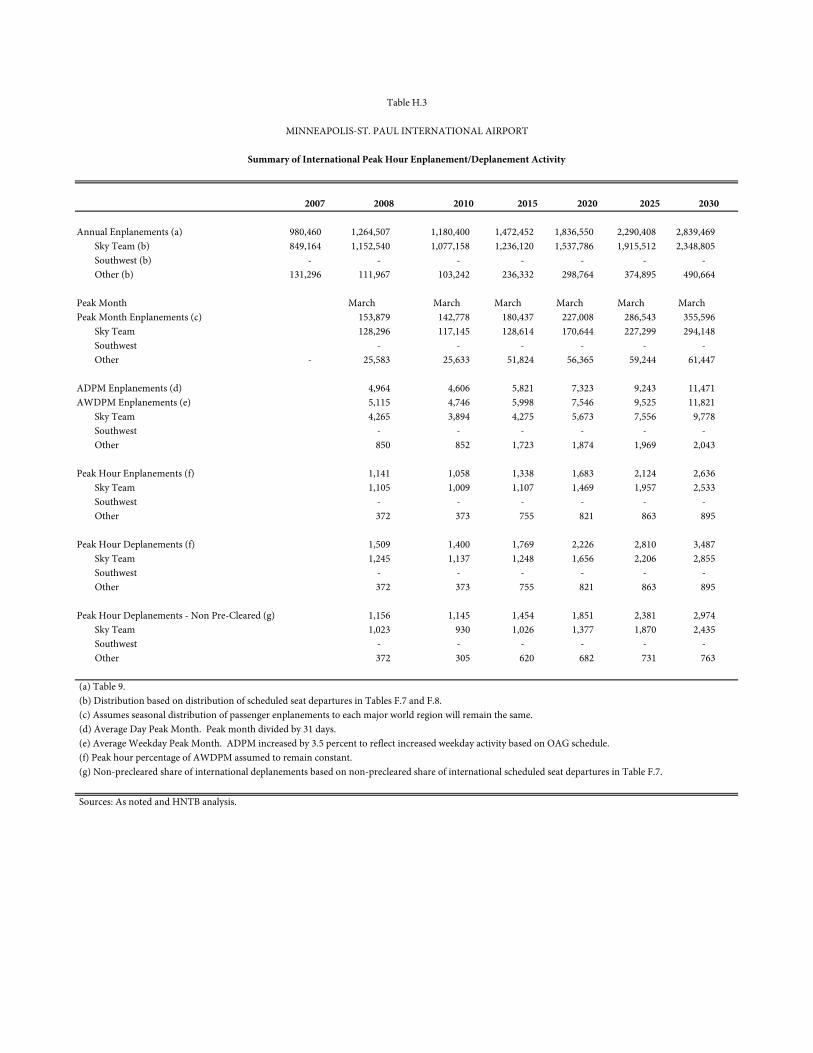
2007 2008 2010 2015 2020 2025 2030
Annual Enplanements (a) 980,460 1,264,507 # 1,180,400 1,472,452 1,836,550 2,290,408 2,839,469 Sky Team (b) 849,164 1,152,540 1,077,158 1,236,120 1,537,786 1,915,512 2,348,805 Southwest (b) - - - - - - - Other (b) 131,296 111,967 103,242 236,332 298,764 374,895 490,664
Peak Month March March March March March MarchPeak Month Enplanements (c) 153,879 142,778 180,437 227,008 286,543 355,596
Sky Team 128,296 117,145 128,614 170,644 227,299 294,148 Southwest - - - - - - Other - 25,583 25,633 51,824 56,365 59,244 61,447
ADPM Enplanements (d) 4,964 4,606 5,821 7,323 9,243 11,471 AWDPM Enplanements (e) 5,115 4,746 5,998 7,546 9,525 11,821
Sky Team 4,265 3,894 4,275 5,673 7,556 9,778 Southwest - - - - - - Other 850 852 1,723 1,874 1,969 2,043
Peak Hour Enplanements (f) 1,141 1,058 1,338 1,683 2,124 2,636 Sky Team 1,105 1,009 1,107 1,469 1,957 2,533 Southwest - - - - - - Other 372 373 755 821 863 895
Peak Hour Deplanements (f) 1,509 1,400 1,769 2,226 2,810 3,487 Sky Team 1,245 1,137 1,248 1,656 2,206 2,855 Southwest - - - - - - Other 372 373 755 821 863 895
Peak Hour Deplanements - Non Pre-Cleared (g) 1,156 1,145 1,454 1,851 2,381 2,974 Sky Team 1,023 930 1,026 1,377 1,870 2,435 Southwest - - - - - - Other 372 305 620 682 731 763
(a) Table 9. (b) Distribution based on distribution of scheduled seat departures in Tables F.7 and F.8. (c) Assumes seasonal distribution of passenger enplanements to each major world region will remain the same. (d) Average Day Peak Month. Peak month divided by 31 days. (e) Average Weekday Peak Month. ADPM increased by 3.5 percent to reflect increased weekday activity based on OAG schedule. (f) Peak hour percentage of AWDPM assumed to remain constant. (g) Non-precleared share of international deplanements based on non-precleared share of international scheduled seat departures in Table F.7.
Sources: As noted and HNTB analysis.
Table H.3
MINNEAPOLIS-ST. PAUL INTERNATIONAL AIRPORT
Summary of International Peak Hour Enplanement/Deplanement Activity
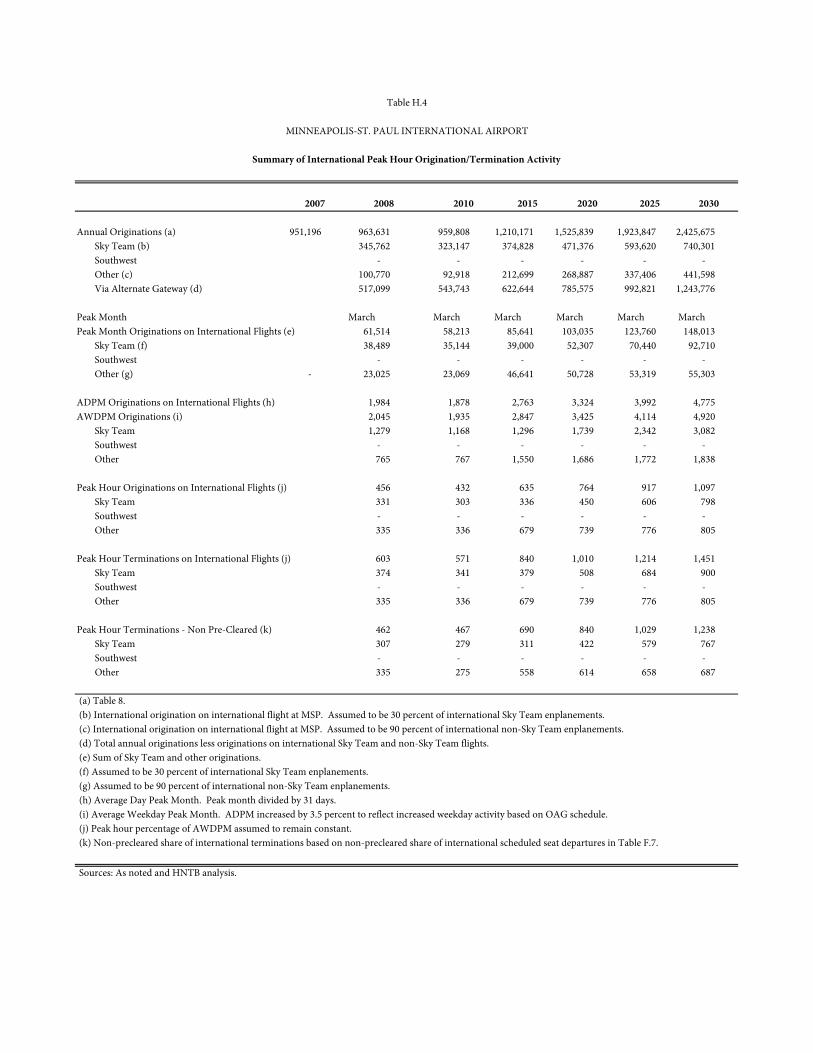
2007 2008 2010 2015 2020 2025 2030
Annual Originations (a) 951,196 963,631 959,808 1,210,171 1,525,839 1,923,847 2,425,675 Sky Team (b) 345,762 323,147 374,828 471,376 593,620 740,301 Southwest - - - - - - Other (c) 100,770 92,918 212,699 268,887 337,406 441,598 Via Alternate Gateway (d) 517,099 543,743 622,644 785,575 992,821 1,243,776
Peak Month March March March March March MarchPeak Month Originations on International Flights (e) 61,514 58,213 85,641 103,035 123,760 148,013
Sky Team (f) 38,489 35,144 39,000 52,307 70,440 92,710 Southwest - - - - - - Other (g) - 23,025 23,069 46,641 50,728 53,319 55,303
ADPM Originations on International Flights (h) 1,984 1,878 2,763 3,324 3,992 4,775 AWDPM Originations (i) 2,045 1,935 2,847 3,425 4,114 4,920
Sky Team 1,279 1,168 1,296 1,739 2,342 3,082 Southwest - - - - - - Other 765 767 1,550 1,686 1,772 1,838
Peak Hour Originations on International Flights (j) 456 432 635 764 917 1,097 Sky Team 331 303 336 450 606 798 Southwest - - - - - - Other 335 336 679 739 776 805
Peak Hour Terminations on International Flights (j) 603 571 840 1,010 1,214 1,451 Sky Team 374 341 379 508 684 900 Southwest - - - - - - Other 335 336 679 739 776 805
Peak Hour Terminations - Non Pre-Cleared (k) 462 467 690 840 1,029 1,238 Sky Team 307 279 311 422 579 767 Southwest - - - - - - Other 335 275 558 614 658 687
(a) Table 8. (b) International origination on international flight at MSP. Assumed to be 30 percent of international Sky Team enplanements. (c) International origination on international flight at MSP. Assumed to be 90 percent of international non-Sky Team enplanements. (d) Total annual originations less originations on international Sky Team and non-Sky Team flights. (e) Sum of Sky Team and other originations. (f) Assumed to be 30 percent of international Sky Team enplanements. (g) Assumed to be 90 percent of international non-Sky Team enplanements. (h) Average Day Peak Month. Peak month divided by 31 days. (i) Average Weekday Peak Month. ADPM increased by 3.5 percent to reflect increased weekday activity based on OAG schedule. (j) Peak hour percentage of AWDPM assumed to remain constant. (k) Non-precleared share of international terminations based on non-precleared share of international scheduled seat departures in Table F.7.
Sources: As noted and HNTB analysis.
Table H.4
MINNEAPOLIS-ST. PAUL INTERNATIONAL AIRPORT
Summary of International Peak Hour Origination/Termination Activity
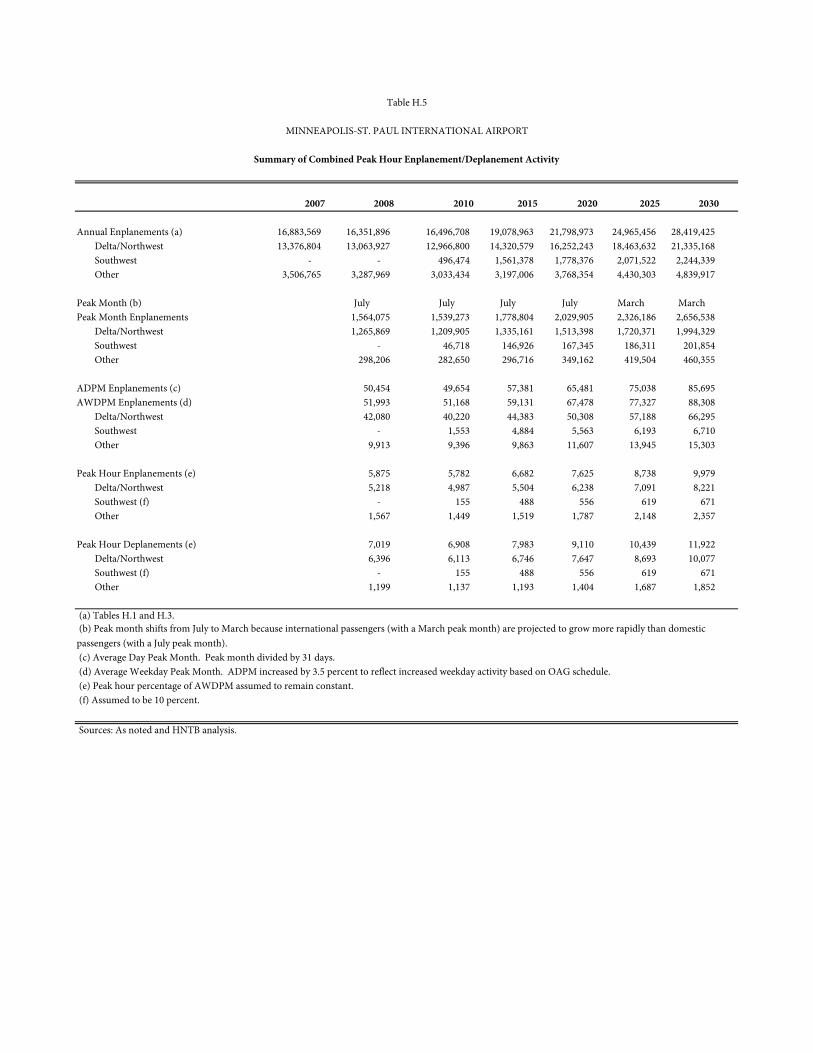
2007 2008 2010 2015 2020 2025 2030
Annual Enplanements (a) 16,883,569 16,351,896 16,496,708 19,078,963 21,798,973 24,965,456 28,419,425Delta/Northwest 13,376,804 13,063,927 12,966,800 14,320,579 16,252,243 18,463,632 21,335,168Southwest - - 496,474 1,561,378 1,778,376 2,071,522 2,244,339 Other 3,506,765 3,287,969 3,033,434 3,197,006 3,768,354 4,430,303 4,839,917
Peak Month (b) July July July July March MarchPeak Month Enplanements 1,564,075 1,539,273 1,778,804 2,029,905 2,326,186 2,656,538
Delta/Northwest 1,265,869 1,209,905 1,335,161 1,513,398 1,720,371 1,994,329 Southwest - 46,718 146,926 167,345 186,311 201,854 Other 298,206 282,650 296,716 349,162 419,504 460,355
ADPM Enplanements (c) 50,454 49,654 57,381 65,481 75,038 85,695 AWDPM Enplanements (d) 51,993 51,168 59,131 67,478 77,327 88,308
Delta/Northwest 42,080 40,220 44,383 50,308 57,188 66,295 Southwest - 1,553 4,884 5,563 6,193 6,710 Other 9,913 9,396 9,863 11,607 13,945 15,303
Peak Hour Enplanements (e) 5,875 5,782 6,682 7,625 8,738 9,979 Delta/Northwest 5,218 4,987 5,504 6,238 7,091 8,221 Southwest (f) - 155 488 556 619 671 Other 1,567 1,449 1,519 1,787 2,148 2,357
Peak Hour Deplanements (e) 7,019 6,908 7,983 9,110 10,439 11,922 Delta/Northwest 6,396 6,113 6,746 7,647 8,693 10,077 Southwest (f) - 155 488 556 619 671 Other 1,199 1,137 1,193 1,404 1,687 1,852
(a) Tables H.1 and H.3.
(c) Average Day Peak Month. Peak month divided by 31 days. (d) Average Weekday Peak Month. ADPM increased by 3.5 percent to reflect increased weekday activity based on OAG schedule. (e) Peak hour percentage of AWDPM assumed to remain constant. (f) Assumed to be 10 percent.
Sources: As noted and HNTB analysis.
(b) Peak month shifts from July to March because international passengers (with a March peak month) are projected to grow more rapidly than domestic passengers (with a July peak month).
Table H.5
MINNEAPOLIS-ST. PAUL INTERNATIONAL AIRPORT
Summary of Combined Peak Hour Enplanement/Deplanement Activity
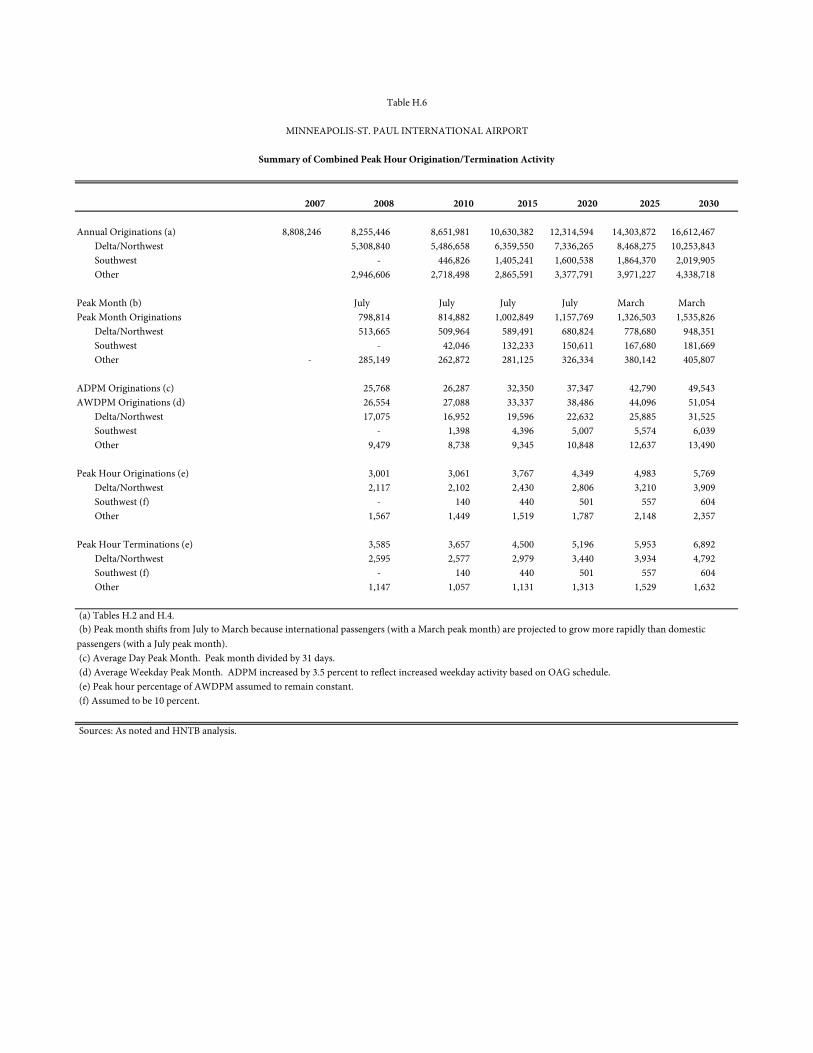
2007 2008 2010 2015 2020 2025 2030
Annual Originations (a) 8,808,246 8,255,446 8,651,981 10,630,382 12,314,594 14,303,872 16,612,467Delta/Northwest 5,308,840 5,486,658 6,359,550 7,336,265 8,468,275 10,253,843Southwest - 446,826 1,405,241 1,600,538 1,864,370 2,019,905 Other 2,946,606 2,718,498 2,865,591 3,377,791 3,971,227 4,338,718
Peak Month (b) July July July July March MarchPeak Month Originations 798,814 814,882 1,002,849 1,157,769 1,326,503 1,535,826
Delta/Northwest 513,665 509,964 589,491 680,824 778,680 948,351 Southwest - 42,046 132,233 150,611 167,680 181,669 Other - 285,149 262,872 281,125 326,334 380,142 405,807
ADPM Originations (c) 25,768 26,287 32,350 37,347 42,790 49,543 AWDPM Originations (d) 26,554 27,088 33,337 38,486 44,096 51,054
Delta/Northwest 17,075 16,952 19,596 22,632 25,885 31,525 Southwest - 1,398 4,396 5,007 5,574 6,039 Other 9,479 8,738 9,345 10,848 12,637 13,490
Peak Hour Originations (e) 3,001 3,061 3,767 4,349 4,983 5,769 Delta/Northwest 2,117 2,102 2,430 2,806 3,210 3,909 Southwest (f) - 140 440 501 557 604 Other 1,567 1,449 1,519 1,787 2,148 2,357
Peak Hour Terminations (e) 3,585 3,657 4,500 5,196 5,953 6,892 Delta/Northwest 2,595 2,577 2,979 3,440 3,934 4,792 Southwest (f) - 140 440 501 557 604 Other 1,147 1,057 1,131 1,313 1,529 1,632
(a) Tables H.2 and H.4.
(c) Average Day Peak Month. Peak month divided by 31 days. (d) Average Weekday Peak Month. ADPM increased by 3.5 percent to reflect increased weekday activity based on OAG schedule. (e) Peak hour percentage of AWDPM assumed to remain constant. (f) Assumed to be 10 percent.
Sources: As noted and HNTB analysis.
(b) Peak month shifts from July to March because international passengers (with a March peak month) are projected to grow more rapidly than domestic passengers (with a July peak month).
Table H.6
MINNEAPOLIS-ST. PAUL INTERNATIONAL AIRPORT
Summary of Combined Peak Hour Origination/Termination Activity
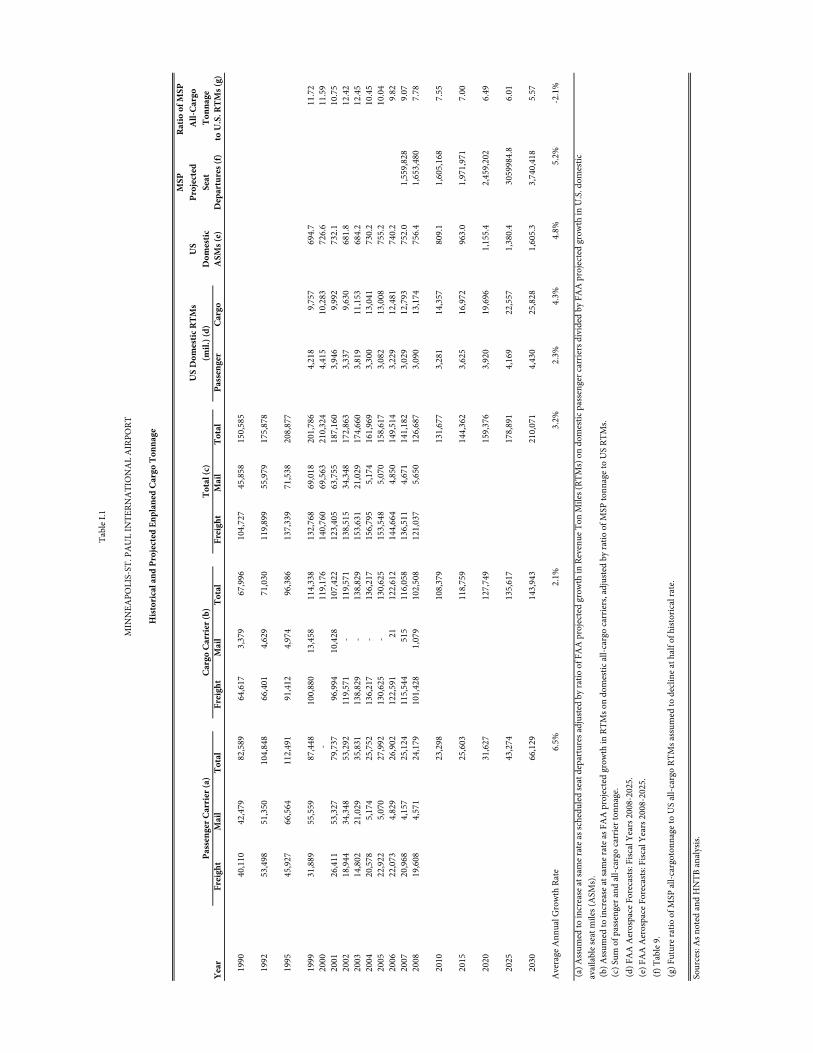
MSP
Ratio
of M
SP
US
Proj
ecte
dA
ll-Ca
rgo
Dom
estic
Seat
Tonn
age
Year
Frei
ght
Mai
lTo
tal
Frei
ght
Mai
lTo
tal
Frei
ght
Mai
lTo
tal
Pass
enge
rCa
rgo
ASM
s (e)
Dep
artu
res (
f)to
U.S
. RTM
s (g)
1990
40,1
10
42
,479
82
,589
64
,617
3,37
9
67,9
96
10
4,72
7
45,8
58
15
0,58
5
1992
53,4
98
51
,350
10
4,84
8
66
,401
4,62
9
71,0
30
11
9,89
9
55,9
79
17
5,87
8
1995
45,9
27
66
,564
11
2,49
1
91
,412
4,97
4
96,3
86
13
7,33
9
71,5
38
20
8,87
7
1999
31,8
89
55
,559
87
,448
10
0,88
0
13,4
58
11
4,33
8
132,
768
69
,018
201,
786
4,21
8
9,
757
69
4.7
11
.72
2000
-
119,
176
14
0,76
0
69,5
63
21
0,32
4
4,
415
10,2
83
72
6.6
11
.59
2001
26,4
11
53
,327
79
,737
96
,994
10,4
28
10
7,42
2
123,
405
63
,755
187,
160
3,94
6
9,
992
73
2.1
10
.75
2002
18,9
44
34
,348
53
,292
11
9,57
1
-
11
9,57
1
138,
515
34
,348
172,
863
3,33
7
9,
630
68
1.8
12
.42
2003
14,8
02
21
,029
35
,831
13
8,82
9
-
13
8,82
9
153,
631
21
,029
174,
660
3,81
9
11
,153
684.
2
12.4
5
20
0420
,578
5,17
4
25
,752
13
6,21
7
-
13
6,21
7
156,
795
5,
174
16
1,96
9
3,
300
13,0
41
73
0.2
10
.45
2005
22,9
22
5,
070
27,9
92
130,
625
-
130,
625
15
3,54
8
5,07
0
158,
617
3,08
2
13
,008
755.
2
10.0
4
20
0622
,073
4,82
9
26
,902
12
2,59
1
21
122,
612
14
4,66
4
4,85
0
149,
514
3,22
9
12
,481
740.
2
9.82
20
0720
,968
4,15
7
25
,124
11
5,54
4
515
116,
058
13
6,51
1
4,67
1
141,
182
3,02
9
12
,793
752.
0
1,55
9,82
8
9.07
20
0819
,608
4,57
1
24
,179
10
1,42
8
1,07
9
102,
508
12
1,03
7
5,65
0
126,
687
3,09
0
13
,174
756.
4
1,65
3,48
0
7.78
2010
23,2
98
108,
379
13
1,67
7
3,
281
14,3
57
80
9.1
1,
605,
168
7.
55
2015
25,6
03
118,
759
14
4,36
2
3,
625
16,9
72
96
3.0
1,
971,
971
7.
00
2020
31,6
27
127,
749
15
9,37
6
3,
920
19,6
96
1,
155.
4
2,
459,
202
6.
49
2025
43,2
74
135,
617
17
8,89
1
4,
169
22,5
57
1,
380.
4
30
5998
4.8
6.01
2030
66,1
29
143,
943
21
0,07
1
4,
430
25,8
28
1,
605.
3
3,
740,
418
5.
57
Ave
rage
Ann
ual G
row
th R
ate
6.5%
2.1%
3.2%
2.3%
4.3%
4.8%
5.2%
-2.1
%
(b) A
ssum
ed to
incr
ease
at sa
me r
ate a
s FA
A p
roje
cted
gro
wth
in R
TMs o
n do
mes
tic al
l-car
go ca
rrie
rs, a
djus
ted
by ra
tio o
f MSP
tonn
age t
o U
S RT
Ms.
(c) S
um o
f pas
seng
er an
d al
l-car
go ca
rrie
r ton
nage
. (d
) FA
A A
eros
pace
For
ecas
ts: F
iscal
Yea
rs 2
008-
2025
. (e
) FA
A A
eros
pace
For
ecas
ts: F
iscal
Yea
rs 2
008-
2025
.
(f) T
able
9.
(g) F
utur
e rat
io o
f MSP
all-c
argo
tonn
age t
o U
S al
l-car
go R
TMs a
ssum
ed to
dec
line a
t hal
f of h
istor
ical
rate
.
Sour
ces:
As n
oted
and
HN
TB an
alys
is.
(a) A
ssum
ed to
incr
ease
at sa
me r
ate a
s sch
edul
ed se
at d
epar
ture
s adj
uste
d by
ratio
of F
AA
pro
ject
ed g
row
th in
Rev
enue
Ton
Mile
s (RT
Ms)
on
dom
estic
pas
seng
er ca
rrie
rs d
ivid
ed b
y FA
A p
roje
cted
gro
wth
in U
.S. d
omes
tic
avai
labl
e sea
t mile
s (A
SMs)
.
Tabl
e I.1
MIN
NEA
POLI
S-ST
. PA
UL
INTE
RNA
TIO
NA
L A
IRPO
RT
Hist
oric
al a
nd P
roje
cted
Enp
lane
d Ca
rgo
Tonn
age
US
Dom
estic
RTM
sPa
ssen
ger C
arri
er (a
)Ca
rgo
Carr
ier (
b)To
tal (
c)(m
il.) (
d)
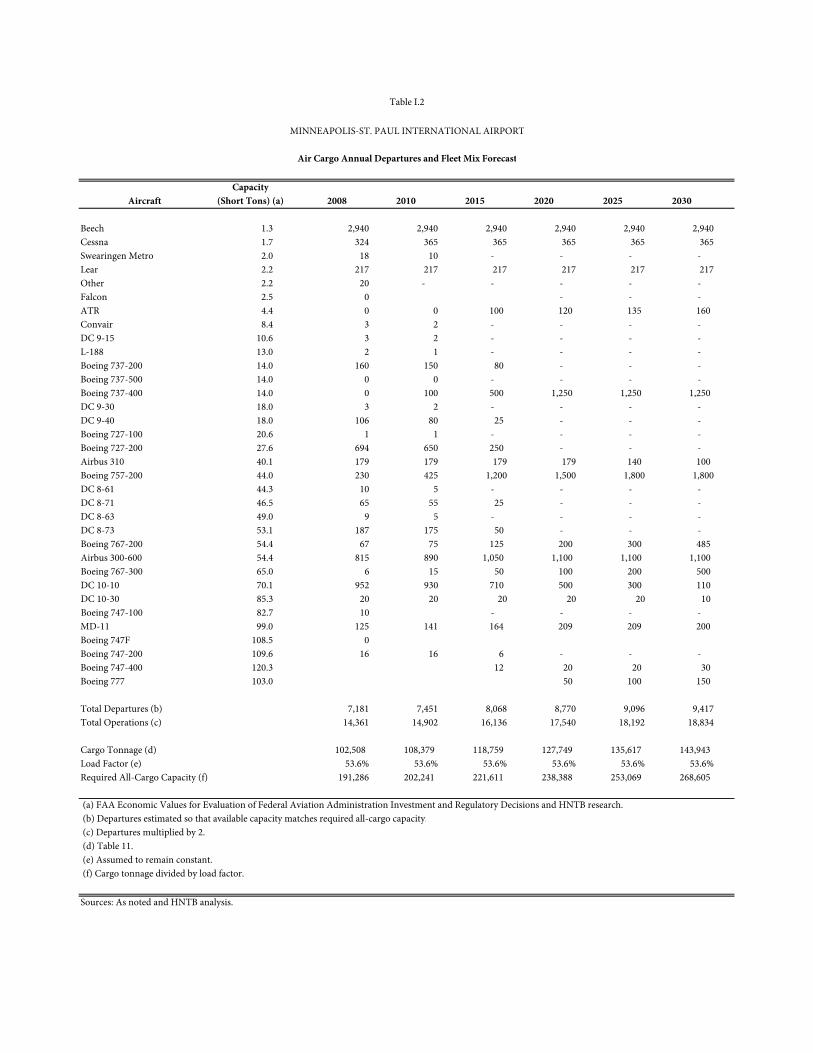
CapacityAircraft (Short Tons) (a) 2008 2010 2015 2020 2025 2030
Beech 1.3 2,940 2,940 2,940 2,940 2,940 2,940Cessna 1.7 324 365 365 365 365 365Swearingen Metro 2.0 18 10 - - - - Lear 2.2 217 217 217 217 217 217Other 2.2 20 - - - - - Falcon 2.5 0 - - - ATR 4.4 0 0 100 120 135 160 Convair 8.4 3 2 - - - - DC 9-15 10.6 3 2 - - - - L-188 13.0 2 1 - - - - Boeing 737-200 14.0 160 150 80 - - - Boeing 737-500 14.0 0 0 - - - - Boeing 737-400 14.0 0 100 500 1,250 1,250 1,250 DC 9-30 18.0 3 2 - - - - DC 9-40 18.0 106 80 25 - - - Boeing 727-100 20.6 1 1 - - - - Boeing 727-200 27.6 694 650 250 - - - Airbus 310 40.1 179 179 179 179 140 100 Boeing 757-200 44.0 230 425 1,200 1,500 1,800 1,800DC 8-61 44.3 10 5 - - - - DC 8-71 46.5 65 55 25 - - - DC 8-63 49.0 9 5 - - - - DC 8-73 53.1 187 175 50 - - - Boeing 767-200 54.4 67 75 125 200 300 485 Airbus 300-600 54.4 815 890 1,050 1,100 1,100 1,100 Boeing 767-300 65.0 6 15 50 100 200 500 DC 10-10 70.1 952 930 710 500 300 110 DC 10-30 85.3 20 20 20 20 20 10 Boeing 747-100 82.7 10 - - - - MD-11 99.0 125 141 164 209 209 200 Boeing 747F 108.5 0Boeing 747-200 109.6 16 16 6 - - - Boeing 747-400 120.3 12 20 20 30 Boeing 777 103.0 50 100 150
Total Departures (b) 7,181 7,451 8,068 8,770 9,096 9,417Total Operations (c) 14,361 14,902 16,136 17,540 18,192 18,834
Cargo Tonnage (d) 102,508 108,379 118,759 127,749 135,617 143,943 Load Factor (e) 53.6% 53.6% 53.6% 53.6% 53.6% 53.6%Required All-Cargo Capacity (f) 191,286 202,241 221,611 238,388 253,069 268,605
(a) FAA Economic Values for Evaluation of Federal Aviation Administration Investment and Regulatory Decisions and HNTB research. (b) Departures estimated so that available capacity matches required all-cargo capacity. (c) Departures multiplied by 2. (d) Table 11. (e) Assumed to remain constant. (f) Cargo tonnage divided by load factor.
Sources: As noted and HNTB analysis.
MINNEAPOLIS-ST. PAUL INTERNATIONAL AIRPORT
Table I.2
Air Cargo Annual Departures and Fleet Mix Forecast
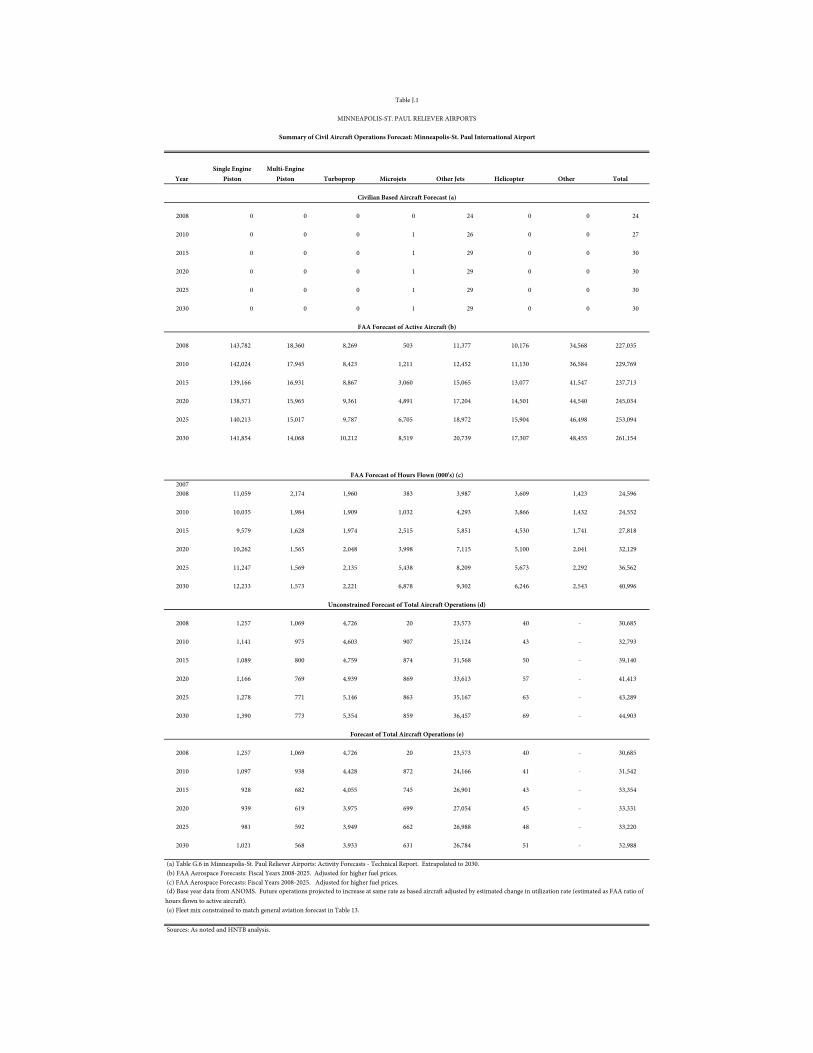
YearSingle Engine
PistonMulti-Engine
Piston Turboprop Microjets Other Jets Helicopter Other Total
2008 0 0 0 0 24 0 0 24
2010 0 0 0 1 26 0 0 27
2015 0 0 0 1 29 0 0 30
2020 0 0 0 1 29 0 0 30
2025 0 0 0 1 29 0 0 30
2030 0 0 0 1 29 0 0 30
2008 143,782 18,360 8,269 503 11,377 10,176 34,568 227,035
2010 142,024 17,945 8,423 1,211 12,452 11,130 36,584 229,769
2015 139,166 16,931 8,867 3,060 15,065 13,077 41,547 237,713
2020 138,571 15,965 9,361 4,891 17,204 14,501 44,540 245,034
2025 140,213 15,017 9,787 6,705 18,972 15,904 46,498 253,094
2030 141,854 14,068 10,212 8,519 20,739 17,307 48,455 261,154
20072008 11,059 2,174 1,960 383 3,987 3,609 1,423 24,596
2010 10,035 1,984 1,909 1,032 4,293 3,866 1,432 24,552
2015 9,579 1,628 1,974 2,515 5,851 4,530 1,741 27,818
2020 10,262 1,565 2,048 3,998 7,115 5,100 2,041 32,129
2025 11,247 1,569 2,135 5,438 8,209 5,673 2,292 36,562
2030 12,233 1,573 2,221 6,878 9,302 6,246 2,543 40,996
2008 1,257 1,069 4,726 20 23,573 40 - 30,685
2010 1,141 975 4,603 907 25,124 43 - 32,793
2015 1,089 800 4,759 874 31,568 50 - 39,140
2020 1,166 769 4,939 869 33,613 57 - 41,413
2025 1,278 771 5,146 863 35,167 63 - 43,289
2030 1,390 773 5,354 859 36,457 69 - 44,903
2008 1,257 1,069 4,726 20 23,573 40 - 30,685
2010 1,097 938 4,428 872 24,166 41 - 31,542
2015 928 682 4,055 745 26,901 43 - 33,354
2020 939 619 3,975 699 27,054 45 - 33,331
2025 981 592 3,949 662 26,988 48 - 33,220
2030 1,021 568 3,933 631 26,784 51 - 32,988
(a) Table G.6 in Minneapolis-St. Paul Reliever Airports: Activity Forecasts - Technical Report. Extrapolated to 2030. (b) FAA Aerospace Forecasts: Fiscal Years 2008-2025. Adjusted for higher fuel prices. (c) FAA Aerospace Forecasts: Fiscal Years 2008-2025. Adjusted for higher fuel prices.
(e) Fleet mix constrained to match general aviation forecast in Table 13.
Sources: As noted and HNTB analysis.
(d) Base year data from ANOMS. Future operations projected to increase at same rate as based aircraft adjusted by estimated change in utilization rate (estimated as FAA ratio of hours flown to active aircraft).
Table J.1
MINNEAPOLIS-ST. PAUL RELIEVER AIRPORTS
Summary of Civil Aircraft Operations Forecast: Minneapolis-St. Paul International Airport
Civilian Based Aircraft Forecast (a)
FAA Forecast of Active Aircraft (b)
FAA Forecast of Hours Flown (000's) (c)
Unconstrained Forecast of Total Aircraft Operations (d)
Forecast of Total Aircraft Operations (e)

2007 2008 2010 2015 2020 2025 2030
EnplanementsDomestic Scheduled Air Carrier 15,903,109 15,087,389 15,316,308 17,606,511 19,962,423 22,675,048 25,579,956International Scheduled Air Carrier 980,460 1,264,507 1,180,400 1,472,452 1,836,550 2,290,408 2,839,469
Subtotal Scheduled 16,883,569 16,351,896 16,496,708 19,078,963 21,798,973 24,965,456 28,419,425Domestic Charter 41,874 16,990 15,574 12,527 10,077 8,106 6,520 International Charter 43,641 15,386 14,103 11,345 9,126 7,341 5,905
Subtotal charter 85,515 32,376 29,677 23,872 19,203 15,447 12,425 Total 16,969,084 16,384,272 16,526,385 19,102,835 21,818,176 24,980,903 28,431,850
OriginationsDomestic Scheduled Air Carrier 7,857,050 7,291,815 7,692,173 9,420,211 10,788,756 12,380,025 14,186,792International Scheduled Air Carrier 951,196 963,631 959,808 1,210,171 1,525,839 1,923,847 2,425,675
Subtotal Scheduled 8,808,246 8,255,446 8,651,981 10,630,382 12,314,594 14,303,872 16,612,467Domestic Charter 41,874 16,990 15,574 12,527 10,077 8,106 6,520 International Charter 43,641 15,386 14,103 11,345 9,126 7,341 5,905
Subtotal charter 85,515 32,376 29,677 23,872 19,203 15,447 12,425 Total 8,893,761 8,287,822 8,681,658 10,654,254 12,333,797 14,319,319 16,624,892
Air Cargo TonnageEnplaned 141,182 126,687 131,677 144,362 159,376 178,891 210,071 Deplaned 142,595 130,430 134,073 146,998 162,780 183,853 218,146 Total 283,777 257,116 265,750 291,360 322,156 362,745 428,217
Aircraft OperationsDomestic Scheduled Air Carrier 388,508 378,273 386,666 426,862 461,076 499,216 529,608 International Scheduled Air Carrier 14,889 24,074 23,714 28,762 32,522 39,830 47,074 Charter 1,432 536 542 440 352 276 218 All-Cargo Carrier 15,292 14,361 14,902 16,136 17,540 18,192 18,834 General Aviation and Air Taxi 30,562 30,685 31,542 33,354 33,331 33,220 32,988 Military 2,289 2,115 2,115 2,115 2,115 2,115 2,115 Total 452,972 450,044 459,481 507,669 546,936 592,849 630,837
Sources: Tables 11, 15, and 16.
Table K.1
MINNEAPOLIS-ST. PAUL INTERNATIONAL AIRPORT
Scenario Summary: Base Case

2007 2008 2010 2015 2020 2025 2030
EnplanementsDomestic Scheduled Air Carrier 15,903,109 15,087,389 14,852,723 15,250,951 16,411,201 17,680,156 19,085,801International Scheduled Air Carrier 980,460 1,264,507 1,157,249 1,376,725 1,637,635 1,947,760 2,302,863
Subtotal Scheduled 16,883,569 16,351,896 16,009,972 16,627,676 18,048,836 19,627,916 21,388,664Domestic Charter 41,874 16,990 15,574 12,527 10,077 8,106 6,520 International Charter 43,641 15,386 14,103 11,345 9,126 7,341 5,905
Subtotal charter 85,515 32,376 29,677 23,872 19,203 15,447 12,425 Total 16,969,084 16,384,272 16,039,649 16,651,548 18,068,039 19,643,363 21,401,089
OriginationsDomestic Scheduled Air Carrier 7,857,050 7,291,815 7,692,173 8,748,659 9,901,029 11,215,730 12,727,850International Scheduled Air Carrier 951,196 963,631 940,984 1,131,495 1,360,576 1,636,037 1,967,268
Subtotal Scheduled 8,808,246 8,255,446 8,633,157 9,880,154 11,261,605 12,851,768 14,695,118Domestic Charter 41,874 16,990 15,574 12,527 10,077 8,106 6,520 International Charter 43,641 15,386 14,103 11,345 9,126 7,341 5,905
Subtotal charter 85,515 32,376 29,677 23,872 19,203 15,447 12,425 Total 8,893,761 8,287,822 8,662,834 9,904,026 11,280,808 12,867,215 14,707,543
Air Cargo TonnageEnplaned 141,182 126,687 131,390 134,174 145,748 160,731 185,826 Deplaned 142,595 130,430 133,781 136,624 148,861 165,189 192,968 Total 283,777 257,116 265,172 270,798 294,609 325,919 378,794
Aircraft OperationsDomestic Scheduled Air Carrier 388,508 378,273 374,963 375,958 393,342 411,204 428,506 International Scheduled Air Carrier 14,889 24,074 23,249 26,892 29,000 33,871 38,178 Charter 1,432 536 542 440 352 276 218 All-Cargo Carrier 15,292 14,361 14,870 14,997 16,040 16,345 16,660 General Aviation and Air Taxi 30,562 30,685 28,203 29,041 28,607 28,540 28,365 Military 2,289 2,115 2,115 2,115 2,115 2,115 2,115 Total 452,972 450,044 443,941 449,443 469,455 492,352 514,042
Source: HNTB analysis.
Table K.2
MINNEAPOLIS-ST. PAUL INTERNATIONAL AIRPORT
Scenario 1 Summary: High Fuel Cost

2007 2008 2010 2015 2020 2025 2030
EnplanementsDomestic Scheduled Air Carrier 15,903,109 15,087,389 15,316,308 18,348,115 21,041,004 24,199,108 27,772,520International Scheduled Air Carrier 980,460 1,264,507 1,198,345 1,549,304 2,002,816 2,588,772 3,326,296
Subtotal Scheduled 16,883,569 16,351,896 16,514,653 19,897,418 23,043,820 26,787,880 31,098,816Domestic Charter 41,874 16,990 15,574 12,527 10,077 8,106 6,520 International Charter 43,641 15,386 14,103 11,345 9,126 7,341 5,905
Subtotal charter 85,515 32,376 29,677 23,872 19,203 15,447 12,425 Total 16,969,084 16,384,272 16,544,330 19,921,290 23,063,023 26,803,327 31,111,241
OriginationsDomestic Scheduled Air Carrier 7,857,050 7,291,815 7,692,173 9,817,000 11,371,678 13,212,124 15,402,800International Scheduled Air Carrier 951,196 963,631 974,400 1,273,333 1,663,975 2,174,461 2,841,557
Subtotal Scheduled 8,808,246 8,255,446 8,666,573 11,090,333 13,035,653 15,386,585 18,244,357Domestic Charter 41,874 16,990 15,574 12,527 10,077 8,106 6,520 International Charter 43,641 15,386 14,103 11,345 9,126 7,341 5,905
Subtotal charter 85,515 32,376 29,677 23,872 19,203 15,447 12,425 Total 8,893,761 8,287,822 8,696,250 11,114,205 13,054,856 15,402,032 18,256,782
Air Cargo TonnageEnplaned 141,182 126,687 131,899 150,608 168,708 192,432 230,707 Deplaned 142,595 130,430 134,299 153,358 172,311 197,770 239,575 Total 283,777 257,116 266,198 303,967 341,019 390,202 470,282
Aircraft OperationsDomestic Scheduled Air Carrier 388,508 378,273 386,666 444,842 485,988 532,770 575,003 International Scheduled Air Carrier 14,889 24,074 24,075 30,263 35,466 45,019 55,145 Charter 1,432 536 542 440 352 276 218 All-Cargo Carrier 15,292 14,361 14,927 16,834 18,567 19,569 20,684 General Aviation and Air Taxi 30,562 30,685 35,614 39,519 41,437 43,427 44,650 Military 2,289 2,115 2,115 2,115 2,115 2,115 2,115 Total 452,972 450,044 463,938 534,013 583,925 643,175 697,815
Source: HNTB analysis.
Table K.3
MINNEAPOLIS-ST. PAUL INTERNATIONAL AIRPORT
Scenario 3 Summary: Low Fuel Cost
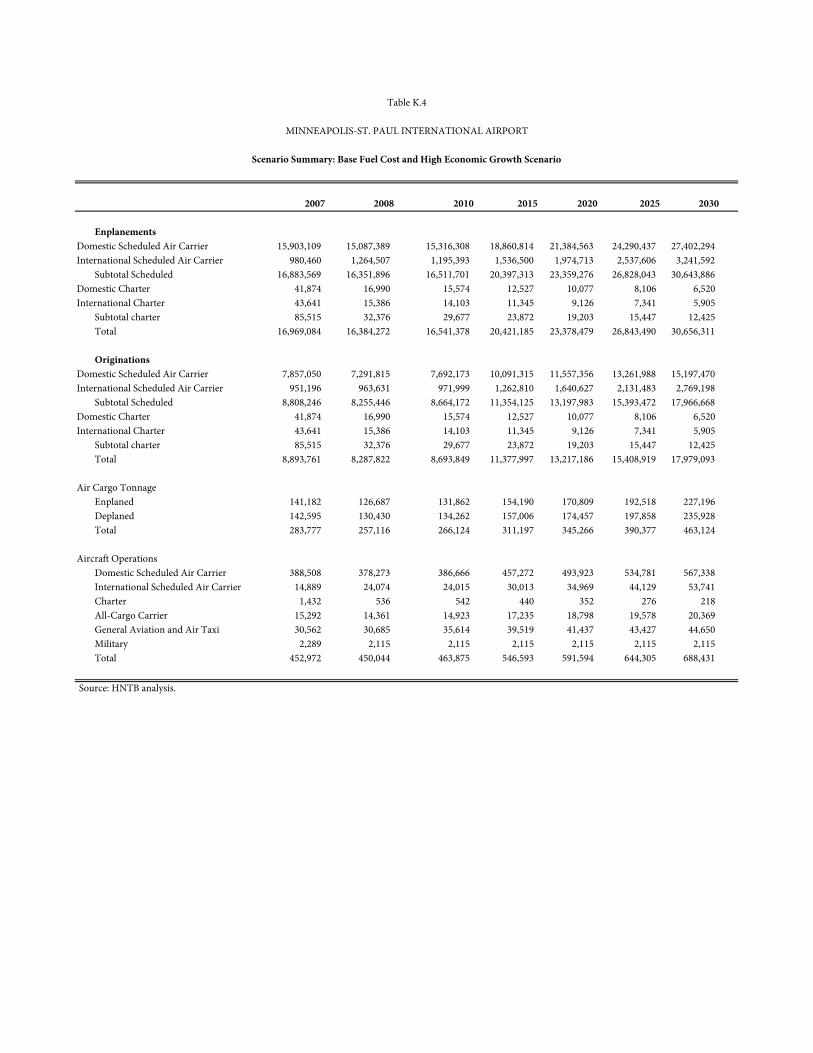
2007 2008 2010 2015 2020 2025 2030
EnplanementsDomestic Scheduled Air Carrier 15,903,109 15,087,389 15,316,308 18,860,814 21,384,563 24,290,437 27,402,294International Scheduled Air Carrier 980,460 1,264,507 1,195,393 1,536,500 1,974,713 2,537,606 3,241,592
Subtotal Scheduled 16,883,569 16,351,896 16,511,701 20,397,313 23,359,276 26,828,043 30,643,886Domestic Charter 41,874 16,990 15,574 12,527 10,077 8,106 6,520 International Charter 43,641 15,386 14,103 11,345 9,126 7,341 5,905
Subtotal charter 85,515 32,376 29,677 23,872 19,203 15,447 12,425 Total 16,969,084 16,384,272 16,541,378 20,421,185 23,378,479 26,843,490 30,656,311
OriginationsDomestic Scheduled Air Carrier 7,857,050 7,291,815 7,692,173 10,091,315 11,557,356 13,261,988 15,197,470International Scheduled Air Carrier 951,196 963,631 971,999 1,262,810 1,640,627 2,131,483 2,769,198
Subtotal Scheduled 8,808,246 8,255,446 8,664,172 11,354,125 13,197,983 15,393,472 17,966,668Domestic Charter 41,874 16,990 15,574 12,527 10,077 8,106 6,520 International Charter 43,641 15,386 14,103 11,345 9,126 7,341 5,905
Subtotal charter 85,515 32,376 29,677 23,872 19,203 15,447 12,425 Total 8,893,761 8,287,822 8,693,849 11,377,997 13,217,186 15,408,919 17,979,093
Air Cargo TonnageEnplaned 141,182 126,687 131,862 154,190 170,809 192,518 227,196 Deplaned 142,595 130,430 134,262 157,006 174,457 197,858 235,928 Total 283,777 257,116 266,124 311,197 345,266 390,377 463,124
Aircraft OperationsDomestic Scheduled Air Carrier 388,508 378,273 386,666 457,272 493,923 534,781 567,338 International Scheduled Air Carrier 14,889 24,074 24,015 30,013 34,969 44,129 53,741 Charter 1,432 536 542 440 352 276 218 All-Cargo Carrier 15,292 14,361 14,923 17,235 18,798 19,578 20,369 General Aviation and Air Taxi 30,562 30,685 35,614 39,519 41,437 43,427 44,650 Military 2,289 2,115 2,115 2,115 2,115 2,115 2,115 Total 452,972 450,044 463,875 546,593 591,594 644,305 688,431
Source: HNTB analysis.
Table K.4
MINNEAPOLIS-ST. PAUL INTERNATIONAL AIRPORT
Scenario Summary: Base Fuel Cost and High Economic Growth Scenario

2007 2008 2010 2015 2020 2025 2030
EnplanementsDomestic Scheduled Air Carrier 15,903,109 15,087,389 14,852,723 16,421,623 17,882,631 19,515,517 21,273,529International Scheduled Air Carrier 980,460 1,264,507 1,192,366 1,423,496 1,699,429 2,028,848 2,422,123
Subtotal Scheduled 16,883,569 16,351,896 16,045,089 17,845,120 19,582,059 21,544,366 23,695,652Domestic Charter 41,874 16,990 15,574 12,527 10,077 8,106 6,520 International Charter 43,641 15,386 14,103 11,345 9,126 7,341 5,905
Subtotal charter 85,515 32,376 29,677 23,872 19,203 15,447 12,425 Total 16,969,084 16,384,272 16,074,766 17,868,992 19,601,262 21,559,813 23,708,077
OriginationsDomestic Scheduled Air Carrier 7,857,050 7,291,815 7,692,173 9,420,211 10,788,756 12,380,025 14,186,792International Scheduled Air Carrier 951,196 963,631 959,808 1,210,171 1,525,839 1,923,847 2,425,675
Subtotal Scheduled 8,808,246 8,255,446 8,651,981 10,630,382 12,314,594 14,303,872 16,612,467Domestic Charter 41,874 16,990 15,574 12,527 10,077 8,106 6,520 International Charter 43,641 15,386 14,103 11,345 9,126 7,341 5,905
Subtotal charter 85,515 32,376 29,677 23,872 19,203 15,447 12,425 Total 8,893,761 8,287,822 8,681,658 10,654,254 12,333,797 14,319,319 16,624,892
Air Cargo TonnageEnplaned 141,182 126,687 131,677 144,362 159,376 178,891 210,071 Deplaned 142,595 130,430 134,073 146,998 162,780 183,853 218,146 Total 283,777 257,116 265,750 291,360 322,156 362,745 428,217
Aircraft OperationsDomestic Scheduled Air Carrier 388,508 378,273 374,963 404,817 428,609 453,891 477,624 International Scheduled Air Carrier 14,889 24,074 23,954 27,806 30,094 35,282 40,155 Charter 1,432 536 542 440 352 276 218 All-Cargo Carrier 15,292 14,361 14,902 16,136 17,540 18,192 18,834 General Aviation and Air Taxi 30,562 30,685 31,542 33,354 33,331 33,220 32,988 Military 2,289 2,115 2,115 2,115 2,115 2,115 2,115 Total 452,972 450,044 448,018 484,668 512,041 542,975 571,934
Source: HNTB analysis.
Table K.5
MINNEAPOLIS-ST. PAUL INTERNATIONAL AIRPORT
Scenario Summary: Base Fuel Cost and Declining Connecting Ratio
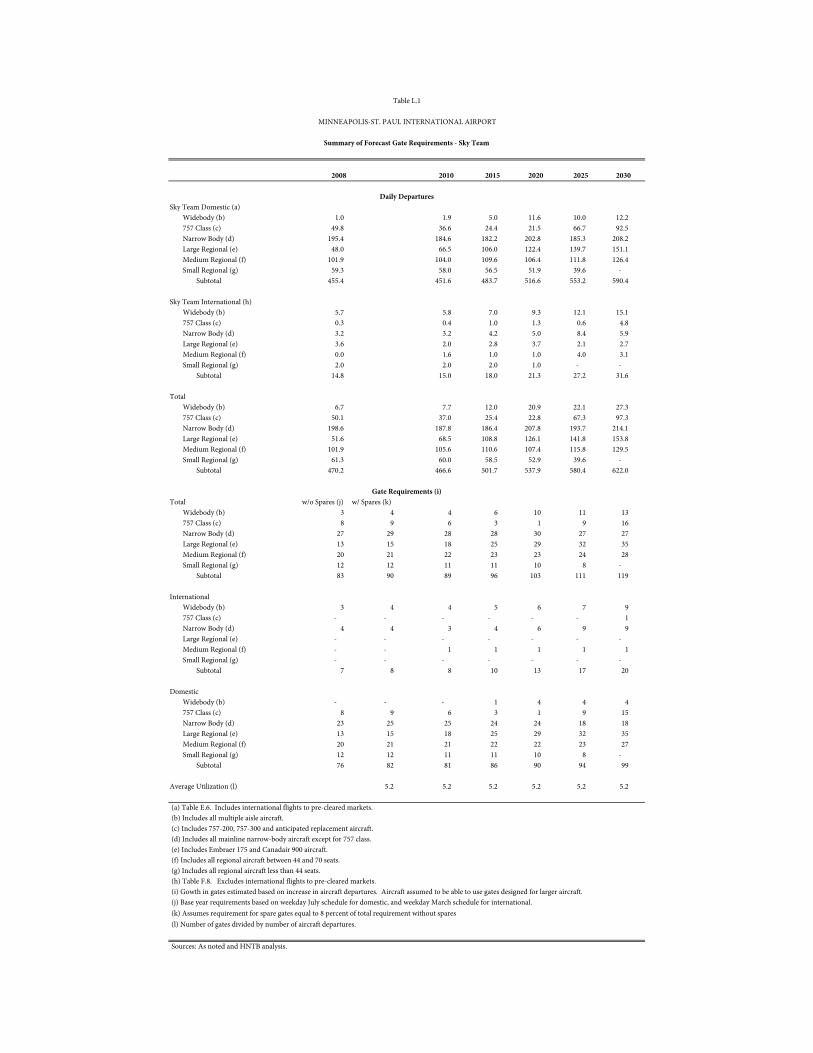
2008 2010 2015 2020 2025 2030
Sky Team Domestic (a)Widebody (b) 1.0 1.9 5.0 11.6 10.0 12.2 757 Class (c) 49.8 36.6 24.4 21.5 66.7 92.5 Narrow Body (d) 195.4 184.6 182.2 202.8 185.3 208.2 Large Regional (e) 48.0 66.5 106.0 122.4 139.7 151.1 Medium Regional (f) 101.9 104.0 109.6 106.4 111.8 126.4 Small Regional (g) 59.3 58.0 56.5 51.9 39.6 -
Subtotal 455.4 451.6 483.7 516.6 553.2 590.4
Sky Team International (h)Widebody (b) 5.7 5.8 7.0 9.3 12.1 15.1 757 Class (c) 0.3 0.4 1.0 1.3 0.6 4.8 Narrow Body (d) 3.2 3.2 4.2 5.0 8.4 5.9 Large Regional (e) 3.6 2.0 2.8 3.7 2.1 2.7 Medium Regional (f) 0.0 1.6 1.0 1.0 4.0 3.1 Small Regional (g) 2.0 2.0 2.0 1.0 - -
Subtotal 14.8 15.0 18.0 21.3 27.2 31.6
TotalWidebody (b) 6.7 7.7 12.0 20.9 22.1 27.3 757 Class (c) 50.1 37.0 25.4 22.8 67.3 97.3 Narrow Body (d) 198.6 187.8 186.4 207.8 193.7 214.1 Large Regional (e) 51.6 68.5 108.8 126.1 141.8 153.8 Medium Regional (f) 101.9 105.6 110.6 107.4 115.8 129.5 Small Regional (g) 61.3 60.0 58.5 52.9 39.6 -
Subtotal 470.2 466.6 501.7 537.9 580.4 622.0
Total w/o Spares (j) w/ Spares (k)Widebody (b) 3 4 4 6 10 11 13 757 Class (c) 8 9 6 3 1 9 16 Narrow Body (d) 27 29 28 28 30 27 27 Large Regional (e) 13 15 18 25 29 32 35 Medium Regional (f) 20 21 22 23 23 24 28 Small Regional (g) 12 12 11 11 10 8 -
Subtotal 83 90 89 96 103 111 119
InternationalWidebody (b) 3 4 4 5 6 7 9 757 Class (c) - - - - - - 1 Narrow Body (d) 4 4 3 4 6 9 9 Large Regional (e) - - - - - - - Medium Regional (f) - - 1 1 1 1 1 Small Regional (g) - - - - - - -
Subtotal 7 8 8 10 13 17 20
DomesticWidebody (b) - - - 1 4 4 4 757 Class (c) 8 9 6 3 1 9 15 Narrow Body (d) 23 25 25 24 24 18 18 Large Regional (e) 13 15 18 25 29 32 35 Medium Regional (f) 20 21 21 22 22 23 27 Small Regional (g) 12 12 11 11 10 8 -
Subtotal 76 82 81 86 90 94 99
Average Utilization (l) 5.2 5.2 5.2 5.2 5.2 5.2
(a) Table E.6. Includes international flights to pre-cleared markets. (b) Includes all multiple aisle aircraft. (c) Includes 757-200, 757-300 and anticipated replacement aircraft. (d) Includes all mainline narrow-body aircraft except for 757 class. (e) Includes Embraer 175 and Canadair 900 aircraft. (f) Includes all regional aircraft between 44 and 70 seats. (g) Includes all regional aircraft less than 44 seats. (h) Table F.8. Excludes international flights to pre-cleared markets. (i) Gowth in gates estimated based on increase in aircraft departures. Aircraft assumed to be able to use gates designed for larger aircraft. (j) Base year requirements based on weekday July schedule for domestic, and weekday March schedule for international.
(l) Number of gates divided by number of aircraft departures.
Sources: As noted and HNTB analysis.
Table L.1
MINNEAPOLIS-ST. PAUL INTERNATIONAL AIRPORT
Summary of Forecast Gate Requirements - Sky Team
(k) Assumes requirement for spare gates equal to 8 percent of total requirement without spares
Daily Departures
Gate Requirements (i)
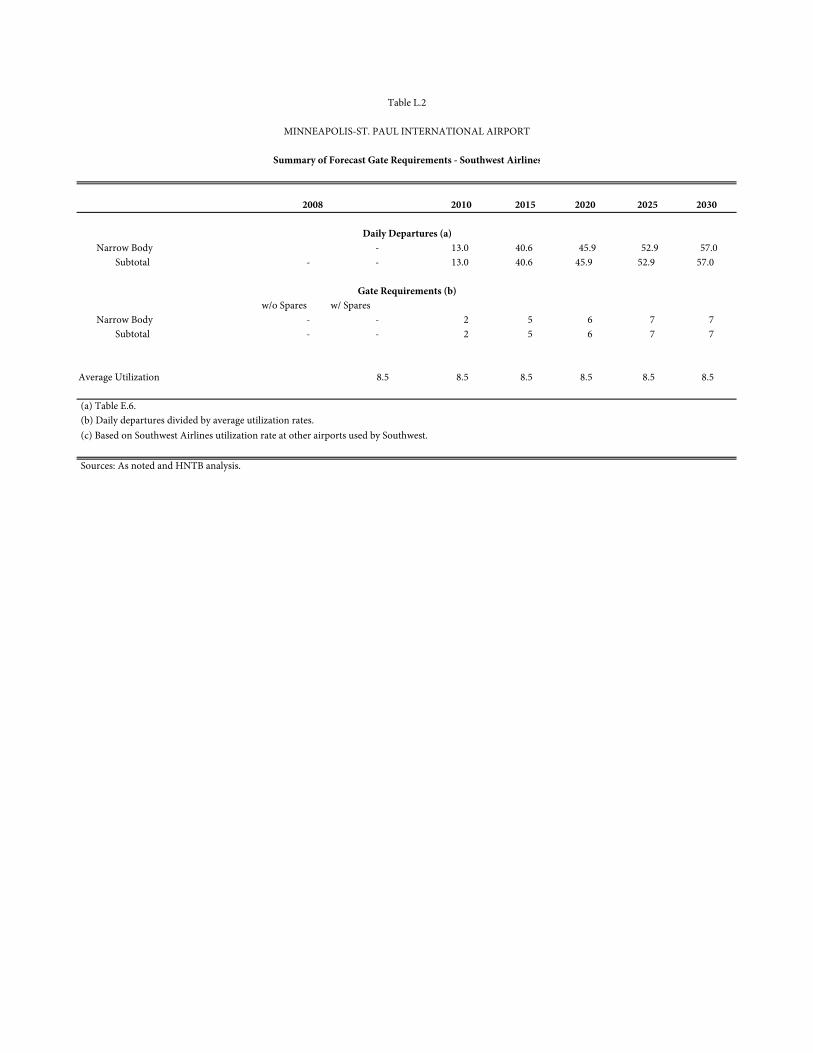
2008 2010 2015 2020 2025 2030
Narrow Body - 13.0 40.6 45.9 52.9 57.0Subtotal - - 13.0 40.6 45.9 52.9 57.0
w/o Spares w/ SparesNarrow Body - - 2 5 6 7 7
Subtotal - - 2 5 6 7 7
Average Utilization 8.5 8.5 8.5 8.5 8.5 8.5
(a) Table E.6. (b) Daily departures divided by average utilization rates.
Sources: As noted and HNTB analysis.
Table L.2
MINNEAPOLIS-ST. PAUL INTERNATIONAL AIRPORT
Summary of Forecast Gate Requirements - Southwest Airlines
(c) Based on Southwest Airlines utilization rate at other airports used by Southwest.
Daily Departures (a)
Gate Requirements (b)
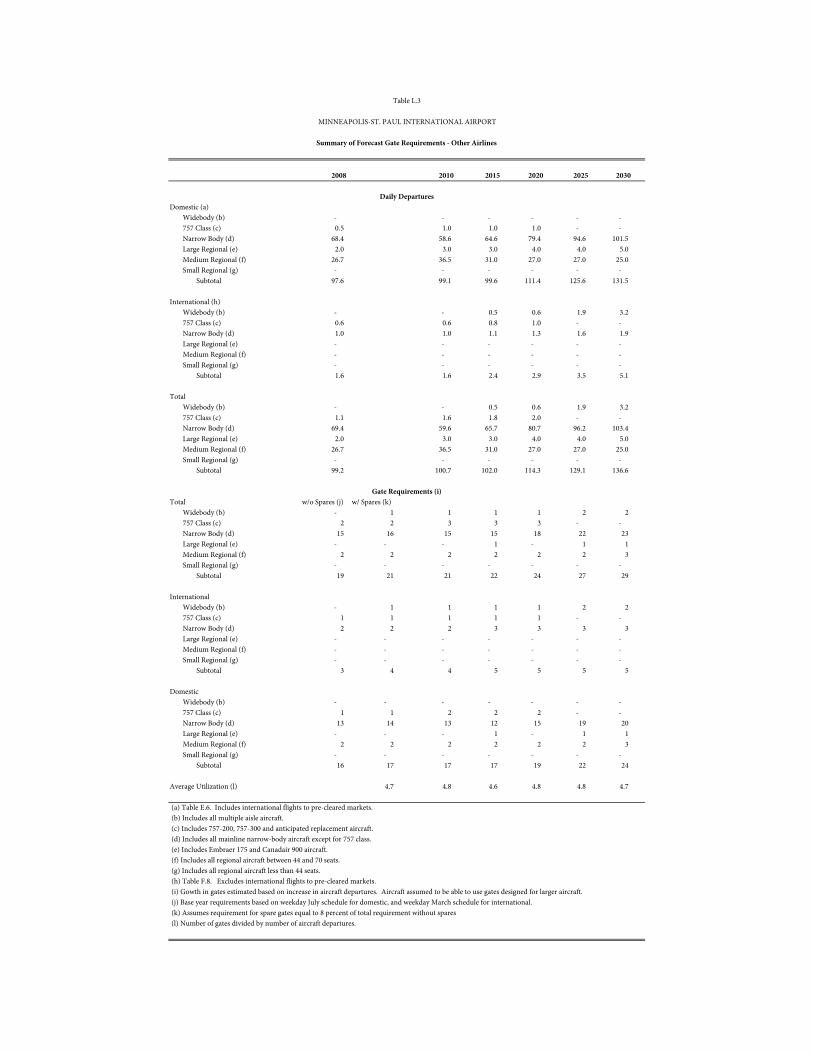
2008 2010 2015 2020 2025 2030
Domestic (a)Widebody (b) - - - - - - 757 Class (c) 0.5 1.0 1.0 1.0 - - Narrow Body (d) 68.4 58.6 64.6 79.4 94.6 101.5 Large Regional (e) 2.0 3.0 3.0 4.0 4.0 5.0 Medium Regional (f) 26.7 36.5 31.0 27.0 27.0 25.0 Small Regional (g) - - - - - -
Subtotal 97.6 99.1 99.6 111.4 125.6 131.5
International (h)Widebody (b) - - 0.5 0.6 1.9 3.2 757 Class (c) 0.6 0.6 0.8 1.0 - - Narrow Body (d) 1.0 1.0 1.1 1.3 1.6 1.9 Large Regional (e) - - - - - - Medium Regional (f) - - - - - - Small Regional (g) - - - - - -
Subtotal 1.6 1.6 2.4 2.9 3.5 5.1
TotalWidebody (b) - - 0.5 0.6 1.9 3.2 757 Class (c) 1.1 1.6 1.8 2.0 - - Narrow Body (d) 69.4 59.6 65.7 80.7 96.2 103.4 Large Regional (e) 2.0 3.0 3.0 4.0 4.0 5.0 Medium Regional (f) 26.7 36.5 31.0 27.0 27.0 25.0 Small Regional (g) - - - - - -
Subtotal 99.2 100.7 102.0 114.3 129.1 136.6
Total w/o Spares (j) w/ Spares (k)Widebody (b) - 1 1 1 1 2 2 757 Class (c) 2 2 3 3 3 - - Narrow Body (d) 15 16 15 15 18 22 23 Large Regional (e) - - - 1 - 1 1 Medium Regional (f) 2 2 2 2 2 2 3 Small Regional (g) - - - - - - -
Subtotal 19 21 21 22 24 27 29
InternationalWidebody (b) - 1 1 1 1 2 2 757 Class (c) 1 1 1 1 1 - - Narrow Body (d) 2 2 2 3 3 3 3 Large Regional (e) - - - - - - - Medium Regional (f) - - - - - - - Small Regional (g) - - - - - - -
Subtotal 3 4 4 5 5 5 5
DomesticWidebody (b) - - - - - - - 757 Class (c) 1 1 2 2 2 - - Narrow Body (d) 13 14 13 12 15 19 20 Large Regional (e) - - - 1 - 1 1 Medium Regional (f) 2 2 2 2 2 2 3 Small Regional (g) - - - - - - -
Subtotal 16 17 17 17 19 22 24
Average Utilization (l) 4.7 4.8 4.6 4.8 4.8 4.7
(a) Table E.6. Includes international flights to pre-cleared markets. (b) Includes all multiple aisle aircraft. (c) Includes 757-200, 757-300 and anticipated replacement aircraft. (d) Includes all mainline narrow-body aircraft except for 757 class. (e) Includes Embraer 175 and Canadair 900 aircraft. (f) Includes all regional aircraft between 44 and 70 seats. (g) Includes all regional aircraft less than 44 seats. (h) Table F.8. Excludes international flights to pre-cleared markets. (i) Gowth in gates estimated based on increase in aircraft departures. Aircraft assumed to be able to use gates designed for larger aircraft. (j) Base year requirements based on weekday July schedule for domestic, and weekday March schedule for international.
(l) Number of gates divided by number of aircraft departures. (k) Assumes requirement for spare gates equal to 8 percent of total requirement without spares
Table L.3
MINNEAPOLIS-ST. PAUL INTERNATIONAL AIRPORT
Summary of Forecast Gate Requirements - Other Airlines
Daily Departures
Gate Requirements (i)


