Embed Size (px)
Citation preview

Special Assistance for Project Implementation (SAPI)for Borg El Arab International Airport Modernization Project
- Final Report -
Chapter 4
Air Traffic Demand Forecast
Table of Contents
4.1 Review of SAPROF Study ................................................................................................... 4-1
4.1.1 Procedure of Air Traffic Demand Forecast applied in SAPROF ................................ 4-1
4.1.2 Comparison between the Forecast in SAPROF Study with the actual Traffic ............ 4-2
4.1.3 Comparative Analysis between SAPROF and Present ............................................... 4-4
4.1.4 Principal Conclusion ................................................................................................... 4-7
4.2 Forecasting Parameters ....................................................................................................... 4-8
4.2.1 Air Traffic in Egypt ..................................................................................................... 4-8
4.2.2 Origin & Destination / Nationality of Air Passenger ................................................ 4-13
4.2.3 Trend of Scheduled Flights in Alexandria ................................................................. 4-16
4.2.4 Passenger Survey at Borg El Arab International Airport .......................................... 4-20
4.2.5 Socio-Economic Indices ........................................................................................... 4-29
4.3 Annual Passenger Demand Forecast ................................................................................ 4-31
4.3.1 Procedure of Air Traffic Demand Forecast ............................................................... 4-31
4.3.2 Top-down Analysis ................................................................................................... 4-32
4.3.3 Bottom-up Analysis .................................................................................................. 4-40
4.3.4 Cross-examination .................................................................................................... 4-54
4.4 Annual Air Cargo Demand Forecast ................................................................................ 4-57
4.4.1 Procedure of Air Cargo Demand Forecast ................................................................ 4-57
4.2.2 Current Situation of Air Cargo in Alexandria and outskirts ...................................... 4-57
4.4.3 Air Cargo Forecast .................................................................................................... 4-58

Special Assistance for Project Implementation (SAPI)for Borg El Arab International Airport Modernization Project
- Final Report -
4.5 Annual Aircraft Movement Forecast ................................................................................ 4-60
4.5.1 Passenger Aircraft Movements .................................................................................. 4-60
4.5.2 Cargo Aircraft Movements ........................................................................................ 4-64
4.6 Peak Air Traffic Demand Forecast ................................................................................... 4-65
4.6.1 Peak-day Air Traffic Demand Forecast ..................................................................... 4-65
4.6.2 Peak-hour Air Traffic Demand Forecast .................................................................... 4-67
4.7 Summary of Air Traffic Demand Forecast ....................................................................... 4-69
4.8 Principal Conclusion .......................................................................................................... 4-72
4.8.1 Forecasting Parameter ............................................................................................... 4-72
4.8.2 Air Passenger Demand Forecast ................................................................................ 4-72
4.8.3 Air Cargo Demand Forecast ...................................................................................... 4-73
4.8.4 Aircraft Movement Forecast ...................................................................................... 4-74
4.8.5 Peak Air Traffic Forecast ........................................................................................... 4-74

Special Assistance for Project Implementation (SAPI) for Borg El Arab International Airport Modernization Project
Chapter 4 Air Traffic Demand Forecast - Final Report -
4-1
Chapter 4. Air Traffic Demand Forecast 4.1. Review of SAPROF Study
4.1.1. Procedure of Air Traffic Demand Forecast applied in SAPROF
The following figure outlines the procedure which had been applied in the previous SAPROF study, to forecast the air traffic demand. In the previous forecast two different approaches, namely, Top-down analysis and Bottom-Up analysis, were applied. Both analysis were computed with data available only until the year 2002.
The present facilities at Borg El Arab International Airport were planned and constructed on the basis of the air traffic demand which had thus been forecasted.
Figure 4.1-1 Procedure of Air Traffic Demand Forecast in SAPROF
In the Top-down analysis the international, domestic passengers and cargo volumes were predicted separately. First the number of air passengers for entire Egypt were computed by a linear regression model. Egyptian GDP per Capita was assumed to be the explanatory variable. In the next step the number of air passengers for Alexandria airport was computed by multiplying the ratio of air passengers at Alexandria to the entire Egypt. This ratio was assumed to be constant, because its trend had been consistent in the past, and was used to forecast the air traffic demand. A sensitive analysis was conducted by changing the assumption for Egyptian future GDP per Capita. Three cases were studied (High, Medium, and Low).
Forecast of air passenger of Egypt
Forecast Model(Int’l/ Dome/ Cargo)
Forecast of air passenger of Alexandria
Current ratio of air passenger of
Alexandria to the whole Egypt
*Explanatory variableEgyptian GDP per Capita
*Current ratio maintain the same in the future- Domestic 1.7%- International 3.0%
Forecast of Domestic air passenger at
Alexandria
Forecast of Int’l air passenger at Alexandria
Growth rate same as Top-
down analysis
Low caseAverage growth rate of Int’l air passenger at Alexandria : 1993-2002 (7.5%)
High caseIt was assumed that passenger growth rate accelerates in line with Alexandria Int’l tourist growth : (7.95 ~ 10.65%)
(Domestic)
Based on the forecast in
Egypt by WTO
Top-down analysis Bottom-up analysis(Egypt driven) (Alexandria driven)

Special Assistance for Project Implementation (SAPI) for Borg El Arab International Airport Modernization Project
Chapter 4 Air Traffic Demand Forecast - Final Report -
4-2
The Bottom-Up analysis was made by focusing on the air passengers in Alexandria. International and domestic passengers were forecasted separately. The future growth rate for international passenger was assumed based on the two scenarios, High and Low. The growth rate in the Low case was set based on the historical average annual growth rate of 7.5%. For the High case a gradually increasing growth rate was assumed according to Egypt tourism growth rate predicted by the World Tourism Organization (WTO). For domestic passengers, the results obtained in the Top-down analysis were adopted. In the previous SAPROF study the low case demand was used facility planning of the Borg El Arab International Airport.
4.1.2. Comparison between the Forecast in SAPROF Study with the actual Traffic
A Comparison has been made between the actual traffic recorded in 2010 and the number of passengers previously forecasted in the SAPROF Study for entire Egypt and Alexandria as shown in Table 4.1-1.
1) Top-down
For example for the Medium case 2010, the actual traffic exceeded the previous forecast for Egypt by 27% and for Alexandria by 57%. The difference between the previous forecast and actual traffic becomes larger when the passenger demands only for Alexandria are considered.
2) Bottom-Up
The actual passenger traffic in 2010 in Alexandria was 55% higher than the Low case forecast.
Table 4.1-1 Actual and SAPROF Forecast Air Passenger Demand Egypt Alexandria (ALY + HBE)
Acutal Top-Down Forecast Acutal Top-Down Forecast Bottom-UP Forecast High Medium Low High Medium Low High Low
1995 11,222 2501996 12,888 2601997 13,561 2851998 11,668 2901999 16,557 3252000 20,534 3472001 17,608 3652002 18,121 18,121 18,121 18,121 422 422 422 422 422 4222003 19,103 19,561 19,117 19,082 449 476 465 464 474 4712004 23,907 21,141 20,259 20,117 491 516 494 490 510 5052005 24,811 22,850 21,544 21,208 609 558 525 517 550 5412006 25,801 24,697 22,910 22,369 803 604 559 546 592 5792007 30,610 26,694 24,364 23,573 962 654 596 576 638 6212008 35,769 28,869 25,923 24,824 1,290 709 634 607 687 6652009 34,835 31,221 27,582 26,141 1,469 767 676 640 740 7132010 40,067 33,767 29,348 27,528 1,682 831 720 674 802 764
▲16% ▲27% ▲31% ▲51% ▲57% ▲60% ▲52% ▲55% Differencein 2010

Special Assistance for Project Implementation (SAPI) for Borg El Arab International Airport Modernization Project
Chapter 4 Air Traffic Demand Forecast - Final Report -
4-3
40,067
33,767
29,348 27,528
0
5,000
10,000
15,000
20,000
25,000
30,000
35,000
40,000
45,000
1995 1996 1997 1998 1999 2000 2001 2002 2003 2004 2005 2006 2007 2008 2009 2010
Acutal
Top-Down Forecast High
Top-Down Forecast Medium
Top-Down Forecast Low
(Thousands.person) EGYPT
1,682
831
674
0
200
400
600
800
1,000
1,200
1,400
1,600
1,800
1995 1996 1997 1998 1999 2000 2001 2002 2003 2004 2005 2006 2007 2008 2009 2010
AcutalTop-Down Forecast HighTop-Down Forecast MediumTop-Down Forecast LowBottom-UP Forecast HighBottom-UP Forecast Low
(Thousands.person) ALEXANDRIA
Figure 4.1-2 Comparison between Previous Forecasts and Actual Traffic

Special Assistance for Project Implementation (SAPI) for Borg El Arab International Airport Modernization Project
Chapter 4 Air Traffic Demand Forecast - Final Report -
4-4
4.1.3. Comparative Analysis between SAPROF and Present
1) Socio-economic indices
In the Top-down analysis of SAPROF study, only Egyptian GDP per Capita was used in the forecasting models as an explanatory variable.
Chronological changes in the Egyptian GDP per Capita after 1995 (actual and assumed in SAPROF) are shown in the Table 4.1-2.
In the SAPROF study, a price of Egyptian GDP was expressed in USD, and the base year of the constant price was at 1995. Currently, Egyptian GDP at constant price is expressed as the base year of 2002.
In the same Table below, the GDP and GDP per Capita after 2003 were estimated by transforming the base year, the GDP deflator, and the then prevailing Exchange Rate.
It should be noted that the Exchange Rate was depreciated after introduction of the floating rate system into Egyptian pound in January, 2003. Thereafter the Egyptian pound has depreciated against the USD, and the value of Egyptian pound has dropped by approximately 20%. Egyptian pound also depreciated against foreign currencies of major and neighboring countries as shown in Figure 4.1-3.
Table 4.1-2 Comparison of variables of forecast model at SAPROF X (explanatory variable)
GDP per capita at 95 const Egypt GDP at 95 const Egypt Population Exchange rate(USD) (Bill USD) (Millions)
Acutal SAPROF Acutal SAPROF Acutal SAPROF USD per EGP per(Estimate) Assumption (Estimate) Assumption Assumption 1EGP 1USD
1995 1,057 60.163 56.90 0.2938 3.40371996 1,084 63.078 58.20 0.2939 3.40251997 1,125 66.844 59.40 0.2945 3.39561998 1,185 71.926 60.70 0.2931 3.41181999 1,220 75.615 62.00 0.2926 3.41762000 1,255 79.453 63.30 0.2830 3.53362001 1,160 75.034 64.70 0.2476 4.03882002 1,019 67.232 66.00 0.2161 4.62752003 870 1,276 58.560 86.376 67.30 67.70 0.1714 5.83432004 740 1,311 50.776 90.478 68.60 69.00 0.1612 6.20352005 778 1,351 54.474 95.002 70.00 70.32 0.1726 5.79372006 851 1,392 60.674 99.752 71.30 71.67 0.1743 5.73722007 889 1,432 65.415 104.740 73.60 73.05 0.1773 5.64022008 966 1,479 72.653 109.977 75.20 74.36 0.1838 5.44072009 988 1,525 75.872 115.476 76.80 75.70 0.1801 5.55252010 1,019 1,573 79.817 121.250 78.34 77.06 0.1776 5.6306
54% 52% ▲2% Differencein 2010
The actual Egyptian GDP per Capita in the year 2010 was 54% lower than the assumption of SAPROF.

Special Assistance for Project Implementation (SAPI) for Borg El Arab International Airport Modernization Project
Chapter 4 Air Traffic Demand Forecast - Final Report -
4-5
50
60
70
80
90
100
110
120
130
140
2000 2001 2002 2003 2004 2005 2006 2007 2008 2009 2010
USD per 1EGP
EUR per 1EGP
GBP per 1EGP
RUB per 1EGP
SAR per 1EGP
Index (year 2002 =100)
[Note] EUE; EURO, GBP: Great Britain Pound, RUB: Russian Ruble, SAR: Saudi Arabian Riyal
Figure 4.1-3 Trend of a value of One Egyptian Pound against foreign currency
It is considered that the depreciation of the Egyptian pound is one of the factors in the increase of the foreign tourist in Egypt.
Though SAPROF assumed the average GDP growth rate from 2003 to 2010 to be 5.0% annually, in fact the average annual growth rate of 5.6% was achieved during the same period.
Elasticity of air passenger demand against Egyptian GDP growth for entire Egypt is shown in Table 4.1-3. The figure at the lower row in the Table expresses a demand elasticity against GDP growth. It is clear that demand elasticity after 2003 was higher than that before SAPROF.
Table 4.1-3 Elasticity of Air Passenger Demand against Egyptian GDP growth for Entire Egypt
1995-2002 2003-2010
The number of increment air passenger per one billon GDP growth (persons) 69,123 104,014
Air passenger growth rate per GDP 1% growth (%) 1.46 1.72

Special Assistance for Project Implementation (SAPI) for Borg El Arab International Airport Modernization Project
Chapter 4 Air Traffic Demand Forecast - Final Report -
4-6
2) Trend of air passenger movement in Egypt
In the Top-down analysis, future air traffic in Alexandria airports was computed by multiplying the ratio of air passengers of Alexandria in the entire Egypt. Meanwhile, in the Bottom-up analysis, future air traffic growth rate was assumed based on the past air traffic trend at Alexandria.
Trend of air passenger movements at each airport in Egypt are shown in Table 4.1-4.
Table 4.1-4 Trend of air passenger movement in Egypt Air passenger movement (persons)
Others Total Actual SAPROFAssumption
1995 7,035,002 633,550 1,112,531 250,042 2,190,417 11,221,542 2.23% 1996 7,801,812 737,768 1,463,443 260,194 2,625,211 12,888,428 2.02% 1997 8,015,942 935,304 1,432,223 284,685 2,893,315 13,561,469 2.10% 1998 7,116,026 1,031,809 1,215,325 289,918 2,015,399 11,668,477 2.48% 1999 8,302,212 1,677,770 2,092,194 325,209 4,159,888 16,557,273 1.96% 2000 8,942,539 2,100,393 3,186,339 346,528 5,957,754 20,533,553 1.69% 2001 8,318,643 2,068,866 2,926,148 365,431 3,929,152 17,608,240 2.08% 2002 8,392,670 2,915,532 3,040,457 421,805 3,350,553 18,121,017 2.33% 2.33% 2003 8,337,152 3,418,808 3,396,354 449,090 3,501,168 19,102,572 2.35% 2.33% 2004 9,534,069 4,590,778 4,574,531 491,367 4,716,434 23,907,179 2.06% 2.33% 2005 10,218,369 4,750,089 4,524,022 609,212 4,709,775 24,811,467 2.46% 2.33% 2006 10,778,097 5,052,705 4,832,530 803,042 4,335,075 25,801,449 3.11% 2.33% 2007 12,577,456 6,415,017 5,945,254 962,392 4,709,552 30,609,671 3.14% 2.33% 2008 14,360,029 7,747,422 6,741,017 1,290,095 5,630,861 35,769,424 3.61% 2.33% 2009 14,378,842 7,419,467 6,728,291 1,469,059 4,839,087 34,834,746 4.22% 2.33% 2010 16,135,898 8,682,279 8,059,849 1,681,983 5,507,126 40,067,135 4.20% 2.33%
Average annual grow th rate1995-2002 3% 24% 15% 8% 6% 7%2003-2010 10% 14% 13% 21% 7% 11%
Ratio of "ALY+HBE"against National total
Cairo ALY + HBESharm El-
Shiekh Hurghada
In the SAPROF study, the ratio of air passengers at Alexandria against those at entire Egypt was assumed constant because the ratio had been relatively stable before 2002, however in fact, the ratio has increased since 2005. The air passenger growth rate in Alexandria during the period from 2003 to 2010 was nearly double the rate of National total.
Average annual air passenger growth rate in Alexandria became higher after the SAPROF. While the rate from 1995 to 2002 was 8% per annum, the rate from 2003 to 2010 was 21% per annum. The growth rate was also higher, compared with the other airports.
Comparing air passenger growth rate from 2003 to 2010 at each airport, it is recognized that the growth rate of Sharm El-Sheikh is similar to that of Hurghada, and that the growth rate of Cairo is similar to that of the other airport.
It is certain that the expansion of Low Cost Carrier (LCC) business in Alexandria contributed to the higher passenger growth as described in Chapter3.

Special Assistance for Project Implementation (SAPI) for Borg El Arab International Airport Modernization Project
Chapter 4 Air Traffic Demand Forecast - Final Report -
4-7
4.1.4. Principal Conclusion
Through review of the air traffic demand forecast in the SAPROF study, the following principal conclusions have been obtained which are relevant to the air traffic demand forecasting process in this study:
The actual passenger number in 2010 at Alexandria was 55% higher than the Low Case forecast of the Bottom-up analysis which was used for facility planning of the Borg El Arab International Airport;
Principal factors behind the difference between the actual number of passengers at Alexandria and the forecasted demand in SAPROF are
- Egyptian economy has grown more than expected;
300
350
400
450
500
550
600
2000 2002 2004 2006 2008 2010
Acutal
SAPROF
(Bill EGP) Egyptian GDPat 2002 constant price
5,000
5,500
6,000
6,500
7,000
7,500
2000 2002 2004 2006 2008 2010
Actual
SAPROF
(EGP) Egyptian GDP per Capita
at 2002 constant price
Figure 4.1-4 Comparison of Socio-economic indices
- The Low Cost Carrier (LCC) business has been expanded especially at Alexandria; and
- As stated earlier, the air passenger demand elasticity against Egyptian GDP growth for entire Egypt after SAPROF study (after 2003) was higher than that before SAPROF.
The amount of Egyptian GDP converted to the USD equivalent fluctuated greatly after SAPROF study due to introduction of floating exchange rate system into Egyptian pound from January 2003. This suggests that Egyptian GDP of the national currency (EGP) is suitable for the explanatory variable of forecast models.
Average annual air passenger growth rate in Alexandria has drastically increased after the SAPROF study, i.e. the rate between 1995 and 2002 was 8% per annum, while the rate after 2003 to 2010 was 21% per annum. The growth rate at Alexandria was the highest among Egyptian airports. In order to incorporate such trend into the revised traffic forecast, it is necessary to carefully observe the trend of air traffic movements specific to each of the Egyptian airports.
Especially, the analysis of LCC business expansion trend is one of the most important issues for revising the future air traffic.

Special Assistance for Project Implementation (SAPI) for Borg El Arab International Airport Modernization Project
Chapter 4 Air Traffic Demand Forecast - Final Report -
4-8
4.2. Forecasting Parameters
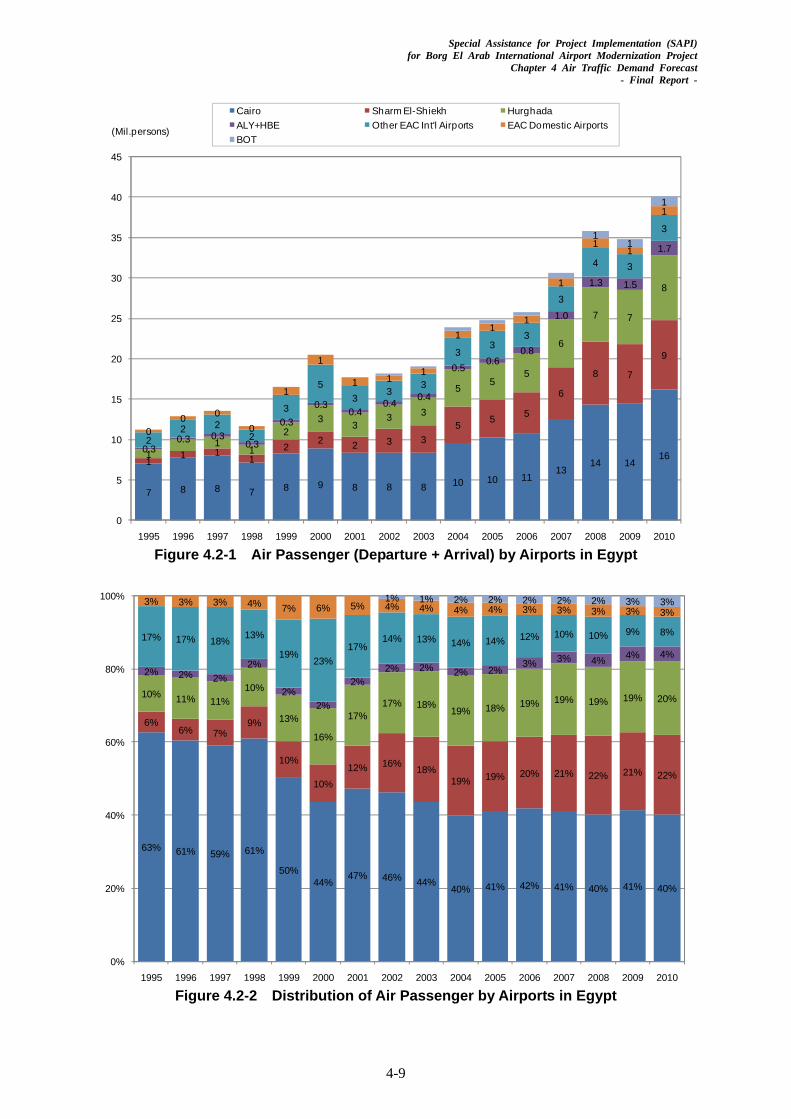
4.2.1. Air Traffic in Egypt
1) Passengers
In general, air passenger demand in Egypt tends to increase constantly, except after negative internal and/or external events, e.g. terrorism or financial crisis, which temporarily decreases the demand.
Internal and external events, which affected the air passenger demand between 1995 and 2010, are summarized below.
Table 4.2-1 Internal and External Events Year Month Event 1997 November Luxor Massacre (Internal) 2001 September September 11 attacks (External) 2005 July Sharm El-Sheikh attacks (Internal) 2008 October World financial crisis (External/Internal)
Average annual growth rate of air passengers increased after the SAPROF study, i.e. from 7.1% between 1995 and 2002 to 11.2% between 2003 and 2010.
The number of air passengers at Sharm El-Sheikh and Hurghada International Airports as well as the total number of air passengers visiting Egypt increased unexpectedly.
In Alexandria, the average annual growth rate of air passengers between 2003 and 2010 in Alexandria-Nozha International Airport (ALY) was 17.7%, and that in Borg El Arab International Airport (HBE) was 26.3%. When compared to other airports in Egypt these growth rates were remarkably higher. Hence, the ratio of air passengers at Alexandria airports to whole Egypt has increased from 2% in 2002 to 4% in 2010.
2) Cargo
International air cargos are mostly handled in Cairo International Airport. The volume of domestic air cargos is assumed to be small, because domestic routes are mainly operated by small aircraft with small belly cargo space. At the moment no sufficient data are available related to the cargo traffic in Egypt.
International air cargo had a tendency to decrease until 2003, but has been increasing thereafter.
3) Aircraft Movement
The trend of aircraft movements is similar to the trend of air passengers.
Average annual growth rates of the aircraft movements were less than those of air passengers (2.8% between 1995 and 2002; and 9.9% between 2003 and 2010), because the number of air passengers onboard was increasing (in other words, operating fleets are up-sizing).
Special Assistance for Project Implementation (SAPI) for Borg El Arab International Airport Modernization Project
Chapter 4 Air Traffic Demand Forecast - Final Report -
4-9
7 8 8 7 8 9 8 8 8 10 10 1113
14 14161
1 11
22 2 3 3
5 5 5
6
8 7
9
11
1
23 3
3 3
55
5
6
7 7
8
0.3 0.3 0.3
0.3
0.3
0.3 0.4
0.4 0.4
0.5 0.6
0.8
1.0
1.3 1.5
1.7
22 2
2
3
53
33
33
3
3
4 3
3
00 0
0
1
1
1 11
11
1
1
11
1
11
1
0
5
10
15
20
25
30
35
40
45
1995 1996 1997 1998 1999 2000 2001 2002 2003 2004 2005 2006 2007 2008 2009 2010
Cairo Sharm El-Shiekh HurghadaALY+HBE Other EAC Int'l Airports EAC Domestic AirportsBOT
(Mil.persons)
Figure 4.2-1 Air Passenger (Departure + Arrival) by Airports in Egypt
63% 61% 59% 61%
50%44%
47% 46% 44%40% 41% 42% 41% 40% 41% 40%
6%6% 7%
9%
10%
10%12% 16% 18%
19% 19% 20% 21% 22% 21% 22%
10% 11% 11%10%
13%
16%
17%17% 18% 19% 18% 19% 19% 19% 19% 20%
2% 2% 2%2%
2%2%
2%2% 2% 2% 2%
3% 3% 4% 4% 4%
17% 17% 18% 13%
19%23%
17%14% 13% 14% 14% 12% 10% 10% 9% 8%
3% 3% 3% 4% 7% 6% 5% 4% 4% 4% 4% 3% 3% 3% 3% 3%1% 1% 2% 2% 2% 2% 2% 3% 3%
0%
20%
40%
60%
80%
100%
1995 1996 1997 1998 1999 2000 2001 2002 2003 2004 2005 2006 2007 2008 2009 2010 Figure 4.2-2 Distribution of Air Passenger by Airports in Egypt

Special Assistance for Project Implementation (SAPI) for Borg El Arab International Airport Modernization Project
Chapter 4 Air Traffic Demand Forecast - Final Report -
4-10
142162 168
191 203 199 198 196 189219 233
255279 279 284
311
6 6 4
533
0
50
100
150
200
250
300
350
400
1995 1996 1997 1998 1999 2000 2001 2002 2003 2004 2005 2006 2007 2008 2009 2010 Figure 4.2-3 International Air Cargo (Export + Import) by Airports in Egypt
100% 100% 100% 100% 100% 100% 100% 100% 100% 100% 100% 100%
88%
98% 98% 98%
2%
2% 2% 2%10%
0%
20%
40%
60%
80%
100%
1995 1996 1997 1998 1999 2000 2001 2002 2003 2004 2005 2006 2007 2008 2009 2010
[Source] Egyptian Holding Company of Airports and Air Navigation website
Figure 4.2-4 Distribution of International Air Cargo by Airports in Egypt

Special Assistance for Project Implementation (SAPI) for Borg El Arab International Airport Modernization Project
Chapter 4 Air Traffic Demand Forecast - Final Report -
4-11
6581 83 79 87 92 83 81 86 95 99 106
122137 142 155
79 11 12
18 2219 24 28
35 36 36
45
56 5462
13
18 12
2326
23 2225
32 33 33
40
48 47
56
8
8 99
96
6 66
6 79
11
13 16
17
24
3033
26
4244
29 2324
3030
29
34
41 36
40
28
2125
23
2218
15 1713
1719 18
20
22 17
19
7 8
10
0
50
100
150
200
250
300
350
400
1995 1996 1997 1998 1999 2000 2001 2002 2003 2004 2005 2006 2007 2008 2009 2010
Cairo Sharm El-Shiekh HurghadaALY+HBE Other EAC Int'l Airports EAC Domestic AirportsBOT
(Thous.times)
Figure 4.2-5 Aircraft Movements by Airports in Egypt
45%49% 46% 49%
43% 44% 48% 47% 47% 44% 43% 45% 44% 42% 44% 43%
5%6%
6%8%
9%10%
11% 14% 15%16% 16% 15% 16% 17% 17% 17%
9%
10%10%
7%11%
13%13%
13%14% 15% 14% 14% 14% 15% 15% 16%
5%
5% 5% 5% 5%3%
3%4%
3% 3% 3% 4% 4% 4% 5% 5%
16%
18% 18% 16% 21%21%
17% 13%13% 14% 13% 12% 12% 13% 11% 11%
19%13% 14% 15% 11% 8% 8% 9% 7% 8% 8% 8% 7% 7% 5% 5%
1% 1% 1% 2% 2% 2% 2% 3% 3%
0%
20%
40%
60%
80%
100%
1995 1996 1997 1998 1999 2000 2001 2002 2003 2004 2005 2006 2007 2008 2009 2010 [Source] Egyptian Holding Company of Airports and Air Navigation website
Figure 4.2-6 Distribution of Aircraft Movements by Airports in Egypt

Special Assistance for Project Implementation (SAPI) for Borg El Arab International Airport Modernization Project
Chapter 4 Air Traffic Demand Forecast - Final Report -
4-12
Table 4.2-2 Air Traffic by Airports in Egypt Passenger (Thousand Persons)
CairoSharm El-
Shiekh Hurghada Luxor Asw an AlexandriaBorg El-
Arab AsyutEAC Int'lAirport
EAC Dome.Airport
MarsaAlam El-Alamein Total
1995 7,035 634 1,113 1,290 589 250 0 0 3,875 312 0 0 11,2221996 7,802 738 1,463 1,481 748 260 0 0 4,691 396 0 0 12,8881997 8,016 935 1,432 1,713 750 285 0 5 5,121 425 0 0 13,5611998 7,116 1,032 1,215 919 628 290 0 24 4,108 444 0 0 11,6681999 8,302 1,678 2,092 1,735 1,321 325 0 26 7,177 1,078 0 0 16,5572000 8,943 2,100 3,186 2,270 2,356 255 92 25 10,284 1,307 0 0 20,5342001 8,319 2,069 2,926 1,893 1,081 196 170 32 8,366 921 2 0 17,6082002 8,393 2,916 3,040 1,635 834 304 118 47 8,894 665 170 0 18,1212003 8,337 3,419 3,396 1,652 843 310 139 44 9,803 691 271 0 19,1032004 9,534 4,591 4,575 2,124 1,167 412 79 62 13,010 933 430 0 23,9072005 10,218 4,750 4,524 2,257 1,032 489 120 72 13,245 913 435 0 24,8112006 10,778 5,053 4,833 2,033 874 573 230 89 13,684 822 500 18 25,8012007 12,577 6,415 5,945 1,976 979 729 234 131 16,409 952 643 29 30,6102008 14,360 7,747 6,741 2,160 1,107 1,102 188 328 19,374 1,177 820 39 35,7692009 14,379 7,419 6,728 1,847 864 1,098 371 257 18,585 901 939 31 34,8352010 16,136 8,682 8,060 1,935 954 972 710 313 21,626 1,099 1,182 24 40,067
Average Annual Grow th Rate1995-2002 2.6% 24.4% 15.4% 3.4% 5.1% 2.8% - - 12.6% 11.4% - - 7.1%2003-2010 9.9% 14.2% 13.1% 2.3% 1.8% 17.7% 26.3% 32.4% 12.0% 6.9% 23.4% - 11.2%
Cargo (tons)
CairoSharm El-
Shiekh Hurghada Luxor Asw an AlexandriaBorg El-
Arab AsyutEAC Int'lAirport
EAC Dome.Airport
MarsaAlam El-Alamein Total
1995 141,813 0 0 141,8131996 161,527 0 0 161,5271997 168,058 0 0 168,0581998 190,641 0 0 190,6411999 202,867 0 0 202,8672000 199,180 0 0 199,1802001 197,937 0 0 197,9372002 196,308 0 0 196,3082003 189,343 0 0 189,3432004 218,606 0 0 218,6062005 232,548 0 0 232,5482006 254,782 0 0 254,7822007 279,319 33,421 5,844 39,265 0 318,5842008 278,578 945 5,893 6,838 0 285,4162009 283,502 1,035 4,402 5,438 0 288,9402010 310,903 861 5,351 6,212 0 317,115
Average Annual Grow th Rate1995-2002 4.8% - - - - - - - - - - - 4.8%2003-2010 7.3% - - - - - - - - - - - 7.6%
Aircraft Movements (times)
CairoSharm El-
Shiekh Hurghada Luxor Asw an AlexandriaBorg El-
Arab AsyutEAC Int'lAirport
EAC Dome.Airport
MarsaAlam El-Alamein Total
1995 64,628 7,283 12,612 14,624 9,085 7,607 0 0 51,211 27,908 0 0 143,7471996 81,045 9,265 16,480 18,590 11,175 7,802 0 0 63,312 21,041 0 0 165,3981997 83,299 11,457 17,610 20,477 11,729 9,331 0 556 71,160 24,863 0 0 179,3221998 79,312 12,172 11,669 13,412 11,396 8,744 0 844 58,237 23,436 0 0 160,9851999 86,953 18,135 22,695 20,540 19,145 9,250 0 2,792 92,557 22,465 0 0 201,9752000 92,006 21,719 26,127 21,375 18,330 4,411 1,872 4,767 98,601 17,661 0 0 208,2682001 83,293 18,788 22,860 16,603 11,553 2,945 3,149 1,171 77,069 14,740 15 0 175,1172002 81,340 23,708 22,450 13,384 8,850 4,510 1,660 628 75,190 16,500 1,235 0 174,2652003 86,175 27,899 25,367 14,445 8,472 4,396 1,979 646 83,204 13,144 2,290 0 184,8132004 94,921 34,684 32,163 17,590 11,354 5,247 901 766 102,705 16,902 3,129 0 217,6572005 99,204 36,029 32,824 19,079 10,605 5,920 1,494 776 106,727 19,151 3,661 8 228,7512006 106,000 35,723 33,296 17,776 10,119 6,984 2,452 934 107,284 17,722 4,091 273 235,3702007 121,845 44,884 39,992 20,476 12,001 8,251 2,350 1,402 129,356 19,556 4,871 344 275,9722008 137,333 55,854 47,821 23,616 13,629 11,215 1,548 3,439 157,122 21,927 6,353 521 323,2562009 142,355 53,807 46,925 21,652 11,857 12,313 3,544 2,764 152,862 17,372 7,489 619 320,6972010 154,832 61,681 55,634 23,536 13,028 10,424 6,836 3,135 174,274 19,246 9,722 643 358,717
Average Annual Grow th Rate1995-2002 3.3% 18.4% 8.6% -1.3% -0.4% -7.2% - - 5.6% -7.2% - - 2.8%2003-2010 8.7% 12.0% 11.9% 7.2% 6.3% 13.1% 19.4% 25.3% 11.1% 5.6% 22.9% - 9.9%
http://w w w .ehcaan.com/statistics.aspx

Special Assistance for Project Implementation (SAPI) for Borg El Arab International Airport Modernization Project
Chapter 4 Air Traffic Demand Forecast - Final Report -
4-13
4.2.2. Origin & Destination / Nationality of Air passenger
1) Origin & Destination
“Tourism Fact Book” published by the World Tourism Organization (UNWTO) shows the origin & destination of passengers with Egyptian and non-Egyptian nationality.
Share of Egyptian resident or non-resident visitors at the national borders to Egypt is shown in Figure 4.2-7. In average, the ratios of residents and non-residents have been approximately 20% and 80 % respectively.
21% 24% 18% 16% 20% 19%12%
79% 76% 82% 84% 80% 81%88%
0%
20%
40%
60%
80%
100%
2003 2004 2005 2006 2007 2008 2009
Non-Resident (Tourist)
Resident (Egyptian)
[Source] World Tourism Organization (UNWTO)
Figure 4.2-7 Distribution of Resident/ Non-resident visitors at National borders
Figure 4.2-8 shows types of transportation used for tourists’ entry to Egypt. The air transport accounted for more than 80 % which is similar to the share of foreign visitors in the total tourist arrivals shown in Figure 4.2-8.
80% 83% 84% 84% 85% 85% 86%
8% 6% 7% 7% 7% 7% 6%12% 11% 9% 9% 8% 8% 8%
0%
20%
40%
60%
80%
100%
2003 2004 2005 2006 2007 2008 2009
By Land
By Sea
By Air
[Source] Statistical Year Book (CAPMAS)
Figure 4.2-8 Tourist Distribution by Arrival Method
Major destinations of Egyptian and countries of non-Egyptian passengers are illustrated in Figure 4.2-9.
Around 80% of Egyptians are traveling to the Middle East. The second most popular travel

Special Assistance for Project Implementation (SAPI) for Borg El Arab International Airport Modernization Project
Chapter 4 Air Traffic Demand Forecast - Final Report -
4-14
destination is Europe (approximately 10%), while the majority of nonresidents visiting Egypt were from European (75 %), followed by those from the Middle East (15%).
Hence, it can be concluded that Europe and Middle East are the major markets of the air traffic to/from Egypt for both Egyptian and non-Egyptian.
2% 2% 3% 3% 2% 2% 4%10%
6%11% 12%
7% 7%12%
84% 89% 82% 79% 86% 86% 75%
2% 2% 3% 4% 3% 3% 5%
0%
20%
40%
60%
80%
100%
2003 2004 2005 2006 2007 2008 2009
East Asia and PacificSouth Asia
Middle East
Europe
Americas
Africa
Resident (Egyptian)
3% 3% 3% 3% 3% 3% 4%3% 3% 3% 4% 4% 4% 4%
70% 73% 70% 69% 72% 75% 75%
20% 16% 18% 19% 15% 13% 13%
4% 4% 5% 4% 5% 4% 4%
0%
20%
40%
60%
80%
100%
2003 2004 2005 2006 2007 2008 2009
East Asia and PacificSouth Asia
Middle East
Europe
Americas
Africa
Non-Resident (Tourist)
[Source] World Tourism Organization (UNWTO)
Figure 4.2-9 Distribution of Origin & Destination
2) Nationality of Air Passenger at Major EAC Airports
Share of air passengers by nationalities is different at each EAC Airport.
80% of the air passengers at two Alexandria’s airports are Egyptian, followed by travelers from Middle-Eastern and Libyan nationals.
In Sharm El-Sheikh and Hurghada, which are resort places, most passengers are European, mainly Russian. In the upper Egypt (Luxor and Aswan), which are well-known great historical heritages, 40 to 50 % of travelers are European and 20% to 25% are Egyptian.

Special Assistance for Project Implementation (SAPI) for Borg El Arab International Airport Modernization Project
Chapter 4 Air Traffic Demand Forecast - Final Report -
4-15
80%
7%
3%9%
Egypt
Middle east
Libya
Others
Alexandria
82%
7%3%
8%
Egypt
Middle east
Libya
Others
Borg El Arab
29%
22%14%
5%
5%
26%
Russia
U.K
Italy
Poland
Ukraine
Others
Sharm El Shiekh
34%
20%7%
4%3%
32%
Russia
Germany
Poland
France
Ukraine
Others
Hurghada
25%
19%
15%
7%
7%
27%
Egypt
U.K
France
Germany
Spain
Others
Luxor *Departure only
28%
20%
8%8%
7%
28%
Spain
Egypt
USA
U.K
Italy
Others
Aswan *Departure only
[Source] EAC (2010)
Figure 4.2-10 Share of Passengers by Nationality at Major EAC Airports

Special Assistance for Project Implementation (SAPI) for Borg El Arab International Airport Modernization Project
Chapter 4 Air Traffic Demand Forecast - Final Report -
4-16
4.2.3. Trend of Scheduled Flights in Alexandria
The breakdown of aircraft movements at Alexandria-Nozha International Airport (ALY) and Borg El Arab International Airport (HBE) is shown in Figure 4.2-11. Most of the flights at both airports are of international scheduled and only a few are of non-scheduled. The “Others” marked/labeled grey are of petroleum and military flights from/to ALY and HBE.
In this section, the trend of scheduled flights at two Alexandria airports from 2002 to 2011 based on the time table is described.
4 5 5 7 10 10
9 1 1 1
1
1 2
2 5
8 7
10
9 7 9
0
5
10
15
20
25
2004 2005 2006 2007 2008 2009 2010
(Thous.times)
(Year)
36% 35% 40% 37%48% 54%
44%
12%8%
9%8%
8%10%
10%
51% 56%49% 54%
44%37%
46%
0%
20%
40%
60%
80%
100%
2004 2005 2006 2007 2008 2009 2010(Year)
1 1 2 2
1
3
6
0.5
0.7
0.4 0.5
0.5
0.2
0.5
0
2
4
6
8
2004 2005 2006 2007 2008 2009 2010
(Thous.times)
(Year)
43% 49%
77% 78%64%
84% 85%13%
12%
7% 3%
9%
9% 7%
8%7%
2%
3%
3%
35% 32%
15% 17%24%
5% 7%
0%
20%
40%
60%
80%
100%
2004 2005 2006 2007 2008 2009 2010(Year)
Others Domestic Non Scheduled Domestic Scheduled
International Non Scheduled International ScheduledALY
HBE
[Source] Egyptian Holding Company of Airports and Air Navigation website
Figure 4.2-11 Aircraft Movements at ALY and HBE
1) Destinations
The most popular destination of travelers departing from Alexandria airports is the Middle East. This trend has been continuing in the past and the number of flights was increasing

Special Assistance for Project Implementation (SAPI) for Borg El Arab International Airport Modernization Project
Chapter 4 Air Traffic Demand Forecast - Final Report -
4-17
since 2004. The main destinations in Middle East are Saudi Arabia, UAE and Kuwait. The number of flights to Saudi Arabia increased in 2008, to Kuwait in 2005 and to UAE in 2011 respectively. The increment of flights are due to the effect of new airlines recently established, which started to operate on these routes, especially of Low Cost Carriers (LCC).
The number of domestic flights from Alexandria has been increasing due to downsizing of aircraft, since Egypt Air replaced their A320 (150-seater) by EMBRAER (70-seater; of Egypt Air Express) from 2007.
14 15 15 14 16 20 48 55 58 55
13 25 25 25
26 25 25
47
7 7 5
6 6 13
21 29 29
25 20 12
16
5 6 4
20 20 15
20
25 20
35
7 12
12
11 11 13
6
7 8
4
13 10
11
6 5 14
13
18 22
20
0
50
100
150
200
2002 2003 2004 2005 2006 2007 2008 2009 2010 2011
Domestic
Europe
Rest of Middle East
Libya
Kuwait
UAE
Saudi Arabia
Departure Flight s/ week
28% 26% 23%16% 18% 19%
34% 31% 33%27%
6% 9%20%
28% 28% 24%
19%14%
14% 23%14% 12%8% 7% 7% 13%
15%
16%17% 12%
2% 5%8% 7% 6% 3%
4%11% 7% 8%
10% 10%6%
23% 23%15%
14% 14% 11% 17%
14%21% 18%
13% 13%
13%
4% 4%5%
2%26%17% 17%
7% 6%14% 9% 10% 13% 10%
0%
20%
40%
60%
80%
100%
2002 2003 2004 2005 2006 2007 2008 2009 2010 2011
Domestic
Europe
Rest of Middle East
Libya
Kuwait
UAE
Saudi Arabia
[Source] OAG July 2011
Figure 4.2-12 Departure flights by Destination from Alexandria Region
2) Airlines
From 2004 LCC started its operations at Alexandria’s airports. Thereafter the number of LCC flights has been increasing gradually and reached approximately 45% of the total flights in 2010. (It should be noted that, as far as the international flight is concerned, the current ratio of LCC is 50%)

Special Assistance for Project Implementation (SAPI) for Borg El Arab International Airport Modernization Project
Chapter 4 Air Traffic Demand Forecast - Final Report -
4-18
36 35 31 28 23 35 39
57 53 51
14 23 27 46 51
47 62
62 45
62
7
14 14 21
39
60 76
89
0
50
100
150
200
2002 2003 2004 2005 2006 2007 2008 2009 2010 2011
Low Cost Carrier
Legacy Carrier
Egypt Air
Departure Flights/ week
72%60%
48%
32%26%
34%28% 32% 30% 25%
28%40%
42%
52%58% 46%
44% 35%26% 31%
11% 16% 16% 20%28%
34%44% 44%
0%
20%
40%
60%
80%
100%
2002 2003 2004 2005 2006 2007 2008 2009 2010 2011
Low Cost Carrier
Legacy Carrier
Egypt Air
[Source] OAG July 2011
Figure 4.2-13 Departure flights by Type of Airline from Alexandria Region
The low-fares and high frequency of LCC flights are one of the factors that increased number of passengers in Alexandria.
Generally, the unit revenue, which is the amount of sales per passenger kilometer, of each airline is in proportion to its unit Air Fare. The unit revenue of LCC is generally smaller than that of Legacy Carriers as shown in Figure 4.2-14, although the figures indicated are only the airlines which financial data are available on their website, and the currency unit of their unit revenue was converted into EGP using the exchange rates for every year and every country.
The chronological trends of the unit revenue for each airline category are shown in the Figure below. The average unit revenue computed for each airline category shows, that in 2010 the unit revenue of LCCs seemed to be approximately 60% of that of Legacy Carrier. In other words, the air fare of LCC is considered 40% cheaper than that of Legacy carrier,

Special Assistance for Project Implementation (SAPI) for Borg El Arab International Airport Modernization Project
Chapter 4 Air Traffic Demand Forecast - Final Report -
4-19
although the price difference between LCC and Legacy Carrier has gradually shrunken since 2004.
0.0
0.1
0.2
0.3
0.4
0.5
0.6
0.7
0.8
2004 2005 2006 2007 2008 2009 2010
Egypt Air
Emirates
Turkish
Air Arabia
Jazeera Airways
(EGP / passenger km)
[Source] Financial report of each airline (Annual Passenger Revenue / Revenue Passenger Kilometer)
Figure 4.2-14 Comparison of Unit Revenue by Airlines
Table 4.2-3 Comparison of Average Unit Revenue by Airline Category (EGP/ Passenger km)
2004 2005 2006 2007 2008 2009 2010
Legacy Carrier 0.612 0.580 0.586 0.622 0.654 0.582 0.609
Low Cost Carrier 0.268 0.258 0.331 0.389 0.447 0.354 0.344
Ratio (LCC / LC) 44% 44% 56% 63% 68% 61% 56%
[Source] Financial or Annual report of each airline

Special Assistance for Project Implementation (SAPI) for Borg El Arab International Airport Modernization Project
Chapter 4 Air Traffic Demand Forecast - Final Report -
4-20
4.2.4. Passenger survey at Borg El Arab International Airport
Behavioral characteristics, such as final destination, catchment area and purpose of travel, of air passengers using Borg El Arab International Airport were surveyed through questionnaires (hereinafter called “Passenger Survey” in cooperation with EAC).
1) Outline
Table 4.2-4 Outline of Passenger survey for Borg El Arab International Airport
Date 2011/6/12 ~ 6/18 (7 days) 2011/7/10 ~ 7/16 (7 days) 2011/8/07 ~ 8/13 (7 days)
Target All Departing Flights from Borg El Arab International Airport.
* We missed a few flights, because of the arrangement of staff.
Place Departure Waiting Room
Sampling More than 10 passengers per departing flight
(including midnight and early morning flights)
Method Interview with passengers and fill out the questionnaire sheet. (Prepared in Arabic and English)
Study Subject The questionnaire sheet is shown in next page (English Version)
Table 4.2-5 Number of Samples per day June 6/12 6/13 6/14 6/15 6/16 6/17 6/18 Total
102 147 162 149 181 159 179 1,079 July 7/10 7/11 7/12 7/13 7/14 7/15 7/16 Total
146 176 154 153 176 132 165 1,102 August 8/7 8/8 8/9 8/10 8/11 8/12 8/13 Total
256 258 238 163 238 144 203 1,500 3,681

Special Assistance for Project Implementation (SAPI) for Borg El Arab International Airport Modernization Project
Chapter 4 Air Traffic Demand Forecast - Final Report -
4-21

Special Assistance for Project Implementation (SAPI) for Borg El Arab International Airport Modernization Project
Chapter 4 Air Traffic Demand Forecast - Final Report -
4-22
2) Survey Results
a) Tabulation Method
Ten samples per each of the departure flight were collected. The actual number of passengers was varied for each flight. In the case more than ten sheets per flight collected, the following procedure was applied:
Analyzing and tabulating;
Weighting one sample with the inverse of the extraction rate per flight;
Extraction rate per departure flight was computed by the following formula.(Extraction rate = The number of samples / Actual Boarding Passenger per Flight)
(Example)
Date Flight Number The number of
Samples
Actual Boarding
Passenger
Extraction rate
1/ Extraction Rate
2011/6/12 E5 3131 11 21 0.524 1.909
For example the extraction rate was 0.524 (52.4%), then the collected samples for this flight were weighted with the inverse of the extraction rate (1.909) per sample. (i.e. one sample was regarded as 1.909 samples)
b) Behavioral characteristics of Air Passenger at Borg El Arab International Airport
90% of the air passengers at Borg El Arab International Airport were Egyptian. (This
result was a little higher than the statistics of EAC.) But only 67% of these passengers were Egyptian residents, and the rest were living in foreign countries.
Country of Birth Current Residence
90%
EgyptSaudi ArabiaKuwaitUAEJordanTurkeyQatarOthers
67%
32% Egypt
The same as final destination
Others

Special Assistance for Project Implementation (SAPI) for Borg El Arab International Airport Modernization Project
Chapter 4 Air Traffic Demand Forecast - Final Report -
4-23
The residence of Egyptian was distributed over the Nile Delta. 36% of air passengers
were residents of Alexandria.
(For Egyptian) Residence in Egypt
*Pie chart
36%
20%
13%
13%
7%
3% 4% 3%
Alexandria
Beheira
Kafr el-Sheikh
Gharbia
Monufia
Dakahlia
Lower Egypt etc
Middle Egypt
Upper Egypt
Others
Montaza 11%
Wassat6%
Shark9%
Agami 2%Gomrok 3%
Alexandria
N/A
Borg El Arab
Amriya
Gomrok
Agami
Shark
Wassat
Montaza
*Bar chart
Middle Egyot
Upper Egyot
Canal
Alexandria
HBE
Beheira
Kafr el Sheikh
Matruh
Monufia
Gharbia
Dakahlia
0
2,000
4,000
6,000
8,000
10,000
12,000 Pax /3 weeks
Sharkia
Damietta
Visiting places for foreigners: 98% visited Alexandria and 19% visited Cairo (This means 17% visit both Alexandria and Cairo). The lodging places in the last night of their departure were hotels, houses of relatives/friends and rented apartments; share of which was approximately 30% each.

Special Assistance for Project Implementation (SAPI) for Borg El Arab International Airport Modernization Project
Chapter 4 Air Traffic Demand Forecast - Final Report -
4-24
(For Foreigner) Visited Places & Today’s Origin Lodging Place last night
98%
19%
7%
7%
9%
96%
1%
0%
1%
2%
0% 20% 40% 60% 80% 100%
Alexandria
Cairo
Giza
El Alamein
Others
Ratio of visit
Place of today's origin
32%
38%
27%Hotel
House of relatives/friends
Rented Apartment
Others
45% of the purpose of Egyptian travelers was for Pilgrimage, presumably because the
survey was conducted over the month of August 2011, i.e. Ramadan period. The 2nd largest share of travelers was overseas contract workers, whose destinations were Middle East and Istanbul. The ratios of travelers for vacation and business were also high. The major purpose of foreigner to visit Egypt was business or visiting friends/relatives.
Purpose
2%
11%
9%
6%
20%
18%
43%
14%
9%
21%
2%
14%
13%
6%
17%
27%
30%
8%
8%
25%
9%
2%
82%
0%
6%
5%
30%
65%
7%
45%
47%
48%
36%
4%
39%
44%
37%
28%
15%
6%
28%
24%
36%
22%
21%
12%
33%
39%
27%
13%
17%
7%
4%
5%
5%
5%
6%
7%
0% 20% 40% 60% 80% 100%
Jeddah
Kuwait
Abu Dhabi
Riyadh
Dubai
Doha
Istanbul
Amman
Bahrain
Dammam
Medinah
Cairo- Taif
Vacation Business PilgrimageOverseas Contract Worker Archaeology Visiting friends or relativesBack to Home town Others
8%
7%
24%
9%
7%
29%
40%
45%
24%
27%
16%
15%
29%
1%
12%
0% 20% 40% 60% 80% 100%
Total
Egyptian
Foreigner

Special Assistance for Project Implementation (SAPI) for Borg El Arab International Airport Modernization Project
Chapter 4 Air Traffic Demand Forecast - Final Report -
4-25
The ratio of passengers who transit at their arriving airport was 6%. The ratio of
passengers who transit at Doha, Istanbul, Bahrain and Dubai was high.
Content of Transit passenger Transit destination
94%
96%
99%
93%
100%
84%
75%
77%
99%
78%
96%
90%
82%
6%
4%
1%
7%
0%
16%
25%
23%
1%
22%
4%
10%
18%
0% 20% 40% 60% 80% 100%
Total
Jeddah
Kuwait
Abu Dhabi
Riyadh
Dubai
Doha
Istanbul
Amman
Bahrain
Dammam
Medinah
Cairo- Taif
Direct passenger Transit passenger
63%
94%
43%
72%
33%
30%
54%
100%
100%
66%
100%
19%
72%
57%
17%
54%
11%
11%
58%
2%
2%
46%
6%
28%
10%
2%
34%
0% 20% 40% 60% 80% 100%
Total
Jeddah
Kuwait
Abu Dhabi
Riyadh
Dubai
Doha
Istanbul
Amman
Bahrain
Dammam
Medinah
Cairo- Taif
Middle east Asia Pacific Europe
America Africa N/A
*Transit in arrival airport

Special Assistance for Project Implementation (SAPI) for Borg El Arab International Airport Modernization Project
Chapter 4 Air Traffic Demand Forecast - Final Report -
4-26
* Country of birth * TransitQ2 Estimate Ratio Q3 Estimate (Person/3w ) Ratio of transit passenger by destination
(Person/3w ) Destination 1.Yes 2.No Total Destination 1.Yes 2.No Total1.Egypt 31,438 90% Total 2,247 32,811 35,058 Total 6% 94% 100%2.Saudi Arabia 732 2% Jeddah 670 16,013 16,683 Jeddah 4% 96% 100%3.UAE 413 1% Kuw ait 38 5,319 5,357 Kuw ait 1% 99% 100%4.Kuw ait 593 2% Abu Dhabi 219 2,720 2,939 Abu Dhabi 7% 93% 100%5.Jordan 230 1% Riyadh 2,382 2,382 Riyadh 100% 100%6.Qatar 120 0% Dubai 339 1,743 2,082 Dubai 16% 84% 100%7.Turkey 225 1% Doha 417 1,278 1,695 Doha 25% 75% 100%8.Others 1,307 4% Istanbul 343 1,148 1,491 Istanbul 23% 77% 100%
Total 35,058 100% Amman 11 899 910 Amman 1% 99% 100%Bahrain 138 487 625 Bahrain 22% 78% 100%Dammam 19 452 471 Dammam 4% 96% 100%
** Detail of "8. Others" Medinah 31 274 305 Medinah 10% 90% 100%Q2 Estimate Ratio Cairo- Taif 22 96 118 Cairo- Taif 18% 82% 100%
(Person/3w )Bahrain 144 0.4%U.S.A 103 0.3% Transit destination (Person/3w )Libya 93 0.3% Middle east Asia Pacif ic Europe America Africa N/A TotalSudan 81 0.2% Total 1,415 437 244 39 11 101 2,247Italy 77 0.2% Jeddah 631 39 670China 66 0.2% Doha 140 227 44 6 417India 66 0.2% Istanbul 103 200 28 4 8 343Oman 65 0.2% Dubai 244 57 6 33 339Germany 62 0.2% Abu Dhabi 94 126 219France 61 0.2% Bahrain 138 138Lebanon 54 0.2% Kuw ait 28 11 38Britain 48 0.1% Medinah 21 11 31Thailand 45 0.1% Cairo- Taif 22 22Palestine 39 0.1% Dammam 19 19England 38 0.1% Amman 6 5 11Russian 32 0.1%Indonesia 31 0.1%Japan 26 0.1% Middle east Asia Pacif ic Europe America Africa N/A TotalIraq 23 0.1% Total 63% 19% 11% 2% 0% 5% 100%Tunisia 19 0.1% Jeddah 94% 6% 100%Korea 17 0.0% Doha 33% 54% 11% 2% 100%Spain 17 0.0% Istanbul 30% 58% 8% 1% 2% 100%Bangladesh 11 0.0% Dubai 72% 17% 2% 10% 100%Pakistan 9 0.0% Abu Dhabi 43% 57% 100%Netherlands 8 0.0% Bahrain 100% 100%Bulgaria 8 0.0% Kuw ait 72% 28% 100%Sw eden 6 0.0% Medinah 66% 34% 100%Australia 6 0.0% Cairo- Taif 100% 100%Malaysia 6 0.0% Dammam 100% 100%Ireland 5 0.0% Amman 54% 46% 100%Syria 5 0.0%Bolivia 5 0.0%Jordan 5 0.0%Canada 5 0.0%SouthAfrica 4 0.0%Philipine 4 0.0%N/A 11 0.0%
1,307 3.7%
* Current residenceQ4 Estimate Ratio
(Person/3w )1.in Egypt 23,582 67%2.the same as f inal destination Kuw ait 2,978 8%
Abu Dhabi 1,646 5%Jeddah 1,509 4%Riyadh 1,225 3%Dubai 1,045 3%Doha 901 3%Istanbul 460 1%Amman 385 1%Bahrain 384 1%Dammam 244 1%Ammam 166 0%Medinah 128 0%Cairo- Taif 10 0%
3.Others 363 1%N/A 31 0%
Total 35,058 100%

Special Assistance for Project Implementation (SAPI) for Borg El Arab International Airport Modernization Project
Chapter 4 Air Traffic Demand Forecast - Final Report -
4-27
*(For Egyptian) Residence in Egypt * (For Foreigner) Place of visited / MultipleQ4.1 Estimate Ratio Q4.2.1 Estimate Ratio
(Person/3w ) (Person/3w )1.Alexandria 11,248 36% Alexandria 3,457 98%2.Beheira 6,246 20% Cairo 684 19%3.Kafr el-Sheikh 4,039 13% Giza 207 6%4.Gharbia 4,012 13% El Alamein 205 6%5.Monufia 2,131 7% Luxor 33 1%6.Matruh 227 1% Asw an 60 2%7. 6th of October 7 0% Others 225 6%8.Giza 71 0% The number of respondents 3,510 -9.Cairo 796 3%10.Others 2,742 9%
Total 31,520 100% ** Detail of "Others"Q4.2.1others Estimate Ratio
(Person/3w )** Detail of "1. Alexandria" (Destrict) Matruh 42 1.2%
Q4.1Alexandria Estimate Ratio Port Said 37 1.1%(Person/3w ) Sharm El Sheikh 32 0.9%
1.Montaza 3,617 11% Libya 31 0.9%2.Shark (East) 1,868 6% Kafr El Sheikh 24 0.7%3.Wassat (Middle) 2,708 9% Hurghada 16 0.5%4.Gomrok 677 2% Dakahlia 13 0.4%5.Agami 859 3% Gharbia 7 0.2%6.Amriya 420 1% Sharkia 6 0.2%7.Borg El Arab 542 2% Beheira 6 0.2%N/A 558 2% Monufia 6 0.2%
Total 11,248 36% Damietta 2 0.1%
** Detail of "10. Others" * (For Foreigner) Place of today's origin / MultipleQ4.1others Estimate Ratio Q4.2.2 Estimate Ratio
(Person/3w ) (Person/3w )Dakahlia 853 2.7% Alexandria 3,380 96%Sharkia 740 2.3% Cairo 38 1%Mansoura 330 1.0% GizaDamietta 327 1.0% El Alamein 30 1%Asw an 72 0.2% Others 70 2%Ismailia 62 0.2% The number of respondents 3,516 -Suhag 51 0.2%Port Said 41 0.1%Fayoum 39 0.1% ** Detail of "Others"Asyout 35 0.1% Q4.2.2others Estimate RatioBani Suef 29 0.1% (Person/3w )Minya 27 0.1% Libya 47 1.3%Kalyoubia 27 0.1% Sharkia 6 0.2%Suez 23 0.1% Dakahlia 6 0.2%Qena 12 0.0% Matruh 4 0.1%N/A 73 0.2% Gharbia 3 0.1%
Total 2,742 8.7% Damietta 2 0.1%Monufia 2 0.0%
* (For Foreigner) Where did you stay last night? ** Detail of "Others"Q4.3 Estimate Ratio Q4.3others Estimate Ratio
(Person/3w ) (Person/3w )1.Hotel 1,079 32% Rented Apartment 933 27%2.House of relatives/friends 1,291 38% Alexandria's Port 49 1%3.Others 1,022 30% Car 13 0%
Total 3,393 100% Hostel 11 0%Transit to Libya 9 0%N/A 7 0%
** Detail of "1.Hotel" Total 1,022 30%1.Hotel Estimate Ratio
(Person/3w ) * Travel alone or notHilton Green Plaza 354 33% Q6 Estimate RatioRadisson Blu 148 14% (Person/3w )Sheraton Montazah 101 9% 1.Alone 18,232 52%Africana 76 7% 2.w ith colleague/family/friend/group 16,826 48%Regency 54 5% Total 35,058 100%Four Seasons 49 5%Sheraton Montaza 40 4%Plaza 39 4% ** Average the number of "colleague/family/friend/group."Lagoon Alex Resort & Spa 33 3% Q6 AveragePorto Marina 30 3% 2.w ith colleague/family/friend/group 2.20 personsHelnan Palestine 29 3%Mercure 25 2%Acacia 15 1%El Haram 13 1%Kaoud 13 1%Adam 9 1%Mirage 7 1%Conrad Hotel Cairo 7 1%Intercontinental Citystars Cairo 6 1%Union 6 1%Hilton Borg El Arab 5 0%EL-Salamlek 5 0%Maritim Jolie ville 4 0%Semiramis Intercontinental Hote 2 0%N/A 9 1%
Total 1,079 100%

Special Assistance for Project Implementation (SAPI) for Borg El Arab International Airport Modernization Project
Chapter 4 Air Traffic Demand Forecast - Final Report -
4-28
* Purpose ** Detail of "Others"Q5 Estimate Ratio Q5others Estimate Ratio
(Person/3w ) (Person/3w )1.Vacation 2,952 8% Back to Home tow n 432 1.2%2.Business 3,083 9% Conference 149 0.4%3.Pilgrimage 14,051 40% Studying 77 0.2%4.Overseas Contract Worker 8,402 24% Transit In Egypt 20 0.1%5.Archaeology 15 0% N/A 123 0.3%6.Visiting friends or relatives 5,753 16% Total 802 2.3%7.Others 802 2%
Total 35,058 100%
Purpose by NationalityQ5 Estimate Ratio
Egyptian Foreigner Egyptian Foreigner1.Vacation 2,121 831 7% 24%2.Business 2,075 1,008 7% 29%3.Pilgrimage 14,046 5 45% 0%4.Overseas Contract Worker 8,391 11 27% 0%5.Archaeology 6 9 0% 0%6.Visiting friends or relatives 4,735 1,018 15% 29%7.Others 174 628 1% 18%
Total 31,548 3,510 100% 100%
Purpose by destination (Person/3w )1.Vacation 2.Business 3.Pilgrimage 4.Overseas 5.Archaeology 6.Visiting 7.Others Total
Total 2,952 3,083 14,051 8,402 15 5,753 802 35,058Jeddah 406 264 13,744 1,222 932 114 16,683Kuw ait 573 775 20 2,431 1,502 56 5,357Abu Dhabi 251 383 1,387 6 713 200 2,939Riyadh 137 137 6 1,143 861 98 2,382Dubai 411 347 760 465 99 2,082Doha 309 464 476 9 356 81 1,695Istanbul 638 448 90 60 175 80 1,491Amman 91 54 261 216 39 662Bahrain 58 48 275 242 3 625Dammam 117 23 172 127 32 471Medinah 63 28 90 84 40 305Cairo- Taif 3 77 18 20 118
1.Vacation 2.Business 3.Pilgrimage 4.Overseas 5.Archaeology 6.Visiting 7.Others TotalTotal 8% 9% 40% 24% 0% 16% 2% 100%
Jeddah 2% 2% 82% 7% 6% 1% 100%Kuw ait 11% 14% 0% 45% 28% 1% 100%Abu Dhabi 9% 13% 47% 0% 24% 7% 100%Riyadh 6% 6% 0% 48% 36% 4% 100%Dubai 20% 17% 36% 22% 5% 100%Doha 18% 27% 28% 1% 21% 5% 100%Istanbul 43% 30% 6% 4% 12% 5% 100%Amman 14% 8% 39% 33% 6% 100%Bahrain 9% 8% 44% 39% 0% 100%Dammam 25% 5% 37% 27% 7% 100%Medinah 21% 9% 30% 28% 13% 100%Cairo- Taif 2% 65% 15% 17% 100%

Special Assistance for Project Implementation (SAPI) for Borg El Arab International Airport Modernization Project
Chapter 4 Air Traffic Demand Forecast - Final Report -
4-29
4.2.5. Socio-Economic Indices
1) GDP
For the purpose of this Draft Final Report, the weighted GDP value of eleven major foreign countries has been defined as one of the explanatory indices for passenger demand forecast. GDP of foreign countries have been weighted by average number of passengers to/from eleven (11) major countries, namely Russian Federation, Germany, United Kingdom, Italy, France, United States of America, Saudi Arabia, Kuwait, Libyan Arab Jamahiriya, Jordan and Syrian Arab Republic. It should be noted that the majority (i.e. 60%) of all international passengers in Egypt have been originated from or destined to these eleven (11) countries.
The Egyptian GDP and the weighted Foreign GDP (Constant Price) defined above are shown in Figure 4.2-15.
0
500
1,000
1,500
2,000
2,500
3,000
3,500
0
100
200
300
400
500
600
700
1995 1996 1997 1998 1999 2000 2001 2002 2003 2004 2005 2006 2007 2008 2009 2010
Egyptian GDP
Foreign GDP
Egyptian GDP constant price at 2002(Bil.EGP)
Foreign GDP constant price at 2010 (Bil.USD)
5.1%
1.2%
-15%
-10%
-5%
0%
5%
10%
15%
20%
1995 1996 1997 1998 1999 2000 2001 2002 2003 2004 2005 2006 2007 2008 2009 2010
Egyptian GDP
Foreign GDP
Growth rate
[Source] IMF World Economic Outlook Database (September 2011 Edition)
Figure 4.2-15 GDP (Constant Price) and GDP Growth Rate

Special Assistance for Project Implementation (SAPI) for Borg El Arab International Airport Modernization Project
Chapter 4 Air Traffic Demand Forecast - Final Report -
4-30
The Egyptian GDP tends to increase consistently with an average annual growth rate of 5.3% between 1995 and 2010. More specifically, the average annual growth rate between 2003 and 2010 was 5.6% which was a little bit higher than that between 1995 and 2002 (5.2%).
On the other hand, the weighted foreign GDP decreased until 2002, but afterwards, it tends to increase. One reason for the decrease until 2002 was presumably the fluctuation of currency exchange rate in each country against USD. The average annual growth rate of weighted foreign GDP between 2003 and 2010 was 5.0% despite the negative economic growth during the world financial crisis in 2008 and 2009.
2) Population
The population in Egypt has almost reached 80 million in 2010, at the average annual growth rate of 2.2 % between 2000 and 2010.
The population in Lower Egypt, which is the catchment area of Borg El Arab International Airport, was 38 million in 2010. This is nearly the half of Egypt’s entire population. The growth rate in the Lower Egypt was similar to the growth rate for the entire Egypt. The region with the highest population growth at 4.9 % was Sinai.
31 31 32 33 33 34 34 35 36 37 38
12 13 13 13 13 14 14 14 15 15 15
19 19 20 20 21 21 21 22 22 23 23
0
10
20
30
40
50
60
70
80
90
2000 2001 2002 2003 2004 2005 2006 2007 2008 2009 2010
Sinai
Canal
Upper Egypt
Middle Egypt
Lower Egypt
(Million person)
[Source] Statistical year book
Figure 4.2-16 Population by Area in Egypt

Special Assistance for Project Implementation (SAPI) for Borg El Arab International Airport Modernization Project
Chapter 4 Air Traffic Demand Forecast - Final Report -
4-31
4.3. Annual Air Passenger Demand Forecast
4.3.1. Procedure of Air Traffic Demand Forecast
Figure 4.3-1 represents the procedure used for the air traffic demand forecast discussed in this Chapter.
As shown, the latest trend of air traffic and socio-economic indicators have been incorporated in this forecast.
Figure 4.3-1 Procedure of Air Passenger Demand Forecast in SAPI
Table 4.3-1 Improvement to the SAPROF Study Method Top-down Analysis Bottom-up Analysis
Selected explanatory variables for this forecast model consist of the weighted foreign GDP, Dummy variables and Egyptian GDP.
An airport model, which computes the ratio of Alexandria’s airports to Egypt’s aviation activity, is developed.
Domestic traffic forecast is based on the prospects (business plan) of Egypt Air Express (same as for the Bottom-up analysis).
Air passenger demand is forecasted in respect of the three groups of passengers, namely, Int’l Egyptian, Int’l Tourist, and Domestic.
Int’l Egyptian forecast is focused on the passenger demand in the Nile Delta. With the airport selection model, the probability of selecting one of Alexandria’s airports is computed.
The number of Int’l tourist is calculated by a forecast model, which is using chronological data.
Top-down analysis Bottom-up analysis(Egypt driven) (Alexandria driven)
Forecast of air passenger of Egypt Forecast Model
Forecast of air passenger of Alexandria
Forecast Model(Cairo etc/ Red Sea/
Alexandria)
*Explanatory variableEgyptian GDPForeign GDPDummy variables
Forecast of Int’l Egyptianair passenger in Lower & Middle Egypt (Nile Delta)
Future ratio of air passenger of Alexandria to the
whole Egypt
*Alexandria ratio gradates in the future
Domestic
International
Prospects of Egypt Air Express
(Distribution)
Forecast Model
*Explanatory variablePopulation in Nile DeltaEgyptian GDP per Capita
Airport Selection Model (Cairo/ Alex)
*Explanatory variableAir fare (considering LCC)Frequency
Forecast of Int’l Egyptian air passenger of
Alexandria
Forecast of Int’l Foreign air passenger of
Alexandria
Forecast of Domesticair passenger of
Alexandria
Forecast Model
*Explanatory variableEgyptian GDP

Special Assistance for Project Implementation (SAPI) for Borg El Arab International Airport Modernization Project
Chapter 4 Air Traffic Demand Forecast - Final Report -
4-32
Air cargo volume has been forecasted by qualitative analysis based on an interview survey. At present, only a few air cargo is handled in Alexandria airports and data to develop a reliable forecast model are not available.
4.3.2. Top-down Analysis
1) Forecast of Air Passengers for Egypt
a) Forecast Model
The forecast model of air passengers for Egypt (named as “Egypt Model”) is as follows:
Forecast Model
Yt : The number of air passengers for entire Egypt in the year t (persons)
X1t : Egyptian GDP in the year t (Bill.EGP) X2t : Weighted Foreign GDP in the year t (Bill.USD)
X3t : Dummy variable in the year t (0 or 1)
a,bj : coefficients
The coefficients (a, b) have been estimated through regression analysis based on the relationship between the number of air passengers for the entire Egypt (Y: dependent variable) and explanatory variables, consisting of the weighted Foreign GDP, a Dummy variable and the Egyptian GDP (X: independent variables).
Data for estimating the coefficients and the results are shown in Table 4.3-2. A dummy variable is used to represent the occurrence of internal events in Egypt and to measure their impacts.
Table 4.3-2 Data for Estimating Coefficients (Egypt Model) t Y X1 X2 X3
Year Passenger Egyptian Foreign Dummy Actual GDP GDP Internal Event (persons) (Bill.EGP) (Bill.USD)
1995 11,221,542 266 1,890 0 1996 12,888,428 278 1,880 0 1997 13,561,469 295 1,807 0 1998 11,668,477 317 1,677 1 1999 16,557,273 337 1,722 0 2000 20,533,553 355 1,724 0 2001 17,608,240 367 1,601 0 2002 18,121,017 379 1,409 0 2003 19,102,572 391 1,542 0 2004 23,907,179 407 1,661 0 2005 24,811,467 425 1,902 0 2006 25,801,449 454 2,055 1 2007 30,609,671 487 2,074 0 2008 35,769,424 521 2,176 0 2009 34,834,746 546 2,147 0 2010 40,067,135 574 2,173 0
tjjj
t XbaY ⋅+= ∑

Special Assistance for Project Implementation (SAPI) for Borg El Arab International Airport Modernization Project
Chapter 4 Air Traffic Demand Forecast - Final Report -
4-33
Table 4.3-3 Result of Coefficients Estimation (Egypt Model) a b1 b2 b3 Constant Egyptian GDP Foreign GDP Dummy
Coefficient -21,689,155 83,436 5,981 -2,921,823 (t-value) (-9.1) (20.3) (3.6) (-3.3)
Correlation Coefficient: 0.9933 *t-value: a t-value corresponding to a coefficient estimate is a statistical measure of the confidence in the estimate. If the absolute value of t-value is more than approximately 2.0, it can be judged that an estimated coefficient is statistically significant.
0
5,000
10,000
15,000
20,000
25,000
30,000
35,000
40,000
45,000
1995 1996 1997 1998 1999 2000 2001 2002 2003 2004 2005 2006 2007 2008 2009 2010
Actual
Estimate
(Thousands.person) Egypt Model
Figure 4.3-2 Comparison of Actual Passenger and Estimated
b) Future Assumption
Future values for explanatory variables (X) are set as follows.
Table 4.3-4 Future values for Explanatory Variables (Egypt Model) t X1 X2 X3
Year Egyptian Foreign Dummy GDP Growth GDP Growth Internal (Bill.EGP) rate (Bill.USD) rate
2006 454 6.8% 2,055 8.1% 1 2007 487 7.1% 2,074 0.9% 0 2008 521 7.2% 2,176 4.9% 0 2009 546 4.7% 2,147 -1.3% 0 2010 574 5.1% 2,173 1.2% 0 2011 581 1.2% 2,316 6.6% 1 2012 591 1.8% 2,363 2.0% 0 2013 615 4.0% 2,408 1.9% 0 2014 650 5.8% 2,458 2.1% 0 2015 692 6.4% 2,510 2.1% 0 2016 737 6.5% 2,565 2.2% 0 2017 778 5.5% 2,596 1.2% 0 2018 820 5.5% 2,627 1.2% 0 2019 865 5.5% 2,659 1.2% 0 2020 913 5.5% 2,690 1.2% 0
[Source] IMF World Economic Outlook Database (September 2011 Edition)

Special Assistance for Project Implementation (SAPI) for Borg El Arab International Airport Modernization Project
Chapter 4 Air Traffic Demand Forecast - Final Report -
4-34
The future Egyptian GDP and Foreign GDP have been set based on the outlook by the International Monetary Fund (IMF) until 2016. The Foreign GDP is an integrated value, which is computed by the weighted average of the numbers of tourists of major Origin & Destination countries. The values of IMF are useful, because the GDP for each country is obtained from one data source. In the calculation of the future Foreign GDP, the number of tourists has been assumed to be constant and the latest value has used (i.e. it has been assumed that the latest weight would remain steady in future).
The World Bank also has published its outlook on the future Egyptian GDP growth rate as shown in the Table below, but the outlook published by IMF after the World Bank has been adopted as the latest trend.
Table 4.3-5 Future Egyptian GDP Growth Rate 2011 2012 2013 2014 2015 2016 Published in IMF 1.2% 1.8% 4.0% 5.8% 6.4% 6.5% Sep.2011 World Bank 1.0% 3.5% 5.0% Jun.2011
The chronological change and future assumption of Egyptian GDP growth rates are shown in Table 4.3-6. It should be noted that in the past there was economic cycle periodically in 5 years but the average annual growth rate for 10 years was kept at approximately 5.0%.
Therefore, it has been assumed that the GDP growth rates until 2016 would follow the outlook of IMF, while those beyond 2017 have been set at 5.5 % so that the average annual growth rate between 2011 and 2020 would become around 5.0% (the Medium case).
Table 4.3-6 Chronological change /future assumption of Egyptian GDP growth rates t Egyptian Year-on-Year Average Annual Growth Rate
GDP 5 years 10 years 10 years (Bill.EGP)
Actual 1996 278 4.9%
1997 295 5.9% 1998 317 7.5% 1999 337 6.1% 2000 355 5.4% 6.2% 2001 367 3.5% 2002 379 3.2% 2003 391 3.2% 2004 407 4.1% 2005 425 4.5% 3.7% 4.8% 2006 454 6.8% 2007 487 7.1% 2008 521 7.2% 2009 546 4.7% 2010 574 5.1% 6.0% 5.1%
Predicted 2011 581 1.2% by IMF 2012 591 1.8%
2013 615 4.0% 2014 650 5.8% 2015 692 6.4% 4.5% 4.8% 2016 737 6.5%
Assumption 2017 778 5.5%
2018 820 5.5% 2019 865 5.5% 2020 913 5.5% 5.2%

Special Assistance for Project Implementation (SAPI) for Borg El Arab International Airport Modernization Project
Chapter 4 Air Traffic Demand Forecast - Final Report -
4-35
A sensitive analysis has been conducted by changing the assumption for the future GDP growth rate. A GDP with a 1.0% lower and higher growth rates than the Medium case have been defined as the “Low case” and the “High case” respectively.
A dummy variable has been applied to the year 2011 to represent the decrease in air traffic demand due to the outbreak of the Egyptian Revolution 2011.
It should be noted that an estimation of the future economic indices beyond 2020 is considered not reliable. For the purpose of approximation in this Study, the air traffic demand after 2020 has been assumed to increase every year by an annual air traffic average increment in the previous ten years (from 2020 to 2030), thus the annual increase after year 2020 is set constant.
c) Result
Based on the demand forecasting models as well as the assumed future socio-economic indices described above, the future air passenger demand in whole Egypt has been forecasted as follows.
0
20,000
40,000
60,000
80,000
100,000
120,000
140,000
160,000
1995 2000 2005 2010 2015 2020 2025 2030
ActualForecast HighForecast Med.Forecast LowForecast ICAOForecast ACI
(Thousands.person) EGYPT
Figure 4.3-3 Result of Air Passenger Forecast in Whole Egypt
For reference the growth rates forecasts published by International Institutions are also shown in this Figure.

Special Assistance for Project Implementation (SAPI) for Borg El Arab International Airport Modernization Project
Chapter 4 Air Traffic Demand Forecast - Final Report -
4-36
Table 4.3-7 Air Passenger Growth Rates forecasted by ICAO and ACI ICAO ACI
2008-2012 5.7% 2009-2014 8.4%
2012-2028 6.9% 2009-2029 6.1%
Africa Egypt Int’l Passenger [Source] ICAO: Africa-Indian Ocean Regional Traffic Forecasts 2008-2028
ACI: GLOBAL TRAFFIC FORECAST 2010 - 2029
2) Air Passenger Forecast for Alexandria
a) Forecast Model
The forecast model for computing the ratio of aviation activity in Alexandria to Egypt (“Airport Model”) is as follows:
Forecast Model
Sit : Ratio of air passenger at i airport in the year t (%)
Yit : The number of air passenger at i airport in the year t (persons) X1t : Egyptian GDP in the year t (Bill.EGP) X2t : Foreign GDP in the year t (Bill.USD)
X3t : Dummy variable in the year t (0 or 1)
ai,bij : coefficients
The coefficients (a and b) have been estimated by a regression analysis based on the relationship between air passenger number (Y) for each airport and economic indices (X). The explanatory variables (X) are the same as those in the Egypt Model i.e. Egyptian GDP, Foreign GDP and a dummy variable. The dummy variable has been excluded from the formula for Alexandria, because the internal events as observed seemed no effects on the traffic at Alexandria.
The airports in Egypt are differentiated into three categories based on their features: ”Cairo etc.”, “Red Sea (Sharm El-Sheikh and Hurghada)” and “Alexandria (Alexandria and Borg El Arab)”. Comparing air passenger growth rate from 2003 to 2010 at each category, it has been recognized that the growth rate of Sharm El-Shiekh was similar to that of Hurghada, and that the growth rate of Cairo was similar to that of the other airport as shown in the Table 4.3-1.
The coefficients (a and b) have been estimated according to these categories.
Data for estimating the coefficients and the results are shown in Table 4.3-8.
tjijj
iit XbaY ⋅+= ∑
∑=
iit
itit Y
YS

Special Assistance for Project Implementation (SAPI) for Borg El Arab International Airport Modernization Project
Chapter 4 Air Traffic Demand Forecast - Final Report -
4-37
Table 4.3-8 Data for Estimating Coefficients (Airport Model) t Y1 Y2 Y3 X1 X2 X3
Year Cairo etc Red Sea Alexandria Egyptian Foreign Dummy GDP GDP Internal (persons) (persons) (persons) (Bill.EGP) (Bill.USD)
1995 9,225,419 1,746,081 250,042 266 1,890 0 1996 10,427,023 2,201,211 260,194 278 1,880 0 1997 10,909,257 2,367,527 284,685 295 1,807 0 1998 9,131,425 2,247,134 289,918 317 1,677 1 1999 12,462,100 3,769,964 325,209 337 1,722 0 2000 14,900,293 5,286,732 346,528 355 1,724 0 2001 12,247,795 4,995,014 365,431 367 1,601 0 2002 11,743,223 5,955,989 421,805 379 1,409 0 2003 11,838,320 6,815,162 449,090 391 1,542 0 2004 14,250,503 9,165,309 491,367 407 1,661 0 2005 14,928,144 9,274,111 609,212 425 1,902 0 2006 15,113,172 9,885,235 803,042 454 2,055 1 2007 17,287,008 12,360,271 962,392 487 2,074 0 2008 19,990,890 14,488,439 1,290,095 521 2,176 0 2009 19,217,929 14,147,758 1,469,059 546 2,147 0 2010 21,643,024 16,742,128 1,681,983 574 2,173 0
Table 4.3-9 Result of Coefficients Estimation (Airport Model) Correlation a b1 b2 b3 Coefficient Constant Egyptian GDP Foreign GDP Dummy Cairo etc 0.9749 Coefficient -5,179,106 32,017 3,634 -1,830,089 (t-value) (-2.7) (9.6) (2.7) (-2.5)Red Sea 0.9932 Coefficient -14,614,763 47,702 1,770 -1,023,538 (t-value) (-11.4) (21.4) (2.0) (-2.1)Alexandria 0.9751 Coefficient -1,893,914 3,751 564 (t-value) (-8.4) (9.7) (3.6)

Special Assistance for Project Implementation (SAPI) for Borg El Arab International Airport Modernization Project
Chapter 4 Air Traffic Demand Forecast - Final Report -
4-38
0
5,000
10,000
15,000
20,000
25,000
1995 1996 1997 1998 1999 2000 2001 2002 2003 2004 2005 2006 2007 2008 2009 2010
ActualEstimate
(Thousands.person) Cairo etc Model
0
5,000
10,000
15,000
20,000
1995 1996 1997 1998 1999 2000 2001 2002 2003 2004 2005 2006 2007 2008 2009 2010
ActualEstimate
(Thousands.person) Red Sea (SSH / HRG) Model
0
500
1,000
1,500
2,000
1995 1996 1997 1998 1999 2000 2001 2002 2003 2004 2005 2006 2007 2008 2009 2010
ActualEstimate
(Thousands.person) Alexandria Model
Figure 4.3-4 Comparison of Actual Passenger and Estimated

Special Assistance for Project Implementation (SAPI) for Borg El Arab International Airport Modernization Project
Chapter 4 Air Traffic Demand Forecast - Final Report -
4-39
b) Future Assumption
Same as “Egypt Model”
c) Result
The air passengers ratio is computed by dividing the passengers at Alexandria’s airport by the sum of passengers of each passenger category. The results shows that the calculated ratio increases gradually from 4,2% in 2010 to 4,6% in 2030.
The air passenger in Alexandria airports is forecasted by multiplying the ratio of Alexandria’s airports with the air passenger of Egypt, which are calculated with the “Egypt Model”.
The following figures show the results of the passenger ratio for each airport category and the future passenger demand in Alexandria by Top-down analysis.
1.7 2.1 2.3 2.4 2.1 2.5 3.1 3.1 3.6 4.2 4.2 4.6 4.3 4.4 4.4 4.5 4.5 4.5 4.5 4.5 4.5 4.5 4.5 4.6 4.6 4.6 4.6 4.6 4.6 4.6 4.6
0
10
20
30
40
50
60
70
80
90
100
2000 2005 2010 2015 2020 2025 2030
Cairo etc Actual
Cairo etc Forecast
Red Sea Actual
Red Sea Forecast
Alexandria Actual
Alexandria Forecast
%
Figure 4.3-5 Future ratio of Air Passenger by Airport (Medium case)

Special Assistance for Project Implementation (SAPI) for Borg El Arab International Airport Modernization Project
Chapter 4 Air Traffic Demand Forecast - Final Report -
4-40
1,6821,924
3,743
6,072
3,246
5,016
710
1,785
2,791
4,058
0
1,000
2,000
3,000
4,000
5,000
6,000
7,000
2005 2010 2015 2020 2025 2030
Actual ALY+HBE
Actual HBE
Forecast High
Forecast Med.
Forecast Low
(Thousands.person) Alexandria Region
Figure 4.3-6 Air Passenger Forecast in Alexandria Region (Top-down)
4.3.3. Bottom-up Analysis
In the Bottom-up Analysis, the air passengers have been differentiated into three groups: 1) International Egyptian Air Passengers, 2) International Foreign Air Passengers, and 3) Domestic Air Passengers. These three passenger types are to be forecasted separately and finally to be summed up.
Alexandria airports have been mainly used by 1) International Egyptian Air Passenger. Hence, the forecast for this passenger category have great effects on the whole bottom-up analysis.
1) Forecast of Int’l Egyptian Air Passenger
a) Estimation of Int’l Egyptian Air Passengers in Lower /Middle Egypt
The catchment area of Borg El Arab International Airport is assumed to be the area of Lower /Middle Egypt based on the results of passenger survey. The number of Int’l Egyptian air passengers are estimated based on the following formulas:
Int’l Egyptian air passengers = Int’l air passengers in Egypt - (Tourist Arrivals by Air *2)
Int’l Egyptian air passengers in Lower /Middle Egypt = Int’l Egyptian air passengers - Int’l Egyptian air passengers in Upper Egypt (Luxor and Aswan airports)

Special Assistance for Project Implementation (SAPI) for Borg El Arab International Airport Modernization Project
Chapter 4 Air Traffic Demand Forecast - Final Report -
4-41
Table 4.3-10 Estimation of Int’l Egyptian Air Passengers in Lower /Middle Egypt t Whole Egypt
Year Whole Intl Tourist Arrival by Air
Intl Egyptian Air Passenger Dep + Arr 1) 2) 3) = 2)*2 4) = 1) - 3)
2001 11,513,925 3,800,000 7,600,000 3,913,925 2002 12,464,172 4,280,000 8,560,000 3,904,172 2003 13,533,738 4,841,000 9,682,000 3,851,738 2004 17,715,570 6,736,000 13,472,000 4,243,570 2005 18,631,565 7,210,000 14,420,000 4,211,565 2006 19,991,049 7,611,000 15,222,000 4,769,049 2007 23,414,344 9,436,000 18,872,000 4,542,344 2008 27,218,006 10,960,000 21,920,000 5,298,006 2009 27,058,111 10,774,000 21,548,000 5,510,111 2010 31,183,478 12,616,000 25,232,000 5,951,478
(person)t Upper Egypt Intl Egyptian
Passenger in Lower /Middle
Year Luxor Aswan Egyptian Egyptian 25% 20% Egypt
5) 6) =5)*25% 7) 8) = 7)*20% 9) = 4)- 6)-8) 2001 1,053,044 263,261 20,320 4,064 3,646,600 2002 811,060 202,765 28,755 5,751 3,695,656 2003 919,537 229,884 52,055 10,411 3,611,443 2004 1,234,892 308,723 100,544 20,109 3,914,738 2005 1,450,328 362,582 69,072 13,814 3,835,169 2006 1,278,240 319,560 56,143 11,229 4,438,260 2007 1,076,892 269,223 51,181 10,236 4,262,885 2008 1,130,275 282,569 44,324 8,865 5,006,572 2009 971,187 242,797 25,613 5,123 5,262,192 2010 946,129 236,532 32,734 6,547 5,708,399
*Ratios of Egyptian in Luxor and Aswan are based on the ratio in the year 2010 which were 25% and 20% respectively
b) Forecast Model
The forecast model for International Egyptian air passengers in Lower/Middle Egypt (“Egyptian Model”) is as follows:
Forecast Model
Yt : The number of International Egyptian air passenger in Lower/Middle Egypt in the
year t (persons) POPt : The population in Lower/Middle Egypt in the year t (persons)
Xt : Egyptian GDP per Capita in the year t (EGP/person)
a,b : coefficients
The coefficients (a, b) have been estimated through regression analysis based on the relationship between the air passengers (Y) and economic indices (X) such as the population in this area and Egyptian GDP per Capita.
Data for estimating coefficients and the results are shown in the tables below.
)( ttt XbaPOPY ⋅+⋅=

Special Assistance for Project Implementation (SAPI) for Borg El Arab International Airport Modernization Project
Chapter 4 Air Traffic Demand Forecast - Final Report -
4-42
Table 4.3-11 Data for Estimating Coefficients (Egyptian Model) t Y X
Year Intl Egyptian Population Egyptian passenger Egyptian GDP Passenger per capita per capita (persons) (persons) (persons) (EGP/person)
2001 3,646,600 43,958,938 0.0830 5,623 2002 3,695,656 44,791,600 0.0825 5,687 2003 3,611,443 45,646,281 0.0791 5,753 2004 3,914,738 46,476,757 0.0842 5,876 2005 3,835,169 47,390,322 0.0809 6,018 2006 4,438,260 48,259,733 0.0920 6,309 2007 4,262,885 49,547,606 0.0860 6,606 2008 5,006,572 50,533,789 0.0991 6,933 2009 5,262,192 51,598,724 0.1020 7,103 2010 5,708,399 53,359,000 0.1070 7,208
Table 4.3-12 Result of Coefficients Estimation (Egyptian Model) Correlation a b
Coefficient Constant Egyptian GDP per Capita
Egyptian Model 0.9237 Coefficient -4.413E-03 1.489E-05 (t-value) (-0.3) (6.8)
0
1,000
2,000
3,000
4,000
5,000
6,000
7,000
2001 2002 2003 2004 2005 2006 2007 2008 2009 2010
Actual
Estimate
(Thousands.person) Egyptian Model
Figure 4.3-7 Comparison of Actual and Estimated Passengers
c) Future Assumption for Egyptian Model
Egyptian GDP per Capita is computed by the following formula:
Egyptian GDP per Capita = Egyptian GDP / the population in entire Egypt
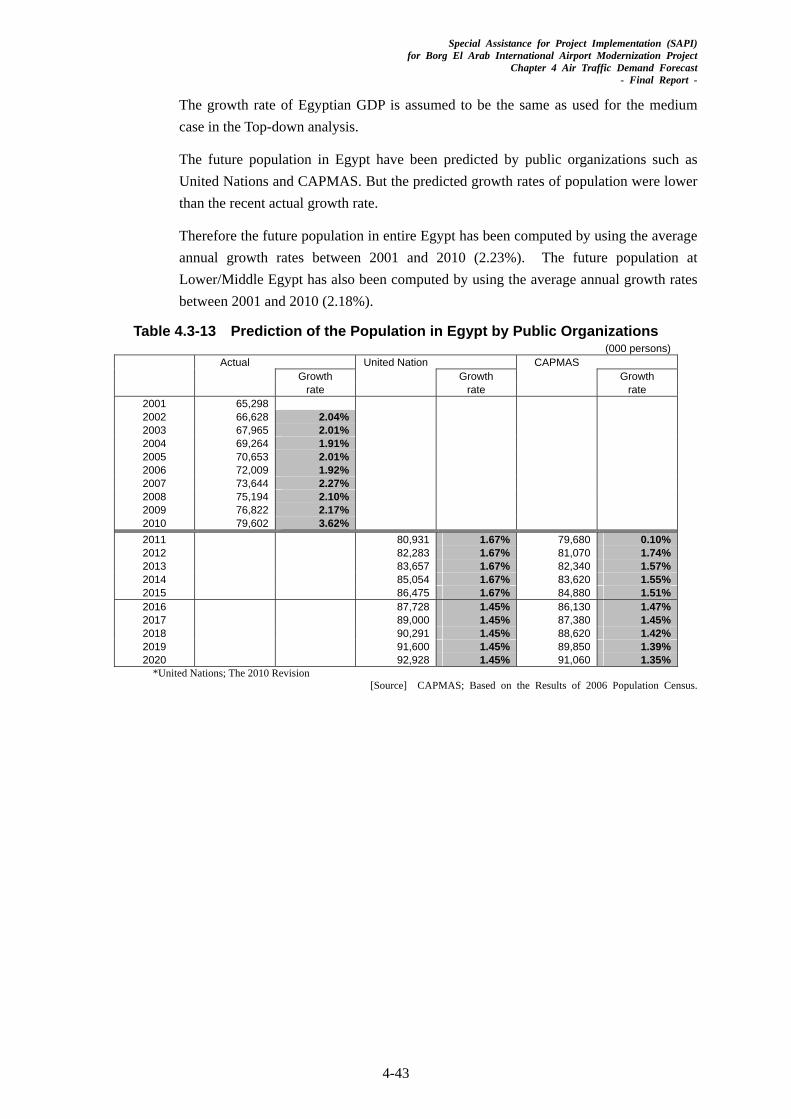
Special Assistance for Project Implementation (SAPI) for Borg El Arab International Airport Modernization Project
Chapter 4 Air Traffic Demand Forecast - Final Report -
4-43
The growth rate of Egyptian GDP is assumed to be the same as used for the medium case in the Top-down analysis.
The future population in Egypt have been predicted by public organizations such as United Nations and CAPMAS. But the predicted growth rates of population were lower than the recent actual growth rate.
Therefore the future population in entire Egypt has been computed by using the average annual growth rates between 2001 and 2010 (2.23%). The future population at Lower/Middle Egypt has also been computed by using the average annual growth rates between 2001 and 2010 (2.18%).
Table 4.3-13 Prediction of the Population in Egypt by Public Organizations (000 persons)
Actual United Nation CAPMAS Growth Growth Growth rate rate rate
2001 65,298 2002 66,628 2.04% 2003 67,965 2.01% 2004 69,264 1.91% 2005 70,653 2.01% 2006 72,009 1.92% 2007 73,644 2.27% 2008 75,194 2.10% 2009 76,822 2.17% 2010 79,602 3.62% 2011 80,931 1.67% 79,680 0.10%2012 82,283 1.67% 81,070 1.74%2013 83,657 1.67% 82,340 1.57%2014 85,054 1.67% 83,620 1.55%2015 86,475 1.67% 84,880 1.51%2016 87,728 1.45% 86,130 1.47%2017 89,000 1.45% 87,380 1.45%2018 90,291 1.45% 88,620 1.42%2019 91,600 1.45% 89,850 1.39%2020 92,928 1.45% 91,060 1.35%
*United Nations; The 2010 Revision [Source] CAPMAS; Based on the Results of 2006 Population Census.

Special Assistance for Project Implementation (SAPI) for Borg El Arab International Airport Modernization Project
Chapter 4 Air Traffic Demand Forecast - Final Report -
4-44
Table 4.3-14 Future Values for Explanatory Variables (Egyptian Model) t Population X
Year Entire Egypt Lower/
Middle Egyptian EG GDP
Growth Egypt Growth GDP Growth per Captia Growth (person) rate (person) rate (Bill.EGP) rate (EGP) rate
2001 65,298,293 43,958,938 367 5,623 2002 66,627,610 2.04% 44,791,600 1.89% 379 3.2% 5,687 1.1%2003 67,965,096 2.01% 45,646,281 1.91% 391 3.2% 5,753 1.2%2004 69,263,902 1.91% 46,476,757 1.82% 407 4.1% 5,876 2.1%2005 70,653,326 2.01% 47,390,322 1.97% 425 4.5% 6,018 2.4%2006 72,008,901 1.92% 48,259,733 1.83% 454 6.8% 6,309 4.8%2007 73,643,587 2.27% 49,547,606 2.67% 487 7.1% 6,606 4.7%2008 75,193,567 2.10% 50,533,789 1.99% 521 7.2% 6,933 4.9%2009 76,822,251 2.17% 51,598,724 2.11% 546 4.7% 7,103 2.5%2010 79,602,000 3.62% 53,359,000 3.41% 574 5.1% 7,208 1.5%
2011 81,373,313 2.23% 54,520,377 2.18% 581 1.2% 7,136 -1.0%2012 83,184,041 2.23% 55,707,031 2.18% 591 1.8% 7,106 -0.4%2013 85,035,061 2.23% 56,919,513 2.18% 615 4.0% 7,229 1.7%2014 86,927,271 2.23% 58,158,386 2.18% 650 5.8% 7,482 3.5%2015 88,861,587 2.23% 59,424,223 2.18% 692 6.4% 7,788 4.1%2016 90,838,945 2.23% 60,717,611 2.18% 737 6.5% 8,113 4.2%2017 92,860,303 2.23% 62,039,150 2.18% 778 5.5% 8,373 3.2%2018 94,926,641 2.23% 63,389,453 2.18% 820 5.5% 8,642 3.2%2019 97,038,959 2.23% 64,769,146 2.18% 865 5.5% 8,918 3.2%2020 99,198,281 2.23% 66,178,869 2.18% 913 5.5% 9,204 3.2%
d) Forecast of Int’l Egyptian Air Passenger in Lower /Middle Egypt
Based on the future explanatory variables as well as the forecasting model, the number of future Int’l Egyptian air passengers in Lower /Middle Egypt has been forecasted as follows.
0
2,000
4,000
6,000
8,000
10,000
12,000
14,000
2000 2005 2010 2015 2020 2025 2030
Actual
Forecast
(Thousands.person) Egyptian
Figure 4.3-8 Forecast Int’l Egyptian Air Passengers in Lower /Middle Egypt

Special Assistance for Project Implementation (SAPI) for Borg El Arab International Airport Modernization Project
Chapter 4 Air Traffic Demand Forecast - Final Report -
4-45
e) Airport Selection Model
To develop a forecast model to compute the selection probability between Alexandria airports and Cairo airport (“Airport Selection Model”) , the logistic regression has been applied as illustrated below.
Forecast Model
Pit : Selection probability of i airport in the year t (%) Uit : Utility function of selecting i airport in the year t (index) e : exponential
Xi1t : International Air fare of i airport in the year t (index) Xi2t : International flight frequency of i airport in the year t (times/day)
bj : coefficients
The explanatory variables of the utility function are the air fare and the frequency considered through the recently increasing Low Cost Carrier activities at Alexandria’s airports.
Data for estimating coefficients and the results are shown below. These are the time-series data of the airport selection ratio, data of the average air fare and the daily frequency for each airport.
Table 4.3-15 Estimation of Airport Selection Probability t Intl Egyptian
Passenger in Lower /Middle
Alexandria Cairo Probability of Airport Selection Year (ALY+HBE)
Egyptian Egyptian Cairo Alexandria Egypt 80% 9) 10) 11) =10)*80% 12) =9)-11) 12) / 9) 11) / 9)
2001 3,646,600 161,087 128,870 3,517,730 96% 4%2002 3,695,656 246,482 197,186 3,498,470 95% 5%2003 3,611,443 246,608 197,286 3,414,156 95% 5%2004 3,914,738 450,455 360,364 3,554,374 91% 9%2005 3,835,169 575,513 460,410 3,374,758 88% 12%2006 4,438,260 774,322 619,458 3,818,803 86% 14%2007 4,262,885 922,288 737,830 3,525,054 83% 17%2008 5,006,572 1,231,058 984,846 4,021,726 80% 20%2009 5,262,192 1,402,917 1,122,334 4,139,858 79% 21%2010 5,708,399 1,593,782 1,275,026 4,433,373 78% 22%
*Ratio of Egyptian in Alexandria was based on the ratio in the year 2010
The ratio for selecting Alexandria airports in the Lower /Middle Egypt Area in 2010 was estimated at 22%. This ratio is largely backed up by comparing the ratio of air ticket sales in the Lower Egypt at Alexandria airports and at Cairo airport, which was roughly 3 to 7 (3:7) as a result of an interview survey from travel agents.
The airfare of LCC is represented as a ratio of LCC airfare to Legacy Carrier airfare. The airfare of Legacy Carrier is regarded as “100”. The integrated airfare is computed by the weighted average of air fares in each airline category and their aircraft
tijjj
it XbU ⋅= ∑
∑=
i
Uit it
itU
eeP

Special Assistance for Project Implementation (SAPI) for Borg El Arab International Airport Modernization Project
Chapter 4 Air Traffic Demand Forecast - Final Report -
4-46
movements.
The natural logarithm (LN) represents the utility of flight frequency.
Coefficients have been estimated based on the data after the year 2005, which was one year after LCC had started operation at Alexandria’s airports.
Table 4.3-16 Explanatory Variables for Establishing Utility Function X1
t Ratio of LCC International Flight Airfare (Discount ratio)
Airfare (Weight Average)
Year Cairo Alexandria (Index) (Index) Legacy Low Cost Legacy Low Cost Legacy Low Cost Cairo Alex
2001 100% 100% 0% 100 100 100 2002 100% 100% 0% 100 100 100 2003 100% 100% 0% 100 100 100 2004 100% 87% 13% 100 44 100 93 2005 100% 83% 17% 100 44 100 91 2006 100% 83% 17% 100 56 100 93 2007 100% 76% 24% 100 63 100 91 2008 100% 69% 31% 100 68 100 90 2009 100% 63% 37% 100 61 100 85 2010 100% 50% 50% 100 56 100 78
X2
t Intl Frequency (Aircraft Movement)
Year Yearly (Times/Year)
Daily (Times/day)
Cairo Alex Cairo Alex 2001
56,599 2,074 155 6 2002 55,287 2,876 151 8 2003 58,036 2,884 159 8 2004 64,895 4,747 178 13 2005 69,568 6,065 191 17 2006 75,348 8,127 206 22 2007 85,106 9,052 233 25 2008 93,889 11,171 257 31 2009 98,305 13,891 269 38 2010 107,505 15,264 295 42
Table 4.3-17 Result of Coefficients Estimation (Utility Function) Correlation b1 b2 Coefficient Air Fare LN(Frequency) Utility function 0.9973 Coefficient -1.929E-02 8.337E-01 (t-value) (-1.9) (13.5)

Special Assistance for Project Implementation (SAPI) for Borg El Arab International Airport Modernization Project
Chapter 4 Air Traffic Demand Forecast - Final Report -
4-47
0%
5%
10%
15%
20%
25%
2001 2002 2003 2004 2005 2006 2007 2008 2009 2010
Actual
Estimate
Selection Probability of Alexandria Airports
Figure 4.3-9 Comparison: Actual Probability of Alexandria Airports and Estimated
f) Future Assumption for Utility function
The future values of the explanatory variables (air fare and frequency), which are substituted into the utility function have been set as follows:
Air Fare: (X1)
The air fare is the integrated index. In the calculation, the following two factors need to be set:
The ratio of the airfare for LCC to Legacy Carrier: Between 2005 and 2010, the ratio of the airfare for LCC was in a range between 40~60 (Average :58) when the airfare for Legacy Carrier is regarded as ”100”. The latest index in 2010 was 56. Therefore, the future ratio of the air fare for LCC has been assumed to be 55, considering the recent trends.
Ratio of LCC flight number: The ratio of the number of LCC International flights in Alexandria’s airports was 50% in 2010. Air Arabia Egypt, the LCC based at Borg El Arab International Airport began to operate in June 2010 and so the current ratio is expected to be larger.
According to an interview survey to Air Arabia Egypt, their principal business plan was as shown below.
Business and marketing plan of Air Arabia Egypt were linked to Air Arabia group.
Air routes of Air Arabia Egypt were being focused on the southern Europe and Middle East.
The number of aircraft are planned to increase one aircraft every year. (Currently, they have two A320 aircraft.)

Special Assistance for Project Implementation (SAPI) for Borg El Arab International Airport Modernization Project
Chapter 4 Air Traffic Demand Forecast - Final Report -
4-48
Considering the business plan of Air Arabia Egypt , which is the most active LCC based at Borg El Arab International Airport as its hub airport, the ratio of the number of LCC international flights in Alexandria will certainly increase. But since the ratio depends on the business plan of each airline, the ratio can vary. Therefore, A sensitive analysis is conducted by changing the assumption for this ratio. The assumption of 60% is defined as “Medium case”. The case, in which the ratio is 5.0% lower, is defined as “Low case”, and “High case” is when the ratio is 5.0% higher.
On the other hand, the ratio of the number of LCC International flights in Cairo International airport has been assumed to remain at the current situation (i.e the ratio is 0%) due to the governmental regulation prohibiting LCCs flight at Cairo International airport.
Frequency: (X2)
The frequency of aircraft movements is generally the output index, which is computed from the forecast air passengers. However, the frequency can also be input and output elements in the competition between two airports, because the frequency is one of the factors for passengers when they select an airport to take a flight.
Therefore, the frequency has been estimated by an convergent calculation until the frequency of output corresponds to the input frequency as shown in Figure 4.3-10.
Air Passenger Forecast
Aircraft Movement Forecast
Airport Selection Model (Cairo/ Alex)
*Explanatory variableAir fare (considering LCC)Frequency
Daily Aircraft Movement
(Frequency)
Output = Input ?
End
Output
Input
Output of Frequency set as the condition of Input
Figure 4.3-10 Procedure of Future Frequency Assumption
The method to forecast the aircraft movements (frequency) at Alexandria’s airports is described in details in the Section 4.5 hereafter.
The future frequency of flights form/to Cairo International Airport has been estimated by dividing the annual passengers of Cairo International Airport, computed by using the growth rate forecasted in the Top-down Analysis for “Cairo etc.” with the number of

Special Assistance for Project Implementation (SAPI) for Borg El Arab International Airport Modernization Project
Chapter 4 Air Traffic Demand Forecast - Final Report -
4-49
passengers per flight.
Daily Frequency in Cairo International Airport = (Annual Passenger Forecast / Passenger per Flight) / 365 days
Future values of the number of passengers per flight have been estimated assuming yearly increase by 1.3% , which is the growth rate between 2000 and 2010 for Cairo International Airport.
g) Forecast of the Probability to select Alexandria Airports
0%
5%
10%
15%
20%
25%
30%
35%
40%
2000 2005 2010 2015 2020
Actual
Forecast High
Forecast Med.
Forecast Low
Figure 4.3-11 Forecast of the Probability to Select Alexandria Airports
h) Forecast of Int’l Egyptian Air Passengers at Alexandria Airports
The International Egyptian air passengers have been computed by multiplying the selection probability of Alexandria airports by the number of air passengers in the Lower /Middle Egypt Area, which have been calculated by the “Egyptian Model”.
The result of the calculation is shown in 4) Sum of each element.

Special Assistance for Project Implementation (SAPI) for Borg El Arab International Airport Modernization Project
Chapter 4 Air Traffic Demand Forecast - Final Report -
4-50
2) Forecast of Int’l Foreign Air Passenger
a) Forecast Model
The forecast model for International foreign air passengers to Alexandria (“Tourist Model”) is as follows:
Forecast Model
Yt :The number of International foreign air passengers to Alexandria in the year t (persons)
Xt : Egyptian GDP in the year t (Bill.EGP)
a,b : coefficients
The coefficients (a, b) have been estimated through regression analysis on the relationship between the air passengers (Y) and Egyptian GDP (X). Data for estimating the coefficients and the results are shown in Table 4.3-16 and Figure 4.3-12.
Since there are no correct time-series data for international foreign tourists available, the number of tourists has been estimated by the following formula:
Int’l foreign air passengers to Alexandria region = Int’l air passengers in Alexandria airports – Int’l Egyptian air passengers in Alexandria airports
Int’l Egyptian air passengers in Alexandria airports in the past have been computed by the ratio of Egyptian in Alexandria (80%) in 2010.
Table 4.3-18 Data for Estimating Coefficients (Tourist Model) Y X
t Int'l air Egyptian Tourist Egyptian GDP Year Passengers in
Alex airports (person) (Bill.EGP) 2001 161,087 128,870 32,217 367 2002 246,482 197,186 49,296 379 2003 246,608 197,286 49,322 391 2004 450,455 360,364 90,091 407 2005 575,513 460,410 115,103 425 2006 774,322 619,458 154,864 454 2007 922,288 737,830 184,458 487 2008 1,231,058 984,846 246,212 521 2009 1,402,917 1,122,334 280,583 546 2010 1,593,782 1,275,026 318,756 574
Table 4.3-19 Result of Coefficients Estimation (Tourist Model) Correlation a b Coefficient Constant Egyptian GDP Tourist Model 0.9979 Coefficient -4.831E+05 1.396E+03 (t-value) (-32.6) (43.4)
tt XbaY ⋅+=

Special Assistance for Project Implementation (SAPI) for Borg El Arab International Airport Modernization Project
Chapter 4 Air Traffic Demand Forecast - Final Report -
4-51
0
50
100
150
200
250
300
350
2001 2002 2003 2004 2005 2006 2007 2008 2009 2010
ActualEstimate
(Thousands.person) Tourist Model
Figure 4.3-12 Comparison of Actual Tourist and Estimated
b) Future Assumption
The future Egyptian GDP assumed in the Top-down analysis has also been used for this analysis and a similar sensitive analysis has been conducted by changing the assumption for the future GDP growth rates.
c) Forecast of Int’l Tourist Air Passengers of Alexandria Airports
International tourist air passengers of Alexandria Airports have been computed by substituting the future Egyptian GDP into the forecast model.
0
200
400
600
800
1,000
1,200
1,400
1,600
1,800
2,000
2000 2005 2010 2015 2020 2025 2030
Actual
Forecast High
Forecast Med.
Forecast Low
(Thousands.person) Tourist
Figure 4.3-13 Forecast of Int’l Tourist Air Passenger of Alexandria Airports

Special Assistance for Project Implementation (SAPI) for Borg El Arab International Airport Modernization Project
Chapter 4 Air Traffic Demand Forecast - Final Report -
4-52
3) Forecast of Domestic Air Passengers
The domestic air passengers have been estimated based on the result of interview survey of Egypt Air Express. At present, domestic air routes are operated by Egypt Air who entrust their operation to Egypt Air Express, which is a subsidiary of Egypt Air. Therefore, the business plan of Egypt Air Express affects the future demand greatly.
The domestic main route is between Alexandria and Cairo, but the usage is low, because Cairo downtown can be reached within three hours by land transportation. Increase in the frequency by using the same smaller aircraft of Egypt Air Express might hopefully create a new demand between Alexandria and Cairo.
The business plan of Egypt Air Express concerning domestic flights is shown in Table 4.3-20 below.
Table 4.3-20 Egypt Air Express Future plan of domestic flight to/from Alexandria Route 2011-2015 2016-2020 2021-2025 Flight / week Cairo 7 14 21 Sharm El-Sheikh 11 10 13 Fleet Cairo 76 76 76 (Number of Seat) Sharm El-Sheikh 76 100 100
The number of future domestic passengers have been computed based on the business plan (route, frequency and fleet) and an average load factor of Egypt Air Express (75%). It has been assumed that the number of flights per week would increase every year so that the total number of weekly flights would reach the target in the five-year term designated in the business plan.
The result of calculation is shown in 4) Sum of each element.
4) Sum of each element
The results for estimate of all three passenger categories of the Bottom-Up Analysis are shown below.
The conditions for the sensitive analysis conducted for the passenger category 1) International Egyptian Air Passenger and 2) International Foreign Air Passenger are summarized in the table below.
Table 4.3-21 Condition of Sensitive Analysis Low Medium High
1) Intl Egyptian Air Passenger Ratio of LCC flight 55% 60% 65%
2) Intl Foreign Air Passenger GDP growth rate Base -1% Base Base +1%

Special Assistance for Project Implementation (SAPI) for Borg El Arab International Airport Modernization Project
Chapter 4 Air Traffic Demand Forecast - Final Report -
4-53
Table 4.3-22 Result of Air Passenger Forecast (Medium case) t Nile Delta Alexandria
Year International Egyptian Intl Tourist Domestic Total Estimate Estimate Estimate Actual Estimate Actual Forecast
2004 3,914,738 360,364 90,091 40,912 491,367 2005 3,835,169 460,410 115,103 33,699 609,212 2006 4,438,260 619,458 154,864 28,720 803,042 2007 4,262,885 737,830 184,458 40,104 962,392 2008 5,006,572 984,846 246,212 59,037 1,290,095 2009 5,262,192 1,122,334 280,583 66,142 1,469,059 2010 5,708,399 1,275,026 318,756 88,201 1,681,983 1,681,983 2011 5,769,243 1,334,370 328,367 91,902 1,754,638 2012 5,865,480 1,411,766 342,956 95,602 1,850,324 2013 6,093,005 1,515,283 375,960 99,303 1,990,546 2014 6,439,860 1,636,620 425,730 103,003 2,165,353 2015 6,845,716 1,767,221 483,834 106,704 2,357,758 2016 7,284,462 1,939,634 546,622 117,562 2,603,818 2017 7,678,424 2,111,962 613,492 128,419 2,853,872 2018 8,094,046 2,245,502 684,708 139,277 3,069,486 2019 8,532,514 2,430,353 760,553 150,134 3,341,040 2020 8,995,076 2,608,395 841,328 160,992 3,610,715
Table 4.3-23 Result of Air Passenger Forecast (Low case) t Nile Delta Alexandria
Year International Egyptian Intl Tourist Domestic Total Estimate Estimate Estimate Actual Estimate Actual Forecast
2004 3,914,738 360,364 90,091 40,912 491,367 2005 3,835,169 460,410 115,103 33,699 609,212 2006 4,438,260 619,458 154,864 28,720 803,042 2007 4,262,885 737,830 184,458 40,104 962,392 2008 5,006,572 984,846 246,212 59,037 1,290,095 2009 5,262,192 1,122,334 280,583 66,142 1,469,059 2010 5,708,399 1,275,026 318,756 88,201 1,681,983 1,681,983 2011 5,769,243 1,334,370 320,358 91,902 1,746,629 2012 5,865,480 1,323,613 326,778 95,602 1,745,993 2013 6,093,005 1,384,502 351,046 99,303 1,834,851 2014 6,439,860 1,503,373 391,039 103,003 1,997,415 2015 6,845,716 1,630,527 438,190 106,704 2,175,421 2016 7,284,462 1,759,879 488,809 117,562 2,366,249 2017 7,678,424 1,890,313 542,211 128,419 2,560,942 2018 8,094,046 2,059,914 598,550 139,277 2,797,741 2019 8,532,514 2,202,233 657,988 150,134 3,010,356 2020 8,995,076 2,377,377 720,695 160,992 3,259,064
Table 4.3-24 Result of Air Passenger Forecast (High case) t Nile Delta Alexandria
Year International Egyptian Intl Tourist Domestic Total Estimate Estimate Estimate Actual Estimate Actual Forecast
2004 3,914,738 360,364 90,091 40,912 491,367 2005 3,835,169 460,410 115,103 33,699 609,212 2006 4,438,260 619,458 154,864 28,720 803,042 2007 4,262,885 737,830 184,458 40,104 962,392 2008 5,006,572 984,846 246,212 59,037 1,290,095 2009 5,262,192 1,122,334 280,583 66,142 1,469,059 2010 5,708,399 1,275,026 318,756 88,201 1,681,983 1,681,983 2011 5,769,243 1,334,370 336,376 91,902 1,762,647 2012 5,865,480 1,542,430 359,295 95,602 1,997,327 2013 6,093,005 1,646,555 401,366 99,303 2,147,224 2014 6,439,860 1,770,598 461,445 103,003 2,335,046 2015 6,845,716 1,943,242 531,270 106,704 2,581,217 2016 7,284,462 2,118,228 607,276 117,562 2,843,065 2017 7,678,424 2,292,989 688,982 128,419 3,110,391 2018 8,094,046 2,467,087 776,816 139,277 3,383,180 2019 8,532,514 2,690,818 871,238 150,134 3,712,190 2020 8,995,076 2,872,064 972,741 160,992 4,005,797

Special Assistance for Project Implementation (SAPI) for Borg El Arab International Airport Modernization Project
Chapter 4 Air Traffic Demand Forecast - Final Report -
4-54
1,6821,997
4,006
6,708
3,611
5,942
710
1,746
3,259
5,270
0
1,000
2,000
3,000
4,000
5,000
6,000
7,000
2005 2010 2015 2020 2025 2030
Actual ALY+HBE
Actual HBE
Forecast High
Forecast Med.
Forecast Low
(Thousands.person) Alexandria Region
Figure 4.3-14 Air Passenger Forecast in Alexandria Region (Bottom-up)
4.3.4. Cross-examination
In this section the results of the forecasted air passengers in Alexandria by Top-down and Bottom-up Analysis are summarized. The number of forecast cases are six, as three sensitive analyses were conducted for each analysis.
As mentioned before, the estimation of the future economic indices beyond the year 2020 is not reliable. Therefore, the air traffic demand has been assumed to increase every year by an annual air traffic average increment in the previous ten years (from 2020 to 2030).
Table 4.3-25 Result of Air Passenger Forecast (Thousand. person)
Top-down Analysis Bottom-Up Analysis
High Medium Low High Medium Low 2010 1,682 1,682 1,682 1,682 1,682 1,682 2015 2,513 2,316 2,125 2,581 2,358 2,175 2020 3,743 3,246 2,791 4,006 3,611 3,259 2025 4,891 4,122 3,421 5,333 4,755 4,239 2030 6,072 5,016 4,058 6,708 5,942 5,270
Annual Average Growth Rate
2010-2015 8.4% 6.6% 4.8% 8.9% 7.0% 5.3%2015-2020 8.3% 7.0% 5.6% 9.2% 8.9% 8.4%2020-2025 5.5% 4.9% 4.2% 5.9% 5.7% 5.4%2025-2030 4.4% 4.0% 3.5% 4.7% 4.6% 4.5%
2010-2030 6.6% 5.6% 4.5% 7.2% 6.5% 5.9%

Special Assistance for Project Implementation (SAPI) for Borg El Arab International Airport Modernization Project
Chapter 4 Air Traffic Demand Forecast - Final Report -
4-55
1,682
6,072
5,016
710
4,058
6,708
5,942
5,270
0
1,000
2,000
3,000
4,000
5,000
6,000
7,000
2005 2010 2015 2020 2025 2030
Actual ALY+HBE
Actual HBE
Forecast /Top down High
Forecast /Top down Med.
Forecast /Top down Low
Forecast /Bottom Up High
Forecast /Bottom Up Med.
Forecast /Bottom Up Low
(Thousands.person) Alexandria Region
Figure 4.3-15 Air Passenger Forecast in Alexandria
According to the forecast, air passengers handled in Alexandria airports were predicted to increase from 1.7 million in year 2010 to a range between 2.8 and 4.0 million in year 2020. Furthermore, until 2030 the air passengers will increase to a range between 4.1 and 6.7 million. The annual average air passenger growth rate from 2010 to 2030 varies between 4.5 and 7.2% .
In general, the number of air passengers predicted by means of Bottom-up Analysis is higher than that by the Top-down Analysis.
The Top-down Analysis is a traditional method and can be used to reflect the trend of demand for entire Egypt. This method is usually applied when the characteristic is similar, but in case of Egypt’s airports it is not the case. The following table shows monthly passenger traffic at Egyptian airports in 2011. The fluctuation of air traffic demand varied from airport to airport after the outbreak of the Egyptian Revolution. The traffic demand for example in Alexandria didn’t much decrease, because most of the air passengers were Egyptian. On the other hand, the demand of the airports, where the passengers were mainly foreign tourists such as Sharm El-Sheikh and Hurghada, sharply decreased,.

Special Assistance for Project Implementation (SAPI) for Borg El Arab International Airport Modernization Project
Chapter 4 Air Traffic Demand Forecast - Final Report -
4-56
Table 4.3-26 Year-on-Year of Passenger traffic in the year 2011 Cairo Red Sea Alexandria ALY HBE etc Total
Jan 7% 9% 24% 28% 21% 12% 9% Feb ▲ 54% ▲ 74% ▲ 17% ▲ 30% ▲ 4% ▲ 80% ▲ 66% Mar ▲ 39% ▲ 71% ▲ 9% ▲ 33% 18% ▲ 63% ▲ 57% Apr ▲ 26% ▲ 48% 1% ▲ 24% 31% ▲ 44% ▲ 37% May ▲ 23% ▲ 44% 1% ▲ 32% 58% ▲ 51% ▲ 36% Jun ▲ 11% ▲ 32% ▲ 20% ▲ 34% 3% ▲ 35% ▲ 23% Jul ▲ 9% ▲ 21% ▲ 7% ▲ 36% 41% ▲ 36% ▲ 16% Aug ▲ 13% ▲ 16% 2% ▲ 39% 61% ▲ 36% ▲ 16% Sep ▲ 15% ▲ 10% ▲ 3% ▲ 41% 61% ▲ 41% ▲ 16% Oct ▲ 25% ▲ 22% ▲ 4% ▲ 33% 33% ▲ 45% ▲ 26% Nov ▲ 32% ▲ 20% ▲ 9% ▲ 37% 26% ▲ 46% ▲ 28% Dec
Total ▲ 21% ▲ 32% ▲ 4% ▲ 32% 33% ▲ 43% ▲ 28% [Source] Egyptian Holding Company of Airports and Air Navigation website
The estimation of the passenger distribution according to the Airport Model used in this Study is important especially in the case of applying the Top-down analysis to forecast the air traffic demand in Egypt. The airport demand cannot be represented appropriately if the explanatory variables used for the forecast model depend specifically on each airport demand. It means that allocation of the total air traffic demand in Egypt to each of the airports cannot be made constantly but should be carried out considering variety of characteristics specific to the airport, that is almost equivalent to the bottom up analysis.
For those reasons, the results of the Bottom-up Analysis (the medium case), which focuses on the characteristics of the air passengers in Alexandria, has been adopted as the planning basis of this Study.

Special Assistance for Project Implementation (SAPI) for Borg El Arab International Airport Modernization Project
Chapter 4 Air Traffic Demand Forecast - Final Report -
4-57
4.4. Annual Air Cargo Demand Forecast
4.4.1. Procedure of Air Cargo Demand Forecast
As described in Section 4.2.1, almost all air cargo traffic in Egypt was handled in Cairo International Airport. For the air cargo traffic in Alexandria, chronological data to develop a forecast model was not available. Accordingly, the forecast of air cargo was not possible in neither the Top-down nor Bottom-up analysis. Therefore, it has been assumed that the air cargo demand in Alexandria would likely to remain at the present level of traffic based on the result of interview surveys.
The interview survey were made to the following entities:
Egypt Air Cargo
Air Cargo Agent (Freight Forwarder)
Ground Handling Service Agent
4.4.2. Current Situation of Air Cargo in Alexandria and its Outskirts
1) Loading/ Unloading Airport
Most of the air cargos in Alexandria and its outskirts were transported to/from Cairo International Airport, because of the availability of quick delivery system and good customer services. Accordingly the air cargo business was concentrated at and around Cairo International Airport.
There are historically-established roles at Cairo International Airport and Alexandria Port, respectively. Since many years air and marine cargos have been handled at Cairo International Airport and Alexandria port respectively.
2) Air Cargo Volume
Most of the exported cargos from Egypt were produced in Cairo and Alexandria with their outskirts, however. the specific volume of air cargo produced/manufactured in and near Alexandria (the latent demand) is not known.
Volumes of air cargo handled at Alexandria-Nozha International Airport (ALY) for the last three years are shown in Table 4.4-1.
In 2010/2011 5,653 tons of air cargo were handled at Alexandria-Nozha International Airport (ALY). The average annual growth rate during this period was 11%.

Special Assistance for Project Implementation (SAPI) for Borg El Arab International Airport Modernization Project
Chapter 4 Air Traffic Demand Forecast - Final Report -
4-58
Table 4.4-1 Air Cargo Volume at Alexandria Airport (tons) 2008/2009 2009/2010 2010/2011 AAGR Egypt Air 2,967 4,208 4,191 12%Foreign A/L 1,174 1,011 1,462 8%
Total 4,142 5,219 5,653 11%[Source] Egypt Air Cargo
At Borg El Arab International Airport, the volume of air cargo is not known, because the statistics of air cargo is not available. But it is clear through the interview that air cargos are not handled regularly. There are a few charter flights by Antonov (this is an all-cargo aircraft; Maximum Payload: 150 t) for the transport of special machines by a petroleum company.
3) Items of Air Cargo
It has been assumed that shares of general cargoes would be 60%, vegetables 30%, and textiles 10%
General cargoes would be mainly machine parts.
Vegetables, produced according to European requirements in mass farns, would be usually transported to Europe.
4.4.3. Air Cargo Forecast
1) Future Possibility
For the accumulation of air cargo at Alexandria airports, following facilities, services and systems would need to be provided, like Cairo International Airport: - Warehouse; - Large-scale refrigerator for safe storage of fresh products (e.g. fruit, vegetable,
meat, etc.); - Air cargo agent (freight forwarder) for the ground transportation; - Skilled customer services; - Low royalty fee and air fare.
Even airlines were able to transport air cargo to Alexandria, the land transportation provided by air cargo agents (freight forwarder) was still underdeveloped. At the moment the improved and attractive services by air cargo agents is most important.
Egypt Air Cargo is planning to launch their business at Borg El Arab International Airport.
Freighter aircraft is expected at Alexandria in the future, because quick delivery especially of machinery parts is demanded.
Strong incentives, warehousing facilities and a strong commitment to cargo handling should be considered to make Borg El Arab International Airport as one of the main cargo hubs in the region.

Special Assistance for Project Implementation (SAPI) for Borg El Arab International Airport Modernization Project
Chapter 4 Air Traffic Demand Forecast - Final Report -
4-59
2) Conclusion
Through the interview survey, it is confirmed that there is a strong air cargo demand in Alexandria and its outskirts.
Air cargo demand at Borg El Arab International Airport may increase in future; considering the fact that Egypt Air Cargo is planning to launch their business to the airport and the recent growth rate is 10% per annum.
At present it is difficult to quantitatively forecast air cargo demand even though air cargo demand tends to increase obviously.
The current cargo terminal building at Borg El Arab International Airport has still space for further expansion. The influence of Egypt Air Cargo’s business plan with their introduction of freighter aircraft and actual operations of the present cargo terminal should be observed in the meantime, so as to grasp future trends and be prepared to take necessary measures.
In conclusion, the Study Team recommends that the planning and design of the cargo terminal be examined later again, when the cargo business would have significantly increased or decision of higher authority has been made to develop Borg El Arab International Airport to be cargo hub.

Special Assistance for Project Implementation (SAPI) for Borg El Arab International Airport Modernization Project
Chapter 4 Air Traffic Demand Forecast - Final Report -
4-60
4.5. Annual Aircraft Movement Forecast
4.5.1. Passenger Aircraft Movements
1) International Aircraft Movement
a) Trend of Aircraft Configuration
The trends of the aircraft fleet configuration in Alexandria airports based on time-table for the past ten years can be summarized as follows.
The aircraft fleet configuration needs to be assumed in each of Legacy Carrier and Low Cost Carrier in Airport Selection Model of Bottom-up analysis, as shown in the following figures. The seating capacities of aircraft can be classified into three categories namely 265-Seater (E), 150-Seater (C) and 80-Seater (C). The alphabet in the parenthesis shows the aircraft classification according to ICAO.
14% 13% 11% 16% 13% 10% 10%17% 20%
10%
81% 83% 87% 74%68% 71%
82%83% 80%
81%
5% 4% 2%10%
19% 19%8% 10%
0%
20%
40%
60%
80%
100%
2002 2003 2004 2005 2006 2007 2008 2009 2010 2011
265 Seater (E)
150 Seater (C)
80 Seater (C)
Legacy Carrier
100% 100% 100% 100% 100% 100% 100% 100%
0%
20%
40%
60%
80%
100%
2002 2003 2004 2005 2006 2007 2008 2009 2010 2011
265 Seater (E)
150 Seater (C)
80 Seater (C)
Low Cost Carrier
[Source] OAG July2011
Figure 4.5-1 Trend of Aircraft Fleet Configuration in Alexandria Airports
150-Seater aircraft are principally operated by both Legacy Carrier and LCC to/from

Special Assistance for Project Implementation (SAPI) for Borg El Arab International Airport Modernization Project
Chapter 4 Air Traffic Demand Forecast - Final Report -
4-61
Alexandria airports. Flights by aircraft over 150-seater are made only at Borg El Arab International Airport.
All Low Cost Carries are operating 150-seater aircraft. This is their “business model” because their costs of operation and maintenance can be reduced by unifying their aircraft.
b) Future Assumption
Regarding the aircraft configuration of Legacy Carrier, it is expected that the number of 265-seater aircraft will increase, because most of the flights from/to Alexandria are shifted to Borg El Arab International Airport, which have 3,400-m long runway for wide-bodied aircraft to land and takeoff. Accordingly, the ratio of 265-seater aircraft of Legacy Carrier is assumed to increase from 10% in 2010 to 15% in 2015 and 20% in 2020. The ratio of 80-seater aircraft is assumed to increase to 15% in 2015 considering the business plan of Egypt Air Express, which would establish new air routes. These ratios are estimated by linear interpolation.
It is assumed that LCCs will continue their operation with 150-seater aircraft in future.
Table 4.5-1 Future Assumption of International Aircraft Configuration Aircraft Configuration Legacy Low Cost 265-seater 150-seater 80-seater 150-seater
2001 2002 5% 81% 14% 100%2003 4% 83% 13% 100%2004 2% 87% 11% 100%2005 10% 74% 16% 100%2006 19% 68% 13% 100%2007 19% 71% 10% 100%2008 8% 82% 10% 100%2009 0% 83% 17% 100%2010 0% 80% 20% 100%2011 10% 80% 10% 100%2012 11% 78% 11% 100%2013 13% 75% 13% 100%2014 14% 73% 14% 100%2015 15% 70% 15% 100%2016 16% 69% 15% 100%2017 17% 68% 15% 100%2018 18% 67% 15% 100%2019 19% 66% 15% 100%2020 20% 65% 15% 100%
c) Forecast
Future aircraft movements have been computed as follows:
Aircraft Movements = Passenger Forecast / Passengers per Flight
Future “Passengers per flight” have been computed by using the growth rate of “Average seat capacity per flight”. “Average seat capacity per flight” has been computed by the weighted average seat capacity for both Legacy Carrier and Low Cost Carrier, and the ratio of the flight number for both. (The ratio of the number of LCC

Special Assistance for Project Implementation (SAPI) for Borg El Arab International Airport Modernization Project
Chapter 4 Air Traffic Demand Forecast - Final Report -
4-62
flight is different for each case of the sensitive analysis). “Passenger per flight” beyond 2020 has been computed based on the growth rates of the previous year.
Table 4.5-2 Forecast of International Aircraft Movement (Medium) Average Seat Capacity passenger
per Flight Passenger Aircraft Movements
Legacy Low Cost Weighted
Average* Growth rate (person) (persons) (times) per day
2002 147 150 147 0% 86 246,482 2,876 8 2003 146 150 146 -0.5% 86 246,608 2,884 8 2004 145 150 146 -0.3% 95 450,455 4,747 13 2005 151 150 150 3.3% 95 575,513 6,065 17 2006 163 150 160 6.6% 95 774,322 8,127 22 2007 165 150 161 0.5% 102 922,288 9,052 25 2008 152 150 151 -6.1% 110 1,231,058 11,171 31 2009 138 150 143 -5.8% 101 1,402,917 13,891 38 2010 136 150 143 0.3% 104 1,593,782 15,264 42 2011 155 150 152 6.4% 111 1,662,737 14,962 41 2012 155 150 152 -0.2% 111 1,754,722 15,818 43 2013 156 150 152 0.1% 111 1,891,243 17,023 47 2014 156 150 152 0.1% 111 2,062,350 18,536 51 2015 157 150 153 0.1% 111 2,251,054 20,202 55 2016 158 150 153 0.3% 112 2,486,256 22,246 61 2017 159 150 154 0.3% 112 2,725,453 24,313 67 2018 160 150 154 0.3% 112 2,930,210 26,062 71 2019 161 150 155 0.3% 113 3,190,906 28,296 78 2020 163 150 155 0.3% 113 3,449,723 30,501 84 Ratio 40% 60%
*Weighted average of the ratio of Legacy Carrier Flight and LCC
Table 4.5-3 Forecast of International Aircraft Movement (Low) Average Seat Capacity passenger
per Flight Passenger Aircraft Movements
Legacy Low Cost Weighted
Average* Growth rate (person) (persons) (times) per day
2002 147 150 147 0% 86 246,482 2,876 8 2003 146 150 146 -0.5% 86 246,608 2,884 8 2004 145 150 146 -0.3% 95 450,455 4,747 13 2005 151 150 150 3.3% 95 575,513 6,065 17 2006 163 150 160 6.6% 95 774,322 8,127 22 2007 165 150 161 0.5% 102 922,288 9,052 25 2008 152 150 151 -6.1% 110 1,231,058 11,171 31 2009 138 150 143 -5.8% 101 1,402,917 13,891 38 2010 136 150 143 0.3% 104 1,593,782 15,264 42 2011 155 150 152 6.4% 111 1,654,728 14,890 41 2012 155 150 152 0.0% 111 1,650,391 14,853 41 2013 156 150 153 0.2% 111 1,735,548 15,593 43 2014 156 150 153 0.2% 111 1,894,412 16,992 47 2015 157 150 153 0.2% 112 2,068,717 18,525 51 2016 158 150 154 0.3% 112 2,248,687 20,069 55 2017 159 150 154 0.3% 112 2,432,523 21,636 59 2018 160 150 155 0.3% 113 2,658,464 23,567 65 2019 161 150 155 0.3% 113 2,860,221 25,271 69 2020 163 150 156 0.3% 114 3,098,072 27,281 75 Ratio 45% 55%
*Weighted average of the ratio of Legacy Carrier Flight and LCC

Special Assistance for Project Implementation (SAPI) for Borg El Arab International Airport Modernization Project
Chapter 4 Air Traffic Demand Forecast - Final Report -
4-63
Table 4.5-4 Forecast of International Aircraft Movement (High) Average Seat Capacity passenger
per Flight Passenger Aircraft Movements
Legacy Low Cost Weighted
Average* Growth rate (person) (persons) (times) per day
2002 147 150 147 0% 86 246,482 2,876 8 2003 146 150 146 -0.5% 86 246,608 2,884 8 2004 145 150 146 -0.3% 95 450,455 4,747 13 2005 151 150 150 3.3% 95 575,513 6,065 17 2006 163 150 160 6.6% 95 774,322 8,127 22 2007 165 150 161 0.5% 102 922,288 9,052 25 2008 152 150 151 -6.1% 110 1,231,058 11,171 31 2009 138 150 143 -5.8% 101 1,402,917 13,891 38 2010 136 150 143 0.3% 104 1,593,782 15,264 42 2011 155 150 152 6.4% 111 1,670,746 15,034 41 2012 155 150 152 -0.3% 111 1,901,724 17,172 47 2013 156 150 152 0.1% 111 2,047,921 18,468 51 2014 156 150 152 0.1% 111 2,232,043 20,102 55 2015 157 150 152 0.1% 111 2,474,513 22,257 61 2016 158 150 153 0.3% 111 2,725,503 24,450 67 2017 159 150 153 0.3% 112 2,981,971 26,680 73 2018 160 150 154 0.3% 112 3,243,903 28,948 79 2019 161 150 154 0.3% 112 3,562,056 31,704 87 2020 163 150 154 0.3% 113 3,844,805 34,131 94 Ratio 35% 65%
*Weighted Average of the ratio of Legacy Carrier Flight and LCC
2) Domestic Aircraft Movements
Domestic passenger aircraft movements have been forecasted based on the business plan of Egypt Air Express for Alexandria airports. The forecast of aircraft movements is summarized below. The number of flights per week are shown in Table 4.5-5.
Annual aircraft movements are computed by multiplying by 52 weeks.
Table 4.5-5 Egypt Air Express Future plan of domestic flight to/from Alexandria Route 2011-2015 2016-2020 2021-2025 Flight / week Cairo 7 14 21 (one-way) Sharm El-Sheikh 11 10 13 Fleet Cairo 76 76 76 (Number of Seat) Sharm El-Sheikh 76 100 100

Special Assistance for Project Implementation (SAPI) for Borg El Arab International Airport Modernization Project
Chapter 4 Air Traffic Demand Forecast - Final Report -
4-64
3) Result
Future aircraft movements in Alexandria region are computed by summing International and Domestic as follows.
Table 4.5-6 Result of Passenger Aircraft Movement Forecast (Times)
Top-down Analysis Bottom-Up Analysis
High Medium Low High Medium Low 2010 17,260 17,260 17,260 17,260 17,260 17,260 2015 24,275 22,375 20,559 24,129 22,074 20,397 2020 34,920 30,146 25,841 36,627 32,997 29,777 2025 44,884 37,497 30,951 48,284 42,988 38,291 2030 54,570 44,463 35,657 59,978 52,975 46,886
Annual Average Growth Rate
2010-2015 7.1% 5.3% 3.6% 6.9% 5.0% 3.4%2015-2020 7.5% 6.1% 4.7% 8.7% 8.4% 7.9%2020-2025 5.1% 4.5% 3.7% 5.7% 5.4% 5.2%2025-2030 4.0% 3.5% 2.9% 4.4% 4.3% 4.1%
2010-2030 5.9% 4.8% 3.7% 6.4% 5.8% 5.1%*Figures from Top-down Analysis are for Reference purpose.
1719
37
60
33
53
7
17
30
47
0
10
20
30
40
50
60
70
2005 2010 2015 2020 2025 2030
Actual ALY+HBE
Actual HBE
Forecast High
Forecast Med.
Forecast Low
(Thousands.time) Alexandria Region
*Commercial Flight Only
Figure 4.5-2 Passenger Aircraft Movement Forecast in Alexandria Region
4.5.2. Cargo Aircraft Movements
The trend of all cargo aircraft movement is expected to continue. A few more number of flights are expected in the future, but the quantitative forecast is difficult. To develop Borg El Arab International Airport to a main cargo hub, a more detailed and thorough survey and study should be conducted thus identifying potential cargo demand existing around Borg El Arab International Airport.

Special Assistance for Project Implementation (SAPI) for Borg El Arab International Airport Modernization Project
Chapter 4 Air Traffic Demand Forecast - Final Report -
4-65
4.6. Peak Air Traffic Demand Forecast
4.6.1. Peak-day Air Traffic Demand Forecast
The peak day ratios are determined to forecast the peak-day air traffic. Four kinds of peak day ratios (international passenger, domestic passenger, international aircraft movements and domestic aircraft movements) are considered.
The daily traffic ratios have been computed by the following formula:
Daily traffic Ratio =
Table 4.6-1 Daily traffic ratio by month in past 3 years in Alexandria region Day ratio by Month
Passenger
Jan. Feb. Mar. Apr. May Jun. Jul. Aug. Sep. Oct. Nov. Dec. Total
Int'l 2008 1/ 500 1/ 455 1/ 550 1/ 422 1/ 430 1/ 319 1/ 275 1/ 257 1/ 304 1/ 356 1/ 395 1/ 353 1/ 365
2009 1/ 483 1/ 428 1/ 508 1/ 407 1/ 437 1/ 319 1/ 267 1/ 273 1/ 291 1/ 368 1/ 389 1/ 405 1/ 365
2010 1/ 562 1/ 430 1/ 478 1/ 408 1/ 469 1/ 325 1/ 250 1/ 266 1/ 263 1/ 414 1/ 343 1/ 471 1/ 365
Average 1/ 515 1/ 438 1/ 512 1/ 412 1/ 445 1/ 321 1/ 264 1/ 266 1/ 286 1/ 379 1/ 375 1/ 410 1/ 365
Domestic 2008 1/ 361 1/ 351 1/ 396 1/ 361 1/ 370 1/ 325 1/ 338 1/ 295 1/ 453 1/ 347 1/ 431 1/ 413 1/ 365
2009 1/ 552 1/ 420 1/ 600 1/ 434 1/ 441 1/ 363 1/ 289 1/ 298 1/ 314 1/ 277 1/ 329 1/ 332 1/ 365
2010 1/ 534 1/ 382 1/ 459 1/ 375 1/ 422 1/ 363 1/ 262 1/ 407 1/ 302 1/ 322 1/ 288 1/ 439 1/ 365
Average 1/ 482 1/ 384 1/ 485 1/ 390 1/ 411 1/ 350 1/ 296 1/ 333 1/ 356 1/ 316 1/ 349 1/ 395 1/ 365
Aircraft Movement
Jan. Feb. Mar. Apr. May Jun. Jul. Aug. Sep. Oct. Nov. Dec. Total
Int'l 2008 1/ 492 1/ 477 1/ 498 1/ 381 1/ 399 1/ 342 1/ 298 1/ 293 1/ 308 1/ 341 1/ 365 1/ 339 1/ 365
2009 1/ 466 1/ 442 1/ 439 1/ 413 1/ 406 1/ 326 1/ 279 1/ 278 1/ 315 1/ 359 1/ 402 1/ 391 1/ 365
2010 1/ 475 1/ 451 1/ 440 1/ 412 1/ 452 1/ 336 1/ 277 1/ 282 1/ 289 1/ 370 1/ 348 1/ 409 1/ 365
Average 1/ 477 1/ 457 1/ 459 1/ 402 1/ 419 1/ 335 1/ 285 1/ 284 1/ 304 1/ 357 1/ 372 1/ 380 1/ 365
Domestic 2008 1/ 345 1/ 335 1/ 363 1/ 419 1/ 395 1/ 379 1/ 392 1/ 374 1/ 304 1/ 371 1/ 349 1/ 380 1/ 365
2009 1/ 480 1/ 420 1/ 465 1/ 418 1/ 391 1/ 396 1/ 337 1/ 297 1/ 301 1/ 300 1/ 337 1/ 356 1/ 365
2010 1/ 384 1/ 394 1/ 418 1/ 410 1/ 433 1/ 422 1/ 321 1/ 371 1/ 314 1/ 314 1/ 310 1/ 358 1/ 365
Average 1/ 403 1/ 383 1/ 415 1/ 416 1/ 406 1/ 399 1/ 350 1/ 347 1/ 306 1/ 328 1/ 332 1/ 365 1/ 365
Daily traffic ratios on the second peak month according to the tables above have been adopted:
Table 4.6-2 Peak Day Ratio (Adopted Ratio) International Domestic
Passenger 1/ 285 1/ 315
Aircraft Movement 1/ 300 1/ 330
Monthly Traffic / The number of days
Annual Traffic

Special Assistance for Project Implementation (SAPI) for Borg El Arab International Airport Modernization Project
Chapter 4 Air Traffic Demand Forecast - Final Report -
4-66
Table 4.6-3 Monthly Air Traffic in Alexandria Region PassengerInternational (person)
year airport Jan. Feb. Mar. Apr. May Jun. Jul. Aug. Sep. Oct. Nov. Dec. Total2008 ALY 62,906 62,319 59,497 74,372 78,633 101,175 122,001 130,714 111,935 102,053 74,888 63,761 1,044,254
HBE 13,454 13,516 9,936 13,112 10,172 14,514 16,789 17,627 9,702 5,101 18,676 44,205 186,804Total 76,360 75,835 69,433 87,484 88,805 115,689 138,790 148,341 121,637 107,154 93,564 107,966 1,231,058
2009 ALY 52,065 52,544 59,692 103,340 99,495 132,059 162,832 113,185 93,384 65,473 49,039 50,178 1,033,286HBE 37,904 39,171 25,913 0 0 0 0 46,093 51,354 52,835 59,200 57,161 369,631Total 89,969 91,715 85,605 103,340 99,495 132,059 162,832 159,278 144,738 118,308 108,239 107,339 1,402,917
2010 ALY 37,652 50,415 52,750 61,570 63,928 90,874 117,076 107,124 109,856 63,212 73,951 58,541 886,949HBE 50,322 53,388 50,602 55,758 41,405 56,463 80,176 78,383 72,220 56,217 65,478 46,421 706,833Total 87,974 103,803 103,352 117,328 105,333 147,337 197,252 185,507 182,076 119,429 139,429 104,962 1,593,782
Domestic (person)year airport Jan. Feb. Mar. Apr. May Jun. Jul. Aug. Sep. Oct. Nov. Dec. Total2008 ALY 5,064 4,707 4,626 4,759 4,580 5,235 5,418 6,193 3,903 5,268 4,055 4,435 58,243
HBE 0 0 0 148 369 209 0 1 10 0 57 0 794Total 5,064 4,707 4,626 4,907 4,949 5,444 5,418 6,194 3,913 5,268 4,112 4,435 59,037
2009 ALY 3,476 4,405 2,234 4,571 4,650 5,472 7,099 6,875 6,308 7,397 6,038 6,094 64,619HBE 237 0 1,185 0 0 0 0 0 13 0 2 86 1,523Total 3,713 4,405 3,419 4,571 4,650 5,472 7,099 6,875 6,321 7,397 6,040 6,180 66,142
2010 ALY 4,094 6,080 5,959 6,256 6,485 7,290 10,453 6,726 8,756 8,451 8,381 6,142 85,073HBE 1,029 391 0 794 0 0 0 0 0 35 798 81 3,128Total 5,123 6,471 5,959 7,050 6,485 7,290 10,453 6,726 8,756 8,486 9,179 6,223 88,201
Aircraft MovementsInternational (time)
year airport Jan. Feb. Mar. Apr. May Jun. Jul. Aug. Sep. Oct. Nov. Dec. Total2008 ALY 616 574 605 767 765 881 1,056 1,076 1,011 969 738 635 9,693
HBE 88 82 90 113 104 98 106 106 76 48 181 386 1,478Total 704 656 695 880 869 979 1,162 1,182 1,087 1,017 919 1,021 11,171
2009 ALY 540 520 677 1,009 1,060 1,279 1,546 1,147 920 697 502 547 10,444HBE 385 359 305 0 0 0 0 404 405 501 534 554 3,447Total 925 879 982 1,009 1,060 1,279 1,546 1,551 1,325 1,198 1,036 1,101 13,891
2010 ALY 445 471 550 616 670 848 1,009 1,009 968 661 684 630 8,561HBE 552 477 525 496 378 515 697 670 618 618 630 527 6,703Total 997 948 1,075 1,112 1,048 1,363 1,706 1,679 1,586 1,279 1,314 1,157 15,264
Domestic (time)year airport Jan. Feb. Mar. Apr. May Jun. Jul. Aug. Sep. Oct. Nov. Dec. Total2008 ALY 143 133 136 111 116 121 126 128 136 127 121 124 1,522
HBE 0 0 0 3 9 5 0 4 21 6 16 6 70Total 143 133 136 114 125 126 126 132 157 133 137 130 1,592
2009 ALY 121 126 73 141 156 149 181 205 195 203 165 154 1,869HBE 6 5 58 0 0 0 0 0 1 0 10 17 97Total 127 131 131 141 156 149 181 205 196 203 175 171 1,966
2010 ALY 117 128 142 137 143 139 190 159 191 188 176 153 1,863HBE 44 14 6 9 0 3 3 8 0 9 17 20 133Total 161 142 148 146 143 142 193 167 191 197 193 173 1,996
[Source] Egyptian Holding Company of Airports and Air Navigation website

Special Assistance for Project Implementation (SAPI) for Borg El Arab International Airport Modernization Project
Chapter 4 Air Traffic Demand Forecast - Final Report -
4-67
4.6.2. Peak-hour Air Traffic Demand Forecast
Peak hour ratios have been calculated to forecast the peak-hour air traffic. The peak hour ratios have been estimated for the two-way (departure + arrival) and one-way (departure or arrival) traffic.
A peak hour ratio has been calculated based on the equation shown below. As the aircraft movement increases, the peak hour ratio decreases gradually. In this Study, the following forecast model has been assumed, and their coefficient has been estimated based on the hourly and daily aircraft movements at Alexandria airports.
Peak Hour Ratio = a +
a, b : Coefficient
Table 4.6-4 Result of Coefficients Estimation (Peak Hour Model) Correlation a b
Coefficient Constant Daily Aircraft Movement
Two-ways 0.7095 Coefficient 0.0754 1.3805 (t-value) (0.9) (15.7)One-way 0.8551 Coefficient 0.0405 1.3716 (t-value) (1.3) (15.8)
The peak hour ratio computed by the same forecast model is shown in Figure 4.6-1.
0.000
0.050
0.100
0.150
0.200
0.250
0.300
0.350
0.400
0.450
0.500
0.550
0 25 50 75 100 125 150 175 200
Peak Hour Ratio
Aircraft Movement / day (Two-Ways)
Daily data (HBE)
OAG data (ALY + HBE)
Formula (Two ways)
J-CAB Domestic
Figure 4.6-1 Peak Hour Ratio (Two-ways)
The above graph includes, for reference, the model published by Japan Civil Aviation Bureau for domestic flights (J-CAB model: as expressed in blue dotted line), which had been applied in the previous SAPROF study. Presumably, at the time of the previous SAPROF study, flight data at Borg El Arab International Airport had not been sufficient
b
Daily Aircraft Movement

Special Assistance for Project Implementation (SAPI) for Borg El Arab International Airport Modernization Project
Chapter 4 Air Traffic Demand Forecast - Final Report -
4-68
enough and therefore the J-CAB model was only applied until such time that its reproducibility would have been confirmed. However, the peak-hour ratio based on the J-CAB model are generally higher than that forecasted in this study (expressed in red bold line). This is because in Japan the operations from midnight to early morning are restricted due to noise pollution, and also because more than half of domestic passengers are traveling for business purpose (of mostly one-day trip) hence they tend to select their trip in morning and evening time.
The following figure shows the result of peak hour ratios of one-way traffic. In 60 flights, which is the number of the currently average per day, the peak hour ratio for one way is 65% of two-ways.
0.000
0.050
0.100
0.150
0.200
0.250
0.300
0.350
0.400
0.450
0.500
0.550
0 25 50 75 100 125 150 175 200
Peak Hour Ratio
Aircraft Movement / day (Two-Ways)
Daily data (HBE)
OAG data (ALY + HBE)
Formula (One way)
Formula (Two ways)
Figure 4.6-2 Peak Hour Ratio (One-way)

Special Assistance for Project Implementation (SAPI) for Borg El Arab International Airport Modernization Project
Chapter 4 Air Traffic Demand Forecast - Final Report -
4-69
4.7. Summary of Air Traffic Demand Forecast
1 Meduim All f light move to HBE
(HBE) (ALY+HBE) (HBE)Actual Actual Forecast
FACTOR 2010 2010 2015 2020 2025 2030Annual
Passenger 709,961 1,681,983 2,357,758 3,610,715 4,754,833 5,941,699(7.0%) (8.9%) (5.7%) (4.6%)
International 706,833 1,593,782 2,251,054 3,449,723 4,528,945 5,654,166(7.1%) (8.9%) (5.6%) (4.5%)
Domestic 3,128 88,201 106,704 160,992 225,888 287,533(3.9%) (8.6%) (7.0%) (4.9%)
Aircraft Movement 6,836 17,260 22,074 32,997 42,988 52,975(5.0%) (8.4%) (5.4%) (4.3%)
: E 1,212 2,440 3,156 3,882: C 6,836 17,260 20,862 30,557 39,832 49,093
International 6,703 15,264 20,202 30,501 39,452 48,527(5.8%) (8.6%) (5.3%) (4.2%)
: E 1,212 2,440 3,156 3,882: C 6,703 15,264 18,990 28,061 36,296 44,645
Domestic : C 133 1,996 1,872 2,496 3,536 4,448(-1.3%) (5.9%) (7.2%) (4.7%)
Estimate ForecastTypical Busy Day
Passenger 2,490 5,872 8,237 12,615 16,608 20,752International 1/ 285 2,480 5,592 7,898 12,104 15,891 19,839Domestic 1/ 315 10 280 339 511 717 913
Aircraft Movement 22 57 73 110 143 175: E 4 8 11 13: C 22 57 69 102 132 162
International 1/ 300 22 51 67 102 132 162: E 4 8 11 13: C 22 51 63 94 121 149Domestic : C 1/ 330 0.4 6 6 8 11 13
Peak Hour Ratio International 0.138 0.102 0.096 0.089 0.086 0.084(Two ways) 1/7 1/10 1/10 1/11 1/12 1/12
Domestic 3.527 0.305 0.305 0.248 0.201 0.1821/0 1/3 1/3 1/4 1/5 1/6
Peak Hour (Two ways)Passenger 378 659 862 1,203 1,508 1,831
International 343 573 758 1,076 1,364 1,665Domestic 35 86 104 127 144 166
Aircraft Movement 4.4 7.0 8.2 11.1 13.5 16.0: E 0.4 0.7 0.9 1.1: C 4.4 7.0 7.8 10.4 12.6 14.9
International 3.0 5.2 6.4 9.1 11.3 13.6: E 0.4 0.7 0.9 1.1: C 3.0 5.2 6.0 8.4 10.4 12.5Domestic : C 1.4 1.8 1.8 2.0 2.2 2.4
Peak Hour Ratio International 0.103 0.067 0.061 0.054 0.051 0.049(One way) 1/10 1/15 1/16 1/19 1/20 1/20
Domestic 3.470 0.269 0.269 0.212 0.165 0.1461/0 1/4 1/4 1/5 1/6 1/7
Peak Hour (One way)Passenger 290 452 572 761 927 1,104
International 255 377 481 653 809 971Domestic 35 75 91 108 118 133
Aircraft Movement 3.7 5.0 5.7 7.2 8.5 9.8: E 0.2 0.4 0.5 0.6: C 3.7 5.0 5.5 6.8 8.0 9.2
International 2.3 3.4 4.1 5.5 6.7 7.9: E 0.2 0.4 0.5 0.6: C 2.3 3.4 3.9 5.1 6.2 7.3Domestic : C 1.4 1.6 1.6 1.7 1.8 1.9
Note : Aircraft Movements is only Commercial Aircraft

Special Assistance for Project Implementation (SAPI) for Borg El Arab International Airport Modernization Project
Chapter 4 Air Traffic Demand Forecast - Final Report -
4-70
Low All f light move to HBE
(HBE) (ALY+HBE) (HBE)Actual Actual Forecast
FACTOR 2010 2010 2015 2020 2025 2030Annual
Passenger 709,961 1,681,983 2,175,421 3,259,064 4,238,918 5,270,045(5.3%) (8.4%) (5.4%) (4.5%)
International 706,833 1,593,782 2,068,717 3,098,072 4,013,030 4,982,512(5.4%) (8.4%) (5.3%) (4.4%)
Domestic 3,128 88,201 106,704 160,992 225,888 287,533(3.9%) (8.6%) (7.0%) (4.9%)
Aircraft Movement 6,836 17,260 20,397 29,777 38,291 46,886(3.4%) (7.9%) (5.2%) (4.1%)
: E 1,112 2,182 2,780 3,395: C 6,836 17,260 19,286 27,595 35,511 43,491
International 6,703 15,264 18,525 27,281 34,755 42,438(3.9%) (8.0%) (5.0%) (4.1%)
: E 1,112 2,182 2,780 3,395: C 6,703 15,264 17,414 25,099 31,975 39,043
Domestic : C 133 1,996 1,872 2,496 3,536 4,448(-1.3%) (5.9%) (7.2%) (4.7%)
Estimate ForecastTypical Busy Day
Passenger 2,490 5,872 7,598 11,381 14,798 18,395International 1/ 285 2,480 5,592 7,259 10,870 14,081 17,482Domestic 1/ 315 10 280 339 511 717 913
Aircraft Movement 22 57 68 99 127 154: E 4 7 9 11: C 22 57 64 92 118 143
International 1/ 300 22 51 62 91 116 141: E 4 7 9 11: C 22 51 58 84 107 130Domestic : C 1/ 330 0.4 6 6 8 11 13
Peak Hour Ratio International 0.138 0.102 0.098 0.091 0.087 0.085(Two ways) 1/7 1/10 1/10 1/11 1/11 1/12
Domestic 3.527 0.305 0.305 0.248 0.201 0.1821/0 1/3 1/3 1/4 1/5 1/6
Peak Hour (Two ways)Passenger 378 659 813 1,111 1,373 1,655
International 343 573 709 984 1,229 1,489Domestic 35 86 104 127 144 166
Aircraft Movement 4.4 7.0 7.9 10.2 12.3 14.4: E 0.4 0.7 0.8 1.0: C 4.4 7.0 7.5 9.5 11.5 13.4
International 3.0 5.2 6.1 8.2 10.1 12.0: E 0.4 0.7 0.8 1.0: C 3.0 5.2 5.7 7.5 9.3 11.0Domestic : C 1.4 1.8 1.8 2.0 2.2 2.4
Peak Hour Ratio International 0.103 0.067 0.063 0.056 0.052 0.050(One way) 1/10 1/15 1/16 1/18 1/19 1/20
Domestic 3.470 0.269 0.269 0.212 0.165 0.1461/0 1/4 1/4 1/5 1/6 1/7
Peak Hour (One way)Passenger 290 452 545 712 855 1,011
International 255 377 454 604 737 878Domestic 35 75 91 108 118 133
Aircraft Movement 3.7 5.0 5.5 6.8 7.9 9.0: E 0.2 0.4 0.5 0.6: C 3.7 5.0 5.3 6.4 7.4 8.4
International 2.3 3.4 3.9 5.1 6.1 7.1: E 0.2 0.4 0.5 0.6: C 2.3 3.4 3.7 4.7 5.6 6.5Domestic : C 1.4 1.6 1.6 1.7 1.8 1.9
Note : Aircraft Movements is only Commercial Aircraft

Special Assistance for Project Implementation (SAPI) for Borg El Arab International Airport Modernization Project
Chapter 4 Air Traffic Demand Forecast - Final Report -
4-71
High All f light move to HBE
(HBE) (ALY+HBE) (HBE)Actual Actual Forecast
FACTOR 2010 2010 2015 2020 2025 2030Annual
Passenger 709,961 1,681,983 2,581,217 4,005,797 5,332,875 6,708,254(8.9%) (9.2%) (5.9%) (4.7%)
International 706,833 1,593,782 2,474,513 3,844,805 5,106,987 6,420,721(9.2%) (9.2%) (5.8%) (4.7%)
Domestic 3,128 88,201 106,704 160,992 225,888 287,533(3.9%) (8.6%) (7.0%) (4.9%)
Aircraft Movement 6,836 17,260 24,129 36,627 48,284 59,978(6.9%) (8.7%) (5.7%) (4.4%)
: E 1,335 2,730 3,580 4,442: C 6,836 17,260 22,794 33,897 44,704 55,536
International 6,703 15,264 22,257 34,131 44,748 55,530(7.8%) (8.9%) (5.6%) (4.4%)
: E 1,335 2,730 3,580 4,442: C 6,703 15,264 20,922 31,401 41,168 51,088
Domestic : C 133 1,996 1,872 2,496 3,536 4,448(-1.3%) (5.9%) (7.2%) (4.7%)
Estimate ForecastTypical Busy Day
Passenger 2,490 5,872 9,022 14,002 18,636 23,442International 1/ 285 2,480 5,592 8,683 13,491 17,919 22,529Domestic 1/ 315 10 280 339 511 717 913
Aircraft Movement 22 57 80 122 160 198: E 4 9 12 15: C 22 57 76 113 148 183
International 1/ 300 22 51 74 114 149 185: E 4 9 12 15: C 22 51 70 105 137 170Domestic : C 1/ 330 0.4 6 6 8 11 13
Peak Hour Ratio International 0.138 0.102 0.094 0.088 0.085 0.083(Two ways) 1/7 1/10 1/11 1/11 1/12 1/12
Domestic 3.527 0.305 0.305 0.248 0.201 0.1821/0 1/3 1/3 1/4 1/5 1/6
Peak Hour (Two ways)Passenger 378 659 921 1,308 1,661 2,033
International 343 573 817 1,181 1,517 1,867Domestic 35 86 104 127 144 166
Aircraft Movement 4.4 7.0 8.8 12.0 14.8 17.7: E 0.4 0.8 1.0 1.2: C 4.4 7.0 8.4 11.2 13.8 16.5
International 3.0 5.2 7.0 10.0 12.6 15.3: E 0.4 0.8 1.0 1.2: C 3.0 5.2 6.6 9.2 11.6 14.1Domestic : C 1.4 1.8 1.8 2.0 2.2 2.4
Peak Hour Ratio International 0.103 0.067 0.059 0.053 0.050 0.048(One way) 1/10 1/15 1/17 1/19 1/20 1/21
Domestic 3.470 0.269 0.269 0.212 0.165 0.1461/0 1/4 1/4 1/5 1/6 1/7
Peak Hour (One way)Passenger 290 452 603 817 1,008 1,212
International 255 377 512 709 890 1,079Domestic 35 75 91 108 118 133
Aircraft Movement 3.7 5.0 6.0 7.7 9.2 10.8: E 0.3 0.5 0.6 0.7: C 3.7 5.0 5.7 7.2 8.6 10.1
International 2.3 3.4 4.4 6.0 7.4 8.9: E 0.3 0.5 0.6 0.7: C 2.3 3.4 4.1 5.5 6.8 8.2Domestic : C 1.4 1.6 1.6 1.7 1.8 1.9
Note : Aircraft Movements is only Commercial Aircraft

Special Assistance for Project Implementation (SAPI) for Borg El Arab International Airport Modernization Project
Chapter 4 Air Traffic Demand Forecast - Final Report -
4-72
4.8. Principal Conclusions
4.8.1. Forecasting Parameters
In air traffic demand forecasting, it is extremely important to observe the relationship between the trend (or feature) of air traffic and socio-economic indices as well as the level of aviation services. Information being collected should include qualitative information as well as quantitative information for the definition of issues and the consideration of the possibility of the future demand.
Key forecasting parameters for Alexandria described in this Chapter are summarized as follows.
Average annual growth rate of air passenger at Alexandria airports from 2003 to 2010 was 21%, the highest among all Egyptian airports.
Air passenger characteristics in each Egyptian airport were individually different. Air passengers at Alexandria airports were mainly Egyptian, while alomost of those at Sharm El-Sheikh and Hurghada were tourists from Europe. Such difference could have affected instantly the variation of air passengers when internal termoil such as the outbreak of the Egyptian Revolution in 2011 occurred. The traffic demand in Alexandria haven’t much decreased (almost same as the previous year)
The residence of Egyptian using Borg El Arab International Airport was distributed over the Nile Delta.
The population in Lower Egypt, the catchment area of Borg El Arab International Airport, was 38 million in 2010. This was nearly half of Egypt’s entire population.
45% of the purpose of Egyptian travelers was for Pilgrimage. The 2nd largest share of travelers was overseas contract workers, whose destination was Middle East and Istanbul.
Since LCC started its operations at Alexandria’s airports from 2004, the number of LCC flights has been increasing gradually and reached approximately 45% of the total flights in 2010 (as far as the international flights are concerned, the current ratio of LCC is 50%). The air fare of LCC was 40% cheaper than that of Legacy carrier in average.
4.8.2. Air passenger demand forecast
The methodology of air passenger forecast in this Chapter follows two different approaches, namely a Top-down and a Bottom-up analysis, which are the same as SAPROF study.
The Top-down analysis, which can be seen as “Egypt driven”, focuses on the trend of aviation activity for entire Egypt. The role (ratio) of Alexandria within Egypt was forecasted considering the difference of air passenger growth rates in each Egyptian airport.
The Bottom-up analysis, which can be seen as “Alexandria driven” focuses on the feature of

Special Assistance for Project Implementation (SAPI) for Borg El Arab International Airport Modernization Project
Chapter 4 Air Traffic Demand Forecast - Final Report -
4-73
air passengers in Alexandria region. Air passenger demand has been forecasted in respect of the three groups of passengers, namely, International Egyptian, International Tourist, and Domestic. International Egyptian who were the main user of Alexandria airport has been forecasted considering the probability of selecting Alexandria airport. The probability has been computed through comparison on the level of aviation service (air fare price and frequency) between Alexandria and Cairo airport.
These approaches provide opportunity for integrating both national and regional perspectives into the forecasting process. But considering the recent high air passenger growth in Alexandria airport, it has been concluded that the results of the Bottom-up Analysis that focused on the feature of the air passengers in Alexandria, was more suitable.
In the Bottom-up analysis, the ratio of the number of LCC International flights at Alexandria’s airports in the International Egyptian forecast, and the future Egyptian GDP growth rate in the International tourist forecast, have been assumed with its sensitive analyses of three cases (High, Medium, Low).
Air passengers handled in Alexandria airports were estimated to increase to 2.2 to 2.6 million (2.4 million in medium case) in 2015 from 1.7 million passenger in 2010. Furthermore, in 2020 the air passengers would increase to 3.3 to 4.0 million (3.6 million in medium case). The estimated average annual air passenger growth rates in medium case were 7.0% from 2010 to 2015, and 8.9% from 2015 to 2020 respectively.
4.8.3. Air Cargo Demand Forecast
Almost all air cargo traffic in Egypt has been handled at Cairo International Airport. For the air cargo traffic in Alexandria, chronological data to develop a forecast model was not available.
Current situation of air cargo in Alexandria and its outskirts are summarized as follows.
Most export cargoes in Egypt have been produced in Cairo and Alexandria with their outskirts. But the air cargoes in Alexandria and its outskirts have been transported to Cairo International Airport, because of the availability of quick delivery system and good customer services.
In 2010/2011, 5,653 tons of air cargos were handled at Alexandria-Nozha International Airport (ALY). At Borg El Arab International Airport, the volume of air cargo was not identified. But there were a few charter flights by Antonov (the largest all-cargo aircraft with its maximum payload of 150 t) for the transport of special machines by a petroleum company.
Items of Air Cargo: It has been assumed that share of general cargoes are 60%, vegetables are 30%, and textiles are 10%. General cargoes are mainly machine parts.
Considering the current situation of air cargo and the future possibility of air cargo in Alexandria airport based on an interview survey, the prediction of the future air cargo

Special Assistance for Project Implementation (SAPI) for Borg El Arab International Airport Modernization Project
Chapter 4 Air Traffic Demand Forecast - Final Report -
4-74
demand and the facility requirement are shown in below.
At present it is difficult to quantitatively forecast air cargo demand even though air cargo demand tends to increase obviously. Through the interview survey, it has been confirmed that there should exist strong air cargo demand in Alexandria and its outskirts .
Air cargo demand at Borg El Arab International Airport may increase in future; considering the fact that Egypt Air Cargo has been planning to launch their business to the airport and the recent growth rate of 10% per annum.
The current cargo terminal building at Borg El Arab International Airport has still vacant space for further cargo to be handled. Then as a consequence, the Study Team recommends that the planning and design of the cargo terminal be examined later again, when the cargo business significantly increases or decision of higher authority is made to develop Borg El Arab International Airport to be cargo hub.
4.8.4. Aircraft movement forecast
The future aircraft movement is linked to the future air passenger demand and the aircraft fleet configuration.
Aircraft of 150 seats (ICAO Code C) has been the major type of aircraft being used at two Alexandria airports because of the LCCs business model unifying the aircraft type (i.e. A320 series) for the purpose of reducing operation and maintenance costs.
Accordingly, it has been expected that only Legacy carriers would introduce a larger aircraft whereas an aircraft for LCCs maintain the current situation in the future.
The number of aircraft movements in Alexandria airports were predicted to increase from 20 to 24 thousand (22 thousand in Medium Case) in 2015 from 17 thousand in 2010. Further, in 2020 the aircraft movements would increase from 30 to 37 thousand times (33 thousand in medium case). The average annual growth rate in the medium case has been estimated to be 5.0% from 2010 to 2015, and 8.4% from 2015 to 2020.
4.8.5. Peak air traffic forecast
Peak day ratios and assumed daily traffic ratios on the second peak month are shown in the Table below.
Table 4.8-1 Peak Day Ratio (Adopted Ratio) International Domestic
Passenger 1/ 285 1/ 315 Aircraft Movement 1/ 300 1/ 330
The peak hour ratios have been estimated by a forecast model developed using daily traffic data in Alexandria airports. A forecast model was developed for two-way traffic (departure + arrival) and one-way traffic (departure or arrival).

Special Assistance for Project Implementation (SAPI) for Borg El Arab International Airport Modernization Project
Chapter 4 Air Traffic Demand Forecast - Final Report -
4-75
Two-way peak hour ratio of International flight has been estimated to decrease to 0.096 (9.6%) in the medium case in 2015 from 0.102 (10.2%) in 2010. In 2015, one-way peak hour ratio would decrease to 0.067 (6.7%) corresponding approximately to 65% of two-way ratio. Furthermore these ratios in 2020 would be further decrease to 0.089 (8.9%; two-way) and to 0.054 (5.4%; one-way).

Special Assistance for Project Implementation (SAPI)for Borg El Arab International Airport Modernization Project
- Final Report -
Chapter 5
Current Conditions of Borg El Arab International Airport
Table of Contents
5.1 Current Situation of Civil Aviation Operation in Alexandria Region ............................. 5-1
5.1.1 Current Air Transport at Borg El Arab International Airport ...................................... 5-1
5.1.2 Current Operation at Alexandria-Nozha International Airport .................................... 5-4
5.2 Current Operational Status of Airport Facilities
at Borg El Arab International Airport .................. 5-5
5.2.1 Overview ..................................................................................................................... 5-5
5.2.2 Airside Facilities .......................................................................................................... 5-6
5.2.3 Passenger Terminal Building ..................................................................................... 5-11
5.2.4 Terminal and Apron (Airside) Congestion ................................................................ 5-14
5.2.5 Current Operational Status of Key Facilities related to Airport Congestion ............. 5-15
5.3 Analysis on Egypt Air Relocation to Borg El Arab International Airport .................... 5-21
5.3.1 Assumed Congestion ................................................................................................. 5-21
5.3.2 Operational Status of Key Facilities related to Assumed Congestion ....................... 5-22
5.4 Mode of Access to / from Airport (Type of Transportation) ........................................... 5-26
5.4.1 Operations ................................................................................................................. 5-26
5.4.2 Possible Strategies for the Future .............................................................................. 5-26

Special Assistance for Project Implementation (SAPI)for Borg El Arab International Airport Modernization Project
- Final Report -
5.5 Non-Aeronautical Revenue at Borg El Arab International Airport .............................. 5-28
5.5.1 Main Revenue at Borg El Arab International Airport ................................................ 5-28
5.5.2 Non-Aeronautical Businesses at Present ................................................................... 5-29
5.5.3 Present Contract (Concessions, Advertising, Office Rental) ..................................... 5-32
5.6 Airport Marketing Activity at Borg El Arab International Airport .............................. 5-34
5.6.1 Current Condition ...................................................................................................... 5-34
5.6.2 Current Issues to be addressed and Possible Strategy for the Future ........................ 5-34
5.7 Management of Borg El Arab International Airport ...................................................... 5-36
5.7.1 Current Organizational Structure of Borg El Arab International Airport .................. 5-36
5.7.2 Observations Concerning the Approach to the Future by All Organizations ............ 5-42
5.8 Existing Assistance by Narita International Airport ....................................................... 5-43
5.8.1 Assistance Items and Implementation ....................................................................... 5-43
5.8.2 Effect of Assistance Project ....................................................................................... 5-45

Special Assistance for Project Implementation (SAPI) for Borg El Arab International Airport Modernization Project
Chapter 5 Current Conditions of Borg El Arab International Airport - Final Report -
5-1
Chapter 5. Current Conditions of Borg El Arab International Airport 5.1. Current Situation of Civil Aviation Operations in Alexandria Region
5.1.1. Current Air Transport at Borg El Arab International Airport
1) Current Flight Schedule at Borg El Arab International Airport
The new facility developed under the Project at Borg El Arab International Airport commenced its initial operations for civil aviation in December 2010.
Table 5.1-1 shows the destinations and number of flights per week as of September 2011.
Table 5.1-1 List of Destinations and Number of Flights at Borg El Arab International Airport as of September 2011
International/ Domestic Airline Destination Flights/Week
(One-way) Aircraft Remarks
International Service
FZ flydubai Dubai 14 B738 LCC J9 Jazeera Airways Kuwait 7 A320 LCC TK Turkish Airlines Istanbul 4 B737 BN Bahrain Air Bahrain 2 A320 GF Gulf Air Bahrain 4 A319/A320 QR Qatar Airways Doha 7 A320 KU Kuwait Airways Kuwait 5 A320 EY Etihad Airways Abu Dhabi 4 A320 RJ Royal Jordanian Airlines Amman 5 E90/E95 NP Nile Air Ta’if 7 A320
SV Saudi Arabian Airlines Medina 1 A320
Riyadh 3 A320 Jeddah 7 A320
ES Air Arabia Egypt (*Using Borg El Arab as a hub)
Riyadh 6 A320
LCC
Kuwait 6 A320 Abu Dhabi 3 A320 Dammam 3 A320 Istanbul 3 A320 Jeddah 2 A320
Khartoum 3 A320 Total number of weekly flights (new terminal) 96
Average number of daily flights 13.71
International XY NAS Air (operating in the old terminal)
Jeddah 7 A319/A320 LCC Riyadh 7 A320
Medina 3 A319/A320 Total number of weekly flights (new and old combined) 113
Average number of daily flights 16.14 Percentage of the total (%)
Total number by aircraft type
Small aircraft (A321, A320, B737, E95) ※E90/E95: Embraer 190 or 195 113 100
* Operating schedule information from EAC data, airline websites and ADI (Airport Data Intelligence) * Excluding code share services
The number of flights has gradually increased since the new terminal was commissioned in December 2010. As of September 2011, 14 destinations were being serviced from the airport and 96 flights a week were using the new terminal. One company continues to use the old terminal, which brings the number of flights per week to 113 for both terminals combined. The political situation in Egypt has been unstable since the uprising of February 2011 as has the

Special Assistance for Project Implementation (SAPI) for Borg El Arab International Airport Modernization Project
Chapter 5 Current Conditions of Borg El Arab International Airport - Final Report -
5-2
situation in neighboring Libya. Undoubtedly this has affected demand for air transport, resulting in little growth in the number of flights and destinations compared to the projections in 2004.
Comparison of the traffic recorded in 2010 and 2009 is made in Table 5.1-2, in which the number of passenger in 2010 has increased by 91% from 2009, and aircraft movements in 2010 increased by 97% from 2009 at Borg El Arab International Airport. The air traffic at Alexandria-Nozha International Airport has not much changed presumably because it has surpassed the physical capacity since long time ago.
Table 5.1-2 Passenger and Aircraft Traffic at Alexandria's Two Airports Passenger and Aircraft Traffic at Borg El Arab International Airport (2009, 2010)
2009 2010 Growth Rate Aircraft Movements 3,717 7,312 196.7%
Passengers 371,154 709,961 191.2% Passenger and Aircraft Traffic at Alexandria- Nozha International Airport (2009, 2010)
2009 2010 Growth Rate Aircraft Movements 19,405 19,364 99.7%
Passengers 1,097,905 972,022 88.5% [Source] ACI World Airport Traffic Report 2010
2) LCCs (Low Cost Carriers) at Borg El Arab International Airport
LCCs are expanding their activities in Europe, the US, Asia and around the world. In Europe, for example, they have achieved high growth with a projected 40% share of the EU market in 2011. In Asia, low fare airlines such as Air Asia are continuing to emerge and grow to exploit demand by people who were unable to travel by aircraft before. In the Middle East as well, LCCs are expanding demand in the centers of Dubai and Saudi Arabia.
There are currently four (4) LCCs operating at Borg El Arab International Airport. Air Arabia Egypt, one of the four, operates 26 flights a week to seven destinations using Borg El Arab International Airport as its hub. The airline plans to increase its fleet and will probably expand its network further from Borg El Arab International Airport.
With LCCs expanding rapidly throughout the world, this expansion has not yet reached Egypt to the same extent as other regions. Therefore, further growth can be expected when this global trend reaches Egypt. Given the particularly close-knit links in the Middle East, as the LCCs continue to expand here, there is every possibility that they will have an influence on growth at Borg El Arab International Airport.
Airlines operating low-fare scheduled and non-scheduled (chartered) flights are continuing to increase in number in Europe as well with many flights operating to Sharm el-Sheikh and Hurghada as well as Luxor from the UK and Russia. There is the possibility that these airlines will launch new routes.
Enthusiastically enticing these airlines to actively exploit the latent demand among income earners who have never been able to travel by aircraft and expanding demand in Egypt for air transport could be a key factor that would lead to the growth at Borg El Arab International

Special Assistance for Project Implementation (SAPI) for Borg El Arab International Airport Modernization Project
Chapter 5 Current Conditions of Borg El Arab International Airport - Final Report -
5-3
Airport.
3) Current Destinations and Aircraft
The routes emanating from Borg El Arab International Airport are unique in that almost all are to the Middle East and many are short haul of a duration ranging from 1 to 3 hours. Previously there were routes from cities in Europe such as Germany and Greece but those airlines withdrew because of the current political unrest in Egypt.
All aircraft are small models with the majority being A320 and B737. However, there are some mid-size aircraft such as B767 operating on Hajj flights and other charter operations.
4) Connections
a) Present
Since all current flights to and from Borg El Arab International Airport are straight origin to destination (O&D) flights with no stopovers, there are no transit passengers.
b) Possible Strategies for the Future
As mentioned previously, Air Arabia Egypt uses Borg El Arab International Airport as its hub. As it expands its operations in the future, there is every possibility that it would use its hub--Borg El Arab--as a transit hub. This would result in more transit passengers.
More transit passengers would help boost retail and other non-aeronautical revenue. To achieve this, it would be necessary to first create transit demand at Borg El Arab by marketing to airlines such as Air Arabia Egypt, which use Borg El Arab as a hub, as well as other airlines that would use it as a node.
5) Old Terminal
a) Present
The old terminal at Borg El Arab International Airport had been operated before the new terminal opened. It was built in 1998. The facilities were not only run down due to inadequate maintenance but, at only 2,500 m2 in area, are also too small to handle the present passenger traffic.
After the opening of the new terminal, the airlines transferred over in stages. As of September 2011, one airlines (NAS Air) operates in the old terminal and the other 12 are now operating in the new terminal. NAS Air also plans to begin operating in the new terminal as soon as all of the conditions are in place.
b) Problems with Using the Old Terminal
The two terminals are on either side of the runway. Operating two separated terminals means additional time assigning and relocating local EAC staff as well as other problems. To alleviate these problems, it might be easier for the airport operator to offer more assistance so that the remaining airlines can move to the new terminal as quickly as possible.

Special Assistance for Project Implementation (SAPI) for Borg El Arab International Airport Modernization Project
Chapter 5 Current Conditions of Borg El Arab International Airport - Final Report -
5-4
6) Aircraft Time (Turnaround Time) at the Airport per Flight
According to the August 2011 schedule, the average aircraft time (turnaround time) at the Airport per flight using the new terminal was about 50 minutes (excluding Hajj flights and other non-scheduled flights and overnight stays).
This is much less than the average time of 2 hours 35 minutes at Narita International Airport where the majority are large aircraft.
The primary reason for the shorter turnaround time is that all of the aircraft are small models, which require less time to complete the preflight preparations. The second reason is that there are an increasing number of LCCs. LCCs minimize their turnaround time at the airport between arrival and departure and carry more passengers in their business models. Therefore, as LCCs grow in number, the average aircraft turnaround time at Borg El Arab International Airport becomes shorter.
Because turnaround times will become shorter, time on the stand will also be shorter. It is conceivable, therefore, that there will be a higher occupancy rate (turnover ratio) per stand. The higher the turnover ratio, the more aircraft can use the same stand. This can be described as a good result in terms of accommodating new routes in the future.
5.1.2. Current Operation at Alexandria-Nozha International Airport
Alexandria-Nozha International Airport is located in Alexandria downtown.
Currently, Egypt Air (including Egypt Air Express) and AlMasria Universal Airlines operate at Alexandria-Nozha, destination and number of flights are shown in Table 5.1-3.
Table 5.1-3 List of Destinations and Number of Flights at Alexandria-Nozha International Airport
International / Domestic Airline Destination Flights/Week
(One-way) Aircraft Remarks
International Service
MS Egypt Air
Dammam 1 A320 Jeddah 14 A320 Kuwait 2 A320 Medina 3 A320 Riyadh 4 A320
UJ AlMasria Universal Airlines
Jeddah 7 A320 Kuwait 1 A320
Total number of weekly flights 32
Domestic Service MS Egypt Air
Cairo 11 A320 / B735 Hurghada 3 E70
Sharm El Sheikh 6 E70 Total number of weekly flights 20
Total number of weekly flights (International and Domestic) 52 * Operating schedule information from EAC data, airline websites and ADI (Airport Data Intelligence) * As of April 2011
However, the Airport has numerous problems as stated in Chapter 3.2.1, and all operations are due to transfer to Borg El Arab International Airport from December 2011 as described in Chapter 3.3.1.

Special Assistance for Project Implementation (SAPI) for Borg El Arab International Airport Modernization Project
Chapter 5 Current Conditions of Borg El Arab International Airport - Final Report -
5-5
5.2. Current Operational Status of Airport Facilities at Borg El Arab International Airport
5.2.1. Overview
The current status of operations at Borg El Arab International Airport is as described in Chapter 5.1-1. The following is a description of the current operational status of airport’s main facilities. Key facilities which are closely related to airport congestion are explained in Chapter 5.2.5.
[Airside Facilities]
a) Runway b) Parallel Taxiway c) Taxiways to New Terminal
d) Follow-me car Operation e) Aircraft Stands
[Passenger Terminal Building Facilities]
a) Boarding Bridges b) International - International Transit
Facilities
c) Departure Bus Gate d) Inbound passport control
e) Baggage claim f) Check-in counters
g) Outbound passport control.

Special Assistance for Project Implementation (SAPI) for Borg El Arab International Airport Modernization Project
Chapter 5 Current Conditions of Borg El Arab International Airport - Final Report -
5-6
5.2.2. Airside Facilities
Runway
Current Status
As before, the airport continues to share the existing single 3,400-meter long runway with the military after the opening of the new terminal.
The runway is owned by the military. The military presently only uses helicopters on the runway and there are only a few civil aviation
movements at the moment. Therefore, the EAC says that there is not much hindrance to civil aviation operations.
The runway's handling capacity is sufficient for 40 to 60 flights an hour under ICAO specifications. The airport currently handles 3 flights an hour at most so capacity is not a problem.
Operational Issues
The three major prerequisites of airport operations are to ensure aircraft punctuality, safety and dependability.
Although the military owns the runway, the EAC carries out the maintenance. At the moment the Airport is constrained by an inefficient maintenance management system in that the EAC not only must coordinate with the Civil Aviation Authority (CAA) when carrying out scheduled maintenance and essential emergency repairs, it must also gain approval from the military. Therefore, the process to carrying out maintenance is lengthy in terms of time. Correct management of facility maintenance draws the most out of runway functions at all times and contributes to safe, efficient airport operation.
The runway must also be closed when emergency repairs are required or in the event of an aircraft accident. With a single runway operation, no aircraft can land or take off. This paralyzes the airport and poses a major hindrance to the operation of many aircraft. The airport might be, therefore, unable to contribute to punctuality that airlines require.
Airlines are unable to continue operations when the only available runway shuts down. Consequently, they are unable to guarantee punctuality. Punctuality is one of the factors used by passengers to select an airline. Therefore, airlines have less confidence in airports where delays are frequent.

Special Assistance for Project Implementation (SAPI) for Borg El Arab International Airport Modernization Project
Chapter 5 Current Conditions of Borg El Arab International Airport - Final Report -
5-7
Possible Strategy for the Future
Given the fact that demand for air transport in Egypt overall is expected to continue growing, it is expected that demand at Borg El Arab International Airport would grow and there is every possibility of a major increase in aircraft movements. Although continued shared use with the military would not pose a problem to capacity, the risk of interference to civil aviation during times of emergency is higher than use of a runway exclusively for civil aviation.
A single runway system also poses the risk of not being able to guarantee punctuality, one of the core elements of air transport.
With the current number of aircraft movements, it is relatively easy to carry out maintenance on the runway. However, with increases in demand on the single runway, it will become increasingly difficult to allocate time for maintenance. This could be the cause of inefficient and costly maintenance.
Moreover, in the future, the airport will have to be closed for certain periods for major repairs to the single runway. During that time, all flights will need to be moved to another airport. However, bearing in mind future increases in traffic and aircraft size at Borg El Arab International Airport, it will be difficult to move all the flights at Borg El Arab International Airport to Alexandria-Nozha International Airport and Cairo International Airport because the capacity of those airports is limited, and there are also limitations on the size of aircraft that can be accommodated especially at Alexandria-Nozha International Airports.
An additional runway and parallel taxiway to the existing runway is one of the best options for a solution. However, this will require careful decision-making with a lot of thought given to future facility and operations planning for the airport overall, particularly concerning an additional runway and terminal. Construction will also require massive investment costs and, bearing in mind that it will be an immense project to undertake while also maintaining airport operations, a long project period can be expected.
It will ultimately be important to look at every aspect before making a decision. This includes future master plans for the airport, construction timing, costs, project length and demand.
As a result, the airport loses its competitive edge. In an era of increasing competition between airports where airlines are able to select their airport of preference, a runway's reduced handling capacity in times of emergency and other situations is a negative influence on airport growth.
On the other hand, given the immense cost of building another runway, a certain level of demand should be incorporated when looking at the cost effectiveness.
Taking the above into overall consideration, a runway solely for the use of civil aviation will be essential for providing safe, efficient operations at all times, and improving and sustaining the airport's competitive edge. However, this will need an in-depth analysis and study on safety, punctuality, convenience, construction timing, construction period, cost and demand.
Table 5.2-1 Annual Aircraft Movements 2010 Aircraft Flight Type Total Departure Arrival
6,199 3,113 3,086 Regular International504 250 254 Irregular International
41 21 20 Regular Domestic92 33 59 Irregular Domestic8 4 4 Military
328 164 164 Private140 70 70 Others
0 0 0 Mixed7,312 3,655 3,657 Total
[Source] EAC

Special Assistance for Project Implementation (SAPI) for Borg El Arab International Airport Modernization Project
Chapter 5 Current Conditions of Borg El Arab International Airport - Final Report -
5-8
Parallel Taxiway
Current Status
The parallel taxiway was built on the western side of the runway. The old terminal was also built on the same side to contribute to efficiency of operations on the airside.
Operational Issues
Because the new terminal was built on the opposite side of the runway, departing aircraft must cross the runway to enter the parallel taxiway.
[Landing Operations] Under the present situation where there is plenty of time between flights, when runway 14 is used
landing aircraft can turn around on the turning pad at the runway end, backtrack along the runway and travel via the new terminal taxiway to their parking stand. That is how aircraft may operate at the moment.
However, in future when the traffic increases significantly, the landing aircraft will need to exit the runway to the parallel taxiway immediately after landing.
[Departure Operations] When the runway 32 is used and departing aircraft use the parallel taxiway at the moment, they hold
short of the runway until given clearance by air traffic control to cross the runway. This procedure causes not only a safety risk for pilots, but also results in long waiting times and affect punctuality of flight times.
Under the current operational condition, this procedure is acceptable as the flight density is still very low, however again in future when the traffic increases significantly, another parallel taxiway exclusively for the civil aircraft operating at the new passenger terminal should be provided.
[Changes in Runway Direction Due to Wind Shifts] The operational direction from which aircraft arrive or take off is usually against the wind. When the
direction changes due to the change in wind direction, and if the runway would be used for the aircraft taxing as described in Landing Operations, the runway has to be occupied by the aircraft for longer time. In the event, other arriving or departing aircraft may have to wait for longer. Therefore, if the direction change does not take place smoothly, it will interfere the flight times of subsequent aircraft. This would affect operational safety and efficiency and even lead to major accidents.
These are factors that could prevent efficient use of the runway and taxiways. Not only will they affect aircraft safety and punctuality, they also stand in the way of improvements in passenger services.
Possible Strategy for the Future As with runways, the construction of new taxiways not only enables greater safety and efficiency in
operations, it is also essential for lifting the competitive edge of the Airport. However, when undertaking this, the new taxiway should be so located that it provides an effective
thoroughfare between the runway and the new terminal area.

Special Assistance for Project Implementation (SAPI) for Borg El Arab International Airport Modernization Project
Chapter 5 Current Conditions of Borg El Arab International Airport - Final Report -
5-9
Connecting Taxiways to New Terminal
Current Status
The two connecting taxiways from the new terminal to the runway were built. The two taxiways enable the effective one-way directional operations when arrival and departure are
made simultaneously. Because the terminal is closer to Runway 14 side the runway is some way from the terminal so
taxiing takes a considerable amount of time when using Runway 32, which is used in most period of time.
Operational Issues
Should a malfunction or emergency situation occur on an aircraft on a taxiway, there is no place to enable that aircraft to be placed out of the way. Consequently, if a distressed aircraft has no option than to stop on the taxiway and there are aircraft behind it, those aircraft will also have to stand idle and this could also impede flight operations.
Because there are adequate intervals between flights under the scheduling at this stage, the probability of this happening is low. However, when aircraft traffic increases in the future, the probability also increases.
Possible Strategy for the Future
When the aircraft movements increase in future, operational safety can be safeguarded through secured provision of adequate intervals between taxiing aircraft.
Regulation or emergency plan for those taxiways should be considered, and cooperation with airlines and air traffic control should be confirmed to project the plan smoothly.

Special Assistance for Project Implementation (SAPI) for Borg El Arab International Airport Modernization Project
Chapter 5 Current Conditions of Borg El Arab International Airport - Final Report -
5-10
Follow-me car Operation
Current Status
Currently, when an aircraft lands, a follow-me car is used to lead the aircraft to its parking stand. Generally, the ground control officers in air traffic control give taxiing instructions to pilots to guide
them to their parking stands but as there is no ground control officers and air traffic controllers do the duty at the Airport, a follow-me car waits at the designated position for the aircraft, makes contact with the pilot and guides him to the parking stand.
Possible Strategy for the Future
This is fully feasible with the current level of aircraft traffic (around 14 flights a day) but as this traffic increases along with rising demand, the continuation of this method or another viable method will need to be examined. As aircraft traffic increases, there will be a flurry of vehicles, much smaller than aircraft and difficult to see from other taxiing aircraft. This will not only reduce operational safety on the airside, it will also mean that more marshalling vehicles and staff will be required. The need to provide operational safety training will also require additional costs.
Conversely, ground control officers will be essential if the operation of follow-me cars is stopped. If ground control officers are provided, pilots will be able to receive their instructions from the controller and taxi themselves to their parking stands.

Special Assistance for Project Implementation (SAPI) for Borg El Arab International Airport Modernization Project
Chapter 5 Current Conditions of Borg El Arab International Airport - Final Report -
5-11
5.2.3. Passenger Terminal Building
Passenger Boarding Bridges
Passenger Boarding Bridge Current Status
There are four passenger boarding bridges. Two of them are used for both international and domestic flights. Others are used only for
international flight.
Operational Issues
EAC staff is responsible for the operation of the passenger boarding bridges (PBB). They are generally operating problem free at the moment. There has been no evidence of incidents
such as collisions with aircraft.

Special Assistance for Project Implementation (SAPI) for Borg El Arab International Airport Modernization Project
Chapter 5 Current Conditions of Borg El Arab International Airport - Final Report -
5-12
International - International Transit Facilities
International Transit Lounge
Current Status
The transit facilities in the new terminal are located on the arrivals level of 1st floor. However, because transit passengers were not taken into consideration initially, the area is very
confined, as is the waiting area for transit passengers
Operational Issues
There is no route after security screening in the transit area to the departure gate lounges on the 2nd floor.
Consequently, transit passengers have to emerge on the arrival passenger flow line, and go back up a fixed bridge to the departure level.
Although the structure separates outbound and inbound passenger flows for improved security, transit-screened connecting passengers will have to re-enter the inbound passenger flow.
Possible Strategy for the Future
As there are no transit passengers at present, this situation has not happened but in future transit passengers will temporarily be required to travel against the inbound passenger flow led by airline or EAC staff, through a fixed bridge and into the departure lobby.
When transit passenger demand increases, it will not be feasible for staff to usher transit passengers in the above manner. Even if there is no increase in demand, it would not be possible to eliminate the risk of illegal entry and smuggling with a temporary solution.
It is normally not accepted practice for transit passengers cleared by security and sent to the departure lobby via the arrival passenger flow. Therefore, if it is possible to provide a route to the departure lobby that does not threaten security and does not pass through the inbound passenger flow, it should be implemented as soon as possible.

Special Assistance for Project Implementation (SAPI) for Borg El Arab International Airport Modernization Project
Chapter 5 Current Conditions of Borg El Arab International Airport - Final Report -
5-13
Departure Bus Gate
Departure Bus Gate
(International and Domestic)
Current Status
When departing from a remote stand, passengers should take bus to the aircraft for boarding. Only 1 bus gate with not enough space is available, passengers should wait at pre-departure lounge in
the 2nd floor, and guided by airline in sequence to the ground floor for boarding.
Operational Issues
The bus gate should not be simultaneously used for international and domestic services. When switching over between international and domestic use, all gate areas must be checked to
prevent illegal entry to the country and terrorist hijacking. The bus gates should be empty before use, to confirm that no suspicious individual, unidentified
objects, smuggling, .including the garbage containers is present. Each supervisor should ensure that all points must be checked in order to use a gate for international
or domestic services, and this will take a certain amount of time. These checks require not only EAC staff but also the cooperation of Customs and Police supervisors.
Possible Strategy for the Future
When the number of flights does increase, there will not be enough fixed gates, particularly during peak hours and there will be more frequent use of the bus gate. Therefore, passengers should be guided safely with customer service staff, playing a central role as well as the airline staff.
Bearing in mind that the gate is to be used for international and domestic flights, from an operations point of view, schedules should be thoroughly checked before assigning stands. Due consideration should be given to the time required to switch the gate from domestic to international or vice versa so as to avoid overlapping flights on the gate. Care should also be taken to ensure that the switch does not take an unreasonable amount of time.

Special Assistance for Project Implementation (SAPI) for Borg El Arab International Airport Modernization Project
Chapter 5 Current Conditions of Borg El Arab International Airport - Final Report -
5-14
5.2.4. Terminal and Apron (Airside) Congestion
The hourly distribution of aircraft movements at Borg El Arab International Airport is graphically shown based on the September 2011 schedule to verify the level of terminal and airside congestion (please refer to Figure 5.2-1 and Figure 5.2-2).
3
2
1
0
1
2
3
0 1 2 3 4 5 6 7 8 9 10 11 12 13 14 15 16 17 18 19 20 21 22 23
Inbound
Outbound
The number of Inbound flight
The number of outbound flight Figure 5.2-1 Flights per Hour (Inbound, Outbound)
at Borg El Arab International Airport
0
1
2
3
4
5
6
0 1 2 3 4 5 6 7 8 9 10 11 12 13 14 15 16 17 18 19 20 21 22 23
Inbound
Outbound
The number of flight
Figure 5.2-2 Flights per Hour (Inbound and Outbound Combined)
at Borg El Arab International Airport
Because operational data have not been processed or not available, it is difficult to obtain historical statistics and, therefore, the graphs were prepared based on weekly schedules. The Figures show that:
Currently 2 outbound and inbound flights are operated in an hour.
Generally, there is not a big difference in the number of flights between peak and off peak periods. Therefore, the present schedule can be described as having a uniform traffic volume.
Current peak appears from 10:00 am to 2:00 pm for inbound flights and 11:00 am to 2:00 pm for outbound flights.
Current peak operations have no polarization in daily schedules, and plenty of rooms within the airport capacity.

Special Assistance for Project Implementation (SAPI) for Borg El Arab International Airport Modernization Project
Chapter 5 Current Conditions of Borg El Arab International Airport - Final Report -
5-15
5.2.5. Current Operational Status of Key Facilities related to Airport Congestion
The key facilities that are essential to aircraft operations are: a) Aircraft stands, b) Inbound passport control, c) Baggage claim, d) Check-in counters, e) Outbound passport control. Each of these facilities is limited in capacity and can become operational bottlenecks. Current congestion in each area can be calculated from the number of flights per hour.
Table 5.2-2 List of Compatible Aircraft for Stands at Borg El Arab International Airport 2 3
remote PBBB777 X XB747 X XA340 X XA330 X XB767 OK OKA300 OK OKA310 OK OKB737- 100 to 500 OK XB737- 600 to 900 OK XA320 OK OKA319 OK OK
1A 1B 2A 3A 4A 4B 5A 5 6A 6B 7A 7Bremote remote remote bridge bridge bridge bridge bridge bridge bridge remote remote
B737- 100 to 500 OK OK OK X OK OK X X OK OK OK OKB737- 600 to 900 OK X OK X OK X X X OK OK X OKA320 OK OK OK OK OK OK OK OK OK OK OK OKA319 OK OK OK OK OK OK OK OK OK OK OK OK
Large
Medium
Small
Small
OK OK X OK OK
Aircraft Type/ Parking Pattern
OK OK OK OK OKSub Gate Number
OK OK OK OK OKOK OK X OK OK
OK OK OK OK OKOK OK OK OK OK
X OK OK OK X
OK OK OK OK OKX OK OK OK X
X OK OK OK XX OK OK OK X
Aircraft Type/ Parking Pattern remote PBB PBB PBB remoteMain Gate Number 1 4 5 6 7
Table 5.2-3 Gate Plan Sheet DATE: - 06-06-2011
REP GATE NO.ST. NO TIME DESTINATION
FLT NO. AIRLINE DEP ARR DEP TOARR FROM
4 4 02:40 01:30 Istanbul Istanbul TK 696/7 Turkish Airlines
REP STD 2 3 3 02:30 Jeddah NP 2160 Nile Air
2 7 09:15 08:30 AmmanAmmanRJ 305/6 Royal Jordanian
4 4 09:35 Kuwait E5 3512/3213 Arabia Egypt
6 6 11:10 10:10 Doha QR 510/1 Quarter Airways
5 5 11:50 10:50 Kuwait Kuwait KU 545/6 Kuwait Airways
4 4 12:00 11:15 Dubai Dubai FZ 177/8 Fly Dubai
6 6 13:15 12:20 Abu DahbyAbu Dahby EY 663/2 Etihad Airways
3 3 19:25 18:00 Abu DahbyKuwait E5 3558/3511 Arabia Egypt
5 5 20:15 19:00 Jeddah Jeddah SV 331/2 Saudi Airways [Source] EAC data

Special Assistance for Project Implementation (SAPI) for Borg El Arab International Airport Modernization Project
Chapter 5 Current Conditions of Borg El Arab International Airport - Final Report -
5-16
Aircraft Parking Stands
Current Status
There are 4 stands with fixed passenger boarding bridges (fixed stands) and 3 remote stands with no fixed passenger boarding bridge where passengers are transported to the terminals by bus. In total, there are 7 stands which, depending on aircraft type, can accommodate up to 12 aircraft. One of the four fixed stands is a swing gate which can be used for both domestic and international flights.
Figure 5.2-2 shows a maximum of 3 flights per hour for outbound and inbound flights combined at present. As long as there are no restrictions on aircraft type, all three flights will be able to use the fixed gates. Aircraft which are not compatible with the fixed gates will use remote stands. At present, there are plenty of stands available.
shows the types of aircraft that can be accommodated by the stands.
Operational Issues
Gates are assigned at the discretion of the operations supervisor after having received flight information for the following day. This information is shared by way of the following plan sheet which is distributed by the relevant department.
There are no specific regulations governing the stand assignment. This is decided at the discretion of the supervisor on the day.
Similarly, no data on daily assignment statistics is kept so trends are not analyzed. There is no differentiation concerning delayed flights from the previous day or other irregular flights.
Possible Strategy for the Future
Keeping assignment data is extremely important. This is because it can help analyze what kind of assignment patterns will facilitate safe, smooth operations on the apron and in the terminals.
For example, allocating stands in the same area to an airline operating several flights at the same time can be easier for the airline to operate and also be more efficient.
If aircraft with the same or similar schedules are parked next to each other, both of the aircraft may require to be pushed back at the same time. It may not be possible to simultaneously push-back the two aircraft side by side.
Assigning stands that will allow both aircraft to leave their stands at the same time rather than making one wait, will help both flights to remain on time.
Assigning a stand close to the transit area for flights with a large number of transit passengers will also enable passengers to be guided smoothly to the transit area.
Maintaining data for regular discussions and improvements in the operations division is important for achieving safer and more efficient operations. With the current number of flights, assigning stands at the discretion of the supervisor is not a problem but as the number of flights increases, a tighter schedule will apply to the operation of the stands and a planned, efficient form of stand assignment will be essential to smooth operations.

Special Assistance for Project Implementation (SAPI) for Borg El Arab International Airport Modernization Project
Chapter 5 Current Conditions of Borg El Arab International Airport - Final Report -
5-17
Inbound Passport Control
Inbound Passport Control Line
Double Passport Checks
(Inbound Passport Control)
Current Status
Inbound passport control has 10 booths occupying 405m2. Inbound passport control is undertaken by Ministry of Internal Affair (police) by normally staffing 2
officers for each booth.
Operational Issues
It is found that average processing time is approximately 75seconds per passenger. It is observed that, since currently 2 booths only are made available at peak hour, queuing lines used to
stretch out of the passport control area into the arrivals concourse. It is Egyptian custom that another police is manned to double-check the visa and stamp immediately
after passport control desks, but there is no queuing space for people to wait. It is difficult to get data on the shift system (number of personnel, shift hours, roster system) so there
is no clear information available. It was informed that the same immigration officers cover Cairo and Alexandria-Nozha International
Airports in shifts.
Possible Strategy for the Future
Unlike outbound passport control, all passengers rush to the inbound passport control upon their arrival at once. Effort must be devoted for the police to timely assign more officers to open another booth, and for EAC to assist passengers while waiting to complete their procedures.
An important step is to encourage the different groups and agencies to work together through frequent sharing of information among the organizations, including the EAC, airlines and police, and the designation of a liaison system and cooperative framework.
Although no details on the shift system used by police are available, it is suggested for police to permanently assign more officers for inbound passport control desks, and for EAC to acquaint them with precise arrival time and numbers of arriving passengers so that they can timely open more booths when there are more flights with more number of passengers than normal.

Special Assistance for Project Implementation (SAPI) for Borg El Arab International Airport Modernization Project
Chapter 5 Current Conditions of Borg El Arab International Airport - Final Report -
5-18
Baggage Claim
Baggage Claim Area
Lost Baggage
Current Status
The Airport has three carousels (2 international and 1 shared international / domestic). 1 carousel is dedicated to one flight at all times.
Figure 5.2-1 shows a maximum of 2 arriving flights per hour at present. The two international carousels enable one to be used for each flight even if the two flights arrive at the same time.
Therefore, no problems exist with peak hour capacity.
Operational Issues
Misdirected or lost baggage is left in the baggage claim area or outside it at present. Anybody can get access to this baggage, a situation that has very dangerous implications for security.
From a Customs perspective also, bonded storage measures should be enforced for lost baggage.
Possible Strategy for the Future
With growth in demand and increases in the number of international flights per hour, when 3 or more flights arrive simultaneously, peak capacity will be at its limit.
If 2 or more domestic flights arrive simultaneously, there could be problems with the current handling capacity.
When this situation occurs, one carousel will need to be shared by two flights. This will require an operational strategy such as removing baggage from the first flight quickly off the carousel and placing it in one location identifiable with that flight.
A dedicated storeroom should be provided for lost baggage. Ordinarily, lost baggage is kept in a bonded storage area. At other airports, for example, the airlines are responsible and take the baggage to bonded storage. A register entry is made when the baggage is submitted and when the owner appears, the airline is able to retrieve the baggage in exchange for the registration slip.

Special Assistance for Project Implementation (SAPI) for Borg El Arab International Airport Modernization Project
Chapter 5 Current Conditions of Borg El Arab International Airport - Final Report -
5-19
Check-in Counters
Check-in Counters
Current Status
The departure check-in area is a spacious; 775m2 with 20 check-in counters At present, 2 to 4 counters are used per flight. The number of counters is assigned by the Central Control
Operation (CCO) of the airport, who is responsible for operations, depending on the prevailing circumstances for the day.
Charges are not imposed for use of the counters. There are two different types in terms of passenger processing time. When the check-in for LCC flights, such as Air Arabia Egypt, was observed currently processing time
was approximately from 3 to 5 minutes per passenger. On the other hand, when the check-in for Legacy airlines, such as Turkish Airlines, was observed currently processing time was approximately from 1 to 2 minutes per passenger. No congestion was evident for both operation and check-in operations went relatively smoothly without any operational problem, because there is plenty of margin for peak hour passenger numbers.
Possible Strategy for the Future
Congestion may increase with future growth in the number of flights. Even if there is no increase in the number of flights, the use of bigger aircraft will produce more passengers per flight.
To deal with this situation, airlines should be consulted on the assignment of check-in counters, which is presently unregulated, to achieve safe and efficient operations.
For example, the position, number and open times of check-in counters and how to make a line with safe and efficient way for passengers flow for each flight could be decided based on weekly schedules.
Current operational procedure will certainly cause congestion problems when the traffic increases in future.
Designating counter use in advance will enable airlines to make simple preparations and check-in their passengers smoothly.
These measures will improve the use of the overall check-in area, enabling greater handling capacity and resulting in more efficient operations in the check-in area.
Especially check-in for LCC flights should be considered extra care since many passengers do not familiar with using air travel, and it results in more processing time for check-in, which has to be reduced for more safe and efficient use.

Special Assistance for Project Implementation (SAPI) for Borg El Arab International Airport Modernization Project
Chapter 5 Current Conditions of Borg El Arab International Airport - Final Report -
5-20
Outbound passport control
Outbound Passport Control
Passport Control Booth (Right) and Security Screening (Left)
Current Status
The outbound passport control area has a floor space of 360 m2 with 8 booths. Adjacent to this is a 457 m2 departure circulation area. Therefore, adequate space is provided at present.
For the purpose of verification operations of the area was observed during peak hours (check-in for 3 flights were available) but, any congestion were not observed.
With two flights per hour during peak periods at present, there would be up to 240 passengers. Since there was no congestion at the check-in counters either, there were no obvious deficiencies in operational safety or efficiency at passport control, the next step in passenger processing after checking in.
Operational Issues
Most passengers using the airport seem to be unfamiliar with air travel since the survey team observed longer passenger processing time than normally observed.
For example, many passengers didn’t know how to proceed to the gates to board. They didn’t know about passport control or how to fill out immigration cards. Therefore, it sometimes took longer to process one passenger.
Possible Strategy for the Future
Security screening is immediately after passport control and the area is confined. Consequently, safety should be ensured by having passport control officers and security personnel attend to some of the finer points of operations such as ushering passengers.
Since most of the passengers didn’t know about the procedures to be followed, airport staff including immigration officials and airline personnel, need to provided more guidance and extend extra care to passengers.

Special Assistance for Project Implementation (SAPI) for Borg El Arab International Airport Modernization Project
Chapter 5 Current Conditions of Borg El Arab International Airport - Final Report -
5-21
5.3. Analysis on Egypt Air Relocation to Borg El Arab International Airport
5.3.1. Assumed Congestion
One of the prerequisites of the Project was that Alexandria-Nozha International Airport would be closed and all the flights from that airport would be transferred to Borg El Arab International Airport. Consequently, the Egypt Air flights have been added to the hourly distribution of the flights at Borg El Arab International Airport (shown in Figure 5.2-1 and Figure 5.2-2). Figures 5.3-1 and 5-3-2 show the hourly distribution of aircraft movements thus obtained.
3
2
1
0
1
2
3
0 1 2 3 4 5 6 7 8 9 10 11 12 13 14 15 16 17 18 19 20 21 22 23
Inbound
Outbound
The number of Inbound flight
The number of outbound flight Figure 5.3-1 Hourly Number of (Inbound, Outbound) Flights
Combined Hourly Distribution of Flights at Borg El Arab and Alexandria-Nozha
0
1
2
3
4
5
6
0 1 2 3 4 5 6 7 8 9 10 11 12 13 14 15 16 17 18 19 20 21 22 23
Inbound
Outbound
The number of flight
Figure 5.3-2 Hourly Total Number of (Inbound and Outbound) Flights
Combined Hourly Distribution of Flights at Borg El Arab and Alexandria-Nozha
On an assumption that Egypt Air was operating at Borg El Arab International Airport, the peak arrival period was between 2:00 pm and 4:00 pm with up to 3 flights an hour.
The peak departure period was between 9:00 am and 10:00 am with up to 3 flights an hour.
Because there is only one make up conveyor for sorting baggage to be loaded onto aircraft, there is a possibility that the system would not be able to cope with the baggage from 3 to 4 flights an hour. Therefore, the Study Team considers that more efficient operations of what are required.

Special Assistance for Project Implementation (SAPI) for Borg El Arab International Airport Modernization Project
Chapter 5 Current Conditions of Borg El Arab International Airport - Final Report -
5-22
5.3.2. Operational Status of Key Facilities related to Assumed Congestion
Aircraft Parking Stands
Assumed Status
Table 5.3-1 shows stand usage based on combined flight schedule. As this is merely a simulated assignment, actual conditions may mean aircraft on the stands of an hour or more in a real situation.
Operational Issues
It has been estimated that the maximum number of simultaneously parked aircraft would be 7 (8:00am) including long-staying aircraft. As mentioned earlier, there are 4 stands with passenger boarding bridges (fixed stands of 3, 4, 5 and 6) and 3 remote stands without fixed boarding bridges to which passengers are transported by bus from the terminal (Stands 1, 2 and 7). In total, there are 7 stands (which can accommodate up to 12 small jet aircraft). These can accommodate 7 aircraft without any problem.
However, only four stands can use fixed boarding bridges simultaneously and up to three departing or arriving flight could be assigned to a remote stand. Depending on the departure or arrival times of the flights, efficient operation of the stands could enable all flights to be serviced with four fixed gates.
It is also worth considering that Air Arabia Egypt and Egypt Air as well as other airlines may park their aircraft for extended periods during the day or at night if they use Borg El Arab International Airport as their hub.
Currently Air Arabia Egypt and Nile Air park their aircraft for extended periods at the Airport, and Egypt Air operates its aircraft in a similar way at Alexandria-Nozha International Airport. Therefore, it is assumed that the number of available stands would be limited by the time of day.
Possible Strategy for the Future
In terms of the number of aircraft movements, there would still be enough stands available even if Egypt Air relocates to Borg El Arab International Airport.
However, it is conceivable that both Air Arabia Egypt and Egypt Air will use Borg El Arab International Airport as a hub. Therefore, there will be more aircraft parked for extended periods or even overnight and we can assume a relative increase in time spent on the stand per aircraft.
Consequently, when Egypt Air relocates, stand allocation should also take into consideration the airline's aircraft rotation.

Special Assistance for Project Implementation (SAPI) for Borg El Arab International Airport Modernization Project
Chapter 5 Current Conditions of Borg El Arab International Airport - Final Report -
5-23
Table 5.3-1 Diagram of Hourly Stand Usage Based on simulated flight schedule
* Yellow indicates international, green indicates domestic * Stands 1, 2 and 7 are remote stands. * Stands 3 and 4 are swing gates and can be used for both domestic and international flights.

Special Assistance for Project Implementation (SAPI) for Borg El Arab International Airport Modernization Project
Chapter 5 Current Conditions of Borg El Arab International Airport - Final Report -
5-24
Inbound Passport Control
Assumed Status
Figure 5.3-1 shows up to 3 flights in the peak arrival time. Assuming the present small A320 class of aircraft, we can estimate 300 to 360 passengers.
Operational Issues
Assuming each passenger requires 1.2 m2 of space, this would produce a maximum number of passengers of around 337, more than the capacity of the facilities. Since the inbound passport control space includes the area occupied by the inspection booth, we can assume an even smaller space available for passengers. Based on the assumption that passport control procedures would be carried out at only two booths, the arrival of only 1 flight (carrying approximately 100 - 120 passengers) would create a queue stretching from the Immigration area almost to the passenger boarding bridge exit. Compared to this, if three flights (carrying 300 - 360 passengers) arrived simultaneously, we predict congestion in the passport control area and a queue stretching as far as the arrival concourse.
Possible Strategy for the Future
Similar to the present situation, after check-in, passengers would gradually filter through to outbound passport control. However, inbound passengers arrive en masse and proceed to the inbound passport control. Consequently, if there are more flights, we believe that remedial operational measures would be required.
Assuming a minimum of 2 passport control booths for one flight as is the practice at present, a minimum of 6 booths would be required to accommodate the anticipated number of passengers of 3 simultaneous arrivals during the peak-hour.
Passengers waiting for immigration clearance should also be ushered in an attempt to streamline operations.
An important step in achieving this is to work to enable the different groups and agencies to work together through frequent sharing of information among the organizations, including the EAC, airlines and police, and the designation of a liaison system and cooperative framework. Because we foresee that Egypt Air will carry the most passengers, the cooperation of this airline in particular would be important in adopting any measures.

Special Assistance for Project Implementation (SAPI) for Borg El Arab International Airport Modernization Project
Chapter 5 Current Conditions of Borg El Arab International Airport - Final Report -
5-25
Baggage Claim, Check-in Counters, Outbound Passport Control
Assumed Status
[Baggage Claim] As mentioned before, one baggage claim carousel is being assigned to one flight each. There are three (3) carousels at the Airport, including one (1) for domestic and two (2) for
international flights. Therefore, three flights can be accommodated simultaneously. Figure 5.3-1 shows up to three arriving flights during peak hours, therefore, the baggage claim
facilities can adequately handle this level of traffic although all carousels would be operating. [Check-in Counters, Outbound Passport Control]
It is predicted that congestion would not be largely different to existing conditions and we believe that this would not pose a problem to the capacity of the facilities.
Baggage ClaimCheck-in Counters
Outbound Passport Control

Special Assistance for Project Implementation (SAPI) for Borg El Arab International Airport Modernization Project
Chapter 5 Current Conditions of Borg El Arab International Airport - Final Report -
5-26
5.4. Mode of Access to / from Airport (Type of Transportation)
5.4.1. Operations
Modes of access to the airport are as follows: Car Taxi Bus Hired Car (Chauffeur driven limousine services)
Like other airports in Egypt, a toll is collected when entering Borg El Arab International Airport.
Statistics commencing from the opening of the new airport in December 2010 to July 2011 are set out in the table below.
Table 5.4-1 Number of Vehicles Entering Airport and Charges Collected
Item No. of Units
(Dec 2010 - Jul 2011) Daily
Vehicle Avg.Airport Entry Toll(Per Vehicle, EGP)
Total (EGP)
Remarks
Bus 1,670 6.9 15 25,050 Mini bus
(Share Ride Vehicles) 9,500 39.5 10 95,000 From Jun 2011
Car 153,835 640 5 769,175 [Source] EAC Data
Cars are the major form of transport accounting for more than 90% of the total.
There is no category in the table for hired cars and taxis but we estimate that they would comprise a sizeable number.
Buses are the cheapest (6 Egyptian pounds) form of transport but there are no timetables and they are difficult to use for those who are not familiar with them.
Mini buses were added as a category from June 2011. Mini bus is a share ride vehicle (bus).
Car hire is presently operated by one company. There is a reception desk in the arrivals lobby and they page a hired car from there. They are quite more expensive than buses, costing around 100 to 120 Egyptian pounds to Alexandria city.
5.4.2. Possible Strategies for the Future
Information on hire cars and taxis, etc should be collected to obtain a more accurate understanding of the data. This will enable the airport operator to expand its facilities more efficiently to suit the number cars, taxis, hire cars, buses and other vehicles in the future and it will also help to construct facilities economically.
It is also recommended to collect, analyze and keep past records of the access traffic so that they can be utilized for proper pricing, improvement of facilities and passenger

Special Assistance for Project Implementation (SAPI) for Borg El Arab International Airport Modernization Project
Chapter 5 Current Conditions of Borg El Arab International Airport - Final Report -
5-27
services.
It would also be beneficial if availability of parking spaces could be shared with staff on duty at the gates to the airport. It is very possible that there will be more vehicles when there is growth in aircraft and passenger traffic. There could be a shortage of parking spaces at times resulting in an overflow of vehicles. If proper records are kept to include the different types of vehicle and the traffic by hour, it would help to calculate peak periods, etc. and improve car park safety and efficiency.

Special Assistance for Project Implementation (SAPI) for Borg El Arab International Airport Modernization Project
Chapter 5 Current Conditions of Borg El Arab International Airport - Final Report -
5-28
5.5. Non-Aeronautical Revenue at Borg El Arab International Airport
5.5.1. Main Revenue at Borg El Arab International Airport
The following table shows the main aeronautical and non-aeronautical revenue at Borg El Arab International Airport.
Table 5.5-1 Breakdown of Major Charges at Borg El Arab International Airport Aeronautical Revenue Non-aeronautical Revenue
Landing fees Airport entry vehicle tolls (parking)
Aircraft parking charge (up to 5 hours) Food & beverage outlets, merchandising, duty free
Aircraft layover charge (5 hours or more) Advertising
Firefighting facility charge Rent for offices, etc.
Follow-me car charge Others
Fixed boarding bridge charge
Others [Source] SAPI Study Team Survey
Non-aeronautical revenue at the Airport comprises airport entry vehicle tolls, proceeds from food and beverage, retailing and duty-free sales, advertising and rental charges for offices, etc.
EAC has no authority to change the tariff system of aeronautical revenues as such authority has rest with the government. As the air transport demand is expected to grow, the aeronautical revenue is also expected to increase, however, within the framework of tariff system the Government approved.
It is important to ensure a source of revenue that is relatively unaffected by demand for air transport in order to sustain stable operations and management of the airport. More precisely, proactive expansion of non-aeronautical revenue is essential.

Special Assistance for Project Implementation (SAPI) for Borg El Arab International Airport Modernization Project
Chapter 5 Current Conditions of Borg El Arab International Airport - Final Report -
5-29
5.5.2. Non-aeronautical Businesses at Present
1) Airport Entry Vehicle Tolls
As mentioned in 5.3 above, tolls are imposed on vehicles entering the airport depending upon the category of vehicle.
2) Food & Beverage, Merchandise and Duty-free Concessions at Present
The following table shows food and beverage, merchandise and duty-free concessions at being operated at Borg El Arab International Airport at present.
Table 5.5-2 Food & Beverage, Merchandise and Duty-free Concessions at Present Business Type Place Remarks
1 Cafe Ground floor Landside 2 Cafe Ground floor Landside 3 Cafe Ground floor Landside 4 Cafe 1st floor Landside
5 Restaurant 2nd floor Departures gate area Closed but
opening preparations underway 6 Cafe 2nd floor Departures gate area 7 Cafe 2nd floor Departures gate area 8 Cafe 2nd floor Departures gate area Closed 9 Cafe 2nd floor Departures gate area Closed
10 Cafe 2nd floor Departures gate area Closed
Shared with domestic area 11 Duty free shops 2nd floor Departures gate area 12 Duty free shops Ground floor Baggage claim area Arrivals duty-free shops
13 Pharmacy Public area Scheduled to open
(No details available) [Source] SAPI Study Team Survey
There are six food and beverage outlets operating at present and two duty-free shops—one in the departures lobby (using two shop spaces) and the other in the arrival baggage claims area. There are no merchandise stores.
Most of the concessions are cafes with no merchandise shops. The number of closed shops is striking.
All the cafes and restaurants belong to an Egypt Air subsidiary (Egypt Air Catering Service) and the duty-free shops are operated by one duty free operating company “Dufry”.
In a conversation with a manager of a duty-free shop, the Study Team was informed that they would like Egypt Air to be transferred from Alexandria-Nozha International Airport because that would mean more passengers. It has been also informed that the company would welcome more competition as it would encourage them to offer better products and services.
There is no detailed information on the method of selecting tenants since no data was made

Special Assistance for Project Implementation (SAPI) for Borg El Arab International Airport Modernization Project
Chapter 5 Current Conditions of Borg El Arab International Airport - Final Report -
5-30
available. However, according to staff, tenders are invited by EAC head office, successful tenders are selected and contracts are concluded. Sales, etc. are also managed by the finance department in EAC head office.
a) Operational Issues
The cafes and restaurants differ to one another but are all operated by the same company in a situation that is close to a monopoly. Consequently, it is difficult for the principle of competition to work and this could lead to problems with efficiency and service quality, etc.
Dufry also has a monopoly on the duty free shops and this could work against the principle of competition.
Furthermore, the shop hours are around the clock but in fact, they are able to close at their own discretion. However, in reality, none of the shops that are now operating closes.
No details of the commercial provisions have been made available to the Study Team. However, it is envisaged that a concession fee should be payable by operators of duty free shops and food & beverage outlets, merchandising. It includes both sales-based commission fees and rental fee for space.
b) Possible Strategies for the Future
In order to present more attractive retail facilities, the monopolies should be abandoned and at least two companies should be in operation to compete each other in terms of the service quality and product line up.
It is also important to eliminate any tendency towards certain types of business and to respond more to the diversified passenger needs. With the exception of one restaurant, all of the food and beverage outlets are cafes. There is not one merchandise store where passengers can buy souvenirs. At Hurghada International Airport, for example, an area resembling an Egyptian market has been set up which offers a great selection of souvenirs.
It is important for the officer in charge at Borg El Arab International Airport to liaise more closely with shop operators. At most of the leading airports around the world, tenants have banded together to form councils which exchange information at regular basis with airport operators. This enables the airport operator to understand the problems encountered by the tenants and is also useful for introducing improvements to retail areas.
Full use of customer satisfaction surveys and feedback boxes at the airport to collect information on opinions concerning tenants and customer needs can be one method that will result in producing a more attractive retail area.

Special Assistance for Project Implementation (SAPI) for Borg El Arab International Airport Modernization Project
Chapter 5 Current Conditions of Borg El Arab International Airport - Final Report -
5-31
Cafes (Different shops but the same operator)
Closed restaurants Duty-free shops
Figure 5.5-1 Shops at Borg El Arab International Airport
3) Advertising
Advertising is one of the main pillars of non-aeronautical revenue along with shop rental.
There are a lot of spaces ideal for surface advertisements but almost none are under contact and they are filled with tourism pictures.
Like the concession contracts, contracting is done by EAC head office but it seems that no detailed information is conveyed to the department in charge of advertising at the airport.
The department provides EAC head office with information on available media. The Study Team recommends that some further improvements are needed to increase advertising revenue.
Figure 5.5-2 Advertising under Contract (Right) and Vacant Space (Left)

Special Assistance for Project Implementation (SAPI) for Borg El Arab International Airport Modernization Project
Chapter 5 Current Conditions of Borg El Arab International Airport - Final Report -
5-32
4) Rents for Offices, etc. at Present
Offices are rented to airlines and airport businesses and this becomes revenue. No details are available because data were not disclosed. However, the rental of offices is contracted by EAC head office, therefore, we assume that head office also oversees the tenant selection method and revenue details.
In addition to the offices, there are ten counters for car hire companies and local hotels in the arrival lobby on the 1st floor; and 4 bank counters for inbound visas located before passport control.
Figure 5.5-3 Hotel and Hire Car Counters
5.5.3. Present Contracts (Concessions, Advertising, Office Rental)
All contracts are handled by EAC head office. The Study Team made inquiries concerning the contract formats and turnover, etc. but such information was not disclosed. Consequently, we have no detailed information.
With regard to advertising and concessions, it seems that a general tender is announced by EAC head office and successful tenderer is selected through that process.
1) Operational Issues
Because the contracts are handled by EAC head office, the department in charge of concessions at the airport is not familiar with the contract formats for each shop. There is even a prescribed procedure concerning turnover to be delivered to EAC head office. The procedure prescribed seems to very much complicated and time-consuming, and therefore it is difficult for the airport department to gain information on current conditions in a timely manner and renders it impossible to consider strategies for improving turnover.
2) Possible Strategies for the Future
Even if EAC head office continues to keep majority of authorities to handle any contracts,

Special Assistance for Project Implementation (SAPI) for Borg El Arab International Airport Modernization Project
Chapter 5 Current Conditions of Borg El Arab International Airport - Final Report -
5-33
some authority should be transferred to the Airport as incentive so that more productive business environment can be created at each of the airports, thus enabling expansion of the non-aeronautical revenue.
First and foremost, EAC head office and the airport should continually share information on monthly turnover figures, customer numbers and value of purchases per passenger, etc. This will enable staff at the airport to be conscious of goals in their work. With close communication between EAC head office and the airport departments, they should be able to work together to produce schemes for improvement.

Special Assistance for Project Implementation (SAPI) for Borg El Arab International Airport Modernization Project
Chapter 5 Current Conditions of Borg El Arab International Airport - Final Report -
5-34
5.6. Airport Marketing Activity at Borg El Arab International Airport
5.6.1. Current condition
EAC head office is responsible for all marketing activities for Borg El Arab and all other airports under EAC to ensure efficient commercial activities.
Airport Sales for airlines
Airport sales is under responsibility of the Commercial department in EAC head office.
The main activities for airport sales generally are that EAC head office attend conferences worldwide or regionally, such as “Routes Development Forum”, which provides airports with opportunities to promote its airports and be able to negotiate with many airlines at once to expand its routes network.
For their marketing activities, there are brochures, DVD and so on to promote airports.
It seems that there are strategic airport marketing plan, for EAC’s regional airports, such as Sharm El Sheikh and Hurghada, which includes incentive plan for airlines to launch new routes.
However, at the moment, such incentive plans are not applied to Borg El Arab International Airport since the number of passengers in Alexandria region is almost reaching its capacity.
Airport Marketing for non-aeronautical activities
As mentioned before, all the contracts, such as concessions and office rental are handled by EAC head office. So the marketing activities cannot be controlled by the airport itself.
5.6.2. Current issues to be addressed and possible strategy for the future.
Individual marketing plan for each airport should be considered.
As the marketing activities are done by EAC head office, most of activities seem to be applied equally to all airports managed by EAC. However, as there are different characteristics among the airports managed by EAC, individual marketing plan for each airport based on each airport’s specialty should be introduced. For example, as mentioned before, there are difference between Sharm el-Sheikh, Hurghada and Borg El Arab International Airports in terms of characteristics of passengers, type of flights, and so on. Characteristics of industries for surrounding area of each airport or cities also differ from each other. Those differences should be taken into account carefully to make more effective marketing plan.
In addition, because airlines’ strategy is different from airport to airport, each airport should consider each airline’s perspective. For example, the needs of LCC and legacy airlines are different from each other.

Special Assistance for Project Implementation (SAPI) for Borg El Arab International Airport Modernization Project
Chapter 5 Current Conditions of Borg El Arab International Airport - Final Report -
5-35
Furthermore, marketing airport individually will create more responsible mind for each airport, and encourage each airport’s autonomy. Creating a sense of ownership of the airport by each member of staff is one of the most important factors for pursuing further development of the airport.
Create more awareness for airport marketing by airport staff.
Because EAC head office deals with all marketing activities for the airport, detailed information about the marketing do not seem to be shared with staff at the airport. This will lead to loss of airport staff initiative and create lack of interest to improve their airports.
Sometimes staff working at the airport would find different idea and thoughts, which could be very important for the airport. It is important to give staff initiative and independence of mind.
Therefore, airport staff should be given the situation for marketing of the airport, which make airport staff aware more about the airport from the management point of view.

Special Assistance for Project Implementation (SAPI) for Borg El Arab International Airport Modernization Project
Chapter 5 Current Conditions of Borg El Arab International Airport - Final Report -
5-36
5.7. Management of Borg El Arab International Airport
5.7.1. Current Organizational Structure of Borg El Arab International Airport
The operation of an airport requires a diverse range of management skills much like managing a city. These include facility maintenance and management, aviation security, airport security, airport operations, financial management, passenger service, communicating with local communities and environmental conservation, etc. Should any of these fall short, it becomes impossible to maximize facility functions and operations and sustain a smooth, successful airport operation. An organization format that is compatible with the circumstances of the airport, and the deployment of personnel and development of human resources are important in order to maximize the roles and functions of each of these.
1) Organization
Organization The organization of Borg El Arab International Airport is structured in accordance with the
stipulations of EAC head office. Please refer to the figure below for the organization chart. Figures in parentheses show the number of staff.
Currently, there are 250 personnel at Borg El Arab International Airport. Approximately 42% are maintenance staff and about 30% are operations staff.
According to interviews with EAC staff, the Study Team learned that the actual staff numbers in individual sections are sometimes not necessarily the same as the figures quoted in the organization chart. This is because the organization chart shows the number of staff under contract but, although they are employed in a particular section under the contract terms with EAC, some actually work in different departments. For example, a person employed in customer services is now working in Quality Control. In addition, some are working in another section temporarily because their section is still being established. It appears that transfers are ultimately decided by the airport director.

Special Assistance for Project Implementation (SAPI) for Borg El Arab International Airport Modernization Project
Chapter 5 Current Conditions of Borg El Arab International Airport - Final Report -
5-37
2) Analysis of Organizations at Present
Safety Department The Safety Department comprises six staff: Air traffic controllers responsible for aviation safety,
and engineers and technicians responsible for the maintenance and management of facilities that are essential to safety.
However, in interviews the Study Team learned that the work is being done by three people: a manager, a controller and an engineer.
Manager(1)
Safety Department<Number of employees: 6>
Safety Controller (1)
Safety Technician (3)
Safety Engineer (1)
Main Activities
The department is involved in the introduction of the Airport Safety Management System (SMS) and the supervision of compliance with the system.
It oversees the maintenance of the runway, taxiway and apron areas to ensure airside safety. The department controls access inside the terminal by airport staff and passengers, oversees access
to public areas and also restricted areas where only passengers and designated employees can enter, and also oversees facilities associated with access control, such as CCTV cameras.
Familiarization of airport staff with the importance of safety Because safety is closely related to terminal and apron operations, this is done in conjunction with
the Operation Department.
Possible Strategies for the Future
Safety is one of the most important items in airport operations. The activities that come under the provisions of SMS, etc. are extremely far reaching, covering areas as wide apart as terminal safety and airside safety. It must be difficult for only three people to provide all of this work.
Admittedly, this work is being done with the cooperation of the Operation Department but there are limits to this since department staff are not safety experts.
Given the probability of further increases in flights and passengers, safety will become increasingly important. Therefore, it will be important to increase the number of safety officers, assign safety specialists to operations and maintenance and provide a stronger footing to safety activities in the landside, terminal and airside areas as well as the maintenance and management activities of the facilities.

Special Assistance for Project Implementation (SAPI) for Borg El Arab International Airport Modernization Project
Chapter 5 Current Conditions of Borg El Arab International Airport - Final Report -
5-38
Security Department The Security Department has 21 staff in its organization. The night shift consists of male staff only. As the information on this matter provided to the Study
Team was very limited, a comprehensive analysis could not be conducted.
Manager(1)
Security Department<Number of employees: 21>
Security Specialist (14) Security Clerk (2) Security Guards (4)
Main Activities
To maintain safety in airport operations, security must be practiced throughout the airport, including the passenger terminals, car parks, curbside areas in front of the terminals, entrances to the airport and the airport perimeter.
The figure above shows the structure of the Security Department. The tasks assigned to the Security Department are done in conjunction with the Operation Department. The close correlation with terminal and apron operations is necessary for safe and efficient airport operation.
Possible Strategies for the Future
The activities of the Security Department assist in airport safety, the cornerstone of airport operations.
It can be assumed that it already works closely with the Operation Department in relation to operations. Therefore, the Study Team assumes that at some point in the future, the organization will become part of the Operation Department, its role will be more clearly defined and, as a result, it can be expected that more effective activities and greater improvements will be acchieved in security.

Special Assistance for Project Implementation (SAPI) for Borg El Arab International Airport Modernization Project
Chapter 5 Current Conditions of Borg El Arab International Airport - Final Report -
5-39
Quality, Commercial & Communication
The Quality, Commercial & Communication Department has a total of six personnel, including 1 manager, 3 quality officers, and 2 environmental specialists.
It operates around the clock in two shifts, 8:00 am to 8:00 pm and 8:00 pm to 8:00 am. The night shift consists of male staff only.
Despite the name, Quality, Commercial and Communication, at Borg El Arab, the environmental specialists belong to this department.
Quality Manager(1)
Quality, Commercial & Communication<Number of employees: 6>
Environmental Specialist (2)
Quality Specialist (3)
Main Activities
The main quality activity is to gather and analyze customer feedback to identify the airport's strengths and weaknesses. Ultimately, it supports the creation of an airport that meets customers’ expectations.
The department carries out daily on-site inspections, promptly notifies the relevant department if it discovers a problem, and provides instructions or assistance for remedial action.
The main activity of the environmental specialists is to maintain order in the terminals and the airport. For example, supervising the cleaning in the terminal comes under this heading. It also works in conjunction with the Safety Department in maintaining order on the airside.
Possible Strategies for the Future
As shown in Chapter 5.6.1 - 1), this section is directly under the control of the airport director at present. In maintaining quality, it is essential to look at the quality related to the activities of all of the departments at the airport in an impartial manner. Therefore, it would be preferable to retain the present organizational format.
However, the Study Team assumes that it would be better to have a more detailed demarcation of responsibilities in the section based on the type of quality under control. If there was a clear definition of responsibility, for example: operations quality, security quality, customer service quality, etc., goals would be much clearer. This would help produce more effective quality.

Special Assistance for Project Implementation (SAPI) for Borg El Arab International Airport Modernization Project
Chapter 5 Current Conditions of Borg El Arab International Airport - Final Report -
5-40
Operation Department There are 72 personnel in this organization, which is the seat of operations at Borg El Arab
International Airport. The department works around the clock. The shifts are 8:00 am to 8:00 pm and 8:00 pm to 8:00 am.
The night shift consists of male staff only.
General Manager(1)
Operation<Number of employees : 72>
Maintenance supervisor (-)
BoardingBridges (18)
Apron Controller (5)
Airport Duty officer (5)
Civil Defense Controller (2)
Terminal & Landside Supervisor (4)
Apron Supervisor (3)
Public Relations (8)
CCO (8)
Information (2)
Customer service Controller (14)
Area Controller (2)
Main Activities
The following activities are carried out under the control of the airport duty officer who supervises daily operations: 1) Customer information, terminal announcements, call center, VIP lounge and other customer
service operations; 2) Management of apron operations, inspection and reporting of apron and runway conditions; 3) Area control activities in charge of maintaining order in the terminals and car parks and the
management of cart retrieval, etc; 4) Aircraft stand assignment, check-in counter assignment; 5) Operation of boarding bridges; and 6) Providing daily operations status reports to staff in the role of operations leader and sharing
information. It has overall control of terminal, runway, taxiway and apron operations and landside security and
safety. On safety aspects it works in conjunction with the Safety Department and the Security Department and on matters related to maintenance in the event of a facility malfunction, it works with the Maintenance Department.
It also helps to maintain smooth operations by exchanging information with the airlines and other related organizations.
Possible Strategies for the Future
In reality, the airport duty officer takes command in the work place. More airport duty officers will be needed with future terminal expansion and the construction of Terminal 2. Experience in operations is important to be able to command in the work place. Experience cannot be acquired overnight and, therefore, staff now working under the airport duty officer will need to be promoted. Providing a system to develop the expertise of these individuals with an eye to the future would improve the quality of the Operation Department and lead to greater quality in operations.

Special Assistance for Project Implementation (SAPI) for Borg El Arab International Airport Modernization Project
Chapter 5 Current Conditions of Borg El Arab International Airport - Final Report -
5-41
Maintenance Department There are 106 personnel in this organization divided into individual specialist fields. Each field has
a manager and personnel with specialist technological knowledge.
Tel. operators
(6)
General M anager(1)
M aintenance<Number of employees: 106>
Garage (2)
M echanics Air Conditioning
Electro mechanics
Electricity Electric & IT
Civil Works
Agriculture& Environment
Drivers(22)
M anager(1)
M anager(1)
M anager (1)
M anager (1)
M anager (-)
M anager (-)
M anager (1)
Tech. (2) Tech. (4) Tech. (6) Tech. (10) Tech. (1) Tech. (2)Tech. (3)
Worker(5)
Worker(2)
Worker(2)
Worker(1)
Worker(4)
Specialist (2)
Sewage and water plant
Air Conditioning
Baggage Handling System PSS Lighting Runway Airport
GreeneryFirefighting equipment Chillers Explosives
Detection System Power Facility
Power supply equipment Taxiways
Passenger Boarding Bridges
CCTV Other Access Roads
X-ray equipment Network Equipment Car Parks
Elevators and escalators
Terminal Announcement
Equipment
TV Flight Information
Display System Common User
Terminal Equipment
Main Activities
The department repairs, maintains and manages each facility and piece of equipment.
Personnel responsible for maintaining and managing the greenery in the Agriculture and Environment department are also in the Maintenance Department.
Possible Strategies for the Future
Because of the clear definition of specialist fields, responsibilities are clear and the work is easy to undertake.
It is important to continue developing the department's human resources through training to further enhance the quality of facility repairs, maintenance and management.
It is important to work in conjunction with the Operation Department in particular to be aware how their repairs, maintenance and management reflect on operations.

Special Assistance for Project Implementation (SAPI) for Borg El Arab International Airport Modernization Project
Chapter 5 Current Conditions of Borg El Arab International Airport - Final Report -
5-42
5.7.2. Observations Concerning the Approach to the Future by All Organizations
1) Accurate Understanding of Personnel Numbers and Assignment System
It will be important to look at the personnel requirements for an increase in flights resulting from greater demand. To achieve this, it is also important to have an accurate understanding of how many employees are actually working in each section.
2) More Extensive Links in the Inter Organization Cooperative Framework
The present organization remains the same as when it was put together by EAC headquarters and staff carries out their work on the basis of individual responsibilities. However, as mentioned previously, the operation of an airport requires a diverse array of activities. Therefore, although it is important to have responsibilities for individual organizations and for those to be discharged as deemed appropriate, working together with other organizations at the same time makes it possible to achieve safer and more efficient airport operations.
For example, the quality of operations and efficiency are closely related to safety, security and the maintenance and management of facilities. Therefore, it may be desirable for those sections to be placed under the Operation Department and to create close links.
3) Continued Human Resources Development
Many of the staff at Borg El Arab International Airport was recruited when it opened. It has been only 10 months since then and they are still not experienced. Therefore, it would be advantageous to continue with human resources development, including training on the job and off.
4) Structuring of Shift Systems to Suit Work Place Conditions
It is reported that shift workers and systems are, in principle, the same number of workers on both day and night shifts. However, airports have peak and off-peak times and under the present circumstances, there is no difference in the number of shift workers during those two time periods. This is not efficient.
It is recommended that, for example, a more detailed shift system with an efficient rationalization of staff numbers on duty depending on flight schedules and peak operating seasons.

Special Assistance for Project Implementation (SAPI) for Borg El Arab International Airport Modernization Project
Chapter 5 Current Conditions of Borg El Arab International Airport - Final Report -
5-43
5.8. Existing Assistance by Narita International Airport
Borg El Arab International Airport has received the assistance of Narita International Airport Corporation (NAA) in airport management for 2 and half years since new facility construction stage in 2009. The Airport has been assisted in airport operation and management by the specialists from NAA and worked on preparation and proficiency before and after the opening of newly developed airport facilities. Moreover, the Airport dispatched about 100 staff to Japan, and NAA provided the training opportunities on airport operation and management of global standards at Narita International Airport.
The results for these airport assistances are reviewed as followings.
5.8.1. Assistance Items and Implementation
Specialists in each of the areas crucial to airport operation and management such as Airport Management, Airport Facilities Management, Airport Facilities Management (Civil Works) Airport Facilities Management (Equipment), and Airport Operation Management, were sent from NAA to Borg El Arab International Airport and training program for EAC staff was conducted in Japan. The assistance of NAA covered various aspects of airport operation and management. Most of the assistance offered was in the area of fundamental knowledge and operational skills because almost all of the staff were hired when the new terminal was commissioned.
The following are the main items of assistance provided.
1. Assistance with Start-up Preparations before the Opening of the New Terminal
Many items needed to be undertaken before startup to ensure trouble free, smooth opening of the new airport (Terminal). Working groups (WG) were established for individual fields (organizations) consisting of EAC staff from the respective fields and assistance was provided on necessary items in preparation for the startup.
2. Assistance with Maintenance and Management of Runways Taxiways and Other Primary Airport Facilities As Well As Mechanical Facilities (BHS,EDS,PBB, elevators and escalators, etc.).
Assistance was provided for the preparation and use of maintenance and management manuals, daily and scheduled maintenance practices, and quality improvement.
3. Assistance was provided with aviation and airport security through preparation of manuals etc.
Assistance was provided in relation to the importance of passenger security screening and screening procedures etc.
Issues and suggested improvements on site in relation to the management of apron area security were advised.

Special Assistance for Project Implementation (SAPI) for Borg El Arab International Airport Modernization Project
Chapter 5 Current Conditions of Borg El Arab International Airport - Final Report -
5-44
Assistance was provided for the preparation of manuals for airport security.
Suggestions were offered on preparations to conduct aircraft disaster rescue drills.
4. Assistance with Passenger Service Improvements
Specialists provided lectures on the pursuit of customer satisfaction and the importance of customer services, and assisted in improving staff knowledge.
Advice was given on frontline customer relations and assistance provided on creating an airport with a high level of satisfaction.
5. Assistance with Day-To-Day Operations
Specialists offered advice on gate assignment plans in relation to aircraft operations and provided assistance with the management of check-in counters and other terminal facilities.
6. Staff Training Courses at Narita International Airport
Nine courses comprising 90 airport staff have been held at Narita International Airport to date to assist EAC with capability development in airport staff.
The courses comprise lectures on fundamental aviation and airport management knowledge such as airport security, airport safety, and customer services. The courses also consist of inspection tours of facility maintenance and management and customer service job site
As mentioned above, most of the staff were recruited when the new terminal was commissioned and, therefore, they had little experience and knowledge of the aviation and airport industries. In addition, each course comprised 10 participants, and the teams were rather mixed since the departments were able to appoint several participants each. This is why the courses mainly consist of lectures on fundamental aviation and airport management, and facilities tours which allow the participants to see on-site activities.

Special Assistance for Project Implementation (SAPI) for Borg El Arab International Airport Modernization Project
Chapter 5 Current Conditions of Borg El Arab International Airport - Final Report -
5-45
Classroom Lecture
On-site Lecture
Airport Facility Inspection
Training on Customer Service
Figure 5.8-1 EAC Airport Staff Training in Japan
5.8.2. Effect of Assistance Project
It is not possible to quantitatively express the results of assistance with service aspects such as airport operations, maintenance and management and customer services but, through analysis, the following points appeared to have been particularly positive.
1. Improvements in Staff Knowledge of Airport Operations
Many of the staff at Borg El Arab International Airport were recruited right before the opening of the new terminal and had little fundamental knowledge of airport management. However, they were able to acquire the essential basic knowledge in airport operation and management through the assistance provided at Borg El Arab International Airport and the courses at Narita International Airport. This could be attributed to the system of providing comprehensive assistance with all airport operations and management. That is to say, it was the integrated management assistance in particular, which provided the knowledge and skills that needed to be acquired by all staff while simultaneously improving the knowledge and skills in the individual specialist fields. This made it possible to improve airport operations skills overall in a more organized and effective way.
2. Smooth Startup and Trouble-Free Airport Operation
Although there were several problems with facility maintenance and management, the smooth startup could be attributed to the assistance provided with advance preparations for operations and other essential items when the new terminal opened.

Special Assistance for Project Implementation (SAPI) for Borg El Arab International Airport Modernization Project
Chapter 5 Current Conditions of Borg El Arab International Airport - Final Report -
5-46
3. Airport Staff Motivation Improvement
Staff motivation was improved by being able to come into direct contact with advanced airport operations through the courses at Narita International Airport. For example, following the courses, staff were observed cleaning up themselves, something they had not done before, and using their experience in the courses to deal with customers with more care. There has also been a change in staff thinking concerning the importance of aviation security and facility maintenance and management. Not only was there a greater feeling that many of the staff were proud of Borg El Arab International Airport, they expressed that sentiment in their work on site and got better each day.
4. Understanding the Japanese way of Airport Operation and Management
Direct exposure to Japanese culture as well as a course in airport management, enables the individual to offer the high quality airport management elements that are unique to Japan through such as passenger services conceived from the customer's perspective, greater care in daily maintenance and management to prevent trouble beforehand, and the recognition of the need for improvements in the pursuit of offering the best at all times.
Passenger Assistance at Immigration Counter Guidance at Information Counter
Figure 5.8-2 Customer Care by EAC Airport Staff at Borg El Arab International Airport

Special Assistance for Project Implementation (SAPI)for Borg El Arab International Airport Modernization Project
- Final Report -
Chapter 6
Demand vs. Capacity Analysis
Table of Contents
6.1 Summary of Air Traffic Demand Forecast (Medium Case) ............................................. 6-1
6.2 Facility Requirements .......................................................................................................... 6-3
6.3 Demand vs. Capacity Analysis ............................................................................................ 6-5
6.3.1 Theoretical Future Requirements ................................................................................ 6-5
6.3.2 Specific Requirements at Borg El Arab International Airport .................................... 6-6
6.4 Future Strategy for Maximum Utilization of Existing Facilities ................................... 6-11
6.4.1 General ...................................................................................................................... 6-11
6.4.2 Barriers for Accommodating Future Capacity .......................................................... 6-11
6.4.3 Possible Future Strategy to cope with Future Growing Demand .............................. 6-12

Special Assistance for Project Implementation (SAPI) for Borg El Arab International Airport Modernization Project
Chapter 6 Demand vs. Capacity Analysis - Final Report -
6-1
Chapter 6. Demand vs. Capacity Analysis 6.1. Summary of Air Traffic Demand Forecast (Medium Case)
Air traffic demand forecast (of Medium Case) for the years 2015, 2020, 2025, and 2030 are summarized in Table 6.1-1.
Table 6.1-1 Summary of Air Traffic Demand Forecast for Borg El Arab International Airport
Item
SAROF Actual
(ALY+HBE)
Forecast Air Traffic Demand
for 2014 2010 2015 2020 2025 2030
Passenger
Movements
1) Annual Passengers 991,000 1,681,983 2,357,758 3,610,715 4,754,833 5,941,699
1.1) International 839,400 1,593,782 2,251,054 3,449,723 4,528,945 5,654,166
1.2) Domestic 151,600 88,201 106,704 160,992 225,888 287,533
2) Peak-day (2-way) 3,980 5,872 8,237 12,615 16,608 20,752
2.1) International 3,370 5,592 7,898 12,104 15,891 19,839
2.2) Domestic 610 280 339 511 717 913
3) Peak-hour (2-way) 567 659 862 1,203 1,508 1,831
3.1) International 546 573 758 1,076 1,364 1,665
3.2) Domestic 223 86 104 127 144 166
4) Peak-hour (1-way) 500 452 572 761 927 1,104
4.1) International 355 377 481 653 809 971
4.2) Domestic 145 75 91 108 118 133
Aircraft
Movements
5) Annual Flights 9,101 17,260 22,074 32,997 42,988 52,975
5.1) International 7,614 15,264 20,202 30,501 39,452 48,527
5.2) Domestic 1,487 1,863 1,872 2,496 3,536 4,488
6) Peak-day (2-way) 36 57 73 110 143 175
6.1) International 30 51 67 102 132 162
6.2) Domestic 6 6 6 8 11 13
7) Peak-hour (2-way) 9.3 7 8.2 11.1 13.5 16.0
7.1) International 4.8 5.2 6.4 9.1 11.3 13.6
7.2) Domestic 3.5 1.8 1.8 2.0 2.2 2.4
8) Peak-hour (1-way) 5.0 5.7 7.2 8.5 9.8
8.1) International 3.1 3.4 4.1 5.5 6.7 7.9
8.2) Domestic 2.3 1.6 1.6 1.7 1.8 1.9
In the SAPROF study, annual passenger demand for the year 2014 was forecasted at approximately 1 million. During the time of SAPROF study, even the then annual passenger volume was some 0.4 million, numbers of passengers were heavily concentrated in summer time (July and August) because Alexandria was likely nominated only as a resort city of relatively cooler than Cairo, where many Egyptians temporarily enjoyed their summer vacation along Mediterranean coast. Therefore, passengers’ concentration in a

Special Assistance for Project Implementation (SAPI) for Borg El Arab International Airport Modernization Project
Chapter 6 Demand vs. Capacity Analysis - Final Report -
6-2
month (August) and on the day (Wednesday evening) was extremely high.
It is a normal practice that individual airport facility requirements are planned not based on the number of annual passengers but on the peak-hour passengers’ volume. The facilities at Borg El Arab International Airport were supposedly so planned in consideration of such heavy concentration.
As air traffic increased, such originally assumed heavy concentration of passengers particularly at Alexandria-Nozha International Airport has gradually been evenly distributed through the year and through the day.
Meanwhile, actual number of annual passengers recorded in 2010 was 1,681,983, exceeding the nominal terminal capacity (1 million passengers per annum).
At a glance, the above Table implies that:
The item 4) above, i.e. peak-hour (1-way) passengers, of SAROF study (forecasted at 500 for the year 2014) would fall between 2010 (452) and 2015 (572), although the number of annual passengers forecasted between 2010 and 2015 was estimated at around 2 million.
Peak-day concentration of international passengers of the latest trend that Study Team analyzed in the foregoing Chapter 4 is 1/285 days of the yearly volumes while that originally assumed was 1/250 days.
Peak-hour passenger concentration ratio assessed from the latest trend is approximately 9 % of the daily volume, while originally assumed in SAROF study was some 14 %.
Such release of heavy concentration of airport passengers is just a normal trend when number of passenger is more than doubled.
Hence, it should be noted first in this Chapter 6 that, the airport could theoretically handle all the number of passengers currently being distributed to the 2 Alexandria’s airports (at Alexandria-Nozha and Borg El Arab), i.e. 1.7 million passengers per annum.

Special Assistance for Project Implementation (SAPI) for Borg El Arab International Airport Modernization Project
Chapter 6 Demand vs. Capacity Analysis - Final Report -
6-3
6.2. Facility Requirements
Facility requirements had been originally established through the SAROF study.
Based on the same annual passenger volumes (i.e. 991,000) of the SAPROF study, the facility requirements were reviewed through the course of detailed design in 2006, which was conducted before the Bidding for the construction contract.
Major passenger processing facilities planned at SAPROF study, at detailed design stage and those actually constructed are summarized in Table 6.2-1.
Table 6.2-1 Major Airport Facilities previously planned and As-constructed Description 2004 SAPROF study 2006 DD As- constructed
1 Annual Passengers 991,000
1.1) International 839,400
1.2) Domestic 151,600
A Passenger Terminal Total 20,840 m2 Revised to 3-story
building; for combined
Int’l & Dom
24,277 m2 A.1) International 3.1) x 30m2 16,380 m2
A.2) Domestic 3.2) x 20m2 4,460 m2
B Check-in Counter Total 15 Total 20
B.1) International (2min/pax) 3.1) x 1/ 60 min 9 4.1) x 2/ 60 min x 1.1 15
B.2) Domestic (2min/pax) 3.1) x 1/ 60 min 6 4.2) x 2/ 60 min x 1.1 5
C Security Check Check points 3 Check points 3
C.0) Entrance (12sec/pax) 2 Int’l + 1 Dom 3 4) x 12/3600 sec 2 for common
C.1) International (12sec/pax) 3 gates 3 4.1) x 12/ 3600 sec 2
C.2) Domestic (12sec/pax) 1 gate 1 4.2) x 12/ 3600 sec 1
D Passport Control
D.1) Departure (1min/pax) 4.1) x 1/ 60 min 6 4.1) x 1/ 60 min x 1.1 8
D.2) Arrival (1min/pax) 4.1) x 1/ 60 min 6 4.1) x 1/ 45 min x 1.1 10
E Customs Desks (1min/pax) 75%; 1min/ pax 6 4.1) x 1/ 60 min 6
F Baggage Claim Total 3 Total 3
F.1) International (30min/flight) 1 for LJ, 1 for SJ 2 1 for LJ, 1 for SJ 2
F.2) Domestic (30min/flight) 1 for LJ, 1 1 for SJ 1
G Apron Spot (90min/flight) 8 3 for LJ, 4 for MJ 7
If all SJ 12
H Departure Lounge Total 1,846 m2 Total 2,095 m2
H.1) International 40 min. dwelling 1,497 m2 Whole lounge can be
used for Int’l or Dom
1,690 m2
H.2) Domestic 40 min. dwelling 349 m2 405 m2
I Public Concourse 2,876 Revised to common
concourse for
combined Int’l & Dom
2,569 m2 I.1) International 2 well-wishers 2,001 m2
I.2) Domestic 2 well-wishers 875 m2

Special Assistance for Project Implementation (SAPI) for Borg El Arab International Airport Modernization Project
Chapter 6 Demand vs. Capacity Analysis - Final Report -
6-4
In the SAROF study, the passenger terminal building was planned to be a 2-story building and the international and domestic functions were individually enclosed in the same building.
Through the course of detailed design stage, the design of passenger terminal building was revised to be a 3-story building in due consideration of the vertical segregation of departing and arriving passengers for security reason as encouraged by ICAO/IATA. Those were main reasons that caused the floor area of the building increased.
Also in the detailed design, for the sake of effective use of entire building floor, common check-in area and swing pre-departure halls were provided, so that the whole areas could flexibly be utilized either for all international or domestic operations as required to accommodate the traffic at certain time of the day. The number of check-in counters was increased to meet IATA recommendations, i.e. a revised processing time of 2 minutes per passenger, instead of 1 minute adopted in the SAPROF study.
Also, the number of arrival passport control desks was increased through the course of the detailed design because the arriving passengers would be generally more time-concentrated than the departing passengers.
Those mentioned above are some reasons among others for the change in the numbers or areas of major facilities or functions constructed.

Special Assistance for Project Implementation (SAPI) for Borg El Arab International Airport Modernization Project
Chapter 6 Demand vs. Capacity Analysis - Final Report -
6-5
6.3. Demand vs. Capacity Analysis
6.3.1. Theoretical Future Requirements
Theoretical future requirements for major airport facility based on Table 6.1-1 (air traffic demand forecast) are summarized in Table 6.3-1.
Table 6.3-1 Theoretical Facility Requirements for Borg El Arab International Airport
Item As-
constructed
Future Requirements 2015 2020 2025 2030
1) Annual Pax Table 6.1-1 1,681,983 2,357,758 3,610,715 4,754,833 5,941,699
A Passenger Terminal 24,277 m2 24,820 m2 34,820 m2 43,800 m2 53,270 m2
A.1) International 3.1) x 30m2 22,740 m2 32,280 m2 40,920 m2 49,950 m2
A.2) Domestic 3.2) x 20m2 2,080 m2 2,540 m2 2,880 m2 3,320 m2
B Check-in Counter 4) x 2 / 60 x 1.1 20 20 28 34 41
C Security Check
C.0) Entrance 4) x 12/3600 sec 2 1.9 2.5 3.1 3.7
C.1) International 4.1) x 12/ 3600 sec 2 1.6 2.2 2.7 3.2
C.2) Domestic 4.2) x 12/ 3600 sec 1 0.3 0.4 0.4 0.4
D Passport Control
D.1) Departure 4.1) x1/60 min x 1.1 8 8.8 12.0 14.8 17.8
D.2) Arrival 4.1) x1/60 min x 1.1 10 8.8 12.0 14.8 17.8
E Customs Desks 4.1) x 1/60 min 6 4 5.4 6.7 8.1
F Baggage Claim 8) x 30/60 min. 3 2.9 3.6 4.3 4.9
G Apron Spot (for all SJ) 8) x 90/60 min +1 12 9.6 11.8 13.8 15.7
H Runway (m)
Runway 14R/32L If 8) < 8 3,400 m 3,400 m 3,400 m 3,400 m 3,400 m
Runway 14L/32R If 8) > 8 none none 2,500m 2,500 m 3,400 m
The Table implies that the major airport facilities constructed during the Borg El Arab International Airport Modernization Project would theoretically cover the requirements up to the year 2015 when the number of annual passengers is 2.35 million.
There are some rooms to shorten the processing time for each function from time to time by applying the latest models of CPU, scanner, or software (e.g. for immigration, check-in counter, CUTE, etc) or improved skills of airport staff, therefore it is hoped that the above-mentioned overall terminal capacity could be somehow improved, depending upon the specific behavior of passengers at this particular airport as mentioned in Chapter 6.3.2. 1) below.
At a moment, it is expected that those major facilities would be gradually congested as illustrated in Figure 6.3-1 and Figure 6.3-2.

Special Assistance for Project Implementation (SAPI) for Borg El Arab International Airport Modernization Project
Chapter 6 Demand vs. Capacity Analysis - Final Report -
6-6
Figure 6.3-1 Years of Theoretical Congestion of Passenger Terminal Facilities
Figure 6.3-2 Years of Theoretical Congestion of Airfield Facilities
6.3.2. Specific Requirements at Borg El Arab International Airport
1) Behavior of Passengers
Main characters of passengers at Borg El Arab International Airport are overseas workers and pilgrims with family members bound for Middle-East, having many pieces of baggage with them. Percentage of well-wishers and greeters per passenger is high.
Owing to the fast growing trend of LCC industry, the cost of air travel has become much cheaper than using the legacy airlines, therefore, air passengers at Borg El Arab International
B) Check-in Counter
Congested after 2015
C0) Entrance Security Check
Congested after 2015
D1) Departure Passport Control
Congested after 2015
E) Customs Desk
Congested after 2020
F) Baggage Claim
Congested after 2015
D2) Arrival Passport Control
Congested after 2020
C1) International Security Check
Congested after 2020 C2) Domestic Security Check
Not congested until 2030
H) Runway Congest at intersection after 2020,
mainly because departing aircraft must once cross the operational runway before
entering into parallel taxiway
G) Aircraft Stands
Congest after 2020

Special Assistance for Project Implementation (SAPI) for Borg El Arab International Airport Modernization Project
Chapter 6 Demand vs. Capacity Analysis - Final Report -
6-7
Airport currently include many Egyptian tourists who take international flights as their first experience.
As mentioned in Chapter 5, processing times for their check-in, passport controls or filling-up their immigration cards are much longer than the standard time suggested by IATA. Also, many arriving pieces of baggage are left behind in the international baggage claim hall, which is one of the serious problems encountered at the Airport.
The situation is totally different from those at Sharm El Sheikh or Hurghada International Airports where majority of the passengers are European tourists with small number of baggage although their carriers are mostly LCC. Seldom well-wisher or greeter appears in those airports.
When all flights currently operated at Alexandria-Nozha International Airport are transferred to Borg El Arab International Airport after December 2011, usage of the airport facilities at Borg El Arab will be suddenly increased. Unless such passengers’ behaviors are improved or EAC staff would assist passengers to acquaint the standard processing manners and regulations of international flights, saturation of the airport facilities could be fast approaching.
2) Runway and Taxiway
ICAO suggests that a single runway is capable of accommodating jet aircraft operations of more than 40 (e.g. generally 20 landings and 20 takeoffs) in an hour where a suitable taxiway system including rapid exit taxiways of appropriate numbers and positions is provided. In case the hourly 40 operations are pursued, in-trail separation of approaching aircraft (at approaching speed of 100 to 110 knot) could be set at some 5 NM, then landing of 3-minute intervals (i.e. 20 landings in an hour) and takeoff of 3-minute intervals (i.e. 20 takeoffs in an hour) injected in-between are materialized. For reference, ICAO suggests 60 peak-hour operations at maximum for large crowded airport if the in-trail separation can be minimized to 3 NM.
One major concern that may limit the practical capacity of the present runway operations at Borg El Arab International Airport is, that the existing parallel taxiway is inconveniently located on the opposite side of the runway (in MOD premise). Since prevailing wind (95%) is from north direction, main runway operations are made from the south, i.e. Runway 32.
Consequently, great majority of departing aircraft with its heavy take-off weight (after refueled) are to start from the new PTB located at north-end of the runway, to move on the 1-km long connecting taxiway, possibly to hold for aircraft landing operations before entry to the runway, to cross over the runway, and to move on 3-km long parallel taxiway before entering into Runway 32 on the south-end.
The rapid exit taxiways are provided but towards the direction of opposite side of the new terminal, arriving aircraft could not use it because, if once exit, the aircraft is obliged to

Special Assistance for Project Implementation (SAPI) for Borg El Arab International Airport Modernization Project
Chapter 6 Demand vs. Capacity Analysis - Final Report -
6-8
occupy the runway once again when taxiing back towards the new terminal.
As the air traffic increases, this kind of nuisance would surely give hard burden to air traffic controller who decides the timing of the ground traffic of departing aircraft and its holding before crossing the runway, with a cross checking of the final approach and landing of arriving aircraft.
In this circumstance, operational bottleneck is departing aircraft that crosses the active single runway. Approaching aircraft should be held in the air due to the two (2) deferent activities of the departing aircraft, i.e. crossing the runway in addition to normal taking off from the runway. When 2 minutes are assumed to accomplish the individual activities, i.e. 1) to cross the runway, 2) to take-off the runway, and 3) to approach/landing/ exit the runway, then aircraft operations are made in 6-minute cycle time (i.e. 10 takeoffs, 10 landings, 10 crossing the runway, in an hour).
For the reason discussed above, it is assumed that the existing runway could accommodate 10 arrivals and 10 departures, or 20 aircraft operations in total during peak hour, as illustrated in Figure 6.2-3.
0 10min. 20min. 30min. 40min. 50min. 60min.
Aircraft No.2: pushed-out:Taxiing: 2
Holding for landing aircraft 2
Runway Crossing: 2
aircraft No.1 Takeoff: 2
Aircraft No.3: pushed-out:Taxiing: 2
Holding for landing aircraft 2
Runway Crossing: 2
Takeoff: 2
Aircraft No.4: pushed-out:Taxiing: 2
Holding for landing aircraft 2
Runway Crossing: 2
Takeoff: 2
Aircraft No.5: pushed-out:Taxiing: 2
Holding for landing aircraft 2
Runway Crossing: 2
Takeoff: 2
Aircraft No.5: pushed-out:Taxiing: 2
Holding for landing aircraft 2
Runway Crossing: 2
Takeoff: 2
Aircraft No.7: pushed-out:Taxiing: 2
Holding for landing aircraft 2
Runway Crossing: 2
Takeoff: 2
Aircraft No.8: pushed-out:Taxiing: 2
Holding for landing aircraft 2
Runway Crossing: 2
Takeoff: 2Aircraft No.9: pushed-out:
Taxiing: 2
Holding for landing aircraft 2
Runway Crossing: 2
Takeoff: 2
Aircraft No.10: pushed-out:Taxiing: 2
Holding for landing aircraft 2
Runway Crossing: 2
Takeoff: 2
Twenty (20) Aircraft Operations in an hour
4
4
4
4
4
4
4
4
4
Aircraf t No.10Landing: 2
Aircraf t No.9Landing: 2
Aircraf t No.8Landing: 2
Aircraf t No.7Landing: 2
Aircraft No.6Landing: 2
Aircraf t No.5Landing: 2
Aircraf t No.4Landing: 2
Aircraf t No.3Landing: 2
Taxiing: 6 .
Taxiing: 6 .
Taxiing: 6 .
Taxiing: 6 .
Taxiing: 6 .
Taxiing: 6 .
Taxiing: 6 .
Taxiing: 6 .
Ten (10) Takeoffs
Ten (10) Landings
Aircraf t No.2Landing: 2
Aircraf t No.1Landing: 2
Ten (10) Crossing Runway
Figure 6.3-3 Simulated Aircraft Operations from Runway 32

Special Assistance for Project Implementation (SAPI) for Borg El Arab International Airport Modernization Project
Chapter 6 Demand vs. Capacity Analysis - Final Report -
6-9
In this connection, observation made by EAC Chairman was that the constant 2-minutes allocation particularly for landing aircraft is difficult since the existing rapid exit taxiway toward opposite direction can no longer be utilized, thus aircraft should make final approach, landing, taxiing and only exit from the right-angled connecting taxiway at 3-km ahead of touch-down point. Also, 2-minutes allocation for aircraft takeoff until its wake blast turbulence disappears before another aircraft to cross near the runway end is not realistic, although which is depending on the size of the aircraft in operations.
Therefore, it is conservatively discussed and assumed that, when departures and arrivals are made on the continuously-staggered basis, doable operations could be made probably at 80 % of the above-mentioned peak-hour capacity (with 6-minutes cycle time), namely, 8 departures and 8 arrivals.
As given in Table 6.1-1, the number of peak-hour one-way aircraft movements (departures or arrivals) at Borg El Arab International Airport is forecasted at 7.2 in 2020 (or 9.8 in 2030). By the time the second runway is desirable to be constructed.
In the past, the runways at the two (2) Alexandria Airports (Alexandria-Nozha and Borg El Arab) were alternately closed for maintenance and rehabilitation, during the time all flight operations of the one closed have transferred to the other airport and vice versa, as if maintenance of the two (2) runways is made synchronically.
Currently, EAC is imposed a limited ownership of the runway being used jointly with MOD. From January 2012, Alexandria-Nozha International Airport is closed for more than a year for the purpose of substantial repair and rehabilitation of the swampy runway. It was reported by EAC that once all commercial flights are moved to Borg El Arab International Airport this time, they would no longer come back to be operated at Alexandria-Nozha International Airport. In case of emergency or accident that might happen on the single runway at Borg El Arab International Airport there is no alternate runway to land in Alexandria region.
One solution to instantly double the runway capacity at Borg El Arab International Airport is to build another parallel taxiway between the runway and the new terminal, so that departing aircraft is no longer necessary to cross the runway as shown in Figure 6.3-4.

Special Assistance for Project Implementation (SAPI) for Borg El Arab International Airport Modernization Project
Chapter 6 Demand vs. Capacity Analysis - Final Report -
6-10
Figure 6.3-4 Possible Parallel Taxiway on the Side of New Terminal
However, construction of the parallel taxiway in the MOD premises depends upon the decision from Higher Authorities, and this cannot solve the potential deficiency that there would be no alternate runway at Alexandria region once Alexandria-Nozha International Airport is totally closed.

Special Assistance for Project Implementation (SAPI) for Borg El Arab International Airport Modernization Project
Chapter 6 Demand vs. Capacity Analysis - Final Report -
6-11
6.4. Future Strategy for Maximum Utilization of Existing Facilities
6.4.1. General
Major facilities at Borg El Arab International Airport completed in 2010 had been designed based on the analyses previously conducted during SAPROF Study (in 2004) in consideration of the then socio-economic background and projected air traffic demand. The completed facilities were aimed to meet the demand of 1 million passengers per annum previously forecasted for the year 2014.
Meanwhile, air traffic demand in Alexandria region has rapidly increased due to unexpected growth of economy in Middle-East countries and expansion of LCC industry which could not be predicted before. In 2010, the total numbers of air passengers recorded in the two (2) Alexandria airports (Alexandria-Nozha and Borg El Arab) have reached 1.68 million even before the completion of new facilities at Borg El Arab International Airport.
Because the heavy concentration of passengers in Alexandria airports, which had been previously observed only in summer months (i.e. July and August), was nowadays evenly distributed through the year, day and night, the completed facilities at Borg El Arab International Airport may still have some margin to accommodate further traffic volumes even after the current flight operations at Alexandria-Nozha are transfer to Borg El Arab.
As described in Chapter 6.3.1, JICA Study Team has analyzed the capacity of major facilities completed at Borg El Arab International Airport, e.g. key passenger processing facilities in the terminal building, aircraft parking apron and runway, by comparing with the common practice of IATA and ICAO, and has come up with the conclusion that the completed airport facilities could cope with 2.35 million passengers per annum for the year 2015 as forecasted in Chapter 4.
6.4.2. Barriers for Accommodating Future Capacity
Upon closure of Alexandria-Nozha International Airport, all commercial scheduled flight operations including Egypt Air flights would be transferred to Borg El Arab International Airport, where the completed facilities have to be fully utilized to accommodate probably over 2 million passengers expected after 2012.
The above conclusion of JICA Study Team was made through the comparative analysis of the future forecasted demand in line with international common practice (recommended by IATA or ICAO), which however is fully dependent on the solutions to the behavior of passengers and airfield issues as stated in Chapter 6.3.2.
The said IATA practice is based on general information collected from airports in the world, where business passengers and tourists are mainly being handled. Meanwhile, 80 % of the passengers at Borg El Arab International Airport are Egyptian, and their great majority

Special Assistance for Project Implementation (SAPI) for Borg El Arab International Airport Modernization Project
Chapter 6 Demand vs. Capacity Analysis - Final Report -
6-12
(some 70%) are pilgrims or seasonal contract workers who would spend longer life in the Middle-East countries, consequently volume of baggage or behaviors are somewhat unexpected in the international practice. Those unique issues e.g. passengers’ behaviors or numerous well-wishers for Hajji-flight passengers rushing at public lobby at the Airport are based on historical and cultural backgrounds.
Key staffs in Borg El Arab International Airport are being periodically trained and progressively acquiring knowledge on airport operation, maintenance and management in cooperation with Narita International Airport Corporation (NAA). However, it is somewhat difficult for them or airport itself to manage such specific issue in this particular Airport.
6.4.3. Possible Future Strategy to cope with Future Growing Demand
From early 2012 after closure of Alexandria-Nozha International Airport, the Borg El Arab International Airport will handle over 2 million passengers, which exceeds the originally-planned airport capacity (1 million for the year 2014). In other words, the ongoing Borg El Arab International Airport Modernization Project (the “Project”) would contribute to much higher economic benefit than expected in the SAPROF study.
To materialize such capacity that the Airport should possess to its maximum extent possible, or to maximize the effect upon the Project implementation, the careful attention should be paid to following issues by all staff at the Airport:
Prevent passengers’ stagnation in terminal building;
Improve passenger service level in terminal building (through guidance and assistance);
Manage, maintain in good condition and update the existing facilities and equipment (To prevent passenger stagnation due to equipment problems); and
Address efficiency and safety in the aircraft operations at apron (to systemize aircraft operation).
In particular, the following items are required to consider for solving issues at the airport.
Manage facility maintenance troubles due to passenger’s manners;
Improve service quality through cleaning and facility maintenance in the passenger terminal building;
Manage passenger’s stagnation due to passenger’s lack of travel experience;
Train the know-how, technical quality and service attitude of airport staff;
Coordinate with airlines to secure smooth process and movement for the passengers;
Minimize queuing of passengers through coordination with immigration, customs

Special Assistance for Project Implementation (SAPI) for Borg El Arab International Airport Modernization Project
Chapter 6 Demand vs. Capacity Analysis - Final Report -
6-13
and police;
Prevent delay of aircraft operation due to inefficient operation on the apron;
Systemize aircraft operations and airport operation plans in coordination with NANSC;
Establish clear trouble shooting procedures;
Clearly establish responsible area of each airport staff; and
Improve operational organizations for efficient operation.
On the other hand, the Airport is desired to handle further numbers of passenger, as JICA Study Team forecasts the current high growth of air traffic demand in Alexandria region is likely to continue. Hence, the Airport is required to improve passenger service quality and access convenience to be dedicated to the growing passengers’ volume. And also the Airport should cooperate with LCC that have drastically increased its passenger carrying capacity, and the development projects implemented in surrounding area of the Airport through to:
Establish adequate airport marketing plan;
Collaborate with local tourism industry in surrounding area of the Airport;
Promote the Airport inside / outside of the country;
Collaborate with LCC services and provide dedicated services for LCC passengers;
Collaborate with local developments in surrounding area of the Airport; and
Develop adequate access modes between the Airport and the city.
In relation to EAC’s strategies to improve airport operational efficiency and to create new air traffic demand, EAC is currently having assistance from foreign airport operators. Management and operations at 5 major EAC airports including Sharm El Sheikh, Hurghada, Aswan, Luxor and Abu Simbel were assisted by ADPm (France) on a contract base. Management and operations at Cairo International Airport is being assisted by Fraport (Germany). Through those assistance contracts, the airports have been trying to achieve efficient operation of airport facilities, airport promotion to create new air traffic demand, and commercial business to increase revenue, and service enlargement for the passengers.
Meanwhile, the Borg El Arab International Airport should exercise its best effort to overcome the specific issues stated above, which are more challenging since characters of the great majority of the passengers at Borg El Arab (those specific to pilgrims and seasonal workers) are different from those of the above named 6 other airports (majority of them are business passengers or international tourists who know all the airport procedures and regulations).

Special Assistance for Project Implementation (SAPI)for Borg El Arab International Airport Modernization Project
- Final Report -
Chapter 7
Recommendations on Future Airport Development
Table of Contents
7.1 Basic Strategy ....................................................................................................................... 7-1
7.2 Addition of Three (3) Passenger Boarding Bridges (PBBs) .............................................. 7-2
7.3 Technical Assistance for Airport Operation and Management ........................................ 7-5
7.3.1 General ........................................................................................................................ 7-5
7.3.2 Assistance in Airport Staff Capacity Development ..................................................... 7-5
7.3.3 Assistance in Facility and Equipment Maintenance .................................................... 7-6
7.3.4 Assistance in Organization Building for Efficient Operation ..................................... 7-7
7.3.5 Recommended Schedule and Scheme for Technical Assistance ................................. 7-8
7.4 Future Development – Construction of Additional Facilities ......................................... 7-12
7.4.1 Suggested Year of Capacity Saturation ..................................................................... 7-12
7.4.2 Basic Features of Phase-2 Development ................................................................... 7-13
7.4.3 Possible Options for Phase-2 Development Scheme ................................................ 7-24
7.4.4 Project Implementation Scheme ............................................................................... 7-39

Special Assistance for Project Implementation (SAPI) for Borg El Arab International Airport Modernization Project
Chapter 7 Recommendation on Future Airport Development - Final Report -
7-1
Chapter 7. Recommendations on Future Airport Development 7.1. Basic Strategy
For the purpose of clear definition of each phase of the entire development for the Borg El Arab International Airport, the Modernization Project completed in year 2010 is hereby referred to as the Project Phase-1 Stage 1, and subsequent measures for maximization of its effect proposed herein are defined as the Phase-1 Stage 2 respectively. Further developments necessary to accommodate the medium to long-term future air traffic demand are defined as the Phase-2 and Phase-3.
Upon closure of Alexandria - Nozha International Airport, all scheduled flights including those of Egypt Air have been transferred to Borg El Arab International Airport as of the end of year 2011. Moreover, as stated in Chapter 3.2.1., several commercial flights are still operated at old terminal building which is the property of the Military of Defense (MoD) in the Airport. However that EAC currently plans to return its facilities to MoD in the near future when the Airport has ready to receive all flights at new passenger terminal building. As discussed in Chapter 6, it has been evaluated that the Airport, after completion of the development in year 2010, should be theoretically capable of accommodating the future air traffic demand of the entire Alexandria region until around year 2015 to 2020, however due to several reasons, such theoretical capacity has not yet been materialized and the Airport has been experiencing operational problems, in particular, serious congestion in the passenger terminal building. It has been understood that realization of the maximum capacity of the Airport should be the first priority and necessary measures therefore need to be implemented.
Addition of one each of the passenger boarding bridge to the existing three fixed gates as originally envisaged will improve the passenger handling capacity and service grade of the passenger terminal building.
Strengthening of the human resources as well as improvement of the passenger handling procedures, etc. through technical assistance by qualified service provider will also enhance the capacity development and upgrading of passenger services.
Namely the Phase-1 Stage 2 Project consists of the following two parts:
a) Addition of three (3) Passenger Boarding Bridges (PBBs) to the completed Passenger Terminal Building (see Chapter 7.2); and
b) Technical Assistance for Airport Operation and Management (see Chapter 7.3).
Further developments to accommodate the medium to long-term future traffic demand are discussed in Chapter 7.4 below.

Special Assistance for Project Implementation (SAPI) for Borg El Arab International Airport Modernization Project
Chapter 7 Recommendation on Future Airport Development - Final Report -
7-2
7.2. Addition of Three (3) Passenger Boarding Bridges (PBBs)
The new passenger terminal building has been provided with 4 Passenger Boarding Bridges (PBBs), 1 each to the 4 fixed gates, as shown in Figure 7.2-1.
Figure 7.2-1 Position of the 4 PBBs; 1 each for 4 gates
In the history of the Project, number of PBBs to be installed has been discussed, chronologically as follows:
In 2004, installation of 2 PBBs to 1 large jet (LJ), i.e. the 1st PBB to serve first or business class and the 2nd PBB to serve economy class door, as being a common practice, had been aimed in the SAPROF study. Hence, 7 PBBs in total had been originally proposed in the SAPROF study to be installed, 2 each to the planned 3 Large Jet (LJ; e.g. B 777) and 1 to Small Jet (SJ; e.g. A320) so as to efficiently manage passengers’ embarkation or disembarkation operations.
In 2006 it was decided through the course of detailed design that the Project package would only include 4 PBBs (1 each to the 4 fixed gates) to keep minimum required service level, and the installation of 3 other PBBs were deferred because it was anticipated that the Bid price might have exceeded the budgeted foreign portion of the then JICA fund; fortunately, it did not though.
In 2007, when the number of air passengers at Alexandrian region was rapidly growing and it reached 1 million per annum, Emirates airlines operated its wide-bodied fleet B777-200 at Borg El Arab International Airport since in fact Emirates did not own small aircraft that could land at Alexandria – Nozha International Airport.
In 2008, EAC once decided to procure additional 3 PBBs and deferred installation due to the then economic crisis in October 2008.
Now all airlines including Egypt Air have transferred their commercial aircraft operations to Borg El Arab International Airport, where sufficient runway length (3,400 m) for LJ to take

Special Assistance for Project Implementation (SAPI) for Borg El Arab International Airport Modernization Project
Chapter 7 Recommendation on Future Airport Development - Final Report -
7-3
off and land is available. It is predicted that Legacy Airlines who were formerly restricted to use LJ due to the shortage of length and strength of the runway at Alexandria – Nozha International Airport, would have a choice to mobilize their LJ at Borg El Arab International Airport for the sake of operational efficiency. In case the operation of LJ at Borg El Arab International Airport is realized, it is considered useful if the 3 PBBs are added as originally planned in the SAPROF study, as shown in Figure 7.2-2.
Figure 7.2-2 Position of 7 PBBs; 2 for 3 LJ, and 1 for 1 SJ
Meanwhile, according to the latest fleet plan of Egypt Air, it would operate regular frequent flight services by using numbers of SJ (e.g. E-170 of Egypt Air Express) for both domestic and regional international flights. Since the terminal building has only one (1) common departure bus-gate for domestic and international flight operations, it is now anticipated to encounter certain risk to mingle the international and domestic passengers at the common bus-gate when air traffic increases further.
When a fixed gate for LJ is used by 2 SJ (i.e. A320 or smaller), the 2 PBBs can individually contact either of the 2 flights separately, as shown in Figure 7.2-3.
When the 7 PBBs can handle the departing passengers for maximum 7 flights at departure level (all at 2nd floor), it would minimize the risk mentioned above without congesting the common bus-gate (at ground floor).

Special Assistance for Project Implementation (SAPI) for Borg El Arab International Airport Modernization Project
Chapter 7 Recommendation on Future Airport Development - Final Report -
7-4
Figure 7.2-3 Position of 7 PBBs; 1 each for 7 SJ
In order to safely manage more than 2 million passengers after 2012, it is recommended that the 3 PBBs be added, each to the aircraft 1st--door position of the 3 fixed gates, foundations made of reinforced-concrete with anchor bolts of which were readily in place through the foregoing Project.

Special Assistance for Project Implementation (SAPI) for Borg El Arab International Airport Modernization Project
Chapter 7 Recommendation on Future Airport Development - Final Report -
7-5
7.3. Technical Assistance for Airport Operation and Management
7.3.1. General
Generally, airports should continuously provide services to passengers, public end-users, airlines and other business entities with the following six (6) targeted objectives:
a) Safety; b) Security; c) Convenience; d) Punctuality; e) Functionality; and f) Comfort.
To materialize the handling capacity (i.e. more than 2 million passengers per annum) that the Airport should already have theoretically possessed, or to maximize the effect by implementation of the Project Phase-1 Stage 1, the above targeted objectives should be achieved through the solutions thereof, and as summarized in the matrix shown in Figure 7.3-1.
Figure 7.3-1 Matrix showing Solutions for Current Issues
Each theme for the assistance required is described hereunder.
7.3.2. Assistance in Airport Staff Capacity Development
To develop the capacity of airport staff, it is important not only to improve the ability of the individual airport staff, but also for them to be consciousness of their responsibility to operate the entire airport continuously for 24 hours as one team through collaboration among each airport staff.
Specifically, the following innovations are required for all airport staff so as to satisfy the
7.3.2 Airport Staff Capacity
Development
7.3.3 Facility and Equipment
Maintenance
7.3.4 OrganizationBuilding for
Efficient Operation
c) to f) in particular To improve Quality of
Passenger Service
c) to e) in particular To maximize Utilization of Facilities/ Equipment
a) & e) in particular To be prepared for
Troubles and Safety Risks
d) to f) in particular To improve Airport
Operational Efficiency
Targeted Objective & Issues Assistance Theme Solutions
Alleviate areas of passengers’ congestion. Assist passenger’s lack of travel experience. Improve Service Level to customer’s satisfaction.
Manage and Maintain Facilities in good condition.Establish trouble shooting procedure. Assign clearly responsible area for EAC staff.
Assign clearly responsible area for EAC staff. Coordinate with Police, Customs and Airlines. Systemize gate operations with NANSC.
Detect facility trouble due to passenger’s behavior.Systemize sequence of facility operations. Fully monitor facilities in coordination with BMS.

Special Assistance for Project Implementation (SAPI) for Borg El Arab International Airport Modernization Project
Chapter 7 Recommendation on Future Airport Development - Final Report -
7-6
above targeted objectives for the Airport:
Detect areas of congestion expected to occur due to the fast growing air traffic demand;
Clearly assign their responsible area and functions to each EAC staff;
Improve the level of services including support and information guidance to passengers;
Constantly help passengers’ lack of travel experience, particularly of the rapidly increasing overseas contract workers and/or pilgrims;
Organize routine coordination with security police, immigration and customs officers to prevent bottle-neck points in the terminal building ;
Organize daily coordination with airlines for smooth check-in processing of passengers and baggage;
Be aware the external functions, e.g. supply networks, capacity limits and bottle-neck points of utilities (power and water), fuel hydrant, irrigation and sewage treatment systems; and
Accumulate skills and experiences necessary for each airport staff.
Through these efforts, not only EAC staff but also all employees involved in the airport operations should work together cooperatively to improve the airport services.
For aircraft ground handling operations on the apron, it is required to systemize the daily gate assignment procedures in close coordination with NANSC so as to secure safe and efficient aircraft operations.
7.3.3. Assistance in Facility and Equipment Maintenance
The Airport is considered to secure all the targeted objectives mentioned above (i.e. safety, security, convenience, punctuality functionality and comfort),only through maintaining in good condition of all the installed facilities, equipment and utilities supply. Any failure in the airport functions would fall in the risks or claims to endanger or disturb passengers, or delay in their flight , and in the worst scenario, smuggling or hijacking.
After opening of the new terminal complex of the Airport, air traffic demand in Alexandria region was still evenly distributed to the two (2) international airports (Alexandria-Nozha and Borg El Arab) and therefore density of the aircraft operations at Borg El Arab International Airport was somehow low until the year 2011. However, upon closure of Alexandria – Nozha International Airport, all flights have been transferred to Borg El Arab International Airport. More numbers of air passengers and international flights than previously envisaged are now utilizing the airport facilities, where even small troubles in the airport facilities or overload in the utilities supply may cause fundamental risks or claims mentioned above.

Special Assistance for Project Implementation (SAPI) for Borg El Arab International Airport Modernization Project
Chapter 7 Recommendation on Future Airport Development - Final Report -
7-7
To immediately remedy the facility trouble that might any time happen, each EAC staff should individually consider how to control the situation.
Specifically, the following efforts shall be regularly exercised so that facilities and equipment at the Airport are well maintained:
Cross-examine the maintenance manuals of individual facilities and equipment;
Cross-examine the physical capacities and bottle-necks of utilities supply and demand (i.e. power, water and sewage treatment);
Establish overall maintenance and remedial procedures of entire facilities and equipment;
Assign each EAC staff for their clearly responsible facilities and equipment (including external utilities networks);
Establish clear trouble shooting procedures;
Constantly clarify how and who in particular, should deal with a trouble upon occurrence in the airport facility;
To regularly conduct onsite drills to simulate possible troubles and solutions; and
Accumulate the daily record of the troubles with the solutions taken, and prepare monthly summary thereof, which would be a possible lifework of EAC staff to totally eliminate the risks.
Clear plans and continuous on-site drills for facility maintenance and management to manage the occurred troubles would contribute not only to avoid saturation or stagnation of functions in the Airport, but also to minimize risks in aviation security, safety of airport operations, or country’s civil aviation activities as a whole.
7.3.4. Assistance in Organizational Building for Efficient Operation
The technical assistance in building a suitable airport organization shall include to detect appropriate routes of immediately conveying all decisions or directions from the Airport Director to all branch departments and up to the end-staff, including all staff of airlines, CIQ, NANSC, concessionaire and/or any outsourcing companies. The organization shall entail how the problems should be dealt with in every field throughout the numbers of work shift (or group) for 24 hours of airport operations.
For such purpose, it is considered essential to obtain necessary assistance of an experienced and qualified service provider such as foreign reputable airport operator. Appropriate authority should be vested in the service provider employed to directly assist relevant departments and the entire Airport organization as well.
Specifically, the following technical assistances are sought from foreign reputable airport

Special Assistance for Project Implementation (SAPI) for Borg El Arab International Airport Modernization Project
Chapter 7 Recommendation on Future Airport Development - Final Report -
7-8
organization:
Build cooperative frameworks to protect the Airport from any risk and claim (i.e. in relation to safety, security, convenience, punctuality, functionality and comfort at the Airport);
Establish auditing rules on outsourcing companies, concessionaires, airlines, ground handlers, to check whether they comply with the rules and objectives of the Airport in terms of safety, security, convenience, punctuality, functionality and comfort;
Support all programs for smooth implementation;
Assist in re-structuring of the Airport organization from time to time to attain the then safe and efficient airport operations to maximum extent possible; and
Ensure that the service provider shall be given by EAC headquarter an appropriate position and authority to issue necessary instructions.
7.3.5. Recommended Schedule and Scheme for Technical Assistance
Considering the evaluation result that the capacity of the existing passenger terminal building would be saturated around the year 2015, the assistance to be provided to EAC has been programmed in two (2) steps as shown in Figure 7.3-2 and discussed hereunder.
2010 2011 2012 2013 2014 2015 2016 2017 2018 2019 2020
Figure 7.3-2 Proposed Schedule of Technical Assistance
To accommodate growing passengers as much as possible with existing terminal facilities up to the completion of additional new terminal building development, JICA study team recommends to operate the Airport with international assistance scheme for airport operation and management through following steps.
Technical Assistance - Step 1 will be contribute to enlarge airport staff capacity development. It will also contribute more efficient airport operation and improve passenger service quality. However that, this scheme should be not only assisted by foreigner’s activities but also should be based on EAC’s own proposing to effort to improve the Airport.
PTB T1 Open PTB T2 Open (Assumed) Nozha Airport Closed
Existing Assistance in Airport Management With Narita Int’l Airport
Annual Passenger traffic will reach
the estimated capacity limit(2.35million pax / year)
Airport Operation and Management Assistance [Step 1] at Borg El Arab International Airport (Including Airport Staff Training, Operation and Management Advises and etc.)
Airport Operation and Management Assistance [Step 2] Through Experts Dispatch from Foreign Donor or Government

Special Assistance for Project Implementation (SAPI) for Borg El Arab International Airport Modernization Project
Chapter 7 Recommendation on Future Airport Development - Final Report -
7-9
Technical Assistance – Step 2 will be consisted of public and governmental assistance in civil aviation sectors through the cooperation by foreign donor and government. To cope future issues assumed after the demand reaches to its capacity, the Airport may need to coordinate related agencies in the Airport such as immigration, customs or security police. During the assistance, foreign experts of these sectors will assist or advise to improve its service quality and operate more efficiently.
These 2 steps of international assistance scheme shall be considered to implement in parallel. For more detail recommendation on these assistances is shown in followings.
1) Technical Assistance - Step 1 Assistance in Airport Operation and Management
So far, assistance in airport operation and management has been provided by Narita International Airport Corporation (NAA) since 2009. At present, it is observed that:
Judging throughout the year 2011 when air traffic in Alexandria region was shared by the two (2) airports, operations at the Airport were on track, as the training provided by NAA through the Phase-1 Stage 1 Project has improved the fundamental knowledge of EAC staff; and
In the next step, some selected EAC staff particularly should have a sort of advanced training course for high-quality airport operation and management, so that they would be able to obtain necessary skills and knowledge as the leader of the organization operating the prestigious international airport in Egypt.
It is recommended that the Airport should obtain further advanced technical assistance from a foreign reputable airport organization on a direct contract basis with EAC as the Step 1, in which the following approaches to the staff capacity development are deemed necessary so as to achieve efficient operations to the maximum extent possible at the Airport:
Continue enhancing the specialist skills and knowledge of the organization leaders (including potential leaders of younger generation as well), which is the key to improve management and maintenance capability of the Airport;
The advanced training course to the leaders should enhance skills and knowledge in the areas such as customer services, aviation security, airport safety, operations, and facility maintenance and management;
The leaders who have participated in these courses should transfer on site what they have learned in these courses to other employees in their working environment. This would systematically create high quality of airport management practices.
Table 7.3-1 shows an example of assistance proposal for enhancing the specialist skills and knowledge of the organization leaders.

Special Assistance for Project Implementation (SAPI) for Borg El Arab International Airport Modernization Project
Chapter 7 Recommendation on Future Airport Development - Final Report -
7-10
Table 7.3-1 Example of Assistance Plan of Leader Training Course
Overview of a Training Course
A training course consists of two-week training in Japan and one week training at Borg El Arab International Airport.
One training course should be held for one field each.
The number of course will depend on the field of assistance (Possible fields are listed below.)
A maximum of only two training courses will be held at the same time because it is important that high quality, intensive courses are provided, which will lead fruitful outcome for trainees.
Possible Participants
Leaders or potential leaders in the individual fields which mentioned below.
Number of trainee of each field will be one or two staff.
Possible Fields of the
Course
1. Customer Services
2. Aviation Security,
3. Airport Safety
4. Operations (Airside & Passenger Terminal Building)
5. Maintenance
Outline of the Course
A training course will consist of A) two weeks training in Japan and B) one week training at job site in Borg El Arab International Airport.
2) Technical Assistance - Step 2 Airport Operation and Management Assistance Through Expert Dispatch from Foreign Donor or Government
Even after the year 2015 when the traffic demand exceeds the estimated capacity limit of the passenger terminal building, the existing airport facilities will need to accommodate the traffic since development of the second runway and new passenger terminal building (tentatively called as Terminal 2), etc. would not be completed by then.
A training Course for each specialized field (3 weeks in total) One or two specialists will be in charge of each course.
+
A) Training in Japan (2 weeks)
More specialized training at a major airport in Japan related to the various activities of the individual fields. (Example: classroom lectures and site inspection)
B) Training at Borg El Arab International Airport (1 week)
On-site training at the Airport by experts in individual specialist fields (Example: hold working groups and conduct on-the-job training)
Training in Japan Training at the Airport
2 weeks 1 week
3 weeks in total

Special Assistance for Project Implementation (SAPI) for Borg El Arab International Airport Modernization Project
Chapter 7 Recommendation on Future Airport Development - Final Report -
7-11
In this situation where significant capacity constraints are expected, it is suggested that appropriate specialists should be dispatched to provide direct advices and recommendation for safe and efficient airport operations as the Step 2 assistance.
Specifically, the following challenges are deemed necessary so as to accommodate passengers of more than the physical capacity:
Continue the assistance in the capacity development of airport staff, and facility maintenance and management;
Conserve energy and utilities volumes (i.e. power and water consumptions in the entire Airport);
Assist in restructuring of organization from time to time of the Airport itself and EAC; and
Keep regular collaboration between the relevant sub-organizations in the Airport.
Especially for solving passenger stagnation at bottle-necked key essential facilities, the coordination with governmental organizations in the airport including security police, immigration and customs officers is considered imperative. It is suggested that such assistance be implemented through JICA specialist dispatch program up to the completion of the new passenger terminal building.
JICA expert technical assistance team is suggested to be organized by following specialists.
Table 7.3-2 Suggested JICA Expert Technical Assistance Team Specialty Number Target Issue
Airport Organization 1 Organization building
Terminal Operation 1 Passenger service / PTB operation / Customer’s Satisfaction
Airside Operation 1 Aircraft operation / Gate planning / Coordination with Airlines
Airport Management 1 Trouble shooting procedure
Facility Management 1 Civil / Mechanical engineering
Capacity Building 1 Airport staff training
Airport Finance 1 Financial analysis
Airport Marketing 1 Commercial activity
Passenger Inspection 1 Coordination with Police (Immigration/ Security Check)
Baggage management 1 In-line Screening / Baggage Reconciliation / Lost Baggage

Special Assistance for Project Implementation (SAPI) for Borg El Arab International Airport Modernization Project
Chapter 7 Recommendation on Future Airport Development - Final Report -
7-12
7.4. Future Development - Construction of Additional Facilities
7.4.1. Suggested Year of Capacity Saturation
1) Passenger Terminal
As stated in Chapter 6, the completed facilities at the Airport are assumed to be capable of accommodating 2.35 million passengers per annum forecasted for the year 2015, provided that the passengers and baggage are processed in the manner and time as recommended by IATA or ICAO.
Knowing the specific characters or behavior of passengers as discussed in the foregoing Chapters, passengers’ congestion at this particular airport may appear somewhat at earlier stage.
For the time being, such congestion could be alleviated by systematic guidance and/or assistance by EAC staff jointly with airlines or Police department, or just in case by adding necessary numbers of counters, desks, seats, X-ray machines, etc.
When the passenger traffic reaches as many as 3million per annum, a shortage of the terminal space and equipment is expected to occur, and then the level of services at the Airport will gradually be downgraded and the terminal will reach its capacity limit around year 2020.
2) Airfield
As discussed in Chapter 6, bottleneck of airfield at the Airport is the parallel taxiway located on the opposite side of the new terminal as shown in Figure 7.4-1.
Figure 7.4-1 Existing Airport Layout Plan
Because of such opposite position of the parallel taxiway, a departing aircraft should be held at the holding position on a taxiway while approaching aircraft land and exit the runway, the existing runway may possess a capacity of hourly 20 aircraft movements (10 departures and 10 landings) at maximum, which is only a half of normal single runway capacity, and is considered to saturate around year 2020.

Special Assistance for Project Implementation (SAPI) for Borg El Arab International Airport Modernization Project
Chapter 7 Recommendation on Future Airport Development - Final Report -
7-13
7.4.2. Basic Features of Phase-2 Development
1) Facility Requirements for Phase-2 Development
As discussed in Chapter 6, the completed Phase-1 passenger terminal building has an adequate floor space (about 24,000 m²) and internal functions to theoretically handle the forecast annual passengers of 2.35 million for the year 2015. Annual passengers are expected to be doubled (4.75 million) by 2025, therefore Phase-2 passenger terminal (Terminal 2) of similar floor space is necessarily to be constructed in a period from 2015 to 2020.
There are 7 aircraft parking stands (to accommodate 3 LJs and 4 MJs), or 12 stands (when all aircraft are SJ) in the existing aircraft parking apron. This dimension of apron may be able to cope with the parking of aircraft up to 2020, if all flights are of short-time turn-around flights. In line with the construction of Phase-2 terminal, additional aircraft parking apron should be constructed also in a period from 2015 to 2020.
Chronological summary of air traffic forecast, and corresponding requirements of airport facilities are given in Table 7.4-1.
Table 7.4-1 Chronological Facility Requirements for Passenger Terminal
Item SAROF actual Air traffic demand forecast
2014 2010 2015 2020 2025 2030
Passengers
1) Annual Pax (‘000) 991 1,682 2,358 3,611 4,755 5,942
2) Peak-day (2-way) 3,980 5,872 8,237 12,615 16,608 20,752
3) Peak-hour (2-way) 567 659 862 1,203 1,508 1,831
4) Peak-hour (1-way) 500 452 572 761 927 1,104
Aircraft Movements
5) Annual Flights 9,101 17,260 22,074 32,997 42,988 52,975
6) Peak-day (2-way) 36 57 73 110 143 175
7) Peak-hour (2-way) 9.3 7 8.2 11.1 13.5 16.0
8) Peak-hour (1-way) 5.0 5.7 7.2 8.5 9.8
Passenger Terminal (m²) 3) x 30 m² 20,840 24,277 24,820 34,820 43,800 53,270
Phase 1 (Terminal 1) Completed by 2010 24,000 m²
Phase 2 (Terminal 2) To complete another 24,000 m² by 2020 Total 48,000 m²
Apron Stand 8) x 90/60min + 1(Extra) 8 7 9.6 11.8 13.8 15.7
Phase 1 Completed by 2010 7 (or 12 if all SJ)
Phase 2 To complete another 9 stands by 2020 Total 17 stands
Meanwhile, the existing runway is 3,400 m in length which was planned in 1980’s presumably to meet the requirement of the then heaviest aircraft, e.g. B747 to fly the longest range.
As discussed in Chapter 6.3.2.- 2). from January 2012, Alexandria-Nozha International Airport is closed for more than a year, and in case of emergency or accident that might happen on the single runway at Borg El Arab International Airport there would be no

Special Assistance for Project Implementation (SAPI) for Borg El Arab International Airport Modernization Project
Chapter 7 Recommendation on Future Airport Development - Final Report -
7-14
alternate runway to land in Alexandria region, which might paralyze the entire air transportation system in Egypt.
Ministry of Civil Aviation (MCA) plans to construct the 2nd runway that forms an open parallel runway system with the 1st runway to enable simultaneous landing and takeoff, the layout of which has been announced in the latest AIP shown below as dotted lines.
Figure 7.4-2 Aerodrome Chart in AIP for Borg El Arab International Airport
The 2nd runway is normally to have a consistent dimension with the 1st runway, so as not to mislead the pilots. However it is not a cost-effective way to pursue such full length if the actual aircraft envisaged in operations do not need it. It should be noted in this connection that the B747-type aircraft is being phased out and the latest generation of aircraft with a large fuselage does not necessarily require a longer runway length than B747 did, owing to its improved body structure and engine performance.

Special Assistance for Project Implementation (SAPI) for Borg El Arab International Airport Modernization Project
Chapter 7 Recommendation on Future Airport Development - Final Report -
7-15
2) 2nd Runway
a) Runway Length
At present, almost all international flights at the Airport are made for short-range destinations to Middle East, Europe and North Africa, and great majority of the type of aircraft is SJ (small jet, such as A320, B737-800, and E-170), generally requiring the takeoff runway length of some 2,000 m.
Distance from the Airport to the main destinations in Middle East countries are within a range of 2,500 km, and to the current longest destination, i.e. Casablanca, is 3,600 km, and to London is 3,800 km, as shown in Figure 7.4-3.
Figure 7.4-3 Distance to Major Destinations from Alexandria
As stated in Chapter 4, 50% of the flights at the Airport are currently operated by LCC whose main fleet is A320. Meanwhile, many European LCCs currently use A321 (7 m longer and 1 m wider than A320) for their flights for Sharm El Sheikh or Hurgahda. Since LCC normally operate a single type of aircraft family so that efficient routine maintenance with common spare parts is ensured, A320 and/or A321 are assumed to be predominantly operated at the Airport in the foreseeable future.
To date, main fleet of Legacy Airlines (e.g. Egypt Air, Saudi Arabian, Royal Jordan, Turkish, Qatar, Kuwait) operating at the Airport are SJ, such as A320, B737-800, and E-170, which were able to safely land at Alexandria - Nozha International Airport. Upon the transfer of all operations to Borg El Arab International Airport, numbers of Legacy Airlines are expected to mobilize MJ (e.g. B767) or LJ (e.g. A330 or B777) because the runway is sufficient in length and strength for their landing and takeoff. Therefore, the runway length requirements for those wide-bodied aircraft are necessarily ascertained.
According to AIP, the Reference Temperature at Borg El International Arab Airport is 30.6

Special Assistance for Project Implementation (SAPI) for Borg El Arab International Airport Modernization Project
Chapter 7 Recommendation on Future Airport Development - Final Report -
7-16
degree Celsius, however, the daytime temperature in the hottest summer normally reaches 34 Celsius or more. For the purpose of computation of takeoff runway length requirements, it is assumed on safer side that the critical conditions occur when the temperature is 34 Celsius.
Based on the above consideration, runway length required for the above named aircraft with full payload to the current farthest destination (London) are tabulated in Table 7.4-2.
Table 7.4-2 Type of Aircraft and Required Runway Length Size MJ
ICAO code code DA320 B737 A321 B767 A330 B787-200 -800 -200 -300 -300 -200 -300 -8
CFM56 CFM56 CF6 CF6 GE GE GEm 34.10 35.79 35.48 47.57 60.30 60.93 60.93 60.12m 37.57 38.02 44.50 54.94 63.69 63.73 73.86 56.72
1 class 180 184 220 290 335 418 500 3752 classes 150 160 185 261 303 375 451 2863 classes - - - 253 305 368 224
lb 166,449 174,200 191,802 350,000 467,380 535,000 632,500 502,500kg 75,500 79,016 87,000 158,758 212,000 242,630 286,900 227,930lb 142,198 146,301 166,449 300,000 390,218 445,000 524,000 380,000kg 64,500 66,361 75,500 136,078 177,000 201,800 237,680 172,365lb 133,380 138,300 157,630 278,000 368,172 420,000 495,000 355,000kg 60,500 62,732 71,500 126,099 167,000 190,470 224,530 161,025lb 90,927 91,300 103,300 189,750 264,182 299,550 353,800 N/Akg 41,244 41,413 46,856 86,069 119,831 135,850 160,530 N/Alb 42,452 47,000 54,331 88,250 103,990 120,450 141,200 N/Akg 19,256 21,319 24,644 40,230 47,169 54,620 64,000 N/A
litter 23,667 26,022 23,700 63,216 97,530 117,300 169,210 126,903lb 40,959 46,063 41,015 119,890 168,788 207,700 299,490 224,638kg 18,579 20,894 18,604 50,753 76,561 94,240 135,880 101,894
litter/km 3.10 3.39 4.80 7.01 6.62 7.92 7.78 N/Alb/km 5.36 5.86 8.31 12.13 11.46 13.71 13.47 N/Akg/km 2.43 2.66 3.77 5.50 5.20 6.22 6.11 N/Alitter 1,919 2,101 2,978 4,344 4,107 4,913 4,826 N/A
lb 13,393 14,661 20,779 30,314 28,660 34,282 33,676 N/Akg 6,075 6,650 9,425 13,750 13,000 15,550 15,275 N/A
litter 9,596 10,504 14,888 21,720 20,535 24,563 24,129 N/Alb 20,357 22,284 31,583 46,077 43,563 52,108 51,187 N/Akg 9,234 10,108 14,326 20,900 19,760 23,636 23,218 N/A
litter 750 750 750 3,200 3,700 3,700 3,700 N/Alb 1,298 1,298 1,298 5,538 6,403 6,403 6,403 N/Akg 589 589 589 2,512 2,905 2,905 2,905 N/A
litter 10,346 11,254 15,638 24,920 24,235 28,263 27,829 N/Alb 21,655 23,582 32,881 51,615 49,967 58,512 57,590 N/Akg 9,823 10,697 14,915 23,412 22,665 26,541 26,123 N/Alb 155,035 161,883 190,512 330,056 418,139 478,426 552,594 N/Akg 70,323 73,429 86,415 149,711 189,665 217,011 250,653 N/A
15ºC 1,600 1,920 1,920 2,012 1,829 1,783 2,377 N/A30 ºC 1,707 2,042 2,042 2,118 1,905 1,890 2,499 N/A 34 ºC 1,736 2,075 2,075 2,146 1,925 1,919 2,532 N/A
16 at sea level 1,463 2,042 1,661 1,820 1,707 1,768 2,134 N/A
8
9
Fuel
13
14
15
Takeoff Weight forLondon flight (3,800 km)
Elevation atsea level
TakeoffRunwayLengthLandingRunwayLength
consumptionper km
10
11
12
consumption toLondon (3,800 km)
for Takeoff,Diversion, Holding
consumption toUAE (2,500km)
total for London(3,800 km)
Max Zero Fuel Weight
Seating Capacity
Max Takeoff Weight
Max Landing Weight
Operating Empty Weight
Maximum Usable(0.785 kg/l)
B777code C
6
7
Turbo Engine
2
3
4
5
Max Structural Payload
1
AircraftType
No Description
SJ
Wing SpanFuselarge Length
code ELJ
The Table implies that the runway length required for the critical aircraft (i.e. B777-300) with its full payload to fly to the furthest destination (London) under the hottest daytime temperature (34 Celsius) is 2,500 m to 2,600 m.

Special Assistance for Project Implementation (SAPI) for Borg El Arab International Airport Modernization Project
Chapter 7 Recommendation on Future Airport Development - Final Report -
7-17
b) Aerodrome Reference Code of Runway
In accordance with ICAO Annex 14 (abstracted in Table 7.4-3), the 2,500-m long runway is defined as ICAO Code Number 4, and the wingspan of B777 of less than 65 m is classified as ICAO Code Letter E. Corresponding runway width required is 45 m.
Table 7.4-3 Aerodrome Reference Code (ICAO Annex 14)
c) Distance between the two (2) Runways
Abstracted below is the minimum separation between the parallel runways recommended in the ICAO Annex 14:

Special Assistance for Project Implementation (SAPI) for Borg El Arab International Airport Modernization Project
Chapter 7 Recommendation on Future Airport Development - Final Report -
7-18
d) Runway Strip
In accordance with ICAO Annex 14, the runway strip for a precision approach runway should extend laterally to a distance of at least 150 m to both sides of runway centerline, and longitudinally for a distance of 60 m before the threshold and beyond the end of the runway.
3) Taxiways
a) Width of Taxiway
ICAO Annex 14 recommends that a straight portion of a taxiway should have a width of not less than 23 m where the aerodrome code letter is E.
b) Width of Taxiway Shoulder
In accordance with the recommendations of ICAO Annex 14, the taxiway and shoulder should cover a total width of 44 m where the aerodrome code letter is 4. Consequently, the required width of the taxiway shoulder shall be 10.5 m (i.e. 10.5 m + 23 m + 10.5 m = 44 m).
c) Separation between Airfield (Runway and Taxiways)
Airfield separations are to be provided basically to follow the minimum separation distances recommended by ICAO Annex 14, shown in Table 7.4-4.
Table 7.4-4 ICAO Annex 14 (Taxiway Minimum Separation Distances)
The above minimum distances between the centerlines of runway and taxiway as well as between taxiways for Code E (182.5 m in column (5); and 80 m in column (10) respectively) are not exactly followed worldwide since the aircraft wingspan keeps changing in the aviation industry, and the operations of Code F aircraft are widely spread in a short period of time. Practically, the location of airfield facilities and buildings, once constructed, cannot be moved in the future even when an airport has to accommodate unforeseeable traffic

Special Assistance for Project Implementation (SAPI) for Borg El Arab International Airport Modernization Project
Chapter 7 Recommendation on Future Airport Development - Final Report -
7-19
demand in 30 to 40 years. It is recommended therefore, that a distance of 200 m between centerlines of the runway and taxiway and 100 m between those of two taxiways (for Code F) be reserved, as are currently the cases worldwide.
ICAO notes that the distance between aircraft stand taxi-lane and object (42.5 m for Code E) may need to be increased if jet exhaust velocities cause hazardous conditions for ground service equipment, therefore a distance of 46.5 m is used in this Study.
In view of the above, separation distances between the runway, taxiways and objects have been set as shown in Figure 7.4-4.
Figure 7.4-4 Airfield Separation Distances adopted in this Study
4) Apron
At a moment, the Terminal 2 is planned to have 4 fixed gates for wide-bodied aircraft, each equipped with 2 passenger boarding bridges. Each gate can serve 2 small aircraft (SJ) as shown in Figure 7.4-5.
Basic Pattern Fixed Gates 4 B777-300
Remote Apron 5 B767-300
9 in total
Variation Fixed Gates
8 A321-200
Remote Apron
7 A321-200
15 in total
Figure 7.4-5 Aircraft Parking Pattern at Terminal 2 (Multi-aircraft Ramp System)

Special Assistance for Project Implementation (SAPI) for Borg El Arab International Airport Modernization Project
Chapter 7 Recommendation on Future Airport Development - Final Report -
7-20
5) Airfield Pavement Structure
Airfield pavement structure has been designed for 20-year life based on FAA design program (FAARFIELD) based on the following design conditions:
Expected Volume of Traffic;
Design Aircraft; and
Subgrade CBR and K values.
a) Annual Traffic
Annual aircraft movements for the international and domestic operations for the design years are given in Chapter 4-7, from which annual departures for the design aircraft have been computed as shown in Table 7.4-5.
Table 7.4-5 Annual Departures of Design Aircraft (One-way Aircraft Movement) Aircraft/Years 2020 2030 Annual Growth
B777-200 1,220 1,941 4.75%
A320-200 15,279 24,547 4.86%
b) Pavement Thickness Calculation
Firstly, the annual departures of the design aircraft have been entered into the FAARFIELD Pavement Design Program as shown in Figure 7.4-6.
Figure 7.4-6 Inputting Annual Departures of Design Aircraft into Computer Program

Special Assistance for Project Implementation (SAPI) for Borg El Arab International Airport Modernization Project
Chapter 7 Recommendation on Future Airport Development - Final Report -
7-21
Then, the material specifications have been entered into the FAARFIELD Pavement Design Program, which produces the required thickness of each of the flexible and rigid pavement layers, as shown in Figure 7.4-7 and Figure 7.4-8.
Figure 7.4-7 Specifications and Thicknesses of Flexible Pavement Layers
Figure 7.4-8 Specifications and Thicknesses of Rigid Pavement Layers

Special Assistance for Project Implementation (SAPI) for Borg El Arab International Airport Modernization Project
Chapter 7 Recommendation on Future Airport Development - Final Report -
7-22
c) Pavement Structure Based on the pavement thicknesses given from the FAARFIELD Pavement Design Program, pavement structures for runway, taxiways and apron have been preliminarily prepared as shown in Figure 7.4-9 to Figure 7.4-11.
Figure 7.4-9 Preliminary Typical Runway Pavement Structure
Figure 7.4-10 Preliminary Typical Taxiway Pavement Structure
Figure 7.4-11 Preliminary Typical Apron Pavement Structure

Special Assistance for Project Implementation (SAPI) for Borg El Arab International Airport Modernization Project
Chapter 7 Recommendation on Future Airport Development - Final Report -
7-23
6) Air Navigational Facility
a) Radio Navigational Aids
Instrument Landing System (ILS: CAT-I) consisting of the localizer, glide slope and terminal DME will be installed for the precision approach to Runway 32R. One set of Doppler VHF Omni-Directional Radio Beacon / Distance Measuring Equipment (DVOR/DME) will also be provided.
Remote Control Equipment will be installed at a Primary Substation (PSS) to be developed under the Phase-2.
b) Aeronautical Ground Lights
Following aeronautical ground lights will need to be installed:
One set of the Precision Approach Lighting System (PALS) for the precision approach Runway 32R and one set of the Simple Approach Lighting System (SALS) for the non-precision approach Runway 14L;
Two sets of the Precision Approach Path Indicator (PAPI) for both approach runways (32R and 14L);
Runway Lighting System;
Taxiway Lighting System;
Wind Direction Indicator Lights (WDIL) for both approach runways (32R and 14L); and
Constant Current Regulators (CCR) and Remote Control System at the new Primary Substation (PSS).
c) Meteorological Equipment
The following meteorological equipment will be installed at both ends of the approach runways:
Transmission meter with RVR converter;
Anemometer;
Thermometer;
Hygrometer; and
Barometer.
The following equipment will be installed at the existing Meteorological building:
Weather Data Processing and Display System.

Special Assistance for Project Implementation (SAPI) for Borg El Arab International Airport Modernization Project
Chapter 7 Recommendation on Future Airport Development - Final Report -
7-24
7.4.3. Possible Options for Phase-2 Development Scheme
The Phase-2 Development scheme is wholly depending on where the 2nd runway is constructed. For the purpose of this Report, the following two (2) Options are considered:
Option 1: the 2nd runway is to be constructed between the completed terminal and the existing runway in MOD premise, which forms a closed parallel runway system.
Option 2: the 2nd runway is to be constructed in the EAC premises which forms an open parallel runway system.
Each Option is further described hereunder:
1) Option 1 - Closed Parallel 2nd Runway in MOD Premise
a) Possible Development Scenario
Minimum distance between the two (2) parallel runways is 210 m as referred to in the above Chapter 7.4.2.- 2) (c), in case the two runways are intended to be used for simultaneous non-instrument operations. It is preferable however to secure the distance of more than 300 m to separate the two (2) runway strips, each having the width of 150 m from the centerline of instrument landing runway, so that pavement rehabilitation of either runway can be made without jeopardizing transitional surface of the other.
It is further preferable if the two (2) runway strips are designated for either priority use of EAC or MOD independently, hence are segregated by the two perimeter roads (for MOD and EAC, respectively) and boundary fence between them.
Since the area between the existing runway and the apron taxi lane at the passenger terminal is measured at 786.5 m, the 2nd runway can be set at a distance of 320 m from the existing runway, with a provision of parallel taxiway at a distance of 200 m and another parallel taxiway at a distance of 100 m or remote aircraft parking stands as the case may be, as shown in Figure 7.4-12.
Figure 7.4-12 Option 1- Separation between the Closed Parallel Runways,
Parallel Taxiway, and Apron Taxilane

Special Assistance for Project Implementation (SAPI) for Borg El Arab International Airport Modernization Project
Chapter 7 Recommendation on Future Airport Development - Final Report -
7-25
The existing terrain at the planned area is highly undulating. The elevation at Runway14 end is 6 m higher than the new terminal area, while the elevation around the middle of the runway is 10 m lower than the area of control tower to fire station.
The difference in elevation between the new terminal apron and control tower area is 8 to 9 m. Therefore, when the Phase-2 terminal is aimed to be located in the middle between them, the Phase-2 terminal and aircraft parking apron should be planned at around 4 m higher than the completed apron, since the apron slope should be planned as very minimal (less than 1 % for combined longitudinal and lateral slope) in accordance with ICAO.
Those undulated major pavement areas, e.g. for the 2 runways, parallel taxiway and 2 isolated aprons, should be moderately connected with sloped taxiways, maximum longitudinal slope of which is 1.5 %.
Those spot elevations are preliminarily planned as shown in Figure 7.4-13.
Figure 7.4-13 Option 1- Planned Elevation for the Closed Parallel Runways,
Parallel Taxiway, Taxilane and Apron
b) Suggested Option 1 Phase-2 Development Plan
The layout plan for the Phase-2 Development with the closed parallel runway is suggested as shown in Figure 7.4-14.

Special Assistance for Project Implementation (SAPI) for Borg El Arab International Airport Modernization Project
Chapter 7 Recommendation on Future Airport Development - Final Report -
7-26
Figure 7.4-14 Suggested Option 1 for Phase-2 Development Plan with Closed Parallel 2nd Runway

Special Assistance for Project Implementation (SAPI) for Borg El Arab International Airport Modernization Project
Chapter 7 Recommendation on Future Airport Development - Final Report -
7-27
c) Cost Estimate
Project cost for the Option 1 Phase-2 Development has been preliminarily estimated as shown in Table 7.4-6.
Table 7.4-6 Option 1 - Preliminary Cost Estimate for Phase-2 Development
in L.E. in Yen
Exchange rate : Japanese Yen = EGP 0.0769
A: Construction
Part 1 General Requirements 1 11,893,945.91 70,077,257 17,284,504.14 224,698,554
Part 2 Civil Works 396,811,780.45 86,177,651.76 403,440,830.58 5,244,730,798
Earthwork
Excavation m3 3,800,000 67,469,923.40 67,469,923.40 877,109,004
Embankment m3 3,800,000 69,851,915.40 69,851,915.40 908,074,900
Pavement
Runway 3,027m Sum 1 44,228,038.26 44,228,038.26 574,964,497
Taxiway 5,690m Sum 1 64,978,937.13 64,978,937.13 844,726,183
Apron Sum 1 73,108,303.76 73,108,303.76 950,407,949
Road and Car park Sum 1 12,010,373.17 12,010,373.17 156,134,851
Other roads, marking and subgrade for pavement Sum 1 24,367,908.93 24,367,908.93 316,782,816
Stormwater Drainage
Manholes, inlets, pipes and open ditches Sum 1 13,722,957.16 1,920,633 13,870,698.16 180,319,076
Miscellaneous
Fences, Gates, road signs and flag poles Sum 1 6,630,736.90 2,588,458 6,829,849.06 88,788,038
Landscaping Sum 1 20,442,686.34 81,668,561 26,724,883.31 347,423,483
Part 3 Utility Works 51,305,457.00 763,570,557.00 110,041,653.69 1,430,541,498
Power Supply Sum 1 43,321,776.64 362,851,223 71,233,409.18 926,034,319
Water/ Chiller Plant Sum 1 3,766,339.59 298,701,868 26,743,406.36 347,664,283
Fire Fighting Facility Sum 1 1,146,276.93 99,524,271 8,801,990.08 114,425,871
Sewage Treatment Sum 1 3,071,063.84 2,493,195 3,262,848.07 42,417,025
Part 4 Building Works 207,969,923.15 3,559,916,448.00 481,809,649.91 6,263,525,449
Passenger Terminal Building (PTB) Sum 1 185,628,499.08 3,448,612,562 450,906,388.46 5,861,783,050
Other Buildings Sum 1 22,341,424.07 111,303,886 30,903,261.45 401,742,399
Primary substation(PSS)
Chiller Plant & Water Tank Building (CHT)
PTS Substation (PTS)
Guard House(GDH)
Part 5 Nav Aids Works Sum 1 1,173,312.00 221,012,720 18,174,290.46 236,265,776
Part 6 Aeronautical Ground Lighting Works Sum 1 19,734,086.35 127,579,994 29,547,932.04 384,123,117
Part 7 Road & Car Park Lighting Works Sum 1 3,860,160.84 76,650,584 9,756,359.61 126,832,675
692,748,665.70 4,904,985,211.76 1,070,055,220.45 13,910,717,866
Contingency 5% of subtotal 35,000,000.00 245,000,000 53,846,153.85 700,000,000
Price Escalation 10.0% 72,774,866.57 946,073,265
800,523,532.27 5,149,985,211.76 1,196,676,240.87 15,556,791,131
B: Consultancy Services % ofconstruction
Part 1 Detailed Design 3.0% 8,975,071.81 350,027,800 35,900,287.19 466,703,734
Part 2 Assistance in Bidding 1.0% 2,393,352.48 124,454,329 11,966,762.40 155,567,911
Part 3 Construction Supervisio 8.0% 19,146,819.85 995,634,632 95,734,099.23 1,244,543,290
Part 4 Maintenance Supervisio 2.0% 5,983,381.20 233,351,867 23,933,524.82 311,135,823
Contingency 5% 1,800,000.00 85,200,000.00 8,353,846.15 108,600,000
38,298,625.34 1,788,668,628 175,888,519.79 2,286,550,757
C: Grand Total Cost for A (Construction) and B (Consultancy) 838,822,157.61 6,938,653,840 1,372,564,760.66 17,843,341,889
D: Project Administration Cost 1.0% 8,388,221.58 109,046,881
E: Grand Total 847,210,379.19 6,938,653,840 1,372,564,760.66 17,952,388,769
Total of Construction Cost A:
Preconstruction Stage
Construction Stage
Total of Consultancy Cost B:
Subtotal of Construction works (Part 1 to 7)
Conbined amountDescription Unit Qty Amount
(L.E)Amount
(Yen)
Notes 1) Unit cost used is basically an average of the previously-offered prices of Besix-Orascom Joint venture
(BOJV) and Taisei-TAV Joint venture (TTJV) as of the Bidding in 2007 for the Project.
2) Average inflation rate in Egypt for the past 7 years (from 2003 to 2010) was 9.4 %, therefore basic local costs have been escalated for 5 years after the Bidding (from 2007 to 2012) by 56.71 %.

Special Assistance for Project Implementation (SAPI) for Borg El Arab International Airport Modernization Project
Chapter 7 Recommendation on Future Airport Development - Final Report -
7-28
2) Option 2 - Open Parallel 2nd Runway in EAC Premise
a) Possible Development Scenario
The length of the 2nd runway is provisionally proposed at 2,500 m, and separation between the two (2) runways is set at 1,960 m which can satisfy the ICAO’s recommended minimum of 1,035 m allowing simultaneous operations on both runways.
In this circumstance, the construction of Terminal 2 is proposed to face at the 2nd runway.
Sequence for Phase-2 Development is suggested as shown in Figure 7.4-15.
Option 2 Phase 2-1: Construction of Runway & Taxiway to/from Terminal 1
Option 2 Phase 2-2: Construction of Terminal 2 & Separate Taxiways between Terminals
Figure 7.4-15 Suggested Phase-2 Development (Option 2: Open Parallel Runway)
Terminal 1 2 to 3 million Pax
Terminal 2 2 to 3 million Pax
Terminal 1 2 to 3 million Pax

Special Assistance for Project Implementation (SAPI) for Borg El Arab International Airport Modernization Project
Chapter 7 Recommendation on Future Airport Development - Final Report -
7-29
Furthermore, when the number of annual passengers increases to, say over 6 million, another passenger terminal (Terminal 3) may have to be considered.
In this connection, direction for further development is suggested toward the south as shown in Figure 7.4-16. The length of the 2nd runway is assumed to be eventually extended to 3,400 m, the same as the 1st runway.
Option 2 Phase 3-1: Construction of Terminal 3
Option 2 Phase 3-2: Future Provision of Runway Extension to 3,400 m
Figure 7.4-16 Suggested Direction for Further Development (Option 2: Open Parallel Runway)
Location of the Terminal 3 shown above is just for future reference as an convenient location, insofar-as more than 90 % of aircraft takeoff operations are made from the runway 32.
Terminal 3 6 million Pax
in future
Terminal 1 2 to 3 million Pax
Terminal 2 2 to 3 million Pax

Special Assistance for Project Implementation (SAPI) for Borg El Arab International Airport Modernization Project
Chapter 7 Recommendation on Future Airport Development - Final Report -
7-30
b) Planned Elevation
The proposed Phase-2 development site is highly undulating terrain according to the initial topographic survey conducted in 2008.
The runway profile should be set in accordance with the requirements stipulated in ICAO Annex 14 as abstracted in Table 7.4-7.
Table 7.4-7 Longitudinal Profile of the Runway (ICAO Annex 14) Clause No Recommendation
3.1.13
Longitudinal slopes
The slope computed by dividing the difference between
maximum and minimum elevation along the runway centerline by the runway length should not exceed 1 % where the code number is 3 or 4.
3.1.14
Along no portion of a runway should be the longitudinal slope exceed 1.25 % where the code number is 4, except that for the
first and last quarter of the length of the runway the longitudinal slope should not exceed 0.8 %
3.1.15
Longitudinal slope change
Where slope change cannot be avoided, a slope change between two consecutive slopes should not exceed 1.5 % where the code number is 3 or 4.
3.1.16
The transition from one slope to another should be accomplished by a curved surface with a rate of change not exceeding 0.1 % per
30 m (minimum radius of curvature of 30,000 m) where the code number is 4.
3.1.17 Sight distance
Where slope changes cannot be avoided, they should be such that there will be an unobstructed line of sight from any point 3 m above a runway to all other points 3 m above the runway within a
distance of at least half the length of the runway where code letter is C, D, E, or F

Special Assistance for Project Implementation (SAPI) for Borg El Arab International Airport Modernization Project
Chapter 7 Recommendation on Future Airport Development - Final Report -
7-31
c) Runway Profile
In accordance with the above Annex 14 of ICAO, the longitudinal profile of the 2nd runway has been preliminarily planned as shown in Figure 7.4-17 (existing height: blue line and planned elevations: red line).
Figure 7.4-17 Option 2 - 2nd Runway Profile
Max cut of 6 m
at Sta, no 18
Max fill of 7 m
at Sta.no.3

Special Assistance for Project Implementation (SAPI) for Borg El Arab International Airport Modernization Project
Chapter 7 Recommendation on Future Airport Development - Final Report -
7-32
Based on the runway profile, spot elevations for the site development has been preliminarily planned as shown in Figure 7.4-18 and Figure 7.4-19.
Figure 7.4-18 Option 2 - Planned Elevations for Phase-2 Facilities
Figure 7.4-19 Option 2 - Planned Heights of Cut and Fill for Phase-2 Facilities

Special Assistance for Project Implementation (SAPI) for Borg El Arab International Airport Modernization Project
Chapter 7 Recommendation on Future Airport Development - Final Report -
7-33
d) Area and Earthwork Volume for Site Development
The areas for the Phase-2 and Phase-3 development covers approximately 260 ha and 210 ha respectively as shown in Figure 7.4-20.
Figure 7.4-20 Option 2 - Areas for Site Development
(Red Zone: Phase-2, Green Zone: Phase 3)
As given in Figure 7.4-17 to Figure 7.4-19, the existing undulating terrain shall be cut and filled, and evenly compacted in consideration of well-balanced volumes for earthwork.
Generally, viewing along the 2nd runway profile (Figure 7.4-17) the area for northern 1 km (Sta. Nos. 0 to 10) is to be filled with a maximum height of 7 m (around Sta. No.3), while that for southern 1.5 km (Sta. Nos. 10 to 25) is to be cut with a maximum height of 6 m (at sta. No. 18).
Since the runway is to be filled by 7 m in some part or to be cut by 6m in other part, wide areas for the runway strip and its immediate vicinity for further extension or future runway shall be cut and filled and evenly moderated during the initial stage of the Phase-2 Development.
In the entire area of 470 ha, the area to be cut is approximately half (i.e. 230 ha) with an average excavation height of 3.5 m. The excavated soil of some 8 million m³will be filled in the remaining half of the area with similar average height (i.e. some 3.5 m) so that the entire earthwork volumes are balanced.

Special Assistance for Project Implementation (SAPI) for Borg El Arab International Airport Modernization Project
Chapter 7 Recommendation on Future Airport Development - Final Report -
7-34
e) Location of Fire station and Distance to Runway ends
In accordance with ICAO Annex 14, the Aerodrome Category for fire-fighting services is to be determined based on the maximum aircraft size in operations. Since B777 is assumed to be used eventually for regular operations at the Airport, the Category for fire-fighting services should be Category 9, which requires a minimum of three (3) fire fighting vehicles, having a total water tank capacity of 24,300 liters with a foam solution discharge rate of 9,000 liters/minutes.
Those minimum required level of service has been already provided in the new fire station constructed at a location equidistant from the both of the existing 3,400-long runway. The entrance/exit of this fire station was provided on back-to-back arrangement which is therefore accessible to the 2nd runway.
Location of the fire station and distances to runway ends are shown in Figure 7.4-21.
Figure 7.4-21 Location of Fire station and Distance to Runway ends
ICAO mandates that the response time of airport fire-fighting services should be less than 3 minutes, but further recommends to be minimized to be less than 2 minutes. The response time is considered to be the lapse of time from the initial call made to the rescue and fire-fighting service to the first vehicle being in position to apply foam at a rate of at least half the specified discharge rate.
Response time of fire fighting vehicle has been computed based on manufacturer’s specification, acceleration/ deceleration length and time as shown in Table 7.4-8.

Special Assistance for Project Implementation (SAPI) for Borg El Arab International Airport Modernization Project
Chapter 7 Recommendation on Future Airport Development - Final Report -
7-35
Table 7.4-8 Response Time of Fire Fighting Vehicles A. High-speed Fire Fighting Vehicle B. Normal Fire Fighting Vehicle
(6,000L water capacity) (10,000L water capacity)
a Maximum Speed 90 km/h 80 km/h
b Acceleration length & time length time length time
0 - 90 km/h 461 m 29 sec 0 - 80 km/h 527 m 37 sec0 - 70 km/h 120 m 15 sec 0 - 70 km/h 400 m 25 sec0 - 50 km/h 76 m 11 sec 0 - 50 km/h 115 m 15 sec50 - 90 km/h 385 m 18 sec 50 - 80 km/h 412 m 22 sec
c Deceleration length & time 90 - 50 km/h 52 m 3.5 sec 80 - 50 km/h 48 m 3.5 sec70 - 50 km/h 20 m 1.5 sec50 - 0 km/h 17 m 2.5 sec 50 - 0 km/h 19 m 3 sec90 - 0 km/h 68 m 4.5 sec 80 - 0 km/h 63 m 4.5 sec
d Curving speeed 50 km/h 50 km/h90 km/h 90 km/h
e Distance to runway endFire station to start of curve 977m Straight
to end of Curve 157 m Curve (R=100 m)to Runway end 1600 m Straight
Total distance from Fire Station 2,767 m
A High-speed Fire Fighting Vehicle (Maximum Speed: 90 km/h)
Curve (R=100)
to Runway (sec) (min)
Length (m) 157
Speed (km/h) 0-90 90 90-50 50 50-90 90 90-0
---in (m/sec) varies 25.00 varies 13.89 varies 25.00 varies
distance (m) 461 464 52 157 385 1,147 68
Time (sec) 30.00 29.00 18.56 3.50 11.30 18.00 45.88 4.50 5.00 165.74 2.76
B Fire Fighting Vehicle (Maximum Speed: 80 km/h)
Curve (R=100)
to Runway (sec) (min)
Length (m) 157
Speed (km/h) 0-80 80 80-50 50 50-80 80 80-0
---in (m/sec) varies 22.22 varies 13.89 varies 22.22 varies
distance (m) 527 402 48 157 412 1,125 63
Time (sec) 30.00 37.00 18.09 3.50 11.30 22.00 50.63 4.50 5.00 182.02 3.03
from firecall tostart
vehicle
977 1,600
Portion to runFire
StationStraight Straight at Site
to startdischrgefoam at
50% rateof ICAO
Response Time
through Road 13 through Runway to end
through Road 13 through Runway to endfrom fire
call tostart
vehicle
977 1,600 to startdischrgefoam at
50% rateof ICAO
R = 100 m R = 100 mR = 300 m R = 300 m
Portion to runFire
StationStraight Straight at Site Response Time
The fire fighting vehicles provided through the Projects consist of one (1) high-speed rapid intervention vehicle (RIV) with a 6-ton water reservoir capacity and two (2) normal vehicles with a 10-ton water capacity, all of which were made in 2008 by IVECO Magirus of Italy.
The Table implies that if RIV type (maximum speed of 90 km/h) is used for the initial fire service the response time of 2.76 minutes is achievable satisfying the ICAO standard requirements of maximum 3 minutes.
If the response time of 2 minutes recommended by ICAO is to be pursued at the Airport, further solution should be discussed, e.g. fire engine and men should be ready to start before aircraft operations, or to construct another fire-fighting sub-station located closer to the runway ends.

Special Assistance for Project Implementation (SAPI) for Borg El Arab International Airport Modernization Project
Chapter 7 Recommendation on Future Airport Development - Final Report -
7-36
f) Access Road Tunnel
When the Airport is provided with two open parallel runways and terminal complex is situated between them, connecting taxiways, fire access and other internal roads necessarily cross over the access road by means of taxiway bridges or underground road tunnels.
Figure 7.4-22 shows an example solution for the crossing by provision of the underground tunnels for the access road underneath the taxiway and the internal roads.
Figure 7.4-22 Option 2 - Location of Underground Road Tunnel
For the purpose of cost estimate, it has been preliminarily assumed that two (2) lanes of 130 linear m in total (i.e. 50 m + 50 m +15 m +15 m) of a consistent dimension (internal width of 8.5 m, and height of 5 m) of reinforced concrete box culverts should be constructed, of which typical cross section is shown in Figure 7.4-23.
Figure 7.4-23 Option 2 - Typical Cross Section of Underground Road Tunnel
g) Suggested Option 2 Phase-2 Development Plan
As a result of the above discussion, the Phase-2 Development for the Airport has been proposed as shown in Figure 7.4-24.

Special Assistance for Project Implementation (SAPI) for Borg El Arab International Airport Modernization Project
Chapter 7 Recommendation on Future Airport Development - Final Report -
7-37
Figure 7.4-24 Suggested Option 2 Phase-2 Development Plan with Open Parallel 2nd Runway

Special Assistance for Project Implementation (SAPI) for Borg El Arab International Airport Modernization Project
Chapter 7 Recommendation on Future Airport Development - Final Report -
7-38
h) Cost Estimate
Project cost for the Option 2 Phase-2 Development has been preliminarily estimated as shown in Table 7.4-9.
Table 7.4-9 Option 2 - Preliminary Cost Estimate for Phase-2 Development
in L.E. in Yen
Exchange rate : Japanese Yen = EGP 0.0769
A: Construction
Part 1 General Requirements 1 11,893,945.91 70,077,257 17,284,504.14 224,698,554
Part 2 Civil Works 536,947,264.03 86,400,352.00 543,593,444.95 7,066,714,784
Earthwork
Excavation m3 7,750,409 137,610,395.14 137,610,395.14 1,788,935,137
Embankment m3 7,665,595 140,909,603.53 140,909,603.53 1,831,824,846
Pavement
Runway 2,500m Sum 1 36,830,465.67 36,830,465.67 478,796,054
Taxiway 7,480m Sum 1 78,331,910.94 78,331,910.94 1,018,314,842
Apron Sum 1 56,525,001.88 56,525,001.88 734,825,024
Road and Car park Sum 1 13,816,128.52 13,816,128.52 179,609,671
Other roads, marking and subgrade for pavement Sum 1 18,758,336.36 18,758,336.36 243,858,373
Stormwater Drainage
Manholes, inlets, pipes and open ditches Sum 1 16,803,229.45 1,920,632 16,950,970.37 220,362,615
Miscellaneous
Tunnnel m 260 11,332,001.20 11,332,001.20 147,316,016
Fences, Gates, road signs and flag poles Sum 1 4,730,621.97 2,588,458 4,929,734.12 64,086,544
Landscaping Sum 1 21,299,569.37 81,891,262 27,598,897.22 358,785,664
Part 3 Utility Works 51,305,457.00 763,570,557.00 110,041,653.69 1,430,541,498
Power Supply Sum 1 43,321,776.64 362,851,223 71,233,409.18 926,034,319
Water/ Chiller Plant Sum 1 3,766,339.59 298,701,868 26,743,406.36 347,664,283
Fire Fighting Facility Sum 1 1,146,276.93 99,524,271 8,801,990.08 114,425,871
Sewage Treatment Sum 1 3,071,063.84 2,493,195 3,262,848.07 42,417,025
Part 4 Building Works 207,969,923.15 3,559,916,448.00 481,809,649.91 6,263,525,449
Passenger Terminal Building (PTB) Sum 1 185,628,499.08 3,448,612,562 450,906,388.46 5,861,783,050
Other Buildings Sum 1 22,341,424.07 111,303,886 30,903,261.45 401,742,399
Primary substation(PSS)
Chiller Plant & Water Tank Building (CHT)
PTS Substation (PTS)
Guard House(GDH)
Part 5 Nav Aids Works Sum 1 1,173,312.00 221,012,720 18,174,290.46 236,265,776
Part 6 Aeronautical Ground Lighting Works Sum 1 18,271,857.83 117,916,478 27,342,356.14 355,450,630
Part 7 Road & Car Park Lighting Works Sum 1 3,860,160.84 76,650,584 9,756,359.61 126,832,675
831,421,920.76 4,895,544,396.00 1,208,002,258.91 15,704,029,366
Contingency 5% of subtotal 42,000,000.00 245,000,000 60,846,153.85 791,000,000
Price Escalation 10.0% 87,342,192.08 1,135,448,497
960,764,112.84 5,140,544,396.00 1,356,190,604.84 17,630,477,863
B: Consultancy Services % ofconstruction
Part 1 Detailed Design 3.0% 10,171,429.54 396,685,752 40,685,718.16 528,914,336
Part 2 Assistance in Bidding 1.0% 2,712,381.21 141,043,823 13,561,906.06 176,304,779
Part 3 Construction Supervisio 8.0% 21,699,049.68 1,128,350,583 108,495,248.37 1,410,438,229
Part 4 Maintenance Supervisio 2.0% 6,780,953.02 264,457,168 27,123,812.10 352,609,557
Contingency 5% 2,100,000.00 96,500,000.00 9,523,076.92 123,800,000
43,463,813.45 2,027,037,326 199,389,761.61 2,592,066,901
C: Grand Total Cost for A (Construction) and B (Consultancy) 1,004,227,926.29 7,167,581,722 1,555,580,366.45 20,222,544,764
D: Project Administration Cost 1.0% 10,042,279.26 130,549,630
E: Grand Total 1,014,270,205.55 7,167,581,722 1,555,580,366.45 20,353,094,394
Description
Total of Construction Cost A:
Preconstruction Stage
Construction Stage
Total of Consultancy Cost B:
Subtotal of Construction works (Part 1 to 7)
Unit Qty Amount(L.E)
Amount(Yen)
Conbined amount
Notes 1) Unit cost used is basically an average of the previously-offered prices of Besix-Orascom Joint venture (BOJV)
and Taisei-TAV Joint venture (TTJV) as of the Bidding in 2007 for the Project. 2) Average inflation rate in Egypt for the past 7 years (from 2003 to 2010) was 9.4 %, therefore basic local costs
have been escalated for 5 years after the Bidding (from 2007 to 2012) by 56.71 %.

Special Assistance for Project Implementation (SAPI) for Borg El Arab International Airport Modernization Project
Chapter 7 Recommendation on Future Airport Development - Final Report -
7-39
7.4.4. Project Implementation Scheme
The Phase-2 Development for Borg El Arab International Airport would involve construction of wide area of airfield pavement accompanied by a vast volume of earthwork (approximately 8 million-m³ cut, and 8 million-m³ fill), which necessitates considerable amount of initial investment.
Normally, the amount of revenues produced by the airfield facilities is smaller than those produced by terminal facilities thus requiring longer period of cost recovery for the initial investment. Besides, passenger terminal is a main revenue generating facility among others in the airport, therefore once proposals are solicited for investment among private sectors for construction, operation and management of a passenger terminal, there might exist some interested parties.
Meanwhile, the Borg El Arab International Airport is owned and operated by the Egyptian Airports Company (EAC) which is a company of self-accounting principle though for the moment organized wholly under the Government. The staff at the Airport are being trained to possess necessary knowledge to operate, maintain and manage the Airport by themselves.
Considering the magnitude of this particular Airport where LCCs and Egyptian pilgrimage passengers are main end-users, it is considered not feasible for private sector to undertake the project by means of PPP or BOT schemes. It is further anticipated that transfer of any part of the airport revenue (e.g. from Terminal 2) to private sectors could negatively affect the overall manner of airport operations or the EAC’s cash-flow as a whole.
Hence, it is considered desirable for EAC to implement the Phase-2 development with an financial assistance of foreign soft loan.


