Embed Size (px)
Citation preview
Crude Oil Forecast, Markets & Transportation 1
Crude OilForecast, Markets & Transportation
June 2014

2 CANADIAN ASSOCIATION OF PETROLEUM PRODUCERS
Disclaimer: This publication was prepared by the Canadian Association of Petroleum Producers (CAPP). While it is believed that the information contained herein is reliable under the conditions and subject to the limitations set out, CAPP does not guarantee the accuracy or completeness of the information. The use of this report or any information contained will be at the user’s sole risk, regardless of any fault or negligence of CAPP.
© Material may be reproduced for public non-commercial use provided due diligence is exercised in ensuring accuracy of information reproduced; CAPP is identified as the source; and reproduction is not represented as an official version of the information reproduced nor as any affiliation.
On Cover: Top Left: Crude by Rail tank car- photo courtesy of Altex EnergyTop Right: Prince George refinery - photo courtesy of Husky EnergyBottom Left: TransCanada Keystone construction - photo courtesy of TransCanada Bottom: Cenovus in situ project
Crude Oil Forecast, Markets & Transportation i
EXECUTIVE SUMMARY Canadian crude oil production is expected to grow over the long-term to 6.4 million b/d by 2030. These supplies will meet the demand of markets located throughout North America and beyond. The recent uncertainty regarding the timing of some transportation infrastructure projects has opened the door for several alternatives, including the transport of crude oil by rail, which is rising and adapting to meet market needs.
The key points of this year’s outlook are:
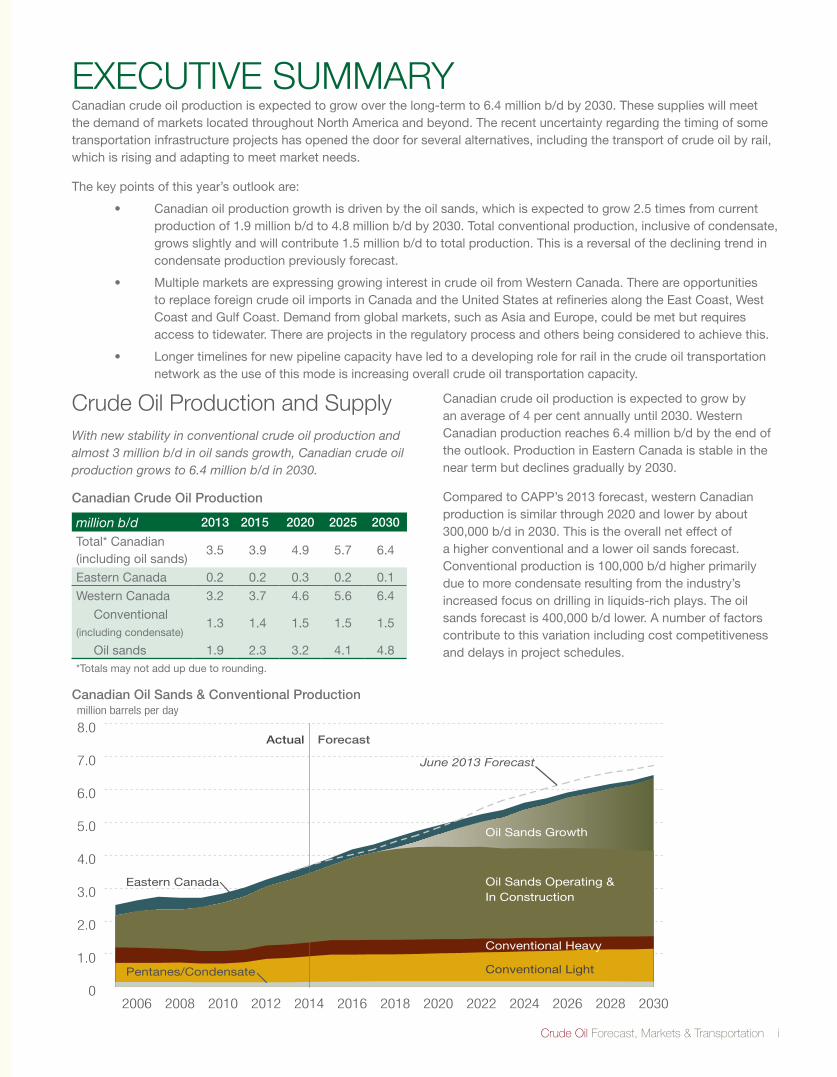
• Canadianoilproductiongrowthisdrivenbytheoilsands,whichisexpectedtogrow2.5timesfromcurrentproduction of 1.9 million b/d to 4.8 million b/d by 2030. Total conventional production, inclusive of condensate, growsslightlyandwillcontribute1.5millionb/dtototalproduction.Thisisareversalofthedecliningtrendincondensate production previously forecast.
• MultiplemarketsareexpressinggrowinginterestincrudeoilfromWesternCanada.Thereareopportunitiesto replace foreign crude oil imports in Canada and the United States at refineries along the East Coast, West Coast and Gulf Coast. Demand from global markets, such as Asia and Europe, could be met but requires access to tidewater. There are projects in the regulatory process and others being considered to achieve this.
• Longertimelinesfornewpipelinecapacityhaveledtoadevelopingroleforrailinthecrudeoiltransportationnetwork as the use of this mode is increasing overall crude oil transportation capacity.
Crude Oil Production and SupplyWith new stability in conventional crude oil production and almost 3 million b/d in oil sands growth, Canadian crude oil production grows to 6.4 million b/d in 2030.
Canadian Crude Oil Production
million b/d 2013 2015 2020 2025 2030
Total* Canadian (including oil sands)
3.5 3.9 4.9 5.7 6.4
Eastern Canada 0.2 0.2 0.3 0.2 0.1
Western Canada 3.2 3.7 4.6 5.6 6.4
Conventional (including condensate)
1.3 1.4 1.5 1.5 1.5
Oil sands 1.9 2.3 3.2 4.1 4.8*Totals may not add up due to rounding.
Canadian crude oil production is expected to grow by an average of 4 per cent annually until 2030. Western Canadian production reaches 6.4 million b/d by the end of the outlook. Production in Eastern Canada is stable in the near term but declines gradually by 2030.
Compared to CAPP’s 2013 forecast, western Canadian production is similar through 2020 and lower by about 300,000 b/d in 2030. This is the overall net effect of a higher conventional and a lower oil sands forecast. Conventional production is 100,000 b/d higher primarily due to more condensate resulting from the industry’s increased focus on drilling in liquids-rich plays. The oil sands forecast is 400,000 b/d lower. A number of factors contribute to this variation including cost competitiveness and delays in project schedules.
Canadian Oil Sands & Conventional Production
0
1.0
2.0
3.0
4.0
5.0
6.0
7.0
8.0
2030202820262024202220202018201620142012201020082006
Conventional Heavy
Pentanes/Condensate
million barrels per day
Actual Forecast
Eastern Canada
Conventional Light
June 2013 Forecast
Conventional Heavy
Oil Sands Growth
Oil Sands Operating & In Construction
ii CANADIAN ASSOCIATION OF PETROLEUM PRODUCERS
Conventional Oil
Conventional production in Western Canada is currently 1.3 million b/d and is expected to grow to almost 1.5millionb/dby2020.Thisgrowthhasresultedfromthecontinuing use of horizontal and multi-stage fracturing drilling techniques. In addition, increased drilling in liquids-rich natural gas plays such as the Montney and emerging plays like the Duvernay has reversed the declining trend in condensate production, which was previously forecast to fall to 94,000 b/d by 2030. In this latest forecast, condensateproductionaccountsforalmost170,000b/d,on average, for the forecast period.
Oil Sands
The vast majority of Canada’s crude oil reserves reside in the oil sands so it is natural for this resource to be the primary driver for future overall growth. The 2014 outlook for oil sands is for an average annual growth of 170,000b/dthroughto2030.
In 2013, 1.9 million b/d were produced from the oil sands ofwhich850,000b/dwasfromminingand1.1millionb/dfrom in situ projects. Looking ahead to 2030, mining production is forecast to increase to 1.6 million b/d and in situ production is forecast to grow to 3.2 million b/d. ComparedtoCAPP’s2013forecast,thisis87,000b/dlower for mining and 312,000 b/d lower for in situ. Some projects were delayed beyond the current forecast period as a result of individual company decisions related to cost competitiveness and capital availability. These impacts are evident near the end of the forecast period.
Eastern Canada
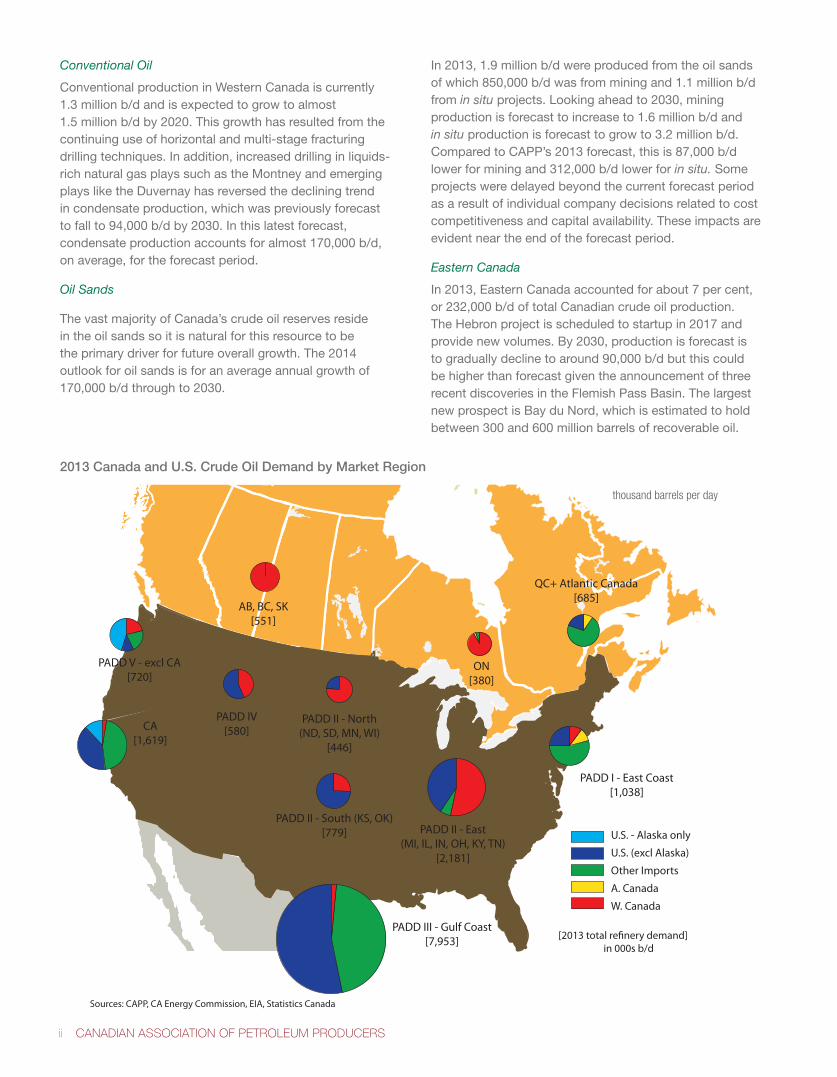
In2013,EasternCanadaaccountedforabout7percent,or 232,000 b/d of total Canadian crude oil production. TheHebronprojectisscheduledtostartupin2017andprovide new volumes. By 2030, production is forecast is to gradually decline to around 90,000 b/d but this could be higher than forecast given the announcement of three recent discoveries in the Flemish Pass Basin. The largest new prospect is Bay du Nord, which is estimated to hold between 300 and 600 million barrels of recoverable oil.
AB, BC, SK[551]
CA [1,619]
PADD V - excl CA [720]
PADD IV [580]
PADD III - Gulf Coast[7,953]
PADD II - North (ND, SD, MN, WI)
[446]
PADD II - South (KS, OK) [779] PADD II - East
(MI, IL, IN, OH, KY, TN) [2,181]
PADD I - East Coast [1,038]
[2013 total re�nery demand] in 000s b/d
Sources: CAPP, CA Energy Commission, EIA, Statistics Canada
ON [380]
QC+ Atlantic Canada [685]
thousand barrels per day
U.S. - Alaska only
U.S. (excl Alaska)
Other Imports
A. Canada
W. Canada
2013 Canada and U.S. Crude Oil Demand by Market Region
Crude Oil Forecast, Markets & Transportation iii
Portland
Montréal
Chicago
Cushing
St. Paul
HoustonSt. James
New Orleans
El Paso
Freeport
Edmonton
AnacortesBurnaby
BP
Hardisty
Centurion
Shell Ho-Ho
WoodRiver
Cromer
Clearbrook
Guernsey
Kitimat
Mus
tang
PatokaLima
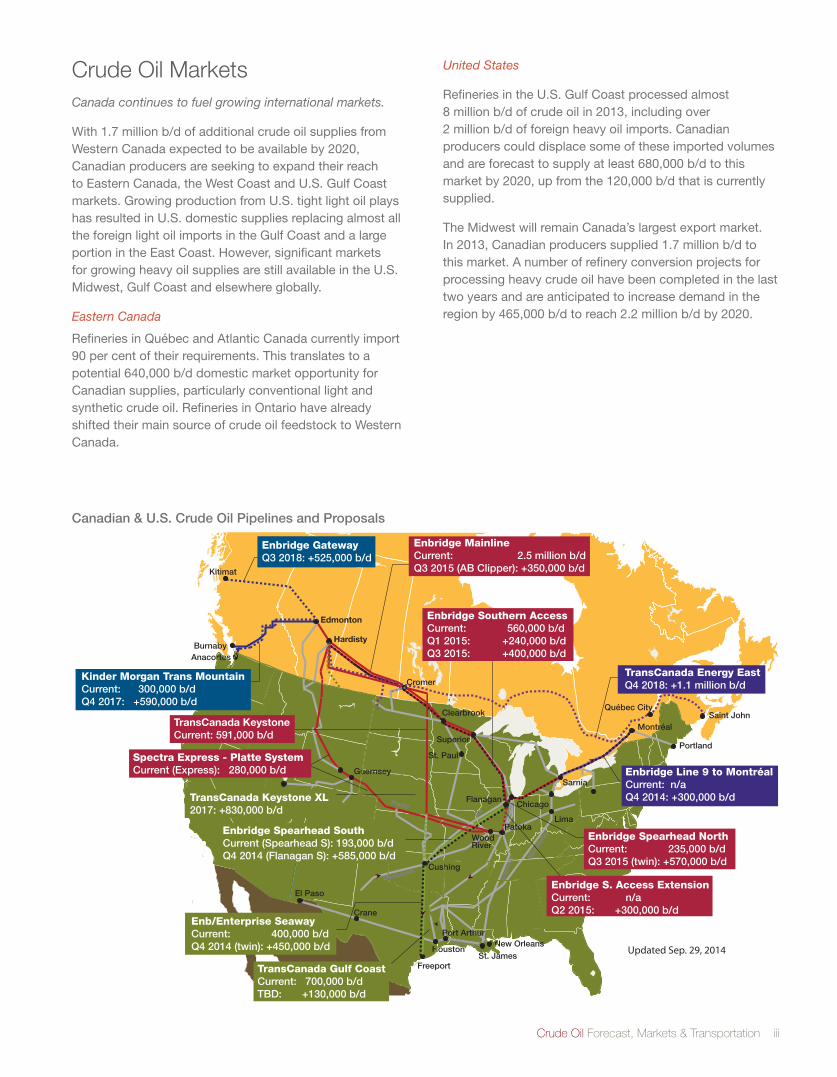
Enbridge GatewayQ3 2018: +525,000 b/d
Enbridge MainlineCurrent: 2.5 million b/dQ3 2015 (AB Clipper): +350,000 b/d
Superior
Platte
Enbridge Line 9 to MontréalCurrent: n/aQ4 2014: +300,000 b/dFlanagan
Mid
Val
ley
CraneEnb/Enterprise SeawayCurrent: 400,000 b/dQ4 2014 (twin): +450,000 b/d
Cap
line
TransCanada Energy EastQ4 2018: +1.1 million b/d
Enbridge Southern AccessCurrent: 560,000 b/d Q1 2015: +240,000 b/dQ3 2015: +400,000 b/d
Québec CitySaint John
Port Arthur
TransCanada Gulf CoastCurrent: 700,000 b/dTBD: +130,000 b/d
Kinder Morgan Trans MountainCurrent: 300,000 b/dQ4 2017: +590,000 b/d
Spectra Express - Platte SystemCurrent (Express): 280,000 b/d
Enbridge Spearhead SouthCurrent (Spearhead S): 193,000 b/dQ4 2014 (Flanagan S): +585,000 b/d
TransCanada KeystoneCurrent: 591,000 b/d
Sarnia
TransCanada Keystone XL2017: +830,000 b/d
Enbridge Spearhead NorthCurrent: 235,000 b/dQ3 2015 (twin): +570,000 b/d
Updated Sep. 29, 2014
Enbridge S. Access ExtensionCurrent: n/aQ2 2015: +300,000 b/d
Crude Oil Markets Canada continues to fuel growing international markets.
With1.7millionb/dofadditionalcrudeoilsuppliesfromWestern Canada expected to be available by 2020, Canadian producers are seeking to expand their reach to Eastern Canada, the West Coast and U.S. Gulf Coast markets. Growing production from U.S. tight light oil plays has resulted in U.S. domestic supplies replacing almost all the foreign light oil imports in the Gulf Coast and a large portion in the East Coast. However, significant markets for growing heavy oil supplies are still available in the U.S. Midwest, Gulf Coast and elsewhere globally.
Eastern Canada
Refineries in Québec and Atlantic Canada currently import 90 per cent of their requirements. This translates to a potential 640,000 b/d domestic market opportunity for Canadian supplies, particularly conventional light and synthetic crude oil. Refineries in Ontario have already shifted their main source of crude oil feedstock to Western Canada.
United States
Refineries in the U.S. Gulf Coast processed almost 8 million b/d of crude oil in 2013, including over 2 million b/d of foreign heavy oil imports. Canadian producers could displace some of these imported volumes and are forecast to supply at least 680,000 b/d to this market by 2020, up from the 120,000 b/d that is currently supplied.
The Midwest will remain Canada’s largest export market. In2013,Canadianproducerssupplied1.7millionb/dtothis market. A number of refinery conversion projects for processing heavy crude oil have been completed in the last two years and are anticipated to increase demand in the regionby465,000b/dtoreach2.2millionb/dby2020.
Canadian & U.S. Crude Oil Pipelines and Proposals
iv CANADIAN ASSOCIATION OF PETROLEUM PRODUCERS
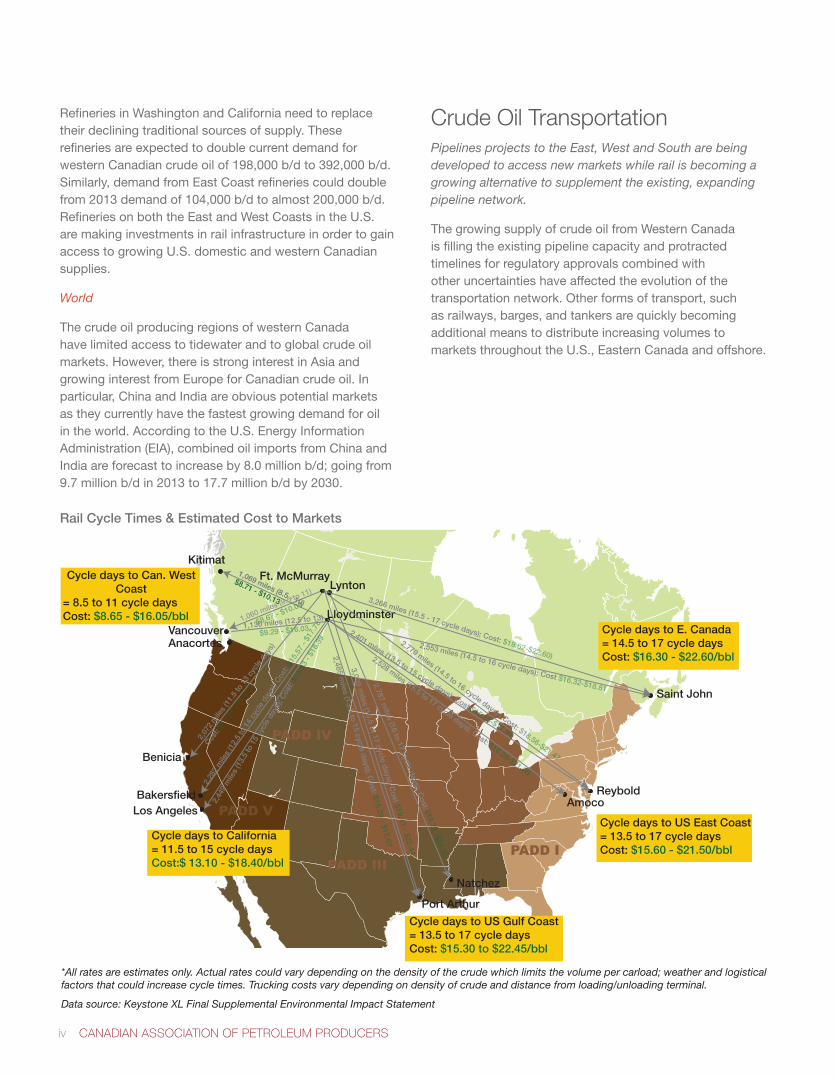
Refineries in Washington and California need to replace their declining traditional sources of supply. These refineries are expected to double current demand for western Canadian crude oil of 198,000 b/d to 392,000 b/d. Similarly, demand from East Coast refineries could double from 2013 demand of 104,000 b/d to almost 200,000 b/d. Refineries on both the East and West Coasts in the U.S. are making investments in rail infrastructure in order to gain access to growing U.S. domestic and western Canadian supplies.
World
The crude oil producing regions of western Canada have limited access to tidewater and to global crude oil markets. However, there is strong interest in Asia and growing interest from Europe for Canadian crude oil. In particular, China and India are obvious potential markets as they currently have the fastest growing demand for oil in the world. According to the U.S. Energy Information Administration (EIA), combined oil imports from China and India are forecast to increase by 8.0 million b/d; going from 9.7millionb/din2013to17.7millionb/dby2030.
Crude Oil TransportationPipelines projects to the East, West and South are being developed to access new markets while rail is becoming a growing alternative to supplement the existing, expanding pipeline network.
The growing supply of crude oil from Western Canada is filling the existing pipeline capacity and protracted timelines for regulatory approvals combined with other uncertainties have affected the evolution of the transportation network. Other forms of transport, such as railways, barges, and tankers are quickly becoming additional means to distribute increasing volumes to markets throughout the U.S., Eastern Canada and offshore.
PADD V
PADD IV
PADD II
PADD IPADD III
Los Angeles
Lloydminster
AnacortesVancouver
Ft. McMurrayLynton
Kitimat
Benicia
Bakersfield
Saint John
ReyboldAmoco
Port Arthur
Natchez
1,069 miles (8.5 - 10)
$8.71 - $10.13
2,44
9 m
iles
(13.
5 to
15
cycl
e da
ys);
Cos
t: $1
5.93
- $1
8.39
2,28
2 m
iles
(12.
5 to
14
cycl
e da
ys);
Cos
t: $1
5.57
- $1
7.78
1,060 miles (9.5 to 11)
$8.67 - $10.09
2,553 miles (14.5 to 16 cycle days); Cost $16.32-$18.81
3,266 miles (15.5 - 17 cycle days); Cost: $19.62-$22.60)
2,401 miles (13.5 to 15 cycle days); Cost:$15.55-$17.98
2,528 miles (15.5 to 17 cycle days); Cost: $18.26-$21.05
3,009 miles (15.5 to 17 cycle days); C
ost $19.43 - $22.44
2,787 miles (16 to 17 cycle days); C
ost:$19.71 -$21.55
2,485 miles (13.5 to 15 cycle d
ays); Cost: $15.29 - $17.67
2,07
2 m
iles
(11.
5 to
13
cycl
e da
ys)
Cost:
$13.
08 -
$14.
75
Cycle days to US East Coast = 13.5 to 17 cycle daysCost: $15.60 - $21.50/bbl
Cycle days to US Gulf Coast = 13.5 to 17 cycle daysCost: $15.30 to $22.45/bbl
Cycle days to California= 11.5 to 15 cycle daysCost:$ 13.10 - $18.40/bbl
Cycle days to Can. West Coast
= 8.5 to 11 cycle daysCost: $8.65 - $16.05/bbl
Cycle days to E. Canada= 14.5 to 17 cycle daysCost: $16.30 - $22.60/bbl
2,779 miles (14.5 to 16 cycle days) ; Cost: $18.56-$21.47
1,130 miles (12.5 to 13)
$9.29 - $16.03
Rail Cycle Times & Estimated Cost to Markets
*All rates are estimates only. Actual rates could vary depending on the density of the crude which limits the volume per carload; weather and logistical factors that could increase cycle times. Trucking costs vary depending on density of crude and distance from loading/unloading terminal.
Data source: Keystone XL Final Supplemental Environmental Impact Statement
Crude Oil Forecast, Markets & Transportation v
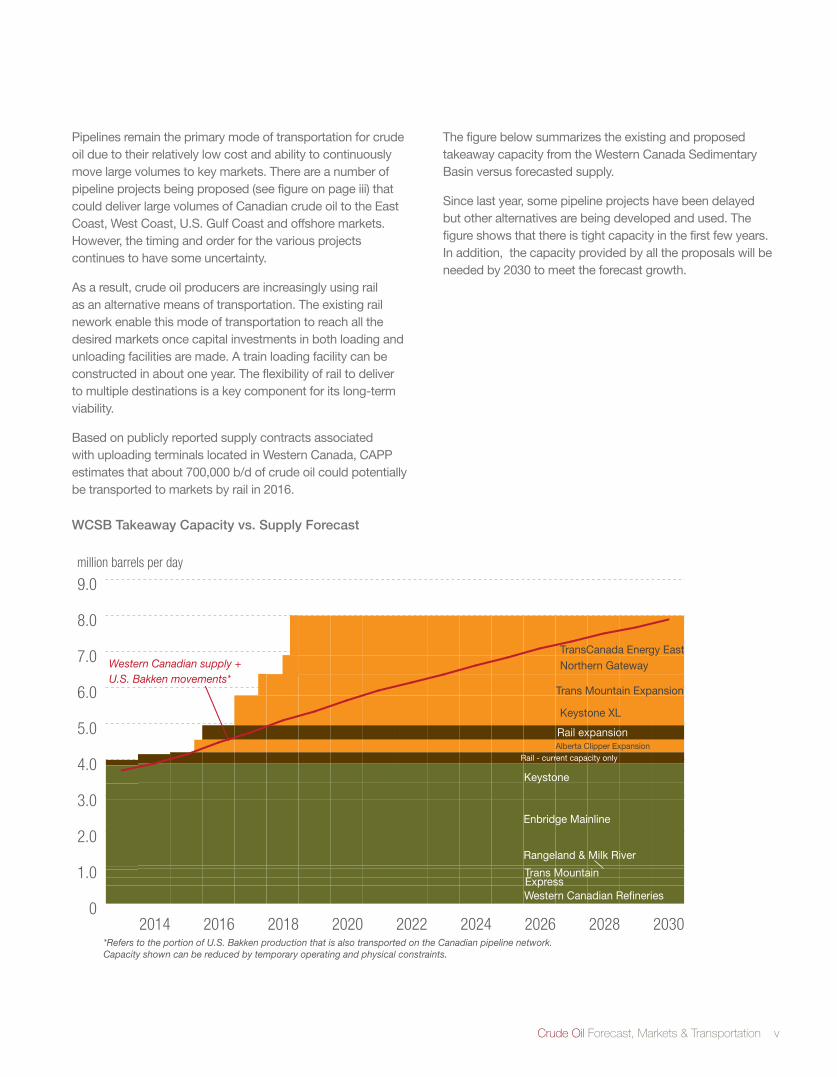
WCSB Takeaway Capacity vs. Supply Forecast
0
1.0
2.0
3.0
4.0
5.0
6.0
7.0
8.0
9.0
203020282026202420222020201820162014
million barrels per day
Western Canadian RefineriesExpressTrans Mountain
Enbridge Mainline
Keystone
Rail - current capacity only
Rangeland & Milk River
TransCanada Energy East
Trans Mountain Expansion
Northern Gateway
Alberta Clipper Expansion
Keystone XL
Rail expansion
Western Canadian supply + U.S. Bakken movements*
*Refers to the portion of U.S. Bakken production that is also transported on the Canadian pipeline network.Capacity shown can be reduced by temporary operating and physical constraints.
Pipelines remain the primary mode of transportation for crude oil due to their relatively low cost and ability to continuously move large volumes to key markets. There are a number of pipeline projects being proposed (see figure on page iii) that could deliver large volumes of Canadian crude oil to the East Coast, West Coast, U.S. Gulf Coast and offshore markets. However, the timing and order for the various projects continues to have some uncertainty.
As a result, crude oil producers are increasingly using rail as an alternative means of transportation. The existing rail nework enable this mode of transportation to reach all the desired markets once capital investments in both loading and unloading facilities are made. A train loading facility can be constructed in about one year. The flexibility of rail to deliver to multiple destinations is a key component for its long-term viability.
Based on publicly reported supply contracts associated with uploading terminals located in Western Canada, CAPP estimatesthatabout700,000b/dofcrudeoilcouldpotentiallybe transported to markets by rail in 2016.
The figure below summarizes the existing and proposed takeaway capacity from the Western Canada Sedimentary Basin versus forecasted supply.
Since last year, some pipeline projects have been delayed but other alternatives are being developed and used. The figure shows that there is tight capacity in the first few years. In addition, the capacity provided by all the proposals will be needed by 2030 to meet the forecast growth.
vi CANADIAN ASSOCIATION OF PETROLEUM PRODUCERS
TABLE OF CONTENTS
EXECUTIVE SUMMARY iLIST OF FIGURES AND TABLES vii
1 INTRODUCTION 11.1 Production and Supply Forecast Methodology 1
1.2 Market Demand Outlook Methodology 2
1.3 Transportation Outlook Methodology 2
2 CRUDE OIL PRODUCTION AND SUPPLY FORECAST 32.1 Canadian Crude Oil Production 3
2.2 Eastern Canadian Crude Oil Production 3
2.3 Western Canadian Crude Oil Production 4
2.4 Western Canadian Crude Oil Supply 8
2.5 CrudeOilProductionandSupplySummary 9
3 CRUDE OIL MARKETS 103.1 Canada 11
3.2 United States 13
3.3 International 21
3.4 Markets Summary 21
4 TRANSPORTATION 224.1 Existing Crude Oil Pipelines Exiting Western Canada 23
4.2 NewRegionalInfrastructureProjectsinWesternCanada 25
4.3 OilPipelinestotheU.S.Midwest 25
4.4 OilPipelinestotheU.S.GulfCoast 27
4.5 OilPipelinestotheWestCoastofCanada 28
4.6 Oil Pipelines to Eastern Canada 28
4.7 DiluentPipelines 29
4.8 Crude Oil by Rail 30
4.9 Transportation Summary 34
GLOSSARY 35APPENDIX A: Acronyms, Abbreviations, Units and Conversion Factors 37APPENDIX B.1: CAPP Canadian Crude Oil Production Forecast 2014 – 2030 39APPENDIX B.2: CAPP Western Canadian Crude Oil Supply Forecast 2014 – 2030 40APPENDIX C: Crude Oil Pipelines and Refineries 41
Crude Oil Forecast, Markets & Transportation vii
LIST OF FIGURES AND TABLESFiguresFigure 2.1 Canadian Oil Sands & Conventional Production 4Figure2.2 WesternCanadaConventionalProduction 5Figure 2.3 Oil Sands Regions 6Figure2.4 WesternCanadaOilSands&ConventionalProduction 7Figure2.5 WesternCanadaOilSands&ConventionalSupply 9
Figure 3.1 Canada and U.S. Market Demand for Crude Oil in 2013 by Source 10Figure 3.2 Market Demand for Western Canadian Crude Oil: Actual 2013 and 2020 Additional 11Figure 3.3 Western Canada: Crude Oil Receipts from Western Canada 12Figure 3.4 Eastern Canada: Crude Oil Receipts from Western Canada 12Figure3.5 2013PADDI:ForeignSourcedSupplybyTypeandDomesticCrudeOil 15Figure3.6 2013PADDII:ForeignSourcedSupplybyTypeandDomesticCrudeOil 15Figure3.7 PADDII(North&South):CrudeOilReceiptsfromWesternCanada 16Figure 3.8 PADD II (East): Forecast Crude Oil Receipts from Western Canada 16Figure3.9 2013PADDIII:ForeignSourcedSupplybyTypeandDomesticCrudeOil 17Figure 3.10 PADD IV: Crude Oil Receipts from Western Canada 18Figure 3.11 2013 PADD V: Foreign Sourced Supply by Type and Domestic Crude Oil 18Figure 3.12 PADD V (Washington): Crude Oil Receipts from Western Canada 19Figure 3.13 2013 PADD V (California): Foreign Sourced Supply by Type and Domestic Crude Oil 19Figure 3.14 Global Net Oil Imports: 2013 to 2030 21
Figure 4.1 Canadian & U.S. Crude Oil Pipelines - All Proposals 22Figure 4.2 Canadian Fuel Oil and Crude Petroleum Moved by Rail: Car Loadings & Tonnage 30Figure 4.3 North American Rail Network 31Figure 4.4 Rail Loading Terminals in Western Canada 32Figure4.5 WesternCanadaUploadingCapacityvs.RailMovements 32Figure 4.6 Rail Cycle Times and Estimated Cost to Market 33Figure4.7 WCSBTakeawayCapacityvs.SupplyForecast 34
TablesTable 2.1 Canadian Crude Oil Production 3Table 2.2 Western Canadian Crude Oil Production 4Table2.3 OilSandsProduction 7Table 2.4 Western Canadian Crude Oil Supply 9
Table 3.1 Summary of Rail Offloading Terminals in PADD I 14Table3.2 SummaryofRecentRefineryUpgradesinNorthern&SouthernPADDII 15Table 3.3 Summary of Recent Refinery Upgrades in Eastern PADD II 16Table 3.4 Summary of Recent Refinery Upgrades in PADD III 18Table3.5 SummaryofRailOffloadingTerminalsinWesternCanada&PADDV 20Table 3.6 Total Oil Demand in Major Asian Countries 21
Table 4.1 Major Existing & Proposed Crude Oil Pipelines Exiting the WCSB 23Table 4.2 Summary of Crude Oil Pipelines to the U.S. Midwest 26Table4.3 SummaryofCrudeOilPipelinestotheU.S.GulfCoast 27Table 4.4 Summary of Crude Oil Pipelines to the West Coast of Canada 28Table4.5 SummaryofCrudeOilPipelinestoEasternCanada 29Table 4.6 Summary of Diluent Pipelines 29
1 CANADIAN ASSOCIATION OF PETROLEUM PRODUCERS
INTRODUCTION
Each year CAPP publishes its long-term outlook for Canadian crude oil production. Since 2007, this outlook has been provided in conjunction with an examination of the potential demand in various markets, as well as an update on the transportation infrastructure that is both currently available and proposed to serve these markets. As such, CAPP’s annual Crude Oil Forecast, Markets & Transportation publication provides a valuable reference document for the industry, governments and the general public.
1
The report is intended to help develop a common understanding regarding the growth in Canadian crude oil supply. CAPP’s long-term crude oil forecast is based on the amalgamated results of the producers’ latest views on their individual oil sands projects while the market demand forecast reflects an unadjusted survey of North American refiners’ future demand for western Canadian crude oil.
Canadian crude oil production is expected to grow steadily to 2030 driven primarily by production from oil sandsresources.Theoilsandsrepresentover97percentof Canada’s crude oil reserves and is the main source for future growth. CAPP’s estimate of industry capital spending on oil sands development is $29 billion for 2014, which is $2 billion higher than the estimated expenditure in 2013. Conventional production grows slightly through the forecast, which offsets some of the declines in production from offshore Eastern Canada after 2020.
1.1 Production and Supply Forecast Methodology
The oil sands component of the forecast is based on CAPP’s survey of all oil sands producers and as such, reflects the latest industry insight on factors such as production capability from individual projects and general market opportunities.
CAPP does not forecast crude oil prices. Producers responded to the survey using their own internal view of the long-term oil price. In this manner, CAPP is assuming that the oil price will be sufficient to make these projects economic so that this production will be available to the market.
Producers were surveyed for the following data:
a) expected production for each project by phase;
b) upgraded light crude oil production; and
c) volumes of synthetic crude oil and condensate used as diluent required to move the volumes to market.
The survey results were then adjusted or “risked” accordingly based on each project’s stage of development. Past performance of each company’s existing projects or phases was also considered in determining the pace of activity in future project stages, which is an important factor in the case of in situ projects that typically have their production capacity divided into multiple phases. The overall forecast was then verified for reasonableness against historical trends. No constraints were put on the forecast due to availability of condensate for blending purposes.
The conventional component of the forecast is undertaken at a provincial level and was developed through CAPP’s internal analysis of historical trends, expected drilling activity, recent announcements, as well as discussions with industry stakeholders and government agencies.
The Saskatchewan forecast is further supported by the data from CAPP’s survey of the oil producers in the province regarding their annual drilling outlook by well type (horizontal or vertical), as well as their anticipated initial production rates and declines.
Crude Oil Forecast, Markets & Transportation 2
1.2 Market Demand Outlook Methodology
CAPP did not make any risk adjustments to the data submitted by refiners beyond checking it for potential errors. Certain assumptions were also made based on discussions with refiners and the review of publicly available information. Where possible, EIA data was used to complete gaps in the survey data for actual demand in 2013 for each region of the U.S.
The CAPP survey categorizes western Canadian crude oil into four main types as follows:
1. ConventionalLightSweet(greaterthan27°APIandlessthanorequalto0.5%sulphur)includingcondensates and pentanes plus;
2. Heavy(equaltoorlessthan27°API)includingconventional heavy, synthetic sour and crude oil blends such as DilBit, SynBit and DilSynBit;
3. ConventionalMediumSour(greaterthan27°APIandgreaterthan0.5%sulphur);and
4. Light Sweet Synthetic
For the purposes of the historical data presented in the source of supply pie charts in this section of the report, the following crude types and definitions apply:
• Sweet:crudeoilwithasulphurcontentoflessthanorequalto0.5%
• Sour:crudeoilwithasulphurcontentofgreaterthan0.5%
• Light:crudeoilwithanAPIofatleast30°
• Medium:crudeoilwithanAPIofgreaterthan27°butlessthan30°
• Heavy:crudeoilwithanAPIof27°orless
No differentiation is made between sweet and sour crude oil that falls into the heavy category because heavy crude oil is generally assumed to be sour.
1.3 Transportation Outlook Methodology
CAPP’s forecast of rail movements from Western Canada was developed based in part on a review of supply contract volumes attributed to individual rail loading facilities located in Western Canada.
CAPP’s production forecast is not constrained by a lack of any transportation infrastructure. However, the report does compare the supply that the analysis produces against the current and proposed pipeline and rail projects to determine where bottlenecks may occur if these transportation projects fail to materialize in the time frame they are currently envisaged.
3 CANADIAN ASSOCIATION OF PETROLEUM PRODUCERS
Technology required to access the bitumen carbonates of Northern Alberta, is under early development. Companies conducting tests in the region to commercialize these carbonates, claim that the Grosmont carbonates alone could hold more than 400 billion barrels of in place bitumen. Thus successful development of these technologies could further dramatically increase the size of Canada’s crude oil resource base.
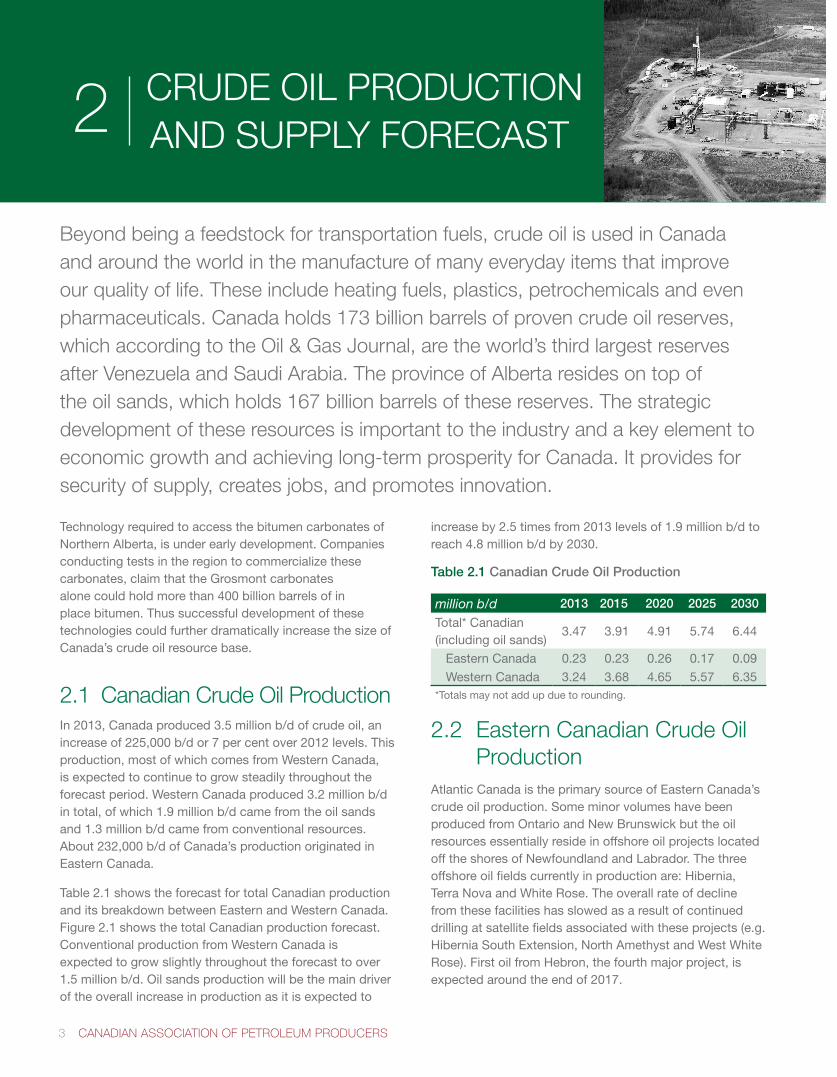
2.1 Canadian Crude Oil ProductionIn2013,Canadaproduced3.5millionb/dofcrudeoil,anincreaseof225,000b/dor7percentover2012levels.Thisproduction, most of which comes from Western Canada, is expected to continue to grow steadily throughout the forecast period. Western Canada produced 3.2 million b/d in total, of which 1.9 million b/d came from the oil sands and 1.3 million b/d came from conventional resources. About 232,000 b/d of Canada’s production originated in Eastern Canada.
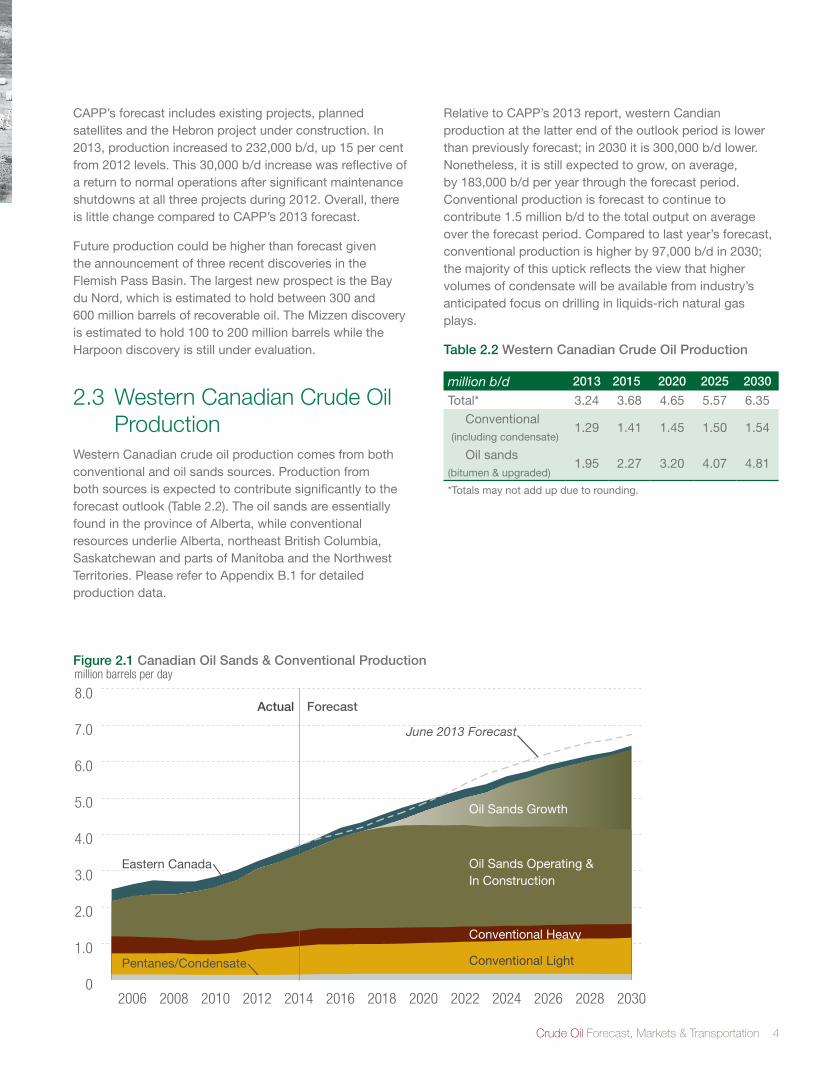
Table 2.1 shows the forecast for total Canadian production and its breakdown between Eastern and Western Canada. Figure 2.1 shows the total Canadian production forecast. Conventional production from Western Canada is expected to grow slightly throughout the forecast to over 1.5millionb/d.Oilsandsproductionwillbethemaindriverof the overall increase in production as it is expected to
increaseby2.5timesfrom2013levelsof1.9millionb/dtoreach 4.8 million b/d by 2030.
Table 2.1 Canadian Crude Oil Production
million b/d 2013 2015 2020 2025 2030
Total* Canadian (including oil sands)
3.47 3.91 4.91 5.74 6.44
Eastern Canada 0.23 0.23 0.26 0.17 0.09
Western Canada 3.24 3.68 4.65 5.57 6.35*Totals may not add up due to rounding.
2.2 Eastern Canadian Crude Oil Production
Atlantic Canada is the primary source of Eastern Canada’s crude oil production. Some minor volumes have been produced from Ontario and New Brunswick but the oil resources essentially reside in offshore oil projects located off the shores of Newfoundland and Labrador. The three offshore oil fields currently in production are: Hibernia, Terra Nova and White Rose. The overall rate of decline from these facilities has slowed as a result of continued drilling at satellite fields associated with these projects (e.g. Hibernia South Extension, North Amethyst and West White Rose). First oil from Hebron, the fourth major project, is expectedaroundtheendof2017.
CRUDE OIL PRODUCTION AND SUPPLY FORECAST2
Beyond being a feedstock for transportation fuels, crude oil is used in Canada and around the world in the manufacture of many everyday items that improve our quality of life. These include heating fuels, plastics, petrochemicals and even pharmaceuticals. Canada holds 173 billion barrels of proven crude oil reserves, which according to the Oil & Gas Journal, are the world’s third largest reserves after Venezuela and Saudi Arabia. The province of Alberta resides on top of the oil sands, which holds 167 billion barrels of these reserves. The strategic development of these resources is important to the industry and a key element to economic growth and achieving long-term prosperity for Canada. It provides for security of supply, creates jobs, and promotes innovation.
Crude Oil Forecast, Markets & Transportation 4
CAPP’s forecast includes existing projects, planned satellites and the Hebron project under construction. In 2013,productionincreasedto232,000b/d,up15percentfrom 2012 levels. This 30,000 b/d increase was reflective of a return to normal operations after significant maintenance shutdowns at all three projects during 2012. Overall, there is little change compared to CAPP’s 2013 forecast.
Future production could be higher than forecast given the announcement of three recent discoveries in the Flemish Pass Basin. The largest new prospect is the Bay du Nord, which is estimated to hold between 300 and 600 million barrels of recoverable oil. The Mizzen discovery is estimated to hold 100 to 200 million barrels while the Harpoon discovery is still under evaluation.
2.3 Western Canadian Crude Oil Production
Western Canadian crude oil production comes from both conventional and oil sands sources. Production from both sources is expected to contribute significantly to the forecast outlook (Table 2.2). The oil sands are essentially found in the province of Alberta, while conventional resources underlie Alberta, northeast British Columbia, Saskatchewan and parts of Manitoba and the Northwest Territories. Please refer to Appendix B.1 for detailed production data.
Relative to CAPP’s 2013 report, western Candian production at the latter end of the outlook period is lower than previously forecast; in 2030 it is 300,000 b/d lower. Nonetheless, it is still expected to grow, on average, by 183,000 b/d per year through the forecast period. Conventional production is forecast to continue to contribute1.5millionb/dtothetotaloutputonaverageover the forecast period. Compared to last year’s forecast, conventionalproductionishigherby97,000b/din2030;the majority of this uptick reflects the view that higher volumes of condensate will be available from industry’s anticipated focus on drilling in liquids-rich natural gas plays.
Table 2.2 Western Canadian Crude Oil Production
million b/d 2013 2015 2020 2025 2030
Total* 3.24 3.68 4.65 5.57 6.35
Conventional (including condensate)
1.29 1.41 1.45 1.50 1.54
Oil sands (bitumen & upgraded)
1.95 2.27 3.20 4.07 4.81
*Totals may not add up due to rounding.
0
1.0
2.0
3.0
4.0
5.0
6.0
7.0
8.0
2030202820262024202220202018201620142012201020082006
Conventional Heavy
Pentanes/Condensate
million barrels per day
Actual Forecast
Eastern Canada
Conventional Light
June 2013 Forecast
Conventional Heavy
Oil Sands Growth
Oil Sands Operating & In Construction
Figure 2.1 Canadian Oil Sands & Conventional Production
5 CANADIAN ASSOCIATION OF PETROLEUM PRODUCERS
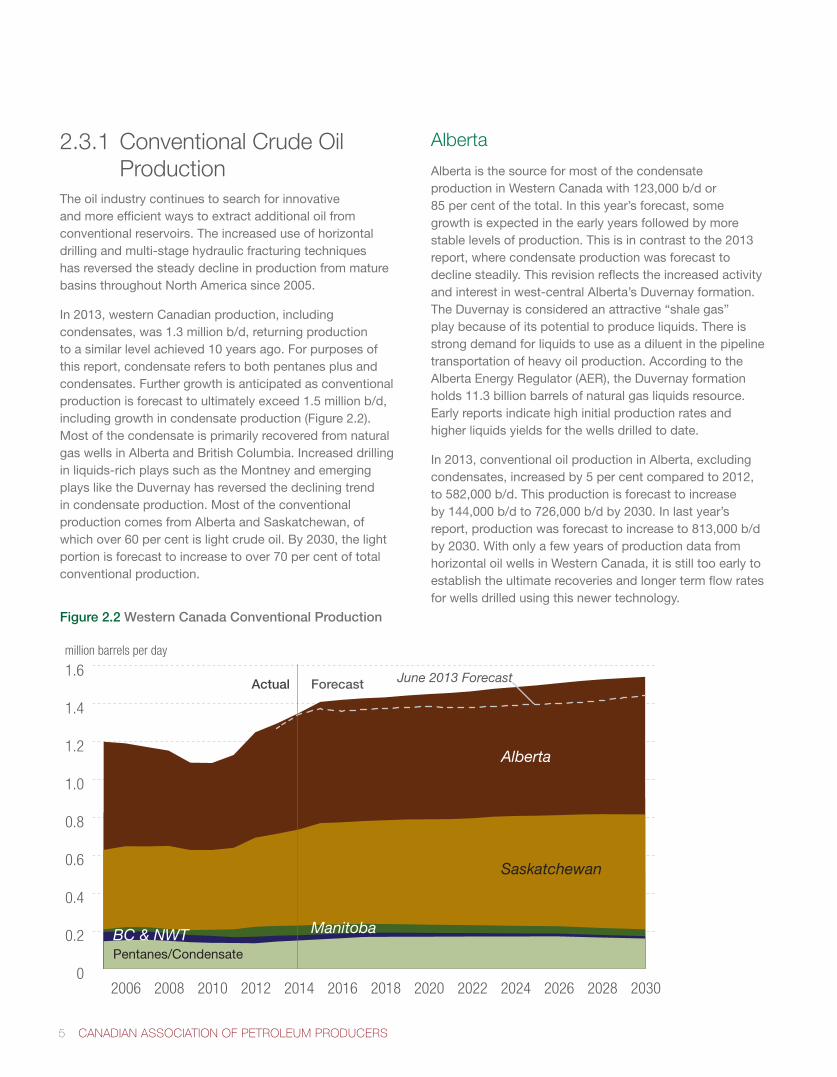
2.3.1 Conventional Crude Oil Production
The oil industry continues to search for innovative and more efficient ways to extract additional oil from conventional reservoirs. The increased use of horizontal drilling and multi-stage hydraulic fracturing techniques has reversed the steady decline in production from mature basinsthroughoutNorthAmericasince2005.
In 2013, western Canadian production, including condensates, was 1.3 million b/d, returning production to a similar level achieved 10 years ago. For purposes of this report, condensate refers to both pentanes plus and condensates. Further growth is anticipated as conventional productionisforecasttoultimatelyexceed1.5millionb/d,including growth in condensate production (Figure 2.2). Most of the condensate is primarily recovered from natural gas wells in Alberta and British Columbia. Increased drilling in liquids-rich plays such as the Montney and emerging plays like the Duvernay has reversed the declining trend in condensate production. Most of the conventional production comes from Alberta and Saskatchewan, of which over 60 per cent is light crude oil. By 2030, the light portionisforecasttoincreasetoover70percentoftotalconventional production.
Alberta
Alberta is the source for most of the condensate production in Western Canada with 123,000 b/d or 85percentofthetotal.Inthisyear’sforecast,somegrowth is expected in the early years followed by more stable levels of production. This is in contrast to the 2013 report, where condensate production was forecast to decline steadily. This revision reflects the increased activity and interest in west-central Alberta’s Duvernay formation. The Duvernay is considered an attractive “shale gas” play because of its potential to produce liquids. There is strong demand for liquids to use as a diluent in the pipeline transportation of heavy oil production. According to the Alberta Energy Regulator (AER), the Duvernay formation holds 11.3 billion barrels of natural gas liquids resource. Early reports indicate high initial production rates and higher liquids yields for the wells drilled to date.
In 2013, conventional oil production in Alberta, excluding condensates,increasedby5percentcomparedto2012,to582,000b/d.Thisproductionisforecasttoincreaseby144,000b/dto726,000b/dby2030.Inlastyear’sreport, production was forecast to increase to 813,000 b/d by 2030. With only a few years of production data from horizontal oil wells in Western Canada, it is still too early to establish the ultimate recoveries and longer term flow rates for wells drilled using this newer technology.
Figure 2.2 Western Canada Conventional Production
0
0.2
0.4
0.6
0.8
1.0
1.2
1.4
1.6
2030202820262024202220202018201620142012201020082006
Pentanes/Condensate
million barrels per day
Actual Forecast
Saskatchewan
ManitobaBC & NWT
Alberta
June 2013 Forecast
Crude Oil Forecast, Markets & Transportation 6
Saskatchewan
Saskatchewan is the second largest oil producing province in Canada and has exhibited exceptionally strong growth in the last two years. Light oil production grew by 12 per cent and 9 per cent in 2012 and 2013 respectively, driven by tight oil play activity. In the next two years growth is expected to be quite strong before growing at a more measured pace for the remainder of the forecast. Saskatchewan’s three main tight oil plays are the Bakken, Shaunavon and Viking.
In 2013, total (light and heavy) Saskatchewan oil production was 486,000 b/d and this is forecast to increase to607,000b/dby2030.Thisisabout118,000b/dhigherthan last year’s forecast and reflects a further refinement to our forecast model, using updated decline rates and drilling trends from CAPP’s survey of Saskatchewan producers.
Manitoba, British Columbia, NWT
Manitoba accounts for 4 per cent of the total conventional production from Western Canada, excluding condensates. Part of the Bakken play underlies a small portion of southwestManitoba.Currentproductionof51,000b/disexpected to decline gradually to 36,000 b/d by 2030.
British Columbia is the second largest provincial source of condensate production, accounting for 14 per cent of total production from Western Canada. With low natural gas prices, the liquids-rich and condensate component of the natural gas production stream has become critical to economic success for some producers. As such, there has been a shift in focus towards drilling in liquids-rich areas within the province’s Montney play. In addition to condensates, the province also accounts for 2 per cent of total western Canadian conventional production.
Very little production currently comes from the Northwest Territories. However, the Canol oil shale formation is estimated to contain between 2 billion and 3 billion barrels of recoverable oil according to the government of the Northwest Territories. Development is still in its very early stages. Companies seeking to develop the Canol note that although the shale play is prolific, its remoteness, distance from markets, lack of infrastructure and inclement weather all pose significant challenges.
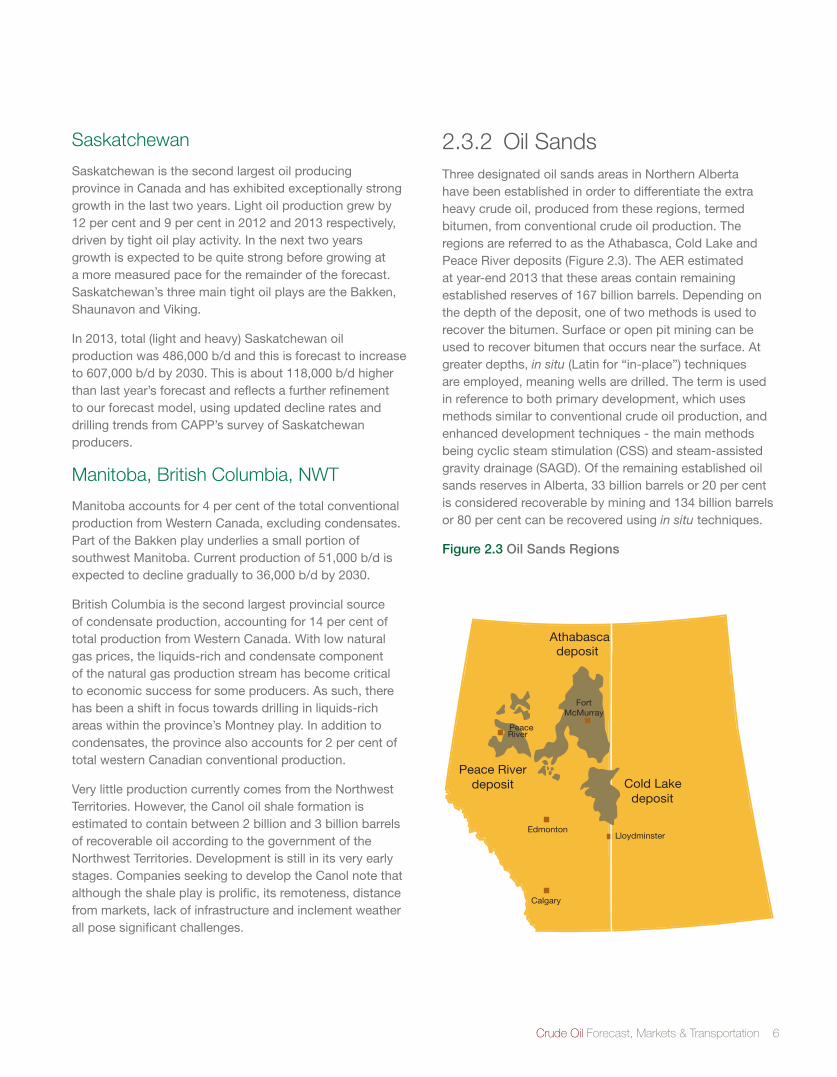
2.3.2 Oil SandsThree designated oil sands areas in Northern Alberta have been established in order to differentiate the extra heavy crude oil, produced from these regions, termed bitumen, from conventional crude oil production. The regions are referred to as the Athabasca, Cold Lake and Peace River deposits (Figure 2.3). The AER estimated at year-end 2013 that these areas contain remaining establishedreservesof167billionbarrels.Dependingonthe depth of the deposit, one of two methods is used to recover the bitumen. Surface or open pit mining can be used to recover bitumen that occurs near the surface. At greater depths, in situ (Latin for “in-place”) techniques are employed, meaning wells are drilled. The term is used in reference to both primary development, which uses methods similar to conventional crude oil production, and enhanced development techniques - the main methods being cyclic steam stimulation (CSS) and steam-assisted gravity drainage (SAGD). Of the remaining established oil sands reserves in Alberta, 33 billion barrels or 20 per cent is considered recoverable by mining and 134 billion barrels or 80 per cent can be recovered using in situ techniques.
Figure 2.3 Oil Sands Regions
Edmonton
Calgary
Lloydminster
Peace River
Fort McMurray
Athabasca deposit
Cold Lake deposit
Peace River deposit
7 CANADIAN ASSOCIATION OF PETROLEUM PRODUCERS
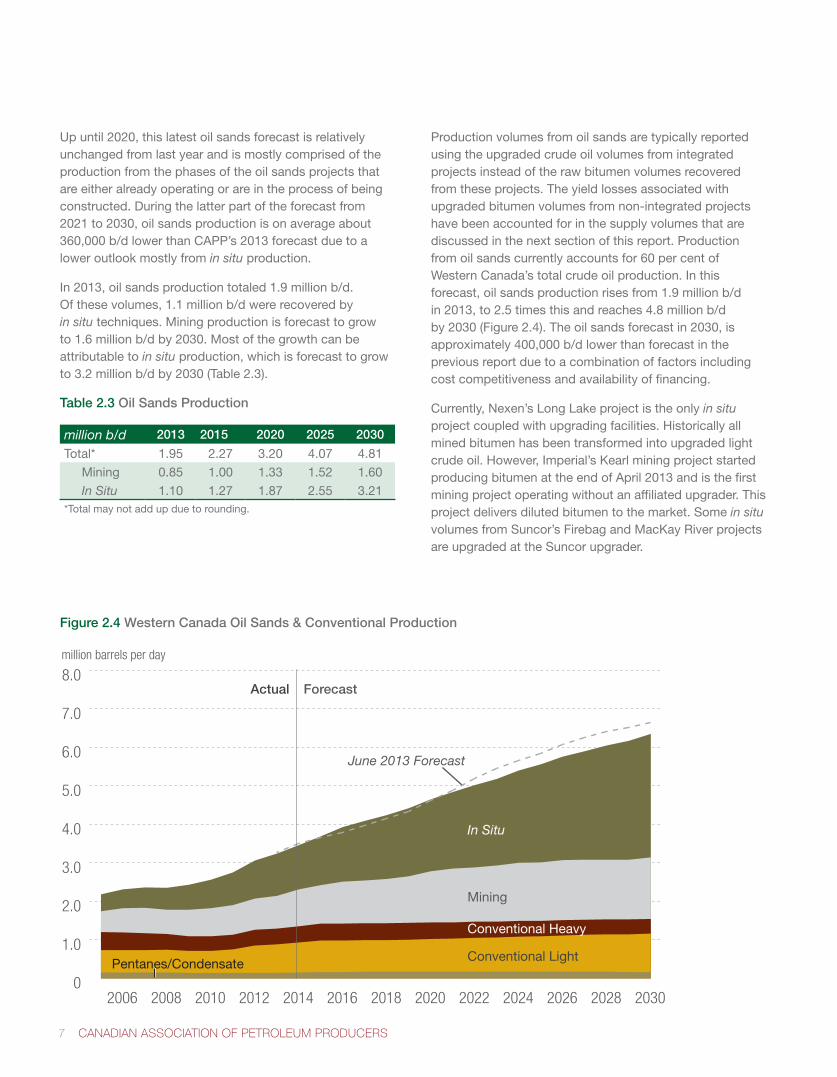
Up until 2020, this latest oil sands forecast is relatively unchanged from last year and is mostly comprised of the production from the phases of the oil sands projects that are either already operating or are in the process of being constructed. During the latter part of the forecast from 2021 to 2030, oil sands production is on average about 360,000 b/d lower than CAPP’s 2013 forecast due to a lower outlook mostly from in situ production.
In 2013, oil sands production totaled 1.9 million b/d. Of these volumes, 1.1 million b/d were recovered by in situ techniques. Mining production is forecast to grow to 1.6 million b/d by 2030. Most of the growth can be attributable to in situ production, which is forecast to grow to 3.2 million b/d by 2030 (Table 2.3).
Table 2.3 Oil Sands Production
million b/d 2013 2015 2020 2025 2030
Total* 1.95 2.27 3.20 4.07 4.81
Mining 0.85 1.00 1.33 1.52 1.60
In Situ 1.10 1.27 1.87 2.55 3.21*Total may not add up due to rounding.
Production volumes from oil sands are typically reported using the upgraded crude oil volumes from integrated projects instead of the raw bitumen volumes recovered from these projects. The yield losses associated with upgraded bitumen volumes from non-integrated projects have been accounted for in the supply volumes that are discussed in the next section of this report. Production from oil sands currently accounts for 60 per cent of Western Canada’s total crude oil production. In this forecast, oil sands production rises from 1.9 million b/d in2013,to2.5timesthisandreaches4.8millionb/dby 2030 (Figure 2.4). The oil sands forecast in 2030, is approximately 400,000 b/d lower than forecast in the previous report due to a combination of factors including cost competitiveness and availability of financing.
Currently, Nexen’s Long Lake project is the only in situ project coupled with upgrading facilities. Historically all mined bitumen has been transformed into upgraded light crude oil. However, Imperial’s Kearl mining project started producing bitumen at the end of April 2013 and is the first mining project operating without an affiliated upgrader. This project delivers diluted bitumen to the market. Some in situ volumes from Suncor’s Firebag and MacKay River projects are upgraded at the Suncor upgrader.
0
1.0
2.0
3.0
4.0
5.0
6.0
7.0
8.0
2030202820262024202220202018201620142012201020082006
Pentanes/Condensate
million barrels per day
Actual Forecast
Conventional Light
June 2013 Forecast
Conventional Heavy
In Situ
Mining
Figure 2.4 Western Canada Oil Sands & Conventional Production
Crude Oil Forecast, Markets & Transportation 8
Existing integrated mining and upgrading projects are listed below:
• SuncorSteepbankandMillenniumMine;
• SyncrudeMildredLakeMineandAuroraMine;
• AthabascaOilSandsProject(AOSP)andShellJackpine Mine; and
• CanadianNaturalHorizonProject
2.4 Western Canadian Crude Oil Supply
Some volumes of raw bitumen are being transported to market by rail. However, the composition of the various crude types available in the market typically differs from crude oil at the production level. Both conventional heavy crude oil and bitumen from the oil sands are either upgraded or blended in order to be transported on pipelines or to meet optimal refinery specifications. In addition, some volumes of light crude oil may also be used for blending. In any event, it is this crude oil supply that is available after upgrading and blending that is more relevant to market observers because it is these volumes that are ultimately delivered to the end-use markets.
In this report, CAPP categorizes the various crude oil types that comprise western Canadian crude oil supply into the following main categories: Conventional Light, Conventional Heavy, Upgraded Light and Oil Sands Heavy. Oil Sands Heavy includes upgraded heavy sour crude oil, bitumen diluted with upgraded light crude oil (also known as “SynBit”) and bitumen diluted with condensate (also known as “DilBit”). Blending for DilBit differs by project butrequiresapproximatelya70:30bitumentocondensateratio while the blending ratio for SynBit is approximately 50:50.Bitumenvolumescurrentlybeingtransportedbyrail are relatively minor; however, these volumes would require less diluent for blending versus moving by pipeline or may even be transported as raw bitumen (also known as “RailBit”).
In2013,about1.1millionb/dor55percentofthetotalbitumen produced in Canada was upgraded, including volumes of bitumen that were processed at the Suncor refinery in Edmonton. This refinery intake was included since it can process oil sands feedstock.
Upgradedvolumesareforecasttoriseto1.5millionb/dby 2030. The five bitumen upgraders located in Alberta produce a variety of upgraded products. Suncor produces light sweet crude and medium sour crudes, including diesel; Syncrude, Canadian Natural Horizon, and Nexen Long Lake produce light sweet synthetic crude; and Shell produces an intermediate refinery feedstock for the Shell Scotford refinery, as well as sweet and heavy synthetic crude.
Canada’s upgrading capacity is not expected to rise commensurately with bitumen production growth due to a number of economic challenges. These include the high capital costs incurred with building an upgrader and the need for a sustained differential between light and heavy crudeoilofatleast$25perbarrel.Itisdifficultforanewupgrader to compete with the option of transporting heavy crude oil to existing refineries located throughout North America with spare coking capacity that are able to refine such heavy crudes.
If it is not upgraded, bitumen is so viscous at its production stage that it needs to be diluted with a lighter hydrocarbon or diluent to create a type of crude that meets pipeline specificationsfordensityandviscosity.Bitumenat10°Celsius has the consistency of a hockey puck. Less diluent is required when bitumen is moved by rail where it is transported in heated rail tank cars that lower the viscosity of the bitumen. The main source of diluent is condensate that is recovered from processing natural gas in Western Canada. This source of condensate is forecast to grow slightly but will be insufficient to meet the needs of growing bitumen production that currently already exceed the available supply.
In 2013, almost 300,000 b/d of imported condensates, diluents from upgraders, as well as quantities of butane were needed to supplement the condensate supply from indigenous natural gas wells. CAPP’s forecast is not constrained by the availability of condensate imports as new sources of condensate are assumed to be available to meetmarketrequirements.RefertoSection4.7fordetailson existing and proposed diluent import pipeline projects. The potential for bitumen to travel by rail with reduced diluent requirement has not been factored into the analysis of condensate demand. To the extent rail becomes a more significant delivery system the reduction in the estimated need for diluent through the use of this transportation option will be reflected in future survey results and in turn, be incorporated in CAPP’s future forecasts.
9 CANADIAN ASSOCIATION OF PETROLEUM PRODUCERS
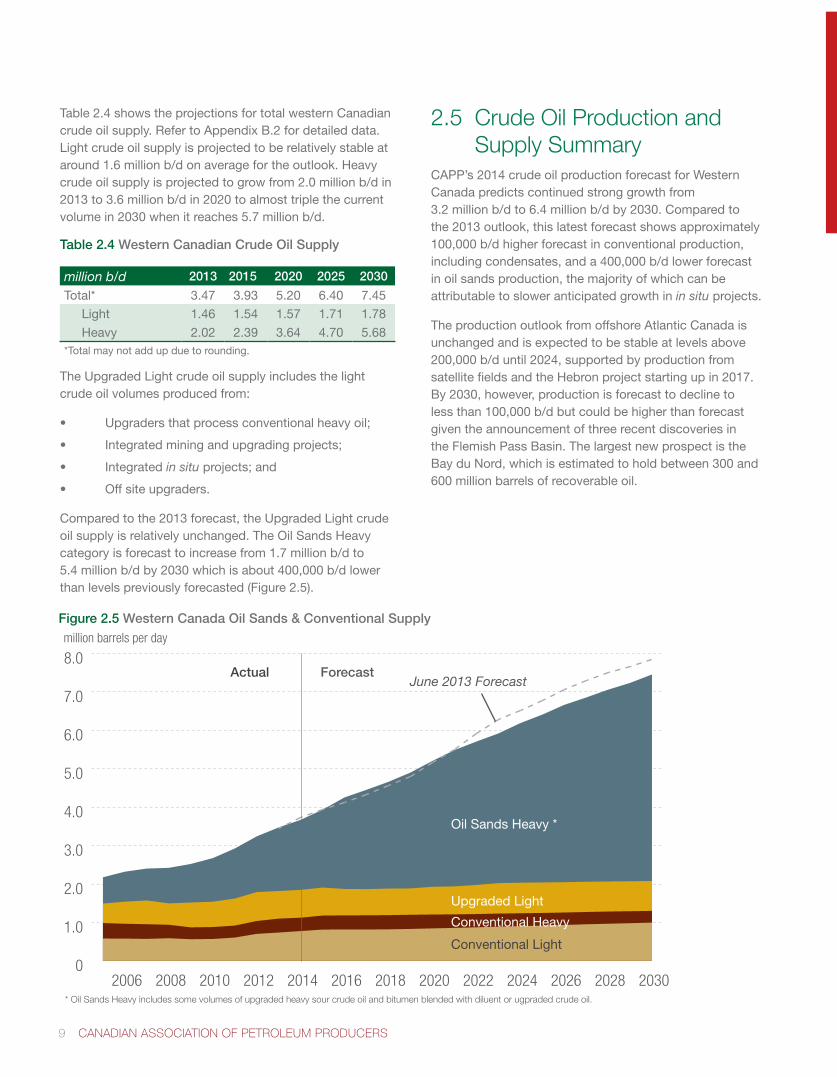
Table 2.4 shows the projections for total western Canadian crude oil supply. Refer to Appendix B.2 for detailed data. Light crude oil supply is projected to be relatively stable at around 1.6 million b/d on average for the outlook. Heavy crude oil supply is projected to grow from 2.0 million b/d in 2013 to 3.6 million b/d in 2020 to almost triple the current volumein2030whenitreaches5.7millionb/d.
Table 2.4 Western Canadian Crude Oil Supply
million b/d 2013 2015 2020 2025 2030
Total* 3.47 3.93 5.20 6.40 7.45
Light 1.46 1.54 1.57 1.71 1.78
Heavy 2.02 2.39 3.64 4.70 5.68*Total may not add up due to rounding.
The Upgraded Light crude oil supply includes the light crude oil volumes produced from:
• Upgradersthatprocessconventionalheavyoil;
• Integratedminingandupgradingprojects;
• Integratedin situ projects; and
• Offsiteupgraders.
Compared to the 2013 forecast, the Upgraded Light crude oil supply is relatively unchanged. The Oil Sands Heavy categoryisforecasttoincreasefrom1.7millionb/dto5.4millionb/dby2030whichisabout400,000b/dlowerthanlevelspreviouslyforecasted(Figure2.5).
2.5 Crude Oil Production and Supply Summary
CAPP’s 2014 crude oil production forecast for Western Canada predicts continued strong growth from 3.2 million b/d to 6.4 million b/d by 2030. Compared to the 2013 outlook, this latest forecast shows approximately 100,000 b/d higher forecast in conventional production, including condensates, and a 400,000 b/d lower forecast in oil sands production, the majority of which can be attributable to slower anticipated growth in in situ projects.
The production outlook from offshore Atlantic Canada is unchanged and is expected to be stable at levels above 200,000 b/d until 2024, supported by production from satellitefieldsandtheHebronprojectstartingupin2017.By 2030, however, production is forecast to decline to less than 100,000 b/d but could be higher than forecast given the announcement of three recent discoveries in the Flemish Pass Basin. The largest new prospect is the Bay du Nord, which is estimated to hold between 300 and 600 million barrels of recoverable oil.
0
1.0
2.0
3.0
4.0
5.0
6.0
7.0
8.0
2030202820262024202220202018201620142012201020082006
Conventional Heavy
million barrels per day
Actual Forecast
Conventional Light
June 2013 Forecast
Conventional Heavy
Oil Sands Heavy *
Upgraded Light
* Oil Sands Heavy includes some volumes of upgraded heavy sour crude oil and bitumen blended with diluent or ugpraded crude oil.
Figure 2.5 Western Canada Oil Sands & Conventional Supply
Crude Oil Forecast, Markets & Transportation 10
AB, BC, SK[551]
CA [1,619]
PADD V - excl CA [720]
PADD IV [580]
PADD III - Gulf Coast[7,953]
PADD II - North (ND, SD, MN, WI)
[446]
PADD II - South (KS, OK) [779] PADD II - East
(MI, IL, IN, OH, KY, TN) [2,181]
PADD I - East Coast [1,038]
[2013 total re�nery demand] in 000s b/d
Sources: CAPP, CA Energy Commission, EIA, Statistics Canada
ON [380]
QC+ Atlantic Canada [685]
thousand barrels per day
U.S. - Alaska only
U.S. (excl Alaska)
Other Imports
A. Canada
W. Canada
3
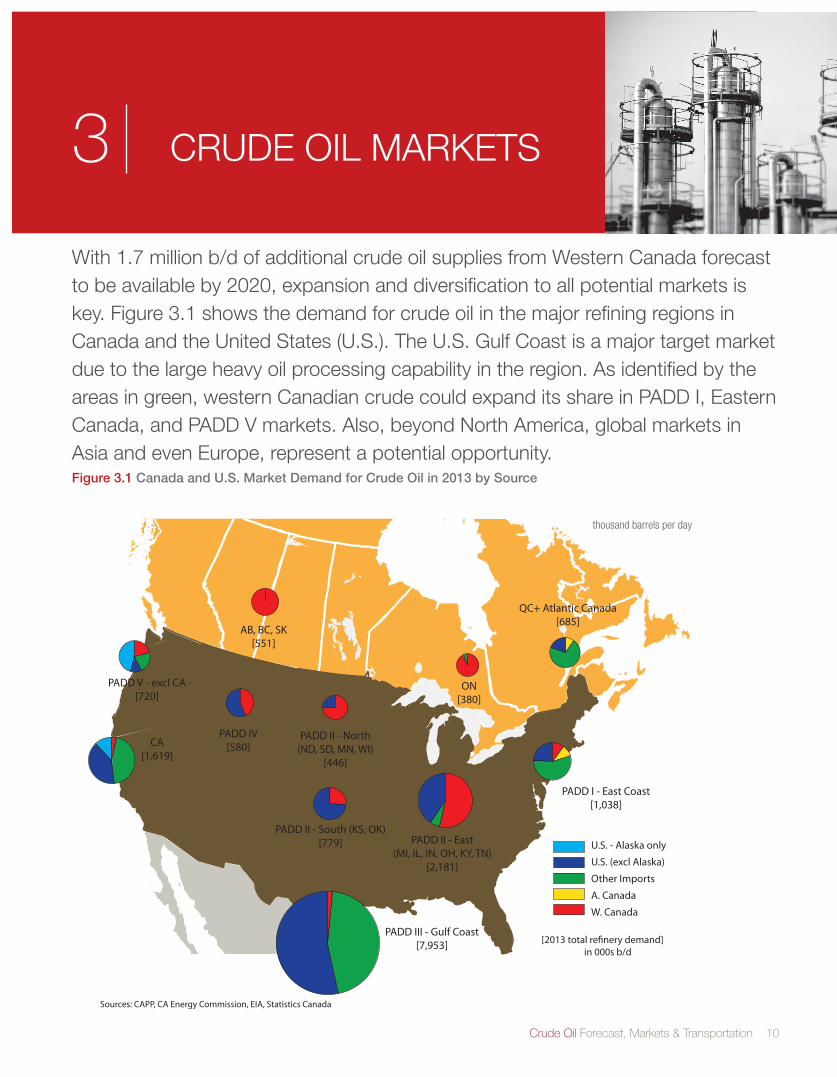
With 1.7 million b/d of additional crude oil supplies from Western Canada forecast to be available by 2020, expansion and diversification to all potential markets is key. Figure 3.1 shows the demand for crude oil in the major refining regions in Canada and the United States (U.S.). The U.S. Gulf Coast is a major target market due to the large heavy oil processing capability in the region. As identified by the areas in green, western Canadian crude could expand its share in PADD I, Eastern Canada, and PADD V markets. Also, beyond North America, global markets in Asia and even Europe, represent a potential opportunity.
CRUDE OIL MARKETS
Figure 3.1 Canada and U.S. Market Demand for Crude Oil in 2013 by Source
11 CANADIAN ASSOCIATION OF PETROLEUM PRODUCERS
PADD 2E
PADD 2N&2S
PADD ICA (PADD V)
WA (PADD V)
E. Canada*
W. CanadaNon-US83 [unknown]
Supply
2013 - 3,4722020 - 5,173
PADD IV
Sources: CAPP, EIA, NEB, Statistics Canada
* E.Canada demand for W. Canadian crude oil in 2013 consisted almost entirely of receipts from Ontario. Projected receipts in 2020 include growth from Québec and Atlantic provinces.
Note: 2013 demand does not equal available supply due to factors such as inventory adjustment and data discrepancies in information collection.
0
500
1,000
1,500
2,000
2,500
0325650975
1300
0300600900
1,200
0325650
0300600900
1,2001,5001,8002,100
0
500
1,000
1,500
2,000
2,500
6791,232
1,372
1,371
6372,117
0350700
0325650975
1,300
2014 Total Refining Capacity
643
9,446
2,5210325650
PADD III
2013 Demand 2020 Demand
thousand barrels per day
2013 Cdn Exports:U.S. - 2,408Other - 83
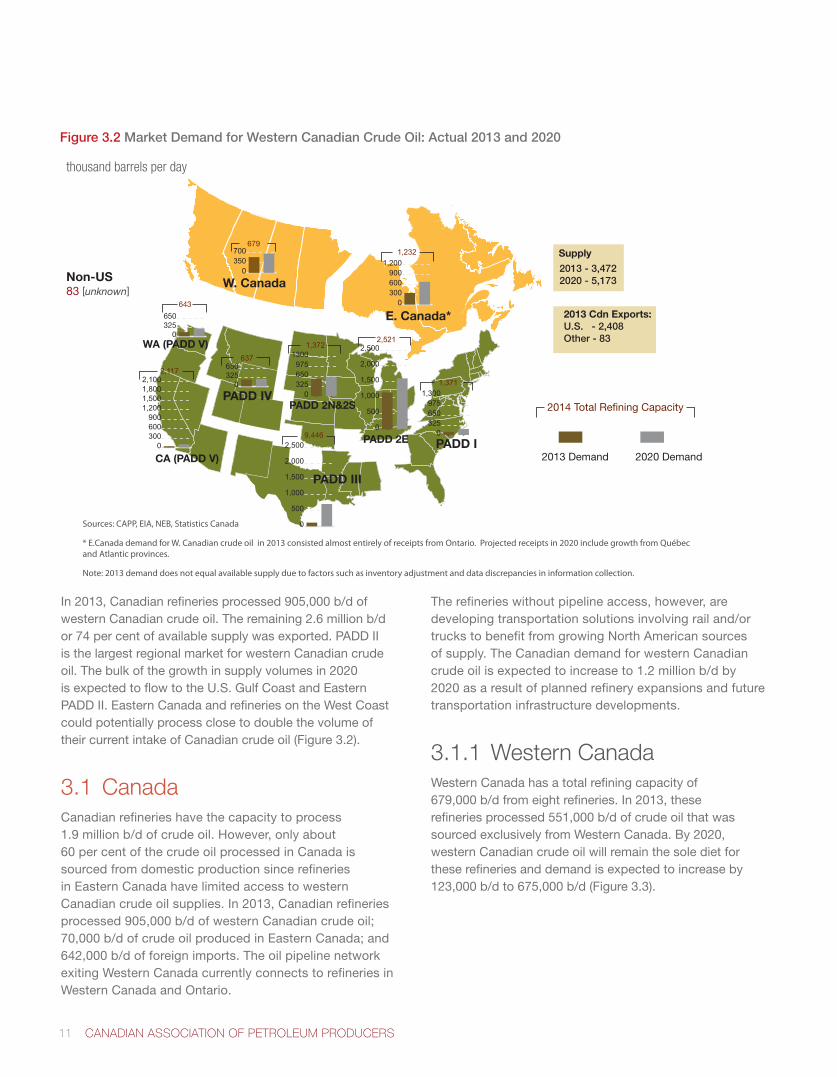
In2013,Canadianrefineriesprocessed905,000b/dofwestern Canadian crude oil. The remaining 2.6 million b/d or74percentofavailablesupplywasexported.PADDIIis the largest regional market for western Canadian crude oil. The bulk of the growth in supply volumes in 2020 is expected to flow to the U.S. Gulf Coast and Eastern PADD II. Eastern Canada and refineries on the West Coast could potentially process close to double the volume of their current intake of Canadian crude oil (Figure 3.2).
3.1 CanadaCanadian refineries have the capacity to process 1.9 million b/d of crude oil. However, only about 60 per cent of the crude oil processed in Canada is sourced from domestic production since refineries in Eastern Canada have limited access to western Canadian crude oil supplies. In 2013, Canadian refineries processed905,000b/dofwesternCanadiancrudeoil;70,000b/dofcrudeoilproducedinEasternCanada;and642,000 b/d of foreign imports. The oil pipeline network exiting Western Canada currently connects to refineries in Western Canada and Ontario.
The refineries without pipeline access, however, are developing transportation solutions involving rail and/or trucks to benefit from growing North American sources of supply. The Canadian demand for western Canadian crude oil is expected to increase to 1.2 million b/d by 2020 as a result of planned refinery expansions and future transportation infrastructure developments.
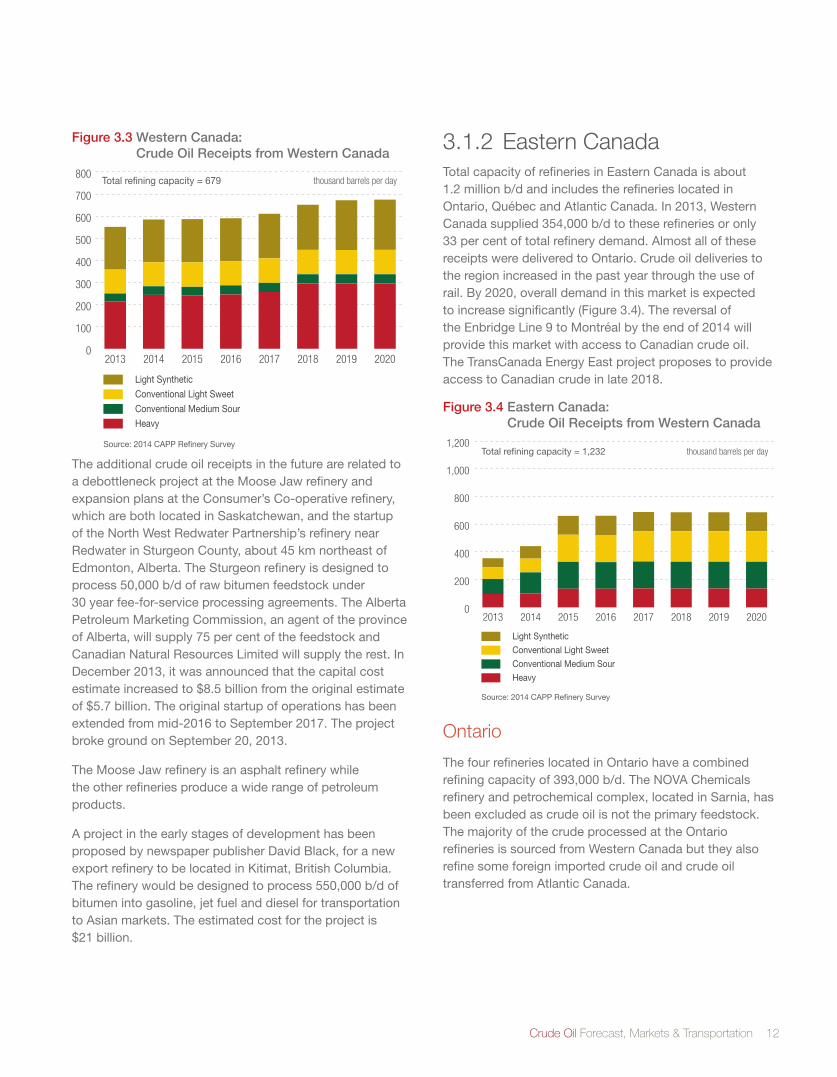
3.1.1 Western Canada Western Canada has a total refining capacity of 679,000b/dfromeightrefineries.In2013,theserefineriesprocessed551,000b/dofcrudeoilthatwassourced exclusively from Western Canada. By 2020, western Canadian crude oil will remain the sole diet for these refineries and demand is expected to increase by 123,000b/dto675,000b/d(Figure3.3).
Figure 3.2 Market Demand for Western Canadian Crude Oil: Actual 2013 and 2020
Crude Oil Forecast, Markets & Transportation 12
Figure 3.3 Western Canada: Crude Oil Receipts from Western Canada
Source: 2014 CAPP Refinery Survey
0
100
200
300
400
500
600
700
800
Light Synthetic
Conventional Light Sweet
Conventional Medium Sour
Heavy
20202019201820172016201520142013
Total refining capacity = 679 thousand barrels per day
The additional crude oil receipts in the future are related to a debottleneck project at the Moose Jaw refinery and expansion plans at the Consumer’s Co-operative refinery, which are both located in Saskatchewan, and the startup of the North West Redwater Partnership’s refinery near RedwaterinSturgeonCounty,about45kmnortheastofEdmonton, Alberta. The Sturgeon refinery is designed to process50,000b/dofrawbitumenfeedstockunder30 year fee-for-service processing agreements. The Alberta Petroleum Marketing Commission, an agent of the province ofAlberta,willsupply75percentofthefeedstockandCanadian Natural Resources Limited will supply the rest. In December 2013, it was announced that the capital cost estimateincreasedto$8.5billionfromtheoriginalestimateof$5.7billion.Theoriginalstartupofoperationshasbeenextendedfrommid-2016toSeptember2017.Theprojectbroke ground on September 20, 2013.
The Moose Jaw refinery is an asphalt refinery while the other refineries produce a wide range of petroleum products.
A project in the early stages of development has been proposed by newspaper publisher David Black, for a new export refinery to be located in Kitimat, British Columbia. Therefinerywouldbedesignedtoprocess550,000b/dofbitumen into gasoline, jet fuel and diesel for transportation to Asian markets. The estimated cost for the project is $21 billion.
3.1.2 Eastern CanadaTotal capacity of refineries in Eastern Canada is about 1.2 million b/d and includes the refineries located in Ontario, Québec and Atlantic Canada. In 2013, Western Canadasupplied354,000b/dtotheserefineriesoronly33 per cent of total refinery demand. Almost all of these receipts were delivered to Ontario. Crude oil deliveries to the region increased in the past year through the use of rail. By 2020, overall demand in this market is expected to increase significantly (Figure 3.4). The reversal of the Enbridge Line 9 to Montréal by the end of 2014 will provide this market with access to Canadian crude oil. The TransCanada Energy East project proposes to provide access to Canadian crude in late 2018.
Figure 3.4 Eastern Canada: Crude Oil Receipts from Western Canada
Source: 2014 CAPP Refinery Survey
0
200
400
600
800
1,000
1,200
Light Synthetic
Conventional Light Sweet
Conventional Medium Sour
Heavy
20202019201820172016201520142013
Total refining capacity = 1,232 thousand barrels per day
Ontario
The four refineries located in Ontario have a combined refining capacity of 393,000 b/d. The NOVA Chemicals refinery and petrochemical complex, located in Sarnia, has been excluded as crude oil is not the primary feedstock. The majority of the crude processed at the Ontario refineries is sourced from Western Canada but they also refine some foreign imported crude oil and crude oil transferred from Atlantic Canada.
13 CANADIAN ASSOCIATION OF PETROLEUM PRODUCERS
Since August 2013, with the first phase of the Enbridge Line 9 re-reversal in operation, crude oil can flow east from Sarnia to North Westover, Ontario and can provide light crude oil to Imperial’s refinery in Nanticoke, Ontario. Refer to Section 4.6 for details on oil pipelines to Eastern Canada. Ultimately, all refineries in the region will have access to a variety of sources and will select their feedstock based on availability and price.
According to data from the NEB and Statistics Canada, Ontario refineries processed 380,300 b/d of crude oil in 2013. A further breakdown of these supplies shows 356,700b/d(94percent)fromdomesticsources;withthe remainder comprised of imports from Norway, United Kingdom, Nigeria, Algeria and Mexico.
Québec & Atlantic Provinces
There are two refineries in Québec that have a combined capacity of 402,000 b/d. With the closure of Imperial’s refinery in Halifax in June 2013, two refineries remain in operation in Atlantic Canada and they have a combined capacityof435,000b/d.Thecrudeoilprocessedattheserefineries generally originates from either Atlantic Canada or foreign sources. Both regions are expected to ramp up receipts of crude oil deliveries from Western Canada that began in recent years. The refineries are configured to process mostly light crude oil but future demand for heavy crude oil could increase if the refineries decided to invest in capital upgrades to enable processing heavier crude types. Suncor continues to assess the feasibility of building a coker at its Montréal refinery.
Once Enbridge’s complete Line 9 re-reversal is in service, western Canadian crude oil could be transported by pipeline all the way to Montréal. Refineries in these provinces would have access to the growing light oil production from both Western Canada and the U.S. Bakken in Montana and North Dakota. Once crude oil reaches Montréal, companies could barge oil from there to Québec City, and potentially ship it by rail to the Irving refinery in Saint John, New Brunswick. By the end of 2018, if TransCanada’s Energy East pipeline project proceeds, there will be pipeline access all the way from Western Canada to Saint John.
3.2 United StatesCanada is the top foreign supplier of crude oil to the U.S. and is likely to remain as such for the foreseeable future. In 2013, almost all of Western Canada’s crude oil exports were to the U.S. Despite rising U.S. domestic production driven by drilling in the shale and tight oil plays in the Eagle Ford in Texas and Bakken in North Dakota, U.S. imports fromCanadagrewby158,000b/dor7percentversus2012. Total U.S. imports of crude oil declined by 808,000 b/d or 9 per cent in 2013, mainly as a result of the displacement of foreign (non-Canadian) imports of light crude oil with domestic light supply. Growing western Canadian crude oil supplies are predominately heavy crude oil, therefore, the U.S. Gulf Coast refineries, with their substantial heavy oil processing capabilities, remain a key target market.
TheU.S.DepartmentofEnergydividesthe50statesintofive market regions termed the Petroleum Administration of Defense Districts or PADDs. These PADDs were originally created during World War II to help allocate fuels derived from petroleum products. Today, this delineation continues to be used when reporting data to describe the U.S. market regions.
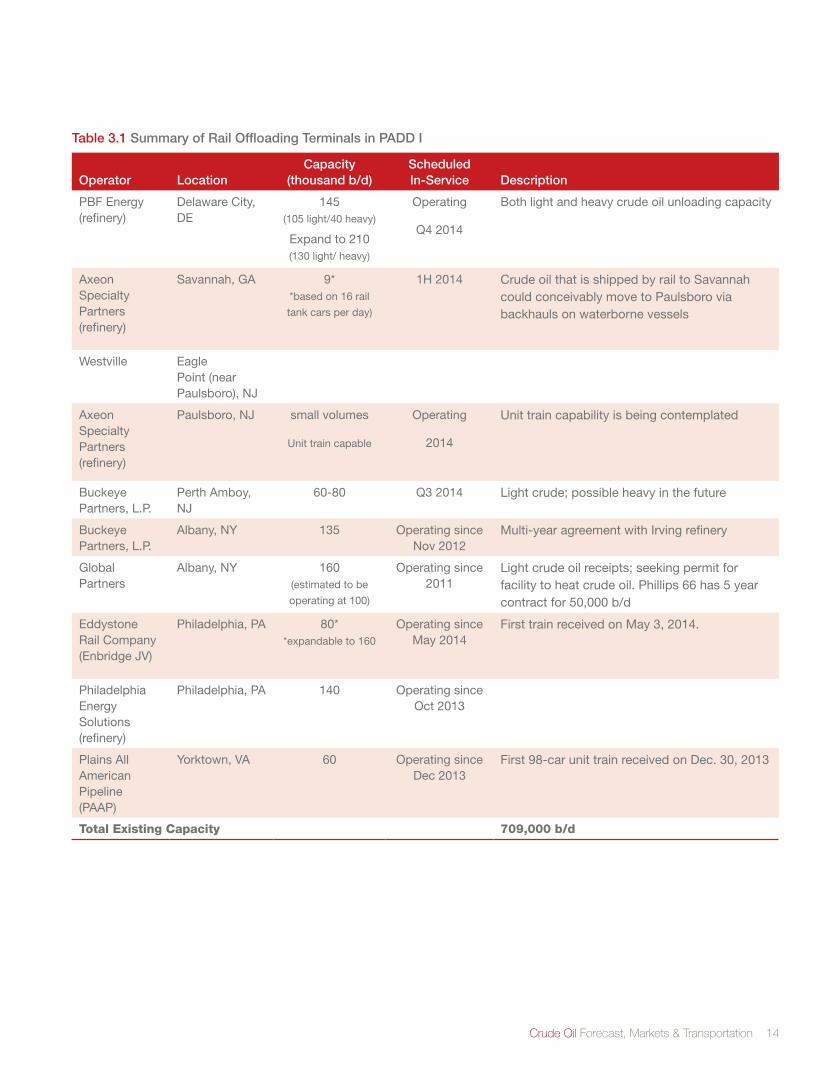
3.2.1 PADD I (East Coast)The refining capacity in the US East Coast currently totals 1.4 million b/d. The 10 refineries that form this capacity are located in the states of Delaware, Georgia, New Jersey, Pennsylvania, and West Virginia.
In 2013, total refinery input increased by 13 per cent compared to 2012 with the first full year return to operations of previously idled refineries. Imports of foreign crudeoilbyrefineriesinPADDItotaled784,000b/d,whichis significantly lower than in 2012 due to a displacement of foreign imports with growing domestic supplies. The domestic portion of the feedstock slate increased from only 60,000b/dto254,000b/d.Thisisanincreaseof194,000 b/d or 322 per cent year over year.
Historically, the refineries on the East Coast have been supplied by waterborne crude oil delivered from the U.S. Gulf Coast and internationally sourced crude oil. However, with development of new rail unloading facilities, these refineries have growing access to Bakken crude oil produced in North Dakota. Phillips 66 and PBF have signed transportation agreements for the provision of Bakken crude supplies to their refineries located on the East Coast.
Crude Oil Forecast, Markets & Transportation 14
Table 3.1 Summary of Rail Offloading Terminals in PADD I
Operator LocationCapacity
(thousand b/d)Scheduled In-Service Description
PBF Energy (refinery)
Delaware City, DE
145(105light/40heavy)
Expand to 210 (130 light/ heavy)
Operating
Q4 2014
Both light and heavy crude oil unloading capacity
Axeon Specialty Partners (refinery)
Savannah, GA 9**based on 16 rail
tank cars per day)
1H 2014 Crude oil that is shipped by rail to Savannah could conceivably move to Paulsboro via backhauls on waterborne vessels
Westville Eagle Point (near Paulsboro), NJ
Axeon Specialty Partners (refinery)
Paulsboro, NJ small volumes
Unit train capable
Operating
2014
Unit train capability is being contemplated
Buckeye Partners, L.P.
Perth Amboy, NJ
60-80 Q3 2014 Light crude; possible heavy in the future
Buckeye Partners, L.P.
Albany, NY 135 Operating since Nov 2012
Multi-year agreement with Irving refinery
Global Partners
Albany, NY 160 (estimated to be
operating at 100)
Operating since 2011
Light crude oil receipts; seeking permit for facilitytoheatcrudeoil.Phillips66has5yearcontractfor50,000b/d
Eddystone Rail Company (Enbridge JV)
Philadelphia, PA 80**expandable to 160
Operating since May 2014
First train received on May 3, 2014.
Philadelphia Energy Solutions (refinery)
Philadelphia, PA 140 Operating since Oct 2013
Plains All American Pipeline (PAAP)
Yorktown, VA 60 Operating since Dec 2013
First 98-car unit train received on Dec. 30, 2013
Total Existing Capacity 709,000 b/d
15 CANADIAN ASSOCIATION OF PETROLEUM PRODUCERS
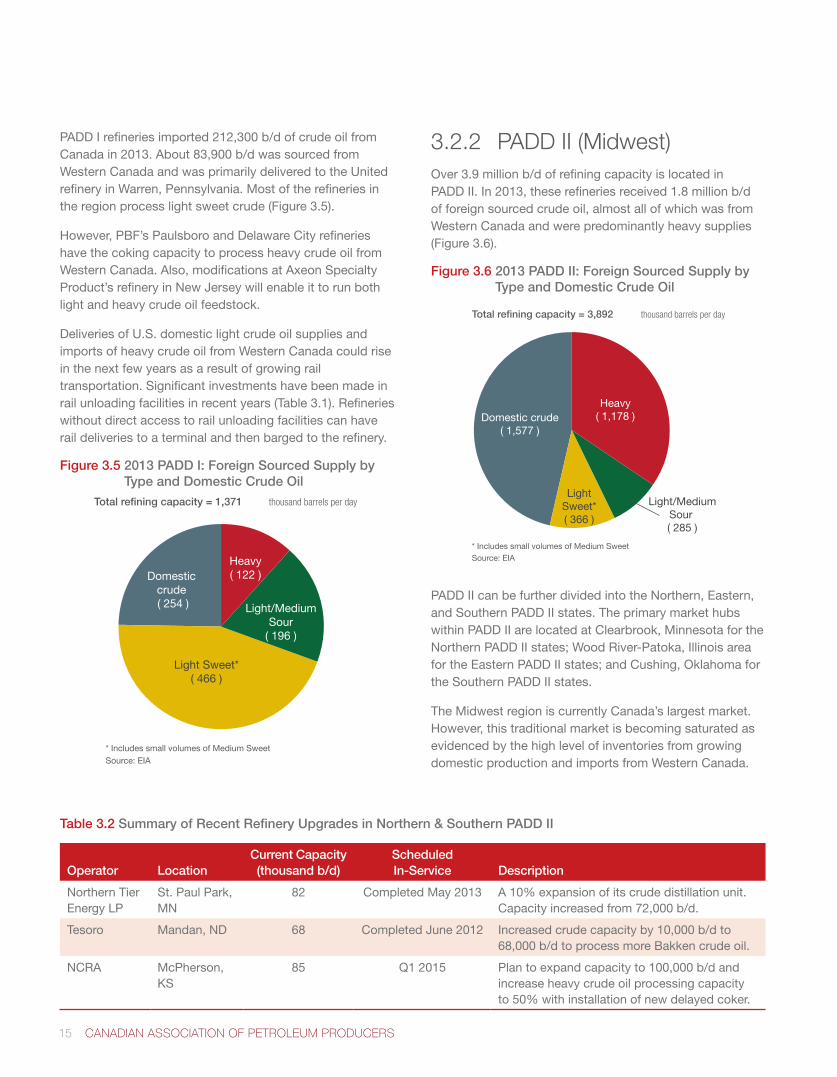
PADD I refineries imported 212,300 b/d of crude oil from Canada in 2013. About 83,900 b/d was sourced from Western Canada and was primarily delivered to the United refinery in Warren, Pennsylvania. Most of the refineries in theregionprocesslightsweetcrude(Figure3.5).
However, PBF’s Paulsboro and Delaware City refineries have the coking capacity to process heavy crude oil from Western Canada. Also, modifications at Axeon Specialty Product’s refinery in New Jersey will enable it to run both light and heavy crude oil feedstock.
Deliveries of U.S. domestic light crude oil supplies and imports of heavy crude oil from Western Canada could rise in the next few years as a result of growing rail transportation. Significant investments have been made in rail unloading facilities in recent years (Table 3.1). Refineries without direct access to rail unloading facilities can have rail deliveries to a terminal and then barged to the refinery.
Figure 3.5 2013 PADD I: Foreign Sourced Supply by Type and Domestic Crude Oil
Domestic crude ( 254 )
Light Sweet*( 466 )
Light/MediumSour
( 196 )
Heavy( 122 )
Total refining capacity = 1,371 thousand barrels per day
* Includes small volumes of Medium SweetSource: EIA
3.2.2 PADD II (Midwest)Over 3.9 million b/d of refining capacity is located in PADD II. In 2013, these refineries received 1.8 million b/d of foreign sourced crude oil, almost all of which was from Western Canada and were predominantly heavy supplies (Figure 3.6).
Figure 3.6 2013 PADD II: Foreign Sourced Supply by Type and Domestic Crude Oil
Domestic crude( 1,577 )
LightSweet*( 366 )
Light/MediumSour ( 285 )
Heavy( 1,178 )
Total refining capacity = 3,892 thousand barrels per day
* Includes small volumes of Medium SweetSource: EIA
PADD II can be further divided into the Northern, Eastern, and Southern PADD II states. The primary market hubs within PADD II are located at Clearbrook, Minnesota for the Northern PADD II states; Wood River-Patoka, Illinois area for the Eastern PADD II states; and Cushing, Oklahoma for the Southern PADD II states.
The Midwest region is currently Canada’s largest market. However, this traditional market is becoming saturated as evidenced by the high level of inventories from growing domestic production and imports from Western Canada.
Table 3.2 Summary of Recent Refinery Upgrades in Northern & Southern PADD II
Operator LocationCurrent Capacity (thousand b/d)
Scheduled In-Service Description
Northern Tier Energy LP
St. Paul Park, MN
82 Completed May 2013 A10%expansionofitscrudedistillationunit.Capacityincreasedfrom72,000b/d.
Tesoro Mandan, ND 68 Completed June 2012 Increased crude capacity by 10,000 b/d to 68,000 b/d to process more Bakken crude oil.
NCRA McPherson, KS
85 Q12015 Plan to expand capacity to 100,000 b/d and increase heavy crude oil processing capacity to50%withinstallationofnewdelayedcoker.
Crude Oil Forecast, Markets & Transportation 16
Northern and Southern PADD II
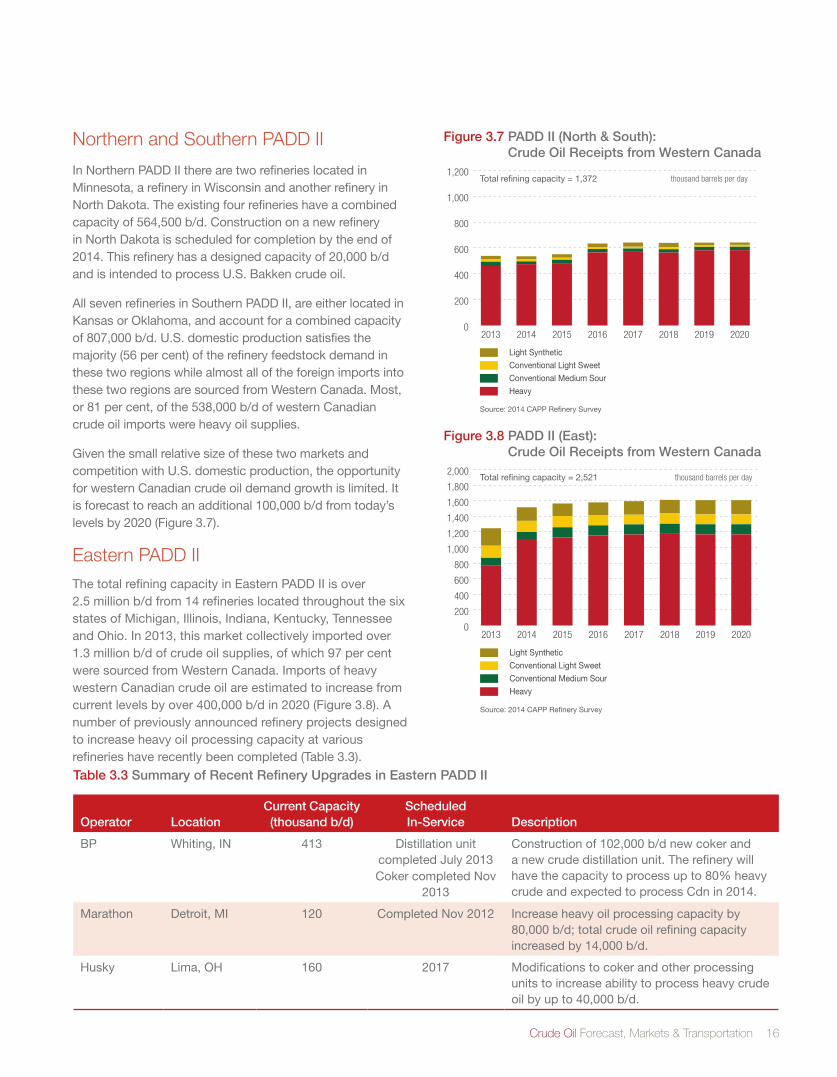
In Northern PADD II there are two refineries located in Minnesota, a refinery in Wisconsin and another refinery in North Dakota. The existing four refineries have a combined capacityof564,500b/d.Constructiononanewrefineryin North Dakota is scheduled for completion by the end of 2014. This refinery has a designed capacity of 20,000 b/d and is intended to process U.S. Bakken crude oil.
All seven refineries in Southern PADD II, are either located in Kansas or Oklahoma, and account for a combined capacity of807,000b/d.U.S.domesticproductionsatisfiesthemajority(56percent)oftherefineryfeedstockdemandinthese two regions while almost all of the foreign imports into these two regions are sourced from Western Canada. Most, or81percent,ofthe538,000b/dofwesternCanadiancrude oil imports were heavy oil supplies.
Given the small relative size of these two markets and competition with U.S. domestic production, the opportunity for western Canadian crude oil demand growth is limited. It is forecast to reach an additional 100,000 b/d from today’s levelsby2020(Figure3.7).
Eastern PADD IIThe total refining capacity in Eastern PADD II is over 2.5millionb/dfrom14refinerieslocatedthroughoutthesixstates of Michigan, Illinois, Indiana, Kentucky, Tennessee and Ohio. In 2013, this market collectively imported over 1.3millionb/dofcrudeoilsupplies,ofwhich97percentwere sourced from Western Canada. Imports of heavy western Canadian crude oil are estimated to increase from current levels by over 400,000 b/d in 2020 (Figure 3.8). A number of previously announced refinery projects designed to increase heavy oil processing capacity at various refineries have recently been completed (Table 3.3).
Figure 3.7 PADD II (North & South): Crude Oil Receipts from Western Canada
Source: 2014 CAPP Refinery Survey
0
200
400
600
800
1,000
1,200
Light Synthetic
Conventional Light Sweet
Conventional Medium Sour
Heavy
20202019201820172016201520142013
Total refining capacity = 1,372 thousand barrels per day
Figure 3.8 PADD II (East): Crude Oil Receipts from Western Canada
Source: 2014 CAPP Refinery Survey
0
200
400
600
800
1,000
1,200
1,400
1,600
1,800
2,000
Light Synthetic
Conventional Light Sweet
Conventional Medium Sour
Heavy
20202019201820172016201520142013
Total refining capacity = 2,521 thousand barrels per day
Table 3.3 Summary of Recent Refinery Upgrades in Eastern PADD II
Operator LocationCurrent Capacity (thousand b/d)
Scheduled In-Service Description
BP Whiting, IN 413 Distillation unit completed July 2013Coker completed Nov
2013
Construction of 102,000 b/d new coker and a new crude distillation unit. The refinery will havethecapacitytoprocessupto80%heavycrude and expected to process Cdn in 2014.
Marathon Detroit, MI 120 Completed Nov 2012 Increase heavy oil processing capacity by 80,000 b/d; total crude oil refining capacity increased by 14,000 b/d.
Husky Lima, OH 160 2017 Modifications to coker and other processing units to increase ability to process heavy crude oil by up to 40,000 b/d.
17 CANADIAN ASSOCIATION OF PETROLEUM PRODUCERS
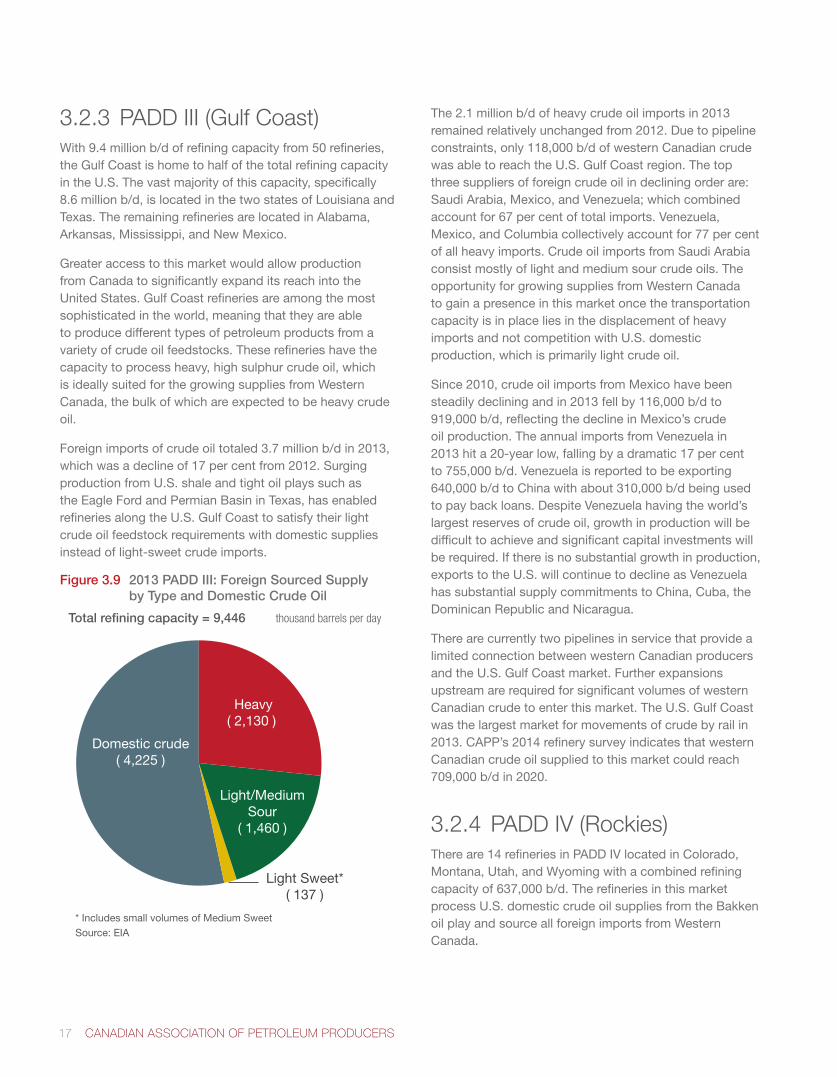
3.2.3 PADD III (Gulf Coast)With9.4millionb/dofrefiningcapacityfrom50refineries,the Gulf Coast is home to half of the total refining capacity in the U.S. The vast majority of this capacity, specifically 8.6 million b/d, is located in the two states of Louisiana and Texas. The remaining refineries are located in Alabama, Arkansas, Mississippi, and New Mexico.
Greater access to this market would allow production from Canada to significantly expand its reach into the United States. Gulf Coast refineries are among the most sophisticated in the world, meaning that they are able to produce different types of petroleum products from a variety of crude oil feedstocks. These refineries have the capacity to process heavy, high sulphur crude oil, which is ideally suited for the growing supplies from Western Canada, the bulk of which are expected to be heavy crude oil.
Foreignimportsofcrudeoiltotaled3.7millionb/din2013,whichwasadeclineof17percentfrom2012.Surgingproduction from U.S. shale and tight oil plays such as the Eagle Ford and Permian Basin in Texas, has enabled refineries along the U.S. Gulf Coast to satisfy their light crude oil feedstock requirements with domestic supplies instead of light-sweet crude imports.
Figure 3.9 2013 PADD III: Foreign Sourced Supply by Type and Domestic Crude Oil
Domestic crude( 4,225 )
Light Sweet*( 137 )
Light/MediumSour
( 1,460 )
Heavy( 2,130 )
Total refining capacity = 9,446 thousand barrels per day
* Includes small volumes of Medium SweetSource: EIA
The 2.1 million b/d of heavy crude oil imports in 2013 remained relatively unchanged from 2012. Due to pipeline constraints, only 118,000 b/d of western Canadian crude was able to reach the U.S. Gulf Coast region. The top three suppliers of foreign crude oil in declining order are: Saudi Arabia, Mexico, and Venezuela; which combined accountfor67percentoftotalimports.Venezuela,Mexico,andColumbiacollectivelyaccountfor77percentof all heavy imports. Crude oil imports from Saudi Arabia consist mostly of light and medium sour crude oils. The opportunity for growing supplies from Western Canada to gain a presence in this market once the transportation capacity is in place lies in the displacement of heavy imports and not competition with U.S. domestic production, which is primarily light crude oil.
Since 2010, crude oil imports from Mexico have been steadily declining and in 2013 fell by 116,000 b/d to 919,000 b/d, reflecting the decline in Mexico’s crude oil production. The annual imports from Venezuela in 2013hita20-yearlow,fallingbyadramatic17percentto755,000b/d.Venezuelaisreportedtobeexporting640,000 b/d to China with about 310,000 b/d being used to pay back loans. Despite Venezuela having the world’s largest reserves of crude oil, growth in production will be difficult to achieve and significant capital investments will be required. If there is no substantial growth in production, exports to the U.S. will continue to decline as Venezuela has substantial supply commitments to China, Cuba, the Dominican Republic and Nicaragua.
There are currently two pipelines in service that provide a limited connection between western Canadian producers and the U.S. Gulf Coast market. Further expansions upstream are required for significant volumes of western Canadian crude to enter this market. The U.S. Gulf Coast was the largest market for movements of crude by rail in 2013. CAPP’s 2014 refinery survey indicates that western Canadian crude oil supplied to this market could reach 709,000b/din2020.
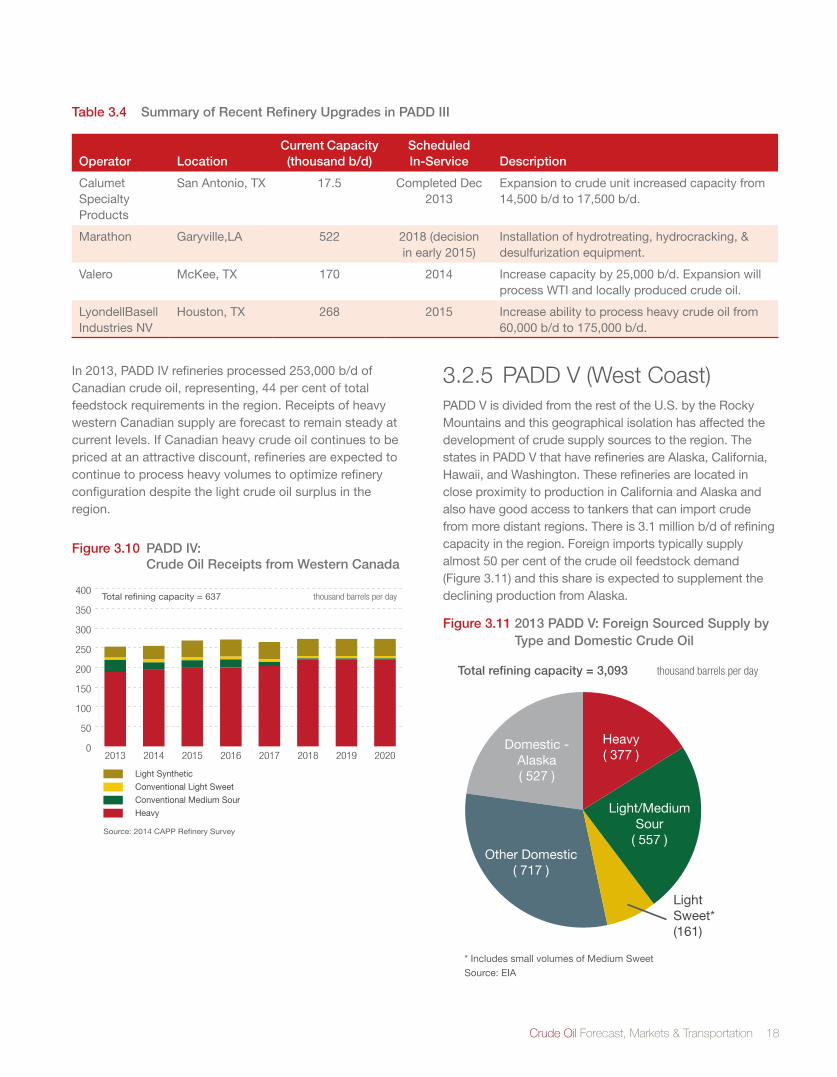
3.2.4 PADD IV (Rockies)There are 14 refineries in PADD IV located in Colorado, Montana, Utah, and Wyoming with a combined refining capacityof637,000b/d.Therefineriesinthismarketprocess U.S. domestic crude oil supplies from the Bakken oil play and source all foreign imports from Western Canada.
Crude Oil Forecast, Markets & Transportation 18
In2013,PADDIVrefineriesprocessed253,000b/dofCanadian crude oil, representing, 44 per cent of total feedstock requirements in the region. Receipts of heavy western Canadian supply are forecast to remain steady at current levels. If Canadian heavy crude oil continues to be priced at an attractive discount, refineries are expected to continue to process heavy volumes to optimize refinery configuration despite the light crude oil surplus in the region.
Figure 3.10 PADD IV: Crude Oil Receipts from Western Canada
Source: 2014 CAPP Refinery Survey
0
50
100
150
200
250
300
350
400
Light Synthetic
Conventional Light Sweet
Conventional Medium Sour
Heavy
20202019201820172016201520142013
Total refining capacity = 637 thousand barrels per day
3.2.5 PADD V (West Coast)PADD V is divided from the rest of the U.S. by the Rocky Mountains and this geographical isolation has affected the development of crude supply sources to the region. The states in PADD V that have refineries are Alaska, California, Hawaii, and Washington. These refineries are located in close proximity to production in California and Alaska and also have good access to tankers that can import crude from more distant regions. There is 3.1 million b/d of refining capacity in the region. Foreign imports typically supply almost50percentofthecrudeoilfeedstockdemand(Figure 3.11) and this share is expected to supplement the declining production from Alaska.
Figure 3.11 2013 PADD V: Foreign Sourced Supply by Type and Domestic Crude Oil
Domestic -Alaska( 527 )
Other Domestic( 717 )
LightSweet*(161)
Light/MediumSour
( 557 )
Heavy( 377 )
Total refining capacity = 3,093 thousand barrels per day
* Includes small volumes of Medium SweetSource: EIA
Table 3.4 Summary of Recent Refinery Upgrades in PADD III
Operator LocationCurrent Capacity (thousand b/d)
Scheduled In-Service Description
Calumet Specialty Products
San Antonio, TX 17.5 Completed Dec 2013
Expansion to crude unit increased capacity from 14,500b/dto17,500b/d.
Marathon Garyville,LA 522 2018 (decision inearly2015)
Installation of hydrotreating, hydrocracking, & desulfurization equipment.
Valero McKee, TX 170 2014 Increasecapacityby25,000b/d.Expansionwillprocess WTI and locally produced crude oil.
LyondellBasell Industries NV
Houston, TX 268 2015 Increase ability to process heavy crude oil from 60,000b/dto175,000b/d.
19 CANADIAN ASSOCIATION OF PETROLEUM PRODUCERS
The following discussion focuses only on Washington and California as the demand from refiners located in these two states account for both the current and future prospects for western Canadian crude oil in this region.
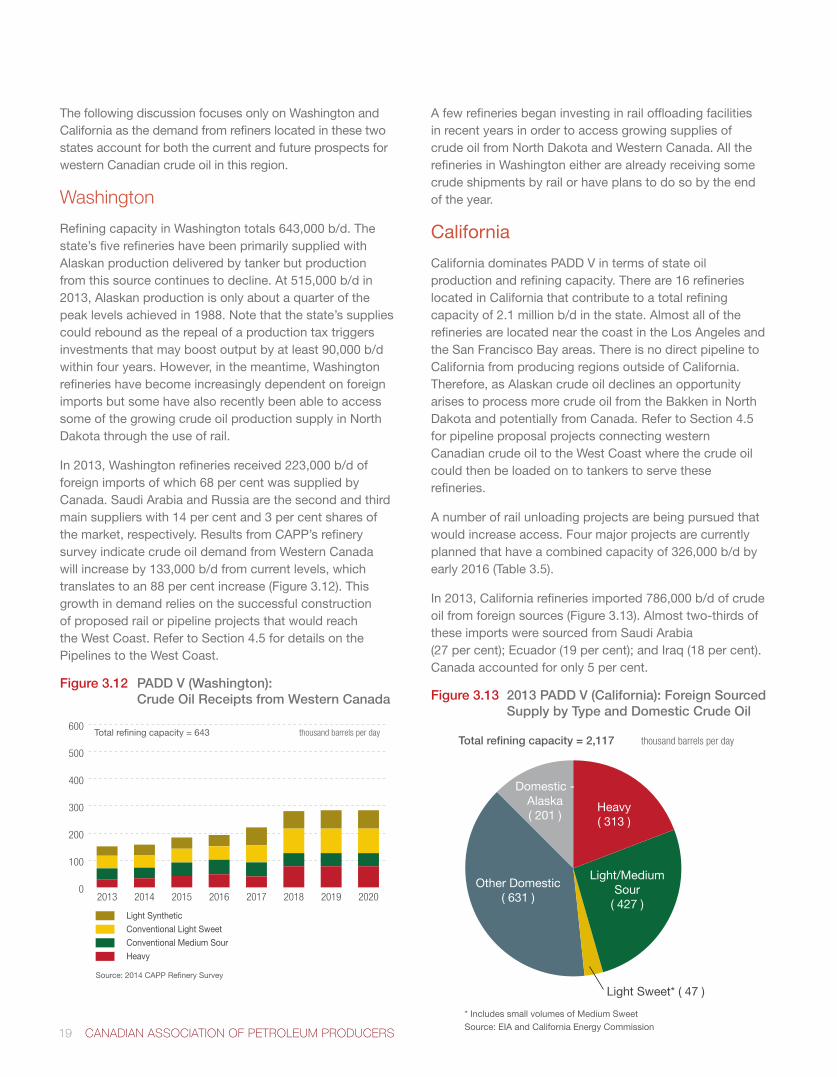
Washington
Refining capacity in Washington totals 643,000 b/d. The state’s five refineries have been primarily supplied with Alaskan production delivered by tanker but production fromthissourcecontinuestodecline.At515,000b/din2013, Alaskan production is only about a quarter of the peak levels achieved in 1988. Note that the state’s supplies could rebound as the repeal of a production tax triggers investments that may boost output by at least 90,000 b/d within four years. However, in the meantime, Washington refineries have become increasingly dependent on foreign imports but some have also recently been able to access some of the growing crude oil production supply in North Dakota through the use of rail.
In 2013, Washington refineries received 223,000 b/d of foreign imports of which 68 per cent was supplied by Canada. Saudi Arabia and Russia are the second and third main suppliers with 14 per cent and 3 per cent shares of the market, respectively. Results from CAPP’s refinery survey indicate crude oil demand from Western Canada will increase by 133,000 b/d from current levels, which translates to an 88 per cent increase (Figure 3.12). This growth in demand relies on the successful construction of proposed rail or pipeline projects that would reach theWestCoast.RefertoSection4.5fordetailsonthePipelines to the West Coast.
Figure 3.12 PADD V (Washington): Crude Oil Receipts from Western Canada
Source: 2014 CAPP Refinery Survey
0
100
200
300
400
500
600
Light Synthetic
Conventional Light Sweet
Conventional Medium Sour
Heavy
20202019201820172016201520142013
Total refining capacity = 643 thousand barrels per day
A few refineries began investing in rail offloading facilities in recent years in order to access growing supplies of crude oil from North Dakota and Western Canada. All the refineries in Washington either are already receiving some crude shipments by rail or have plans to do so by the end of the year.
California
California dominates PADD V in terms of state oil production and refining capacity. There are 16 refineries located in California that contribute to a total refining capacity of 2.1 million b/d in the state. Almost all of the refineries are located near the coast in the Los Angeles and the San Francisco Bay areas. There is no direct pipeline to California from producing regions outside of California. Therefore, as Alaskan crude oil declines an opportunity arises to process more crude oil from the Bakken in North DakotaandpotentiallyfromCanada.RefertoSection4.5for pipeline proposal projects connecting western Canadian crude oil to the West Coast where the crude oil could then be loaded on to tankers to serve these refineries.
A number of rail unloading projects are being pursued that would increase access. Four major projects are currently planned that have a combined capacity of 326,000 b/d by early2016(Table3.5).
In2013,Californiarefineriesimported786,000b/dofcrudeoil from foreign sources (Figure 3.13). Almost two-thirds of these imports were sourced from Saudi Arabia (27percent);Ecuador(19percent);andIraq(18percent).Canadaaccountedforonly5percent.
Figure 3.13 2013 PADD V (California): Foreign Sourced Supply by Type and Domestic Crude Oil
Domestic -Alaska( 201 )
Other Domestic( 631 )
Light Sweet* ( 47 )
Light/MediumSour
( 427 )
Heavy( 313 )
Total refining capacity = 2,117 thousand barrels per day
* Includes small volumes of Medium SweetSource: EIA and California Energy Commission
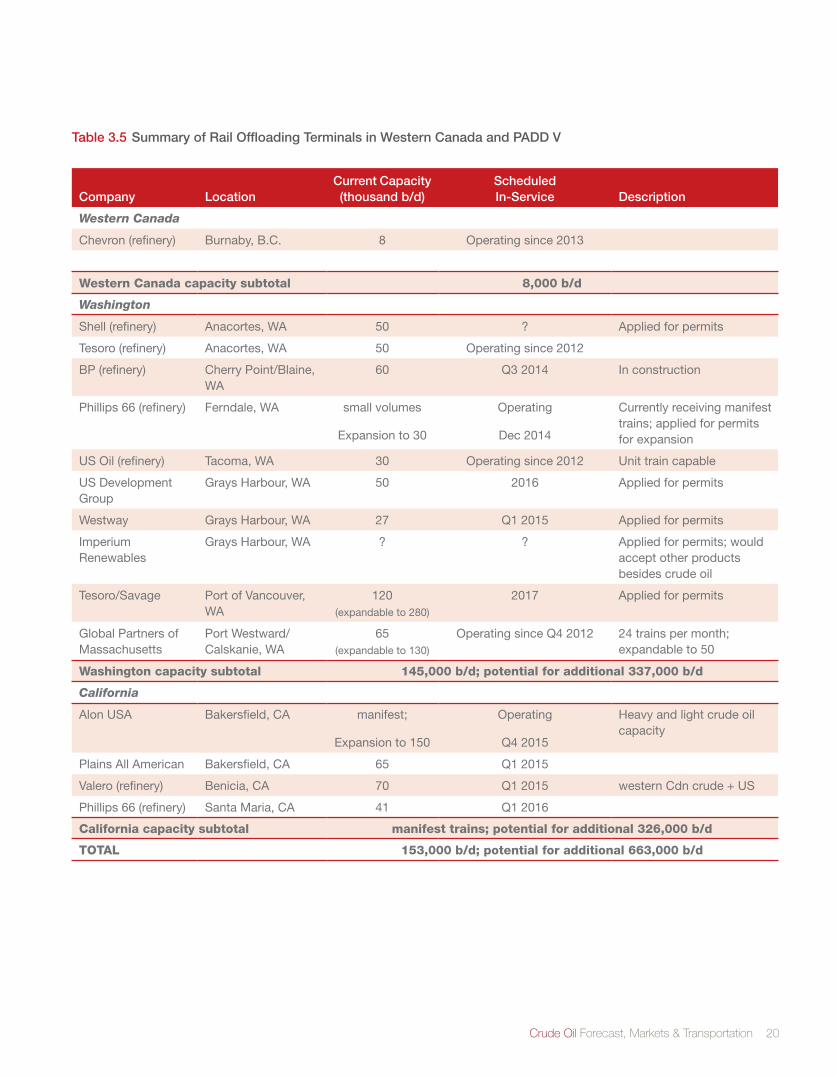
Crude Oil Forecast, Markets & Transportation 20
Table 3.5 Summary of Rail Offloading Terminals in Western Canada and PADD V
Company LocationCurrent Capacity (thousand b/d)
Scheduled In-Service Description
Western Canada
Chevron (refinery) Burnaby, B.C. 8 Operating since 2013
Western Canada capacity subtotal 8,000 b/d
Washington
Shell (refinery) Anacortes, WA 50 ? Applied for permits
Tesoro (refinery) Anacortes, WA 50 Operating since 2012
BP (refinery) Cherry Point/Blaine, WA
60 Q3 2014 In construction
Phillips 66 (refinery) Ferndale, WA small volumes
Expansion to 30
Operating
Dec 2014
Currently receiving manifest trains; applied for permits for expansion
US Oil (refinery) Tacoma, WA 30 Operating since 2012 Unit train capable
US Development Group
Grays Harbour, WA 50 2016 Applied for permits
Westway Grays Harbour, WA 27 Q12015 Applied for permits
Imperium Renewables
Grays Harbour, WA ? ? Applied for permits; would accept other products besides crude oil
Tesoro/Savage Port of Vancouver, WA
120
(expandable to 280)
2017 Applied for permits
Global Partners of Massachusetts
Port Westward/Calskanie, WA
65(expandable to 130)
Operating since Q4 2012 24 trains per month; expandableto50
Washington capacity subtotal 145,000 b/d; potential for additional 337,000 b/d
California
Alon USA Bakersfield, CA manifest;
Expansionto150
Operating
Q42015
Heavy and light crude oil capacity
Plains All American Bakersfield, CA 65 Q12015
Valero (refinery) Benicia, CA 70 Q12015 western Cdn crude + US
Phillips 66 (refinery) Santa Maria, CA 41 Q1 2016
California capacity subtotal manifest trains; potential for additional 326,000 b/d
TOTAL 153,000 b/d; potential for additional 663,000 b/d
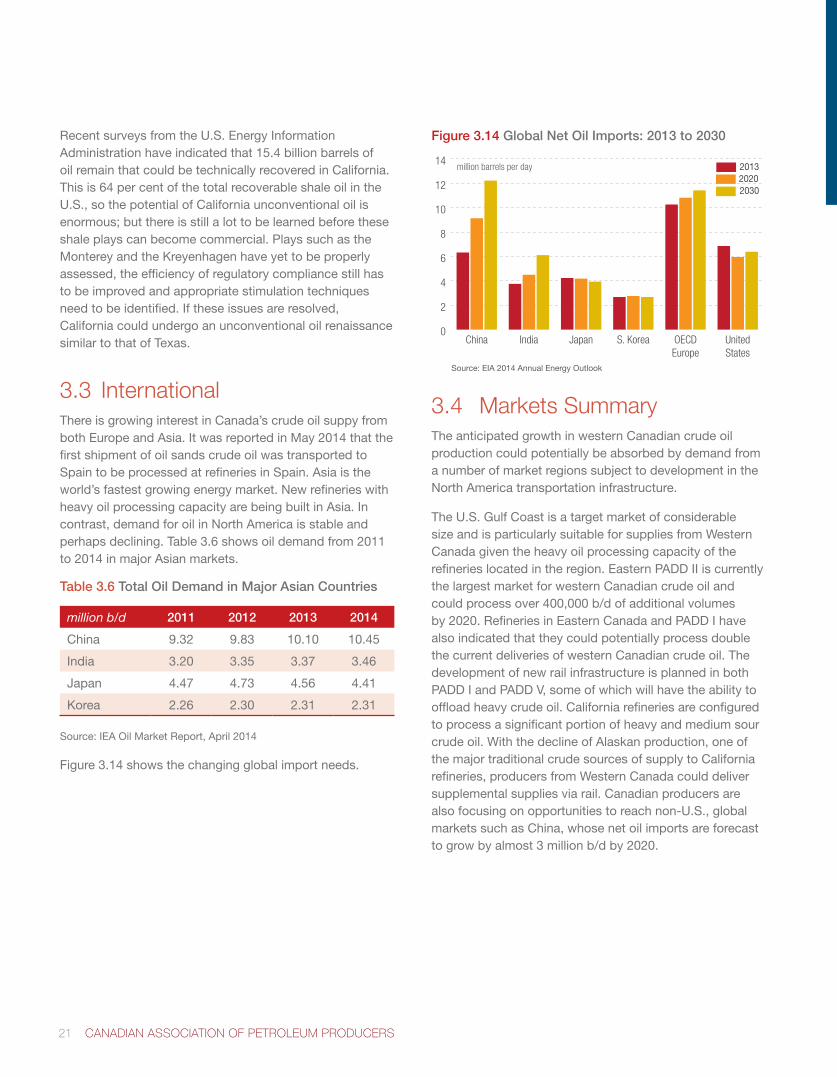
21 CANADIAN ASSOCIATION OF PETROLEUM PRODUCERS
Recent surveys from the U.S. Energy Information Administrationhaveindicatedthat15.4billionbarrelsofoil remain that could be technically recovered in California. This is 64 per cent of the total recoverable shale oil in the U.S., so the potential of California unconventional oil is enormous; but there is still a lot to be learned before these shale plays can become commercial. Plays such as the Monterey and the Kreyenhagen have yet to be properly assessed, the efficiency of regulatory compliance still has to be improved and appropriate stimulation techniques need to be identified. If these issues are resolved, California could undergo an unconventional oil renaissance similar to that of Texas.
3.3 InternationalThere is growing interest in Canada’s crude oil suppy from both Europe and Asia. It was reported in May 2014 that the first shipment of oil sands crude oil was transported to Spain to be processed at refineries in Spain. Asia is the world’s fastest growing energy market. New refineries with heavy oil processing capacity are being built in Asia. In contrast, demand for oil in North America is stable and perhaps declining. Table 3.6 shows oil demand from 2011 to 2014 in major Asian markets.
Table 3.6 Total Oil Demand in Major Asian Countries
million b/d 2011 2012 2013 2014
China 9.32 9.83 10.10 10.45
India 3.20 3.35 3.37 3.46
Japan 4.47 4.73 4.56 4.41
Korea 2.26 2.30 2.31 2.31
Source: IEA Oil Market Report, April 2014
Figure 3.14 shows the changing global import needs.
Figure 3.14 Global Net Oil Imports: 2013 to 2030
0
2
4
6
8
10
12
14
203020202013
UnitedStates
OECDEurope
S. KoreaJapanIndiaChina
million barrels per day
Source: EIA 2014 Annual Energy Outlook
3.4 Markets SummaryThe anticipated growth in western Canadian crude oil production could potentially be absorbed by demand from a number of market regions subject to development in the North America transportation infrastructure.
The U.S. Gulf Coast is a target market of considerable size and is particularly suitable for supplies from Western Canada given the heavy oil processing capacity of the refineries located in the region. Eastern PADD II is currently the largest market for western Canadian crude oil and could process over 400,000 b/d of additional volumes by 2020. Refineries in Eastern Canada and PADD I have also indicated that they could potentially process double the current deliveries of western Canadian crude oil. The development of new rail infrastructure is planned in both PADD I and PADD V, some of which will have the ability to offload heavy crude oil. California refineries are configured to process a significant portion of heavy and medium sour crude oil. With the decline of Alaskan production, one of the major traditional crude sources of supply to California refineries, producers from Western Canada could deliver supplemental supplies via rail. Canadian producers are also focusing on opportunities to reach non-U.S., global markets such as China, whose net oil imports are forecast to grow by almost 3 million b/d by 2020.
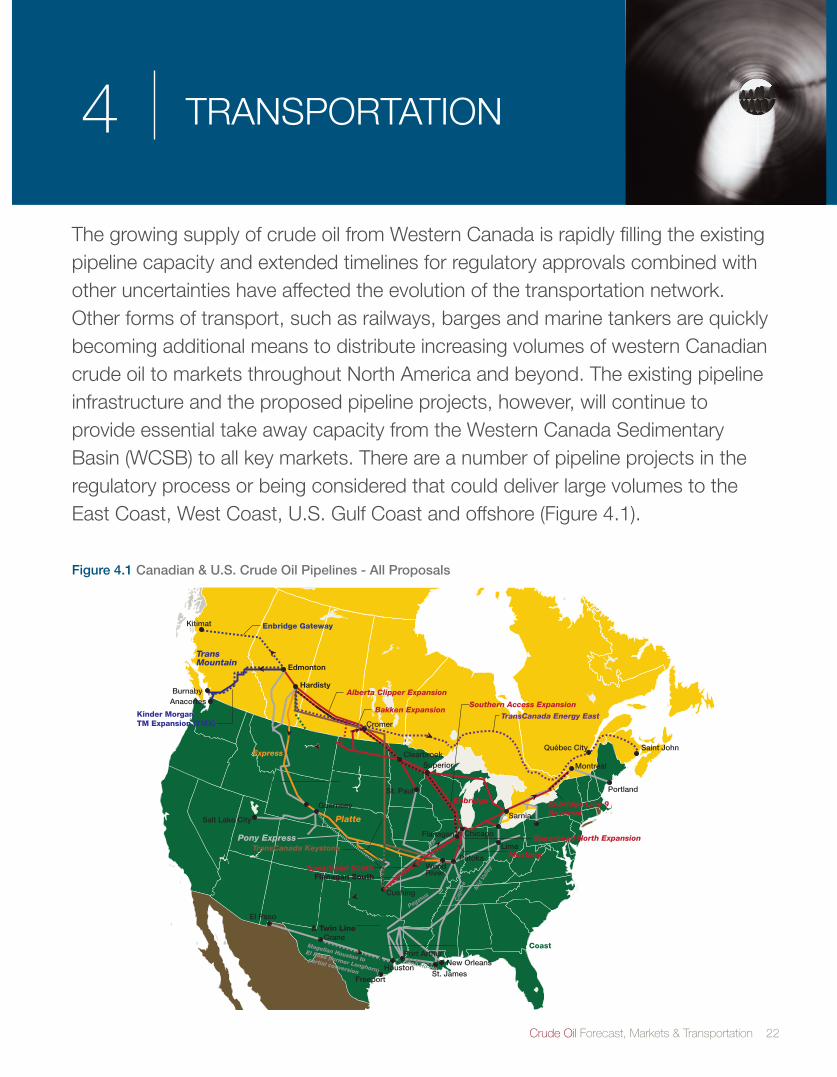
Crude Oil Forecast, Markets & Transportation 22
The growing supply of crude oil from Western Canada is rapidly filling the existing pipeline capacity and extended timelines for regulatory approvals combined with other uncertainties have affected the evolution of the transportation network. Other forms of transport, such as railways, barges and marine tankers are quickly becoming additional means to distribute increasing volumes of western Canadian crude oil to markets throughout North America and beyond. The existing pipeline infrastructure and the proposed pipeline projects, however, will continue to provide essential take away capacity from the Western Canada Sedimentary Basin (WCSB) to all key markets. There are a number of pipeline projects in the regulatory process or being considered that could deliver large volumes to the East Coast, West Coast, U.S. Gulf Coast and offshore (Figure 4.1).
4 TRANSPORTATION
Figure 4.1 Canadian & U.S. Crude Oil Pipelines - All Proposals
Portland
Montréal
Québec City Saint John
Sarnia
Cushing
St. Paul
Salt Lake City
HoustonSt. James
New Orleans
Crane
El Paso
Freeport
Edmonton
AnacortesBurnaby
TransCanada Keystone
Alberta Clipper Expansion
TransMountain
BP
Enbridge
Mid
Val
ley
Hardisty
Centurion Pipeline
Magellan Houston toEl Paso (former Longhorn)
- partial conversion
Shell Ho-Ho
Express
Platte
Spearhead South
Spearhead North Expansion
Superior
WoodRiver
Cromer
Clearbrook
Guernsey
TransCanadaKeystone XL
Kinder MorganTM Expansion (TMX)
Kitimat Enbridge Gateway
MustangPatoka
Seaway Reversal& Twin Line
TransCanada Gulf Coast
Enbridge Line 9Reversal
Lima
Southern Access Expansion
TransCanada Energy East
Flanagan South
Bakken Expansion
Pony Express Flanagan Chicago
Cap
line
Pegasus
Port Arthur
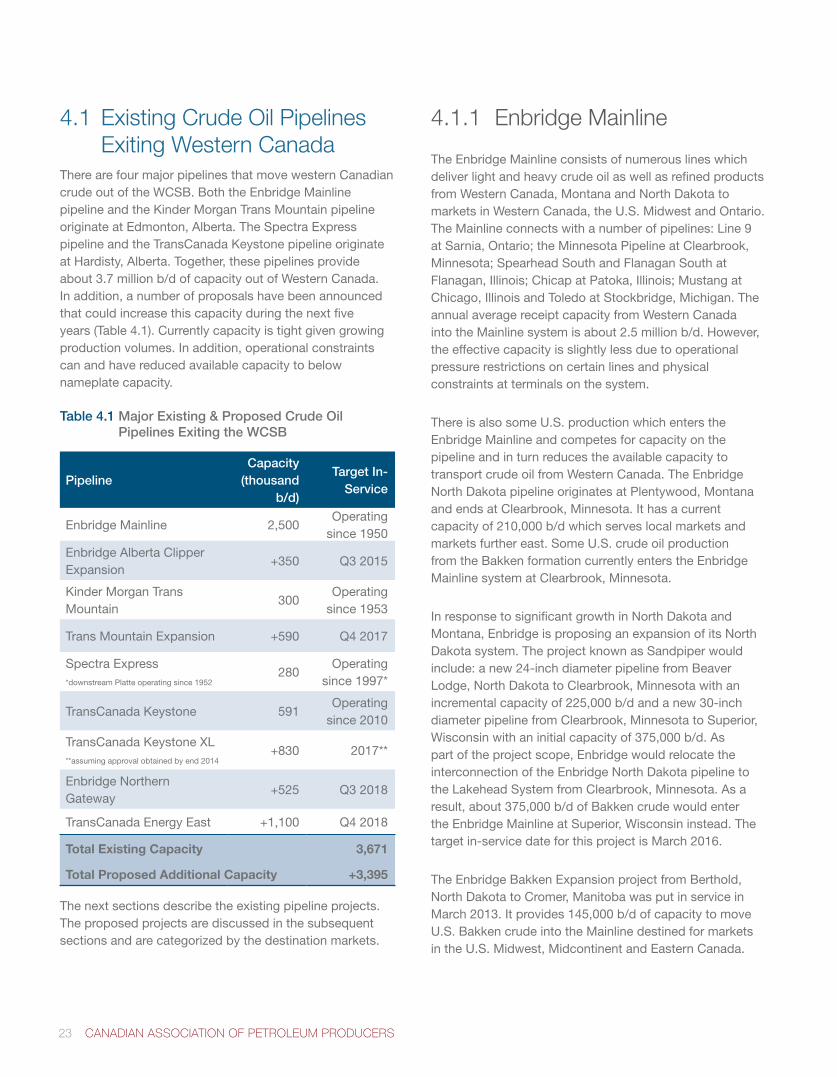
23 CANADIAN ASSOCIATION OF PETROLEUM PRODUCERS
4.1 Existing Crude Oil Pipelines Exiting Western Canada
There are four major pipelines that move western Canadian crude out of the WCSB. Both the Enbridge Mainline pipeline and the Kinder Morgan Trans Mountain pipeline originate at Edmonton, Alberta. The Spectra Express pipeline and the TransCanada Keystone pipeline originate at Hardisty, Alberta. Together, these pipelines provide about3.7millionb/dofcapacityoutofWesternCanada.In addition, a number of proposals have been announced that could increase this capacity during the next five years (Table 4.1). Currently capacity is tight given growing production volumes. In addition, operational constraints can and have reduced available capacity to below nameplate capacity.
Table 4.1 Major Existing & Proposed Crude Oil Pipelines Exiting the WCSB
PipelineCapacity
(thousand b/d)
Target In-Service
Enbridge Mainline 2,500Operating
since1950
Enbridge Alberta Clipper Expansion
+350 Q32015
Kinder Morgan Trans Mountain
300Operating
since1953
Trans Mountain Expansion +590 Q42017
Spectra Express *downstreamPlatteoperatingsince1952
280Operating
since1997*
TransCanada Keystone 591Operating
since 2010
TransCanada Keystone XL **assuming approval obtained by end 2014
+830 2017**
Enbridge Northern Gateway
+525 Q3 2018
TransCanada Energy East +1,100 Q4 2018
Total Existing Capacity 3,671
Total Proposed Additional Capacity +3,395
The next sections describe the existing pipeline projects. The proposed projects are discussed in the subsequent sections and are categorized by the destination markets.
4.1.1 Enbridge Mainline
The Enbridge Mainline consists of numerous lines which deliver light and heavy crude oil as well as refined products from Western Canada, Montana and North Dakota to markets in Western Canada, the U.S. Midwest and Ontario. The Mainline connects with a number of pipelines: Line 9 at Sarnia, Ontario; the Minnesota Pipeline at Clearbrook, Minnesota; Spearhead South and Flanagan South at Flanagan, Illinois; Chicap at Patoka, Illinois; Mustang at Chicago, Illinois and Toledo at Stockbridge, Michigan. The annual average receipt capacity from Western Canada intotheMainlinesystemisabout2.5millionb/d.However,the effective capacity is slightly less due to operational pressure restrictions on certain lines and physical constraints at terminals on the system.
There is also some U.S. production which enters the Enbridge Mainline and competes for capacity on the pipeline and in turn reduces the available capacity to transport crude oil from Western Canada. The Enbridge North Dakota pipeline originates at Plentywood, Montana and ends at Clearbrook, Minnesota. It has a current capacity of 210,000 b/d which serves local markets and markets further east. Some U.S. crude oil production from the Bakken formation currently enters the Enbridge Mainline system at Clearbrook, Minnesota.
In response to significant growth in North Dakota and Montana, Enbridge is proposing an expansion of its North Dakota system. The project known as Sandpiper would include: a new 24-inch diameter pipeline from Beaver Lodge, North Dakota to Clearbrook, Minnesota with an incrementalcapacityof225,000b/dandanew30-inchdiameter pipeline from Clearbrook, Minnesota to Superior, Wisconsinwithaninitialcapacityof375,000b/d.Aspart of the project scope, Enbridge would relocate the interconnection of the Enbridge North Dakota pipeline to the Lakehead System from Clearbrook, Minnesota. As a result,about375,000b/dofBakkencrudewouldenterthe Enbridge Mainline at Superior, Wisconsin instead. The target in-service date for this project is March 2016.
The Enbridge Bakken Expansion project from Berthold, North Dakota to Cromer, Manitoba was put in service in March2013.Itprovides145,000b/dofcapacitytomoveU.S. Bakken crude into the Mainline destined for markets in the U.S. Midwest, Midcontinent and Eastern Canada.
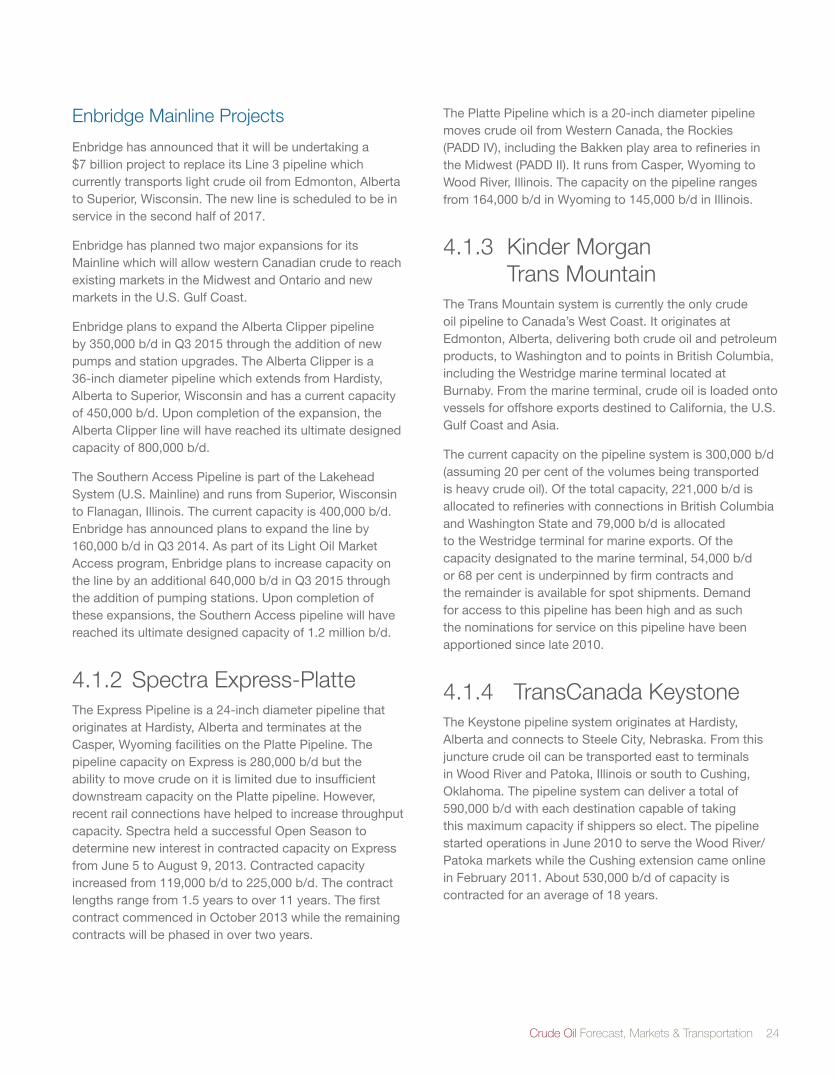
Crude Oil Forecast, Markets & Transportation 24
Enbridge Mainline Projects
Enbridge has announced that it will be undertaking a $7billionprojecttoreplaceitsLine3pipelinewhichcurrently transports light crude oil from Edmonton, Alberta to Superior, Wisconsin. The new line is scheduled to be in serviceinthesecondhalfof2017.
Enbridge has planned two major expansions for its Mainline which will allow western Canadian crude to reach existing markets in the Midwest and Ontario and new markets in the U.S. Gulf Coast.
Enbridge plans to expand the Alberta Clipper pipeline by350,000b/dinQ32015throughtheadditionofnewpumps and station upgrades. The Alberta Clipper is a 36-inch diameter pipeline which extends from Hardisty, Alberta to Superior, Wisconsin and has a current capacity of450,000b/d.Uponcompletionoftheexpansion,theAlberta Clipper line will have reached its ultimate designed capacity of 800,000 b/d.
The Southern Access Pipeline is part of the Lakehead System (U.S. Mainline) and runs from Superior, Wisconsin to Flanagan, Illinois. The current capacity is 400,000 b/d. Enbridge has announced plans to expand the line by 160,000 b/d in Q3 2014. As part of its Light Oil Market Access program, Enbridge plans to increase capacity on thelinebyanadditional640,000b/dinQ32015throughthe addition of pumping stations. Upon completion of these expansions, the Southern Access pipeline will have reached its ultimate designed capacity of 1.2 million b/d.
4.1.2 Spectra Express-Platte The Express Pipeline is a 24-inch diameter pipeline that originates at Hardisty, Alberta and terminates at the Casper, Wyoming facilities on the Platte Pipeline. The pipeline capacity on Express is 280,000 b/d but the ability to move crude on it is limited due to insufficient downstream capacity on the Platte pipeline. However, recent rail connections have helped to increase throughput capacity. Spectra held a successful Open Season to determine new interest in contracted capacity on Express fromJune5toAugust9,2013.Contractedcapacityincreasedfrom119,000b/dto225,000b/d.Thecontractlengthsrangefrom1.5yearstoover11years.Thefirstcontract commenced in October 2013 while the remaining contracts will be phased in over two years.
The Platte Pipeline which is a 20-inch diameter pipeline moves crude oil from Western Canada, the Rockies (PADD IV), including the Bakken play area to refineries in the Midwest (PADD II). It runs from Casper, Wyoming to Wood River, Illinois. The capacity on the pipeline ranges from164,000b/dinWyomingto145,000b/dinIllinois.
4.1.3 Kinder Morgan Trans Mountain
The Trans Mountain system is currently the only crude oil pipeline to Canada’s West Coast. It originates at Edmonton, Alberta, delivering both crude oil and petroleum products, to Washington and to points in British Columbia, including the Westridge marine terminal located at Burnaby. From the marine terminal, crude oil is loaded onto vessels for offshore exports destined to California, the U.S. Gulf Coast and Asia.
The current capacity on the pipeline system is 300,000 b/d (assuming 20 per cent of the volumes being transported is heavy crude oil). Of the total capacity, 221,000 b/d is allocated to refineries with connections in British Columbia andWashingtonStateand79,000b/disallocatedto the Westridge terminal for marine exports. Of the capacitydesignatedtothemarineterminal,54,000b/dor 68 per cent is underpinned by firm contracts and the remainder is available for spot shipments. Demand for access to this pipeline has been high and as such the nominations for service on this pipeline have been apportioned since late 2010.
4.1.4 TransCanada KeystoneThe Keystone pipeline system originates at Hardisty, Alberta and connects to Steele City, Nebraska. From this juncture crude oil can be transported east to terminals in Wood River and Patoka, Illinois or south to Cushing, Oklahoma. The pipeline system can deliver a total of 590,000b/dwitheachdestinationcapableoftakingthis maximum capacity if shippers so elect. The pipeline started operations in June 2010 to serve the Wood River/Patoka markets while the Cushing extension came online inFebruary2011.About530,000b/dofcapacityiscontracted for an average of 18 years.
25 CANADIAN ASSOCIATION OF PETROLEUM PRODUCERS
4.2 New Regional Infrastructure Projects in Western Canada
The major pipelines which move western Canadian crude out of the basin are investing significant capital in regional pipeline infrastructure to move incremental production to markets. The upstream expansions into Hardisty, Alberta could feed the Enbridge Mainline, Keystone, Keystone XL and the proposed TransCanada Energy East Pipeline into Eastern Canada.
4.2.1 Enbridge - Alberta Regional Pipeline
Enbridge - Edmonton to Hardisty
Enbridge is proposing to build a 36-inch diameter pipeline from Edmonton to Hardisty with a capacity of 800,000 b/d. The project includes five new tanks with a total capacity of 2.75millionbarrelsandterminalfacilitiesattheEdmontonSouth terminal. The estimated cost is $1.8 billion. The targetin-serviceQ22015.
4.2.2 TransCanada - Alberta Regional Pipelines
Heartland Pipeline and Terminal
TransCanada is proposing a 36-inch diameter pipeline from the Heartland region to Hardisty, Alberta, which is the starting point of its Keystone pipeline system. Heartland is an industrial area north of Edmonton, Alberta. The initial capacitywouldbe500,000b/dbutthepipelinecouldbeexpanded to 900,000 b/d. At Hardisty, Alberta the pipeline would have connections to Keystone, Keystone XL and Energy East. In the Heartland region, there will be up to 1.9 million barrels of tank capacity available. Regulatory approvals are expected in Q3 2014 while the target in-service date for the Heartland pipeline is 2016.
Grand Rapids Pipeline Project
TransCanada in partnership with Phoenix Energy Holdings Limited (Phoenix) is proposing to develop the Grand Rapids Pipeline in Northern Alberta. Each party will own 50percentoftheproposedpipelinesystem.Theprojectincludes both a crude oil line and a diluent line between the producing area northwest of Fort McMurray and Heartland. The system could move up to 900,000 b/d of bitumen blend and up to 330,000 b/d of diluent. The crudeoilpipelineistargetedtobeinservicebymid-2015withthecompleteprojecttargetedforin-servicein2017.TransCanada will operate the pipeline and Phoenix has entered into a long-term commitment to ship crude oil and diluent on the pipeline system.
4.3 Oil Pipelines to the U.S. Midwest
The U.S. Midwest is the largest market for western Canadian crude oil. The key market hubs in this region are located at Wood River and Patoka in Illinois and at Cushing, Oklahoma. Table 4.2 summarizes the pipelines which deliver Canadian crude oil to the Midwest.
4.3.1 Spectra Express-Platte
See Section 4.1.2.
4.3.2 TransCanada Keystone
See Section 4.1.4.
4.3.3 Southern Access ExtensionEnbridge is proposing an extension to its Southern Access line which would run from Flanagan, Illinois to Patoka, Illinois. The proposed extension would be a 24-inch diameter pipeline with an initial capacity of 300,000 b/d. Thepipelineistargetedtobein-servicedatebymid2015.
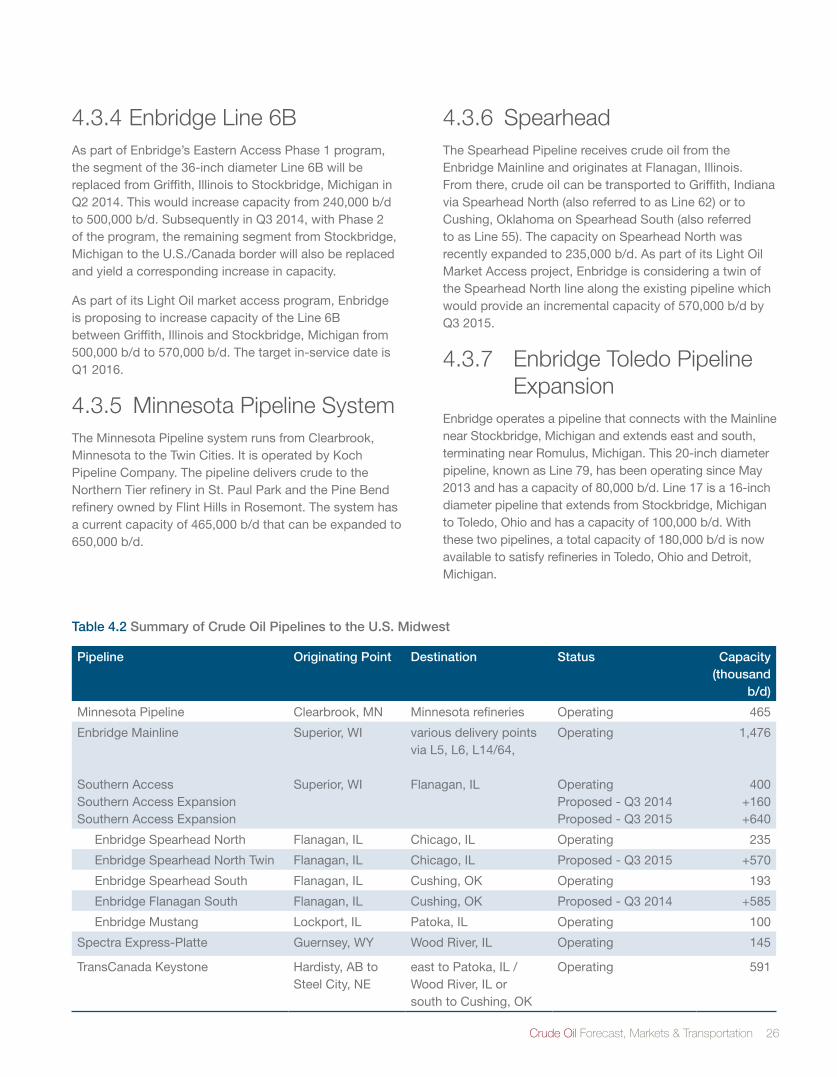
Crude Oil Forecast, Markets & Transportation 26
4.3.4 Enbridge Line 6BAs part of Enbridge’s Eastern Access Phase 1 program, the segment of the 36-inch diameter Line 6B will be replaced from Griffith, Illinois to Stockbridge, Michigan in Q2 2014. This would increase capacity from 240,000 b/d to500,000b/d.SubsequentlyinQ32014,withPhase2of the program, the remaining segment from Stockbridge, Michigan to the U.S./Canada border will also be replaced and yield a corresponding increase in capacity.
As part of its Light Oil market access program, Enbridge is proposing to increase capacity of the Line 6B between Griffith, Illinois and Stockbridge, Michigan from 500,000b/dto570,000b/d.Thetargetin-servicedateisQ1 2016.
4.3.5 Minnesota Pipeline System
The Minnesota Pipeline system runs from Clearbrook, Minnesota to the Twin Cities. It is operated by Koch Pipeline Company. The pipeline delivers crude to the Northern Tier refinery in St. Paul Park and the Pine Bend refinery owned by Flint Hills in Rosemont. The system has acurrentcapacityof465,000b/dthatcanbeexpandedto650,000b/d.
4.3.6 SpearheadThe Spearhead Pipeline receives crude oil from the Enbridge Mainline and originates at Flanagan, Illinois. From there, crude oil can be transported to Griffith, Indiana via Spearhead North (also referred to as Line 62) or to Cushing, Oklahoma on Spearhead South (also referred toasLine55).ThecapacityonSpearheadNorthwasrecentlyexpandedto235,000b/d.AspartofitsLightOilMarket Access project, Enbridge is considering a twin of the Spearhead North line along the existing pipeline which wouldprovideanincrementalcapacityof570,000b/dbyQ32015.
4.3.7 Enbridge Toledo Pipeline Expansion
Enbridge operates a pipeline that connects with the Mainline near Stockbridge, Michigan and extends east and south, terminating near Romulus, Michigan. This 20-inch diameter pipeline,knownasLine79,hasbeenoperatingsinceMay2013andhasacapacityof80,000b/d.Line17isa16-inchdiameter pipeline that extends from Stockbridge, Michigan to Toledo, Ohio and has a capacity of 100,000 b/d. With these two pipelines, a total capacity of 180,000 b/d is now available to satisfy refineries in Toledo, Ohio and Detroit, Michigan.
Table 4.2 Summary of Crude Oil Pipelines to the U.S. Midwest
Pipeline Originating Point Destination Status Capacity(thousand
b/d)
Minnesota Pipeline Clearbrook, MN Minnesota refineries Operating 465
Enbridge Mainline
Southern AccessSouthern Access ExpansionSouthern Access Expansion
Superior, WI
Superior, WI
various delivery points viaL5,L6,L14/64,
Flanagan, IL
Operating
OperatingProposed - Q3 2014Proposed-Q32015
1,476
400+160+640
Enbridge Spearhead North Flanagan, IL Chicago, IL Operating 235
Enbridge Spearhead North Twin Flanagan, IL Chicago, IL Proposed-Q32015 +570
Enbridge Spearhead South Flanagan, IL Cushing, OK Operating 193
Enbridge Flanagan South Flanagan, IL Cushing, OK Proposed - Q3 2014 +585
Enbridge Mustang Lockport, IL Patoka, IL Operating 100
Spectra Express-Platte Guernsey, WY Wood River, IL Operating 145
TransCanada Keystone Hardisty, AB to Steel City, NE
east to Patoka, IL / Wood River, IL or south to Cushing, OK
Operating 591
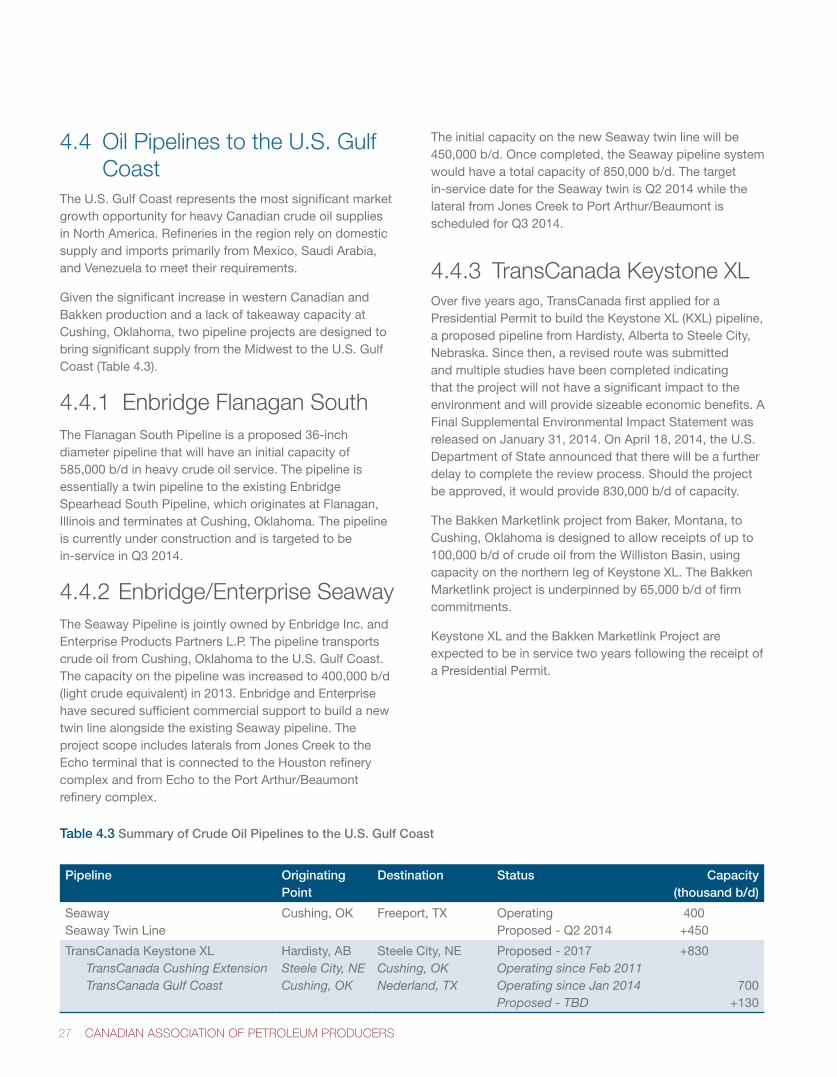
27 CANADIAN ASSOCIATION OF PETROLEUM PRODUCERS
4.4 Oil Pipelines to the U.S. Gulf Coast
The U.S. Gulf Coast represents the most significant market growth opportunity for heavy Canadian crude oil supplies in North America. Refineries in the region rely on domestic supply and imports primarily from Mexico, Saudi Arabia, and Venezuela to meet their requirements.
Given the significant increase in western Canadian and Bakken production and a lack of takeaway capacity at Cushing, Oklahoma, two pipeline projects are designed to bring significant supply from the Midwest to the U.S. Gulf Coast (Table 4.3).
4.4.1 Enbridge Flanagan SouthThe Flanagan South Pipeline is a proposed 36-inch diameter pipeline that will have an initial capacity of 585,000b/dinheavycrudeoilservice.Thepipelineisessentially a twin pipeline to the existing Enbridge Spearhead South Pipeline, which originates at Flanagan, Illinois and terminates at Cushing, Oklahoma. The pipeline is currently under construction and is targeted to be in-service in Q3 2014.
4.4.2 Enbridge/Enterprise SeawayThe Seaway Pipeline is jointly owned by Enbridge Inc. and Enterprise Products Partners L.P. The pipeline transports crude oil from Cushing, Oklahoma to the U.S. Gulf Coast. The capacity on the pipeline was increased to 400,000 b/d (light crude equivalent) in 2013. Enbridge and Enterprise have secured sufficient commercial support to build a new twin line alongside the existing Seaway pipeline. The project scope includes laterals from Jones Creek to the Echo terminal that is connected to the Houston refinery complex and from Echo to the Port Arthur/Beaumont refinery complex.
The initial capacity on the new Seaway twin line will be 450,000b/d.Oncecompleted,theSeawaypipelinesystemwouldhaveatotalcapacityof850,000b/d.Thetargetin-service date for the Seaway twin is Q2 2014 while the lateral from Jones Creek to Port Arthur/Beaumont is scheduled for Q3 2014.
4.4.3 TransCanada Keystone XLOver five years ago, TransCanada first applied for a Presidential Permit to build the Keystone XL (KXL) pipeline, a proposed pipeline from Hardisty, Alberta to Steele City, Nebraska. Since then, a revised route was submitted and multiple studies have been completed indicating that the project will not have a significant impact to the environment and will provide sizeable economic benefits. A Final Supplemental Environmental Impact Statement was released on January 31, 2014. On April 18, 2014, the U.S. Department of State announced that there will be a further delay to complete the review process. Should the project be approved, it would provide 830,000 b/d of capacity.
The Bakken Marketlink project from Baker, Montana, to Cushing, Oklahoma is designed to allow receipts of up to 100,000 b/d of crude oil from the Williston Basin, using capacity on the northern leg of Keystone XL. The Bakken Marketlinkprojectisunderpinnedby65,000b/doffirmcommitments.
Keystone XL and the Bakken Marketlink Project are expected to be in service two years following the receipt of a Presidential Permit.
Table 4.3 Summary of Crude Oil Pipelines to the U.S. Gulf Coast
Pipeline Originating Point
Destination Status Capacity(thousand b/d)
Seaway Seaway Twin Line
Cushing, OK Freeport, TX OperatingProposed - Q2 2014
400+450
TransCanada Keystone XL TransCanada Cushing Extension TransCanada Gulf Coast
Hardisty, ABSteele City, NECushing, OK
Steele City, NECushing, OKNederland, TX
Proposed-2017Operating since Feb 2011Operating since Jan 2014Proposed - TBD
+830
700+130
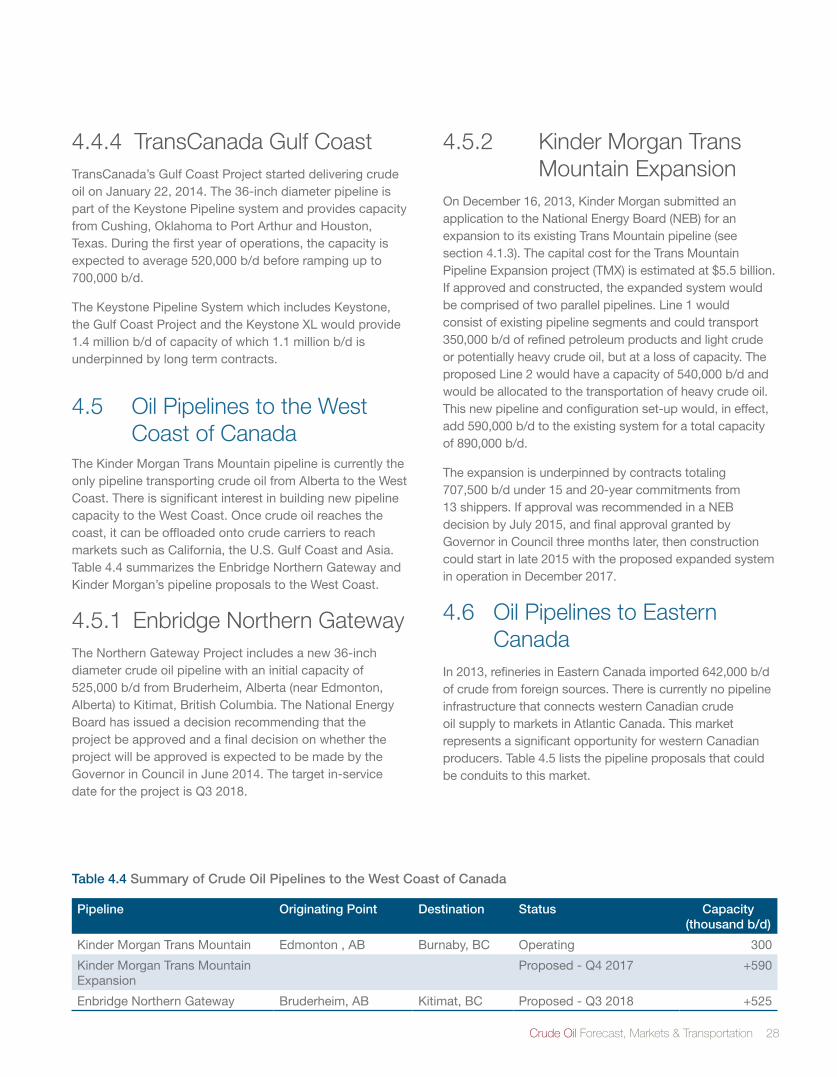
Crude Oil Forecast, Markets & Transportation 28
4.4.4 TransCanada Gulf Coast TransCanada’s Gulf Coast Project started delivering crude oil on January 22, 2014. The 36-inch diameter pipeline is part of the Keystone Pipeline system and provides capacity from Cushing, Oklahoma to Port Arthur and Houston, Texas. During the first year of operations, the capacity is expectedtoaverage520,000b/dbeforerampingupto700,000b/d.
The Keystone Pipeline System which includes Keystone, the Gulf Coast Project and the Keystone XL would provide 1.4 million b/d of capacity of which 1.1 million b/d is underpinned by long term contracts.
4.5 Oil Pipelines to the West Coast of Canada
The Kinder Morgan Trans Mountain pipeline is currently the only pipeline transporting crude oil from Alberta to the West Coast. There is significant interest in building new pipeline capacity to the West Coast. Once crude oil reaches the coast, it can be offloaded onto crude carriers to reach markets such as California, the U.S. Gulf Coast and Asia. Table 4.4 summarizes the Enbridge Northern Gateway and Kinder Morgan’s pipeline proposals to the West Coast.
4.5.1 Enbridge Northern GatewayThe Northern Gateway Project includes a new 36-inch diameter crude oil pipeline with an initial capacity of 525,000b/dfromBruderheim,Alberta(nearEdmonton,Alberta) to Kitimat, British Columbia. The National Energy Board has issued a decision recommending that the project be approved and a final decision on whether the project will be approved is expected to be made by the Governor in Council in June 2014. The target in-service date for the project is Q3 2018.
4.5.2 Kinder Morgan Trans Mountain Expansion
On December 16, 2013, Kinder Morgan submitted an application to the National Energy Board (NEB) for an expansion to its existing Trans Mountain pipeline (see section 4.1.3). The capital cost for the Trans Mountain PipelineExpansionproject(TMX)isestimatedat$5.5billion.If approved and constructed, the expanded system would be comprised of two parallel pipelines. Line 1 would consist of existing pipeline segments and could transport 350,000b/dofrefinedpetroleumproductsandlightcrudeor potentially heavy crude oil, but at a loss of capacity. The proposedLine2wouldhaveacapacityof540,000b/dandwould be allocated to the transportation of heavy crude oil. This new pipeline and configuration set-up would, in effect, add590,000b/dtotheexistingsystemforatotalcapacityof 890,000 b/d.
The expansion is underpinned by contracts totaling 707,500b/dunder15and20-yearcommitmentsfrom13 shippers. If approval was recommended in a NEB decisionbyJuly2015,andfinalapprovalgrantedbyGovernor in Council three months later, then construction couldstartinlate2015withtheproposedexpandedsysteminoperationinDecember2017.
4.6 Oil Pipelines to Eastern Canada
In 2013, refineries in Eastern Canada imported 642,000 b/d of crude from foreign sources. There is currently no pipeline infrastructure that connects western Canadian crude oil supply to markets in Atlantic Canada. This market represents a significant opportunity for western Canadian producers.Table4.5liststhepipelineproposalsthatcouldbe conduits to this market.
Table 4.4 Summary of Crude Oil Pipelines to the West Coast of Canada
Pipeline Originating Point Destination Status Capacity(thousand b/d)
Kinder Morgan Trans Mountain Edmonton , AB Burnaby, BC Operating 300
Kinder Morgan Trans Mountain Expansion
Proposed-Q42017 +590
Enbridge Northern Gateway Bruderheim, AB Kitimat, BC Proposed - Q3 2018 +525
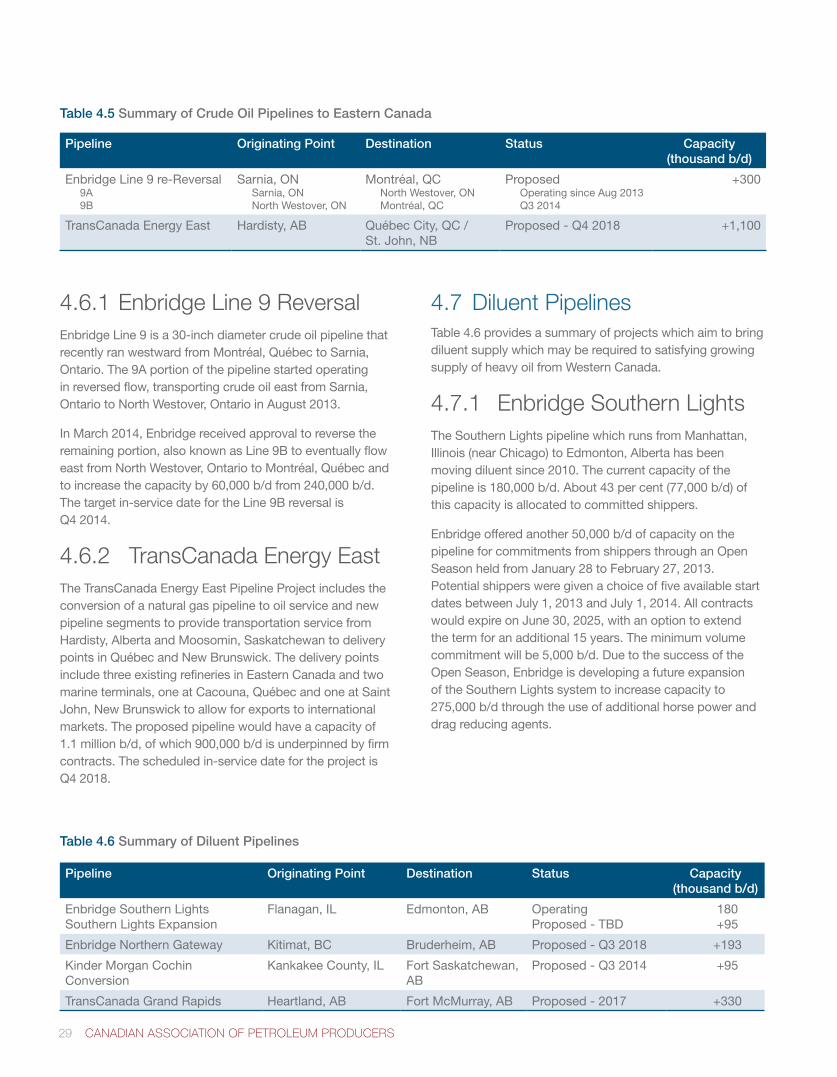
29 CANADIAN ASSOCIATION OF PETROLEUM PRODUCERS
4.6.1 Enbridge Line 9 ReversalEnbridge Line 9 is a 30-inch diameter crude oil pipeline that recently ran westward from Montréal, Québec to Sarnia, Ontario. The 9A portion of the pipeline started operating in reversed flow, transporting crude oil east from Sarnia, Ontario to North Westover, Ontario in August 2013.
In March 2014, Enbridge received approval to reverse the remaining portion, also known as Line 9B to eventually flow east from North Westover, Ontario to Montréal, Québec and to increase the capacity by 60,000 b/d from 240,000 b/d. The target in-service date for the Line 9B reversal is Q4 2014.
4.6.2 TransCanada Energy EastThe TransCanada Energy East Pipeline Project includes the conversion of a natural gas pipeline to oil service and new pipeline segments to provide transportation service from Hardisty, Alberta and Moosomin, Saskatchewan to delivery points in Québec and New Brunswick. The delivery points include three existing refineries in Eastern Canada and two marine terminals, one at Cacouna, Québec and one at Saint John, New Brunswick to allow for exports to international markets. The proposed pipeline would have a capacity of 1.1 million b/d, of which 900,000 b/d is underpinned by firm contracts. The scheduled in-service date for the project is Q4 2018.
4.7 Diluent PipelinesTable 4.6 provides a summary of projects which aim to bring diluent supply which may be required to satisfying growing supply of heavy oil from Western Canada.
4.7.1 Enbridge Southern LightsThe Southern Lights pipeline which runs from Manhattan, Illinois (near Chicago) to Edmonton, Alberta has been moving diluent since 2010. The current capacity of the pipelineis180,000b/d.About43percent(77,000b/d)ofthis capacity is allocated to committed shippers.
Enbridgeofferedanother50,000b/dofcapacityonthepipeline for commitments from shippers through an Open SeasonheldfromJanuary28toFebruary27,2013.Potential shippers were given a choice of five available start dates between July 1, 2013 and July 1, 2014. All contracts wouldexpireonJune30,2025,withanoptiontoextendthetermforanadditional15years.Theminimumvolumecommitmentwillbe5,000b/d.DuetothesuccessoftheOpen Season, Enbridge is developing a future expansion of the Southern Lights system to increase capacity to 275,000b/dthroughtheuseofadditionalhorsepoweranddrag reducing agents.
Table 4.5 Summary of Crude Oil Pipelines to Eastern Canada
Pipeline Originating Point Destination Status Capacity(thousand b/d)
Enbridge Line 9 re-Reversal 9A 9B
Sarnia, ON Sarnia, ON North Westover, ON
Montréal, QC North Westover, ON Montréal, QC
Proposed Operating since Aug 2013 Q3 2014
+300
TransCanada Energy East Hardisty, AB Québec City, QC / St. John, NB
Proposed - Q4 2018 +1,100
Table 4.6 Summary of Diluent Pipelines
Pipeline Originating Point Destination Status Capacity(thousand b/d)
Enbridge Southern LightsSouthern Lights Expansion
Flanagan, IL Edmonton, AB OperatingProposed - TBD
180+95
Enbridge Northern Gateway Kitimat, BC Bruderheim, AB Proposed - Q3 2018 +193
Kinder Morgan Cochin Conversion
Kankakee County, IL Fort Saskatchewan, AB
Proposed - Q3 2014 +95
TransCanada Grand Rapids Heartland, AB Fort McMurray, AB Proposed-2017 +330
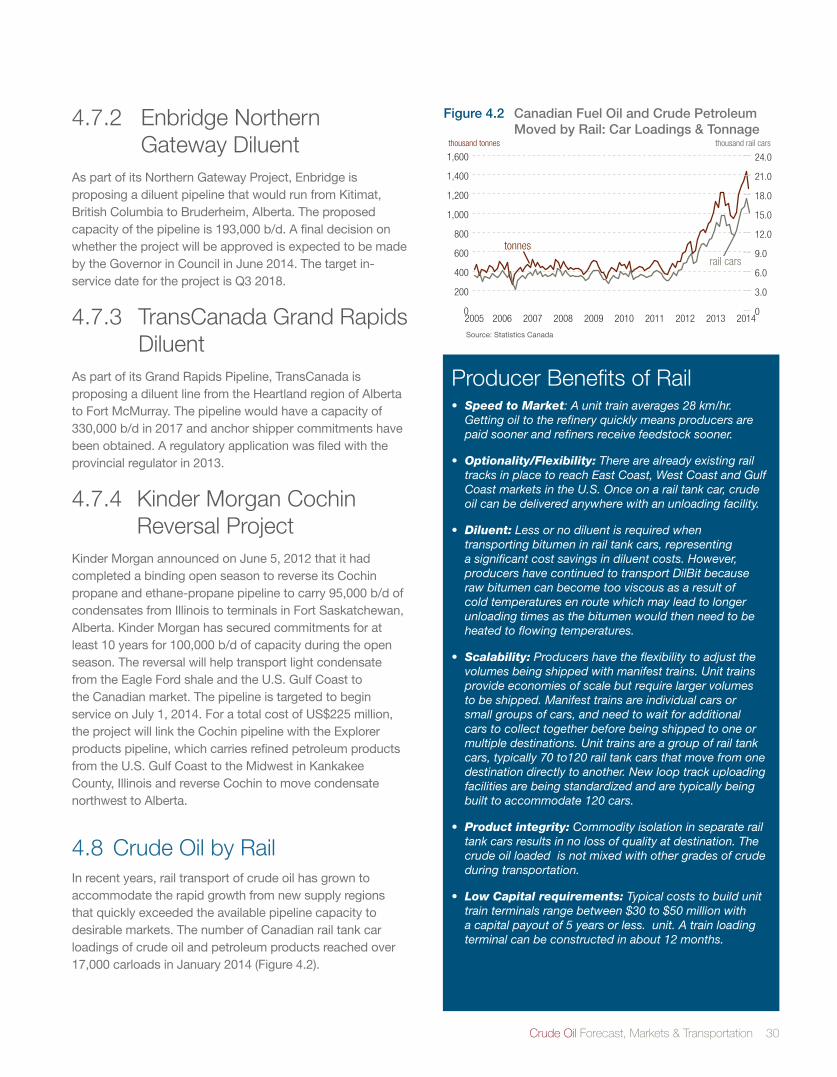
Crude Oil Forecast, Markets & Transportation 30
4.7.2 Enbridge Northern Gateway Diluent
As part of its Northern Gateway Project, Enbridge is proposing a diluent pipeline that would run from Kitimat, British Columbia to Bruderheim, Alberta. The proposed capacity of the pipeline is 193,000 b/d. A final decision on whether the project will be approved is expected to be made by the Governor in Council in June 2014. The target in-service date for the project is Q3 2018.
4.7.3 TransCanada Grand Rapids Diluent
As part of its Grand Rapids Pipeline, TransCanada is proposing a diluent line from the Heartland region of Alberta to Fort McMurray. The pipeline would have a capacity of 330,000b/din2017andanchorshippercommitmentshavebeen obtained. A regulatory application was filed with the provincial regulator in 2013.
4.7.4 Kinder Morgan Cochin Reversal Project
KinderMorganannouncedonJune5,2012thatithadcompleted a binding open season to reverse its Cochin propaneandethane-propanepipelinetocarry95,000b/dofcondensates from Illinois to terminals in Fort Saskatchewan, Alberta. Kinder Morgan has secured commitments for at least 10 years for 100,000 b/d of capacity during the open season. The reversal will help transport light condensate from the Eagle Ford shale and the U.S. Gulf Coast to the Canadian market. The pipeline is targeted to begin serviceonJuly1,2014.ForatotalcostofUS$225million,the project will link the Cochin pipeline with the Explorer products pipeline, which carries refined petroleum products from the U.S. Gulf Coast to the Midwest in Kankakee County, Illinois and reverse Cochin to move condensate northwest to Alberta.
4.8 Crude Oil by RailIn recent years, rail transport of crude oil has grown to accommodate the rapid growth from new supply regions that quickly exceeded the available pipeline capacity to desirable markets. The number of Canadian rail tank car loadings of crude oil and petroleum products reached over 17,000carloadsinJanuary2014(Figure4.2).
Figure 4.2 Canadian Fuel Oil and Crude Petroleum Moved by Rail: Car Loadings & Tonnage
Source: Statistics Canada
thousand tonnes
0
200
400
600
800
1,000
1,200
1,400
1,600
20142013201220112010200920082007200620050
3.0
6.0
9.0
12.0
15.0
18.0
21.0
24.0
tonnesrail cars
thousand rail cars
Producer Benefits of Rail • Speed to Market: A unit train averages 28 km/hr.
Getting oil to the refinery quickly means producers are paid sooner and refiners receive feedstock sooner.
• Optionality/Flexibility: There are already existing rail tracks in place to reach East Coast, West Coast and Gulf Coast markets in the U.S. Once on a rail tank car, crude oil can be delivered anywhere with an unloading facility.
• Diluent: Less or no diluent is required when transporting bitumen in rail tank cars, representing a significant cost savings in diluent costs. However, producers have continued to transport DilBit because raw bitumen can become too viscous as a result of cold temperatures en route which may lead to longer unloading times as the bitumen would then need to be heated to flowing temperatures.
• Scalability: Producers have the flexibility to adjust the volumes being shipped with manifest trains. Unit trains provide economies of scale but require larger volumes to be shipped. Manifest trains are individual cars or small groups of cars, and need to wait for additional cars to collect together before being shipped to one or multiple destinations. Unit trains are a group of rail tank cars, typically 70 to120 rail tank cars that move from one destination directly to another. New loop track uploading facilities are being standardized and are typically being built to accommodate 120 cars.
• Product integrity: Commodity isolation in separate rail tank cars results in no loss of quality at destination. The crude oil loaded is not mixed with other grades of crude during transportation.
• Low Capital requirements: Typical costs to build unit train terminals range between $30 to $50 million with a capital payout of 5 years or less. unit. A train loading terminal can be constructed in about 12 months.
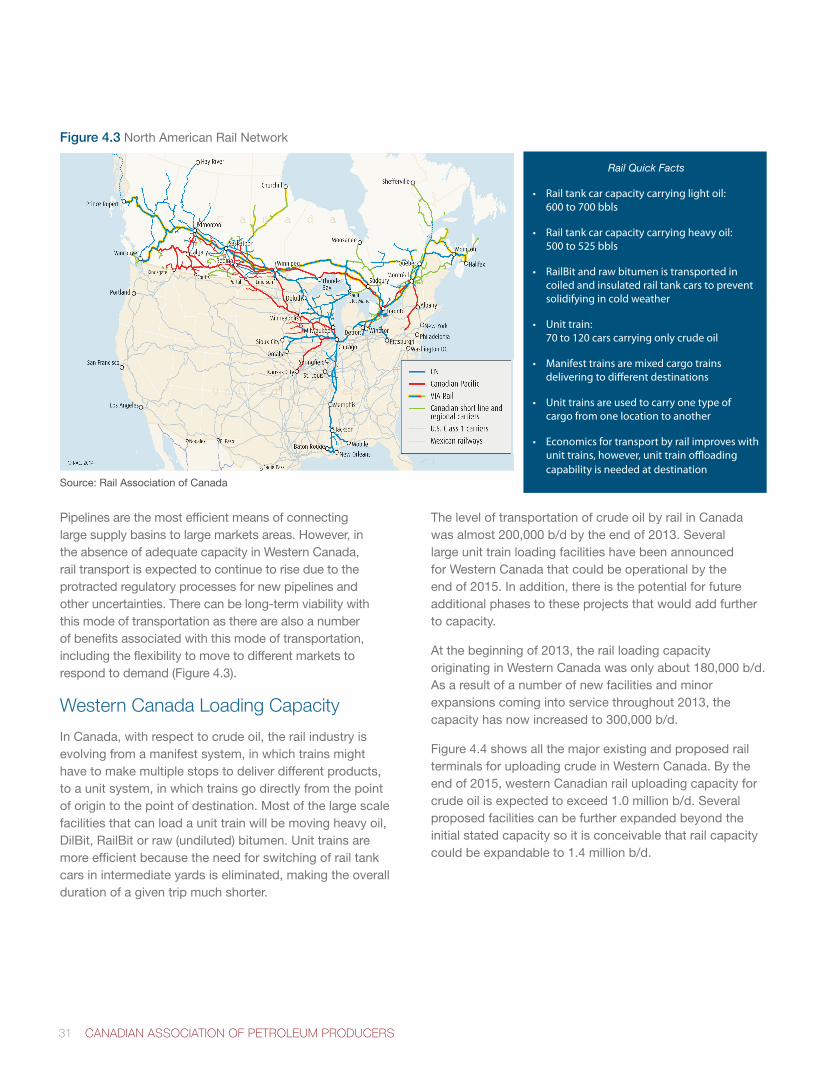
31 CANADIAN ASSOCIATION OF PETROLEUM PRODUCERS
Pipelines are the most efficient means of connecting large supply basins to large markets areas. However, in the absence of adequate capacity in Western Canada, rail transport is expected to continue to rise due to the protracted regulatory processes for new pipelines and other uncertainties. There can be long-term viability with this mode of transportation as there are also a number of benefits associated with this mode of transportation, including the flexibility to move to different markets to respond to demand (Figure 4.3).
Western Canada Loading Capacity
In Canada, with respect to crude oil, the rail industry is evolving from a manifest system, in which trains might have to make multiple stops to deliver different products, to a unit system, in which trains go directly from the point of origin to the point of destination. Most of the large scale facilities that can load a unit train will be moving heavy oil, DilBit, RailBit or raw (undiluted) bitumen. Unit trains are more efficient because the need for switching of rail tank cars in intermediate yards is eliminated, making the overall duration of a given trip much shorter.
The level of transportation of crude oil by rail in Canada was almost 200,000 b/d by the end of 2013. Several large unit train loading facilities have been announced for Western Canada that could be operational by the endof2015.Inaddition,thereisthepotentialforfutureadditional phases to these projects that would add further to capacity.
At the beginning of 2013, the rail loading capacity originating in Western Canada was only about 180,000 b/d. As a result of a number of new facilities and minor expansions coming into service throughout 2013, the capacity has now increased to 300,000 b/d.
Figure 4.4 shows all the major existing and proposed rail terminals for uploading crude in Western Canada. By the endof2015,westernCanadianrailuploadingcapacityforcrude oil is expected to exceed 1.0 million b/d. Several proposed facilities can be further expanded beyond the initial stated capacity so it is conceivable that rail capacity could be expandable to 1.4 million b/d.
Rail Quick Facts
• Railtankcarcapacitycarryinglightoil: 600to700bbls
• Railtankcarcapacitycarryingheavyoil: 500to525bbls
• RailBitandrawbitumenistransportedincoiledandinsulatedrailtankcarstopreventsolidifyingincoldweather
• Unittrain: 70to120carscarryingonlycrudeoil
• Manifesttrainsaremixedcargotrainsdeliveringtodifferentdestinations
• Unittrainsareusedtocarryonetypeofcargofromonelocationtoanother
• Economicsfortransportbyrailimproveswithunittrains,however,unittrainoffloadingcapabilityisneededatdestination
Figure 4.3 North American Rail Network
Source: Rail Association of Canada
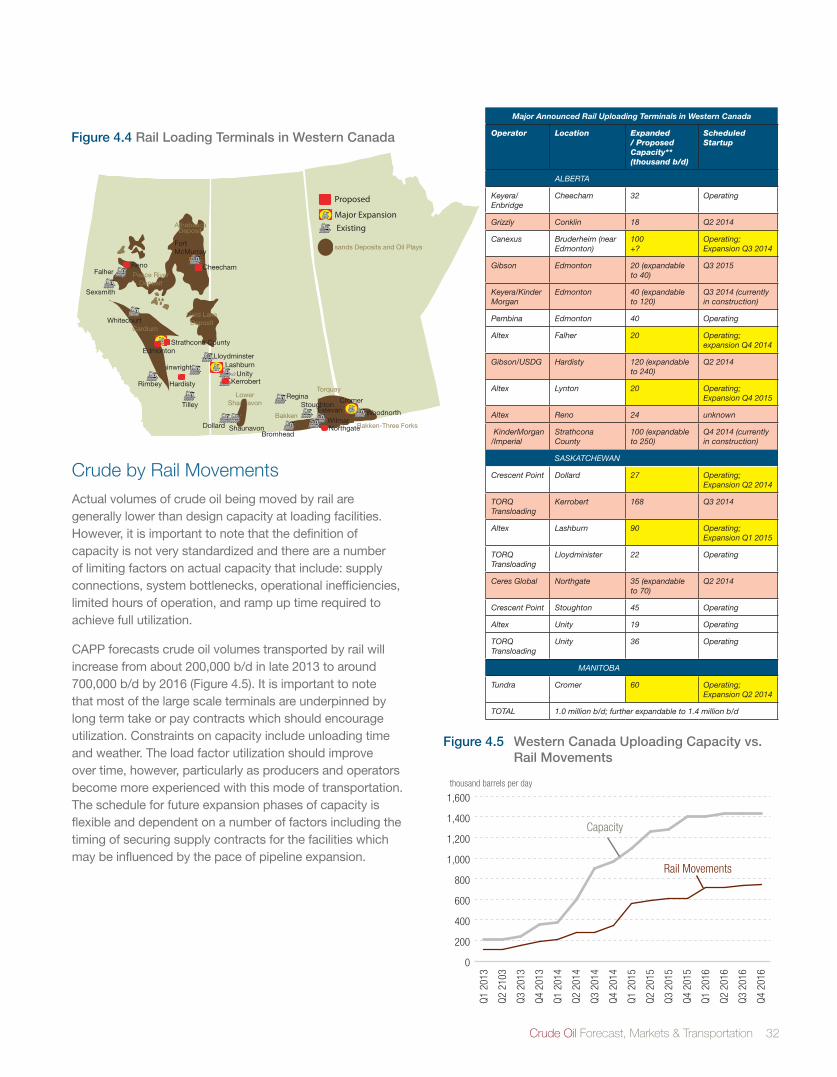
Crude Oil Forecast, Markets & Transportation 32
Figure 4.4 Rail Loading Terminals in Western Canada
Lloydminster
UnityKerrobert
Lashburn
HardistyRimbey
Wainwright
Tilley
Bromhead
Regina
FortMcMurray
Athabasca Deposit
Peace RiverDeposit
Cold LakeDeposit
Cromer
Woodnorth
NorthgateWilmar
EstevanStoughton
Dollard Shaunavon
Major ExpansionExisting
TorquayLower
Shaunavon
Oil sands Deposits and Oil Plays
Bakken-Three Forks
Bakken
Whitecourt
Edmonton
Cardium
Cheecham
Strathcona County
RenoFalher
Proposed
x2
Sexsmith
Major Announced Rail Uploading Terminals in Western Canada
Operator Location Expanded / Proposed Capacity** (thousand b/d)
Scheduled Startup
ALBERTA
Keyera/Enbridge
Cheecham 32 Operating
Grizzly Conklin 18 Q2 2014
Canexus Bruderheim (near Edmonton)
100+?
Operating; Expansion Q3 2014
Gibson Edmonton 20 (expandable to 40)
Q3 2015
Keyera/Kinder Morgan
Edmonton 40 (expandable to 120)
Q3 2014 (currently in construction)
Pembina Edmonton 40 Operating
Altex Falher 20 Operating; expansion Q4 2014
Gibson/USDG Hardisty 120 (expandable to 240)
Q2 2014
Altex Lynton 20 Operating; Expansion Q4 2015
Altex Reno 24 unknown
KinderMorgan/Imperial
Strathcona County
100 (expandable to 250)
Q4 2014 (currently in construction)
SASKATCHEWAN
Crescent Point Dollard 27 Operating; Expansion Q2 2014
TORQ Transloading
Kerrobert 168 Q3 2014
Altex Lashburn 90 Operating; Expansion Q1 2015
TORQ Transloading
Lloydminister 22 Operating
Ceres Global Northgate 35 (expandable to 70)
Q2 2014
Crescent Point Stoughton 45 Operating
Altex Unity 19 Operating
TORQ Transloading
Unity 36 Operating
MANITOBA
Tundra Cromer 60 Operating; Expansion Q2 2014
TOTAL 1.0 million b/d; further expandable to 1.4 million b/d
Crude by Rail MovementsActual volumes of crude oil being moved by rail are generally lower than design capacity at loading facilities. However, it is important to note that the definition of capacity is not very standardized and there are a number of limiting factors on actual capacity that include: supply connections, system bottlenecks, operational inefficiencies, limited hours of operation, and ramp up time required to achieve full utilization.
CAPP forecasts crude oil volumes transported by rail will increase from about 200,000 b/d in late 2013 to around 700,000b/dby2016(Figure4.5).Itisimportanttonotethat most of the large scale terminals are underpinned by long term take or pay contracts which should encourage utilization. Constraints on capacity include unloading time and weather. The load factor utilization should improve over time, however, particularly as producers and operators become more experienced with this mode of transportation. The schedule for future expansion phases of capacity is flexible and dependent on a number of factors including the timing of securing supply contracts for the facilities which may be influenced by the pace of pipeline expansion.
Figure 4.5 Western Canada Uploading Capacity vs. Rail Movements
thousand barrels per day
0
200
400
600
800
1,000
1,200
1,400
1,600
Q4 2
016
Q3 2
016
Q2 2
016
Q1 2
016
Q4 2
015
Q3 2
015
Q2 2
015
Q1 2
015
Q4 2
014
Q3 2
014
Q2 2
014
Q1 2
014
Q4 2
013
Q3 2
013
Q2 2
103
Q1 2
013
Rail Movements
Capacity
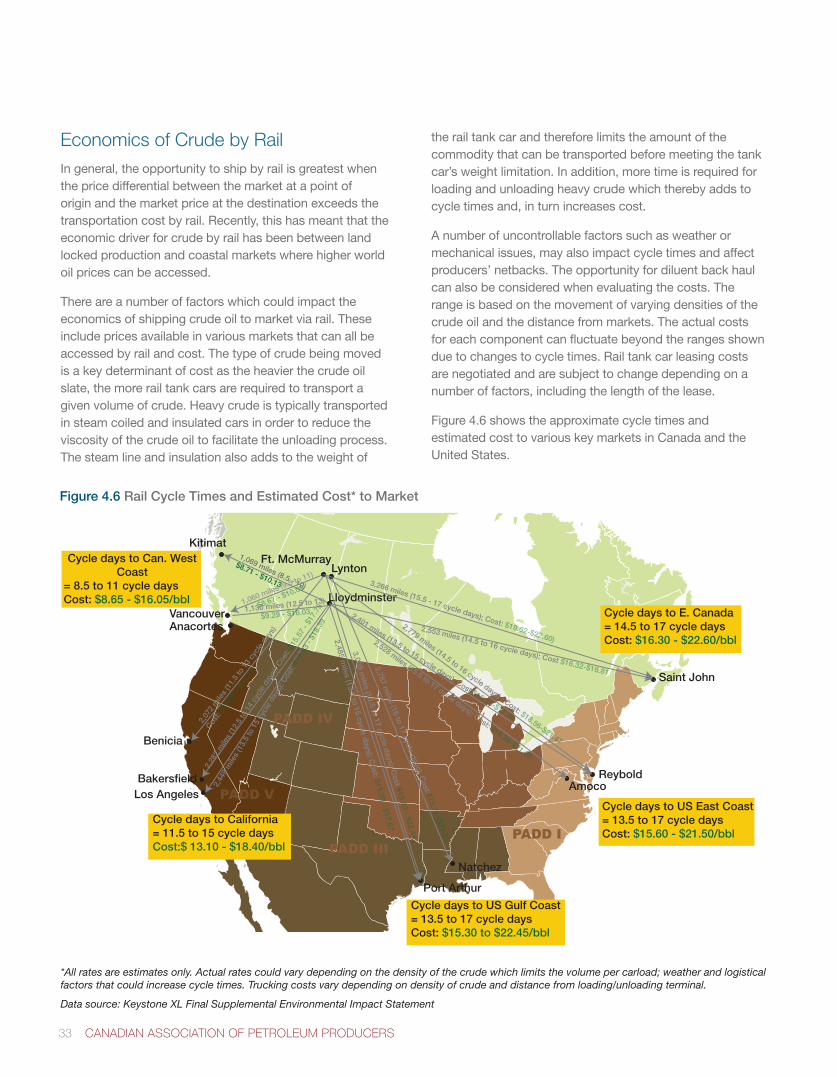
33 CANADIAN ASSOCIATION OF PETROLEUM PRODUCERS
Economics of Crude by RailIn general, the opportunity to ship by rail is greatest when the price differential between the market at a point of origin and the market price at the destination exceeds the transportation cost by rail. Recently, this has meant that the economic driver for crude by rail has been between land locked production and coastal markets where higher world oil prices can be accessed.
There are a number of factors which could impact the economics of shipping crude oil to market via rail. These include prices available in various markets that can all be accessed by rail and cost. The type of crude being moved is a key determinant of cost as the heavier the crude oil slate, the more rail tank cars are required to transport a given volume of crude. Heavy crude is typically transported in steam coiled and insulated cars in order to reduce the viscosity of the crude oil to facilitate the unloading process. The steam line and insulation also adds to the weight of
the rail tank car and therefore limits the amount of the commodity that can be transported before meeting the tank car’s weight limitation. In addition, more time is required for loading and unloading heavy crude which thereby adds to cycle times and, in turn increases cost.
A number of uncontrollable factors such as weather or mechanical issues, may also impact cycle times and affect producers’ netbacks. The opportunity for diluent back haul can also be considered when evaluating the costs. The range is based on the movement of varying densities of the crude oil and the distance from markets. The actual costs for each component can fluctuate beyond the ranges shown due to changes to cycle times. Rail tank car leasing costs are negotiated and are subject to change depending on a number of factors, including the length of the lease.
Figure 4.6 shows the approximate cycle times and estimated cost to various key markets in Canada and the United States.
PADD V
PADD IV
PADD II
PADD IPADD III
Los Angeles
Lloydminster
AnacortesVancouver
Ft. McMurrayLynton
Kitimat
Benicia
Bakersfield
Saint John
ReyboldAmoco
Port Arthur
Natchez
1,069 miles (8.5 - 10)
$8.71 - $10.13
2,44
9 m
iles
(13.
5 to
15
cycl
e da
ys);
Cos
t: $1
5.93
- $1
8.39
2,28
2 m
iles
(12.
5 to
14
cycl
e da
ys);
Cos
t: $1
5.57
- $1
7.78
1,060 miles (9.5 to 11)
$8.67 - $10.09
2,553 miles (14.5 to 16 cycle days); Cost $16.32-$18.81
3,266 miles (15.5 - 17 cycle days); Cost: $19.62-$22.60)
2,401 miles (13.5 to 15 cycle days); Cost:$15.55-$17.98
2,528 miles (15.5 to 17 cycle days); Cost: $18.26-$21.05
3,009 miles (15.5 to 17 cycle days); C
ost $19.43 - $22.44
2,787 miles (16 to 17 cycle days); C
ost:$19.71 -$21.55
2,485 miles (13.5 to 15 cycle d
ays); Cost: $15.29 - $17.67
2,07
2 m
iles
(11.
5 to
13
cycl
e da
ys)
Cost:
$13.
08 -
$14.
75
Cycle days to US East Coast = 13.5 to 17 cycle daysCost: $15.60 - $21.50/bbl
Cycle days to US Gulf Coast = 13.5 to 17 cycle daysCost: $15.30 to $22.45/bbl
Cycle days to California= 11.5 to 15 cycle daysCost:$ 13.10 - $18.40/bbl
Cycle days to Can. West Coast
= 8.5 to 11 cycle daysCost: $8.65 - $16.05/bbl
Cycle days to E. Canada= 14.5 to 17 cycle daysCost: $16.30 - $22.60/bbl
2,779 miles (14.5 to 16 cycle days) ; Cost: $18.56-$21.47
1,130 miles (12.5 to 13)
$9.29 - $16.03
Figure 4.6 Rail Cycle Times and Estimated Cost* to Market
*All rates are estimates only. Actual rates could vary depending on the density of the crude which limits the volume per carload; weather and logistical factors that could increase cycle times. Trucking costs vary depending on density of crude and distance from loading/unloading terminal.
Data source: Keystone XL Final Supplemental Environmental Impact Statement
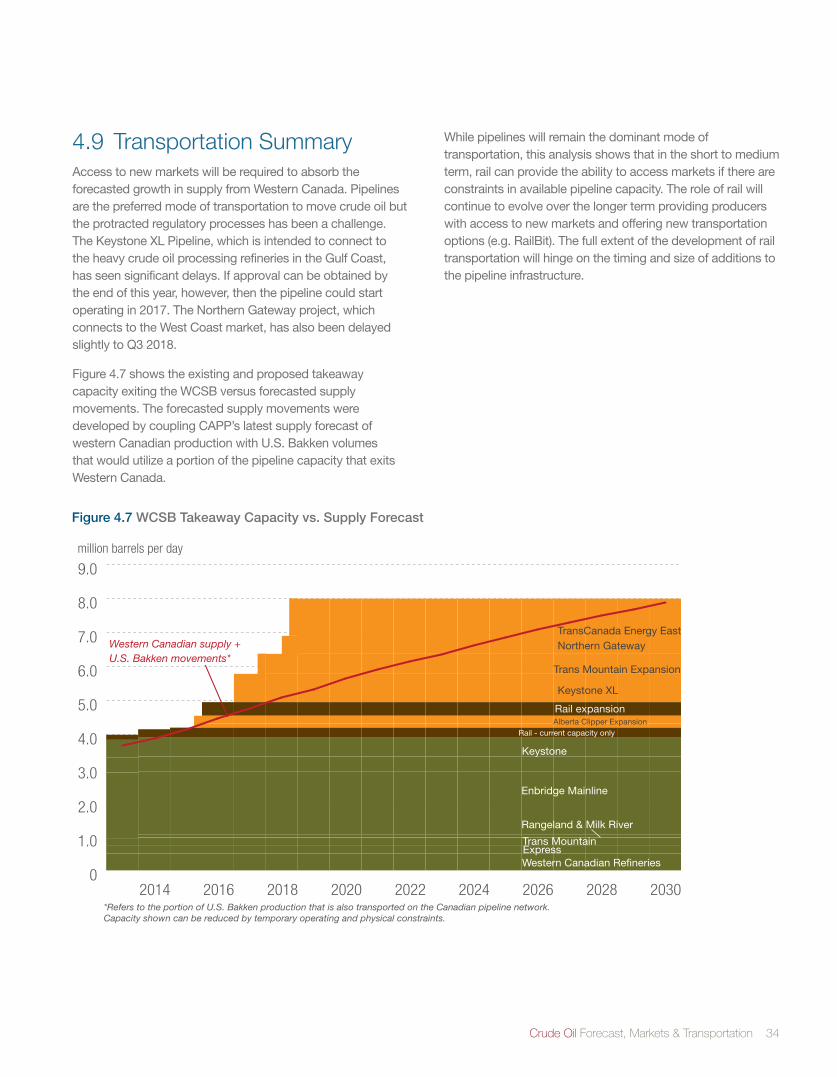
Crude Oil Forecast, Markets & Transportation 34
0
1.0
2.0
3.0
4.0
5.0
6.0
7.0
8.0
9.0
203020282026202420222020201820162014
million barrels per day
Western Canadian RefineriesExpressTrans Mountain
Enbridge Mainline
Keystone
Rail - current capacity only
Rangeland & Milk River
TransCanada Energy East
Trans Mountain Expansion
Northern Gateway
Alberta Clipper Expansion
Keystone XL
Rail expansion
Western Canadian supply + U.S. Bakken movements*
*Refers to the portion of U.S. Bakken production that is also transported on the Canadian pipeline network.Capacity shown can be reduced by temporary operating and physical constraints.
Figure 4.7 WCSB Takeaway Capacity vs. Supply Forecast
4.9 Transportation SummaryAccess to new markets will be required to absorb the forecasted growth in supply from Western Canada. Pipelines are the preferred mode of transportation to move crude oil but the protracted regulatory processes has been a challenge. The Keystone XL Pipeline, which is intended to connect to the heavy crude oil processing refineries in the Gulf Coast, has seen significant delays. If approval can be obtained by the end of this year, however, then the pipeline could start operatingin2017.TheNorthernGatewayproject,whichconnects to the West Coast market, has also been delayed slightly to Q3 2018.
Figure4.7showstheexistingandproposedtakeawaycapacity exiting the WCSB versus forecasted supply movements. The forecasted supply movements were developed by coupling CAPP’s latest supply forecast of western Canadian production with U.S. Bakken volumes that would utilize a portion of the pipeline capacity that exits Western Canada.
While pipelines will remain the dominant mode of transportation, this analysis shows that in the short to medium term, rail can provide the ability to access markets if there are constraints in available pipeline capacity. The role of rail will continue to evolve over the longer term providing producers with access to new markets and offering new transportation options (e.g. RailBit). The full extent of the development of rail transportation will hinge on the timing and size of additions to the pipeline infrastructure.
35 CANADIAN ASSOCIATION OF PETROLEUM PRODUCERS
GLOSSARY
API Gravity A specific gravity scale developed by the American Petroleum Institute (API) for measuring the relative density or viscosity of various petroleum liquids.
Barrel Astandardoilbarrelisapproximatelyequalto35Imperialgallons(42U.S.gallons)orapproximately159litres.
Bitumen A heavy, viscous oil that must be processed extensively to convert it into a crude oil before it can be used by refineries to produce gasoline and other petroleum products.
Coker The processing unit in which bitumen is cracked into lighter fractions and withdrawn to start the conversion of bitumen into upgraded crude oil.
Condensate A mixture of mainly pentanes and heavier hydrocarbons. It may be gaseous in its reservoir state but is liquid at the conditions under which its volumes is measured or estimated.
Crude oil (Conventional) A mixture of pentanes and heavier hydrocarbons that is recovered or is recoverable at a well from an underground reservoir. It is liquid at the conditions under which its volumes is measured or estimated and includes all other hydrocarbon mixtures so recovered or recoverable except raw gas, condensate, or bitumen.
Crude oil (heavy) Crudeoilisdeemed,inthisreport,tobeheavycrudeoilifithasanAPIof27ºorless. No differentiation is made between sweet and sour crude oil that falls in the heavy category because heavy crude oil is generally sour.
Crude oil (medium) Crudeoilisdeemed,inthisreport,tobemediumcrudeoilifithasanAPIgreaterthan27ºbutlessthan30º.Nodifferentiationismadebetweensweetandsourcrudeoilthatfallsinthemedium category because medium crude oil is generally sour.
Crude oil (synthetic) A mixture of hydrocarbons, similar to crude oil, derived by upgrading bitumen from the oil sands.
Density The mass of matter per unit volume.
DilBit Bitumen that has been reduced in viscosity through addition of a diluent (or solvent) such as condensate or naphtha.
Diluent Lighter viscosity petroleum products that are used to dilute bitumen for transportation in pipelines.
Extraction A process unique to the oil sands industry, in which bitumen is separated from their source (oil sands).
Feedstock In this report, feedstock refers to the raw material supplied to a refinery or oil sands upgrader.
Integrated mining A combined mining and upgrading operation where oil sands are mined from open pits. project The bitumen is then separated from the sand and upgraded by a refining process.
In Situ recovery The process of recovering crude bitumen from oil sands by drilling.
Merchant upgrader Processing facilities that are not linked to any specific extraction project but is designed to accept raw bitumen on a contract basis from producers.
Crude Oil Forecast, Markets & Transportation 36
Oil Condensate, crude oil, or a constituent of raw gas, condensate, or crude oil that is recovered in processing and is liquid at the conditions under which its volume is measured or estimated.
Oil sands Refers to a mixture of sand and other rock materials containing crude bitumen or the crude bitumen contained in those sands.
Oil Sands Deposit A natural reservoir containing or appearing to contain an accumulation of oil sands separated or appearing to be separated from any other such accumulation. The AER has designated three areas in Alberta as oil sands areas.
Oil Sands Heavy In this report, Oil Sands Heavy includes upgraded heavy sour crude oil, and bitumen to which light oil fractions (i.e. diluent or upgraded crude oil) have been added in order to reduce its viscosity and density to meet pipeline specifications.
Open Season A period of time designated by a pipeline company to determine shipper interest on a proposed project. Potential customers can indicate their interest/support by signing a transportation services agreement for capacity on the pipeline.
Pentanes Plus A mixture mainly of pentanes and heavier hydrocarbons that ordinarily may contain some butanes and is obtained from the processing of raw gas, condensate or crude oil.
PADD Petroleum Administration for Defense District that defines a market area for crude oil in the U.S.
Refined Petroleum End products in the refining process (e.g. gasoline). Products
Specification Defined properties of a crude oil or refined petroleum product.
SynBit A blend of bitumen and synthetic crude oil that has similar properties to medium sour crude oil.
Train (Manifest) Manifest trains carry multiple cargoes and make multiple stops. These are small group or single car load.
Train (Unit) Unit trains carry a single cargo and deliver a single shipment to one destination, lowering the cost and shortening the trip.
Upgrading The process that converts bitumen or heavy crude oil into a product with a lower density and viscosity.
West Texas Intermediate WTI is a light sweet crude oil, produced in the United States, which is the benchmark grade of crude oil for North American price quotations.
37 CANADIAN ASSOCIATION OF PETROLEUM PRODUCERS
APPENDIX A ACRONYMS, ABBREVIATIONS, UNITS AND CONVERSION FACTORS
Acronyms API American Petroleum Institute
AER Alberta Energy Regulator
CAPP Canadian Association of Petroleum Producers
EIA Energy Information Administration
FERC Federal Energy Regulatory Commission
IEA International Energy Agency
NEB National Energy Board
PADD Petroleum Administration for Defense District
U.S. United States
WCSB Western Canada Sedimentary Basin
WTI West Texas Intermediate
Canadian Provincial AbbreviationsAB Alberta
BC British Columbia
MB Manitoba
NWT Northwest Territories
ON Ontario
QC Québec
SK Saskatchewan
Unitsb/d barrels per day
Conversion Factor1 cubic metre = 6.293 barrels (oil)
Crude Oil Forecast, Markets & Transportation 38
U.S. State AbbreviationsAL Alabama
AK Alaska
AZ Arizona
AR Arkansas
CA California
CO Colorado
CT Connecticut
DE Delaware
FL Florida
GA Georgia
ID Idaho
IL Illinois
IN Indiana
IA Iowa
KS Kansas
KY Kentucky
LA Louisiana
ME Maine
MD Maryland
MA Massachusetts
MI Michigan
MN Minnesota
MS Mississippi
MO Missouri
MT Montana
NE Nebraska
NV Nevada
NH New Hampshire
NJ New Jersey
NM New Mexico
NY New York
NC North Carolina
ND North Dakota
OH Ohio
OK Oklahoma
OR Oregon
PA Pennsylvania
SC South Carolina
SD South Dakota
TN Tennessee
TX Texas
UT Utah
VT Vermont
VA Virginia
VI Virgin Islands
WA Washington
WV West Virginia
WI Wisconsin
WY Wyoming
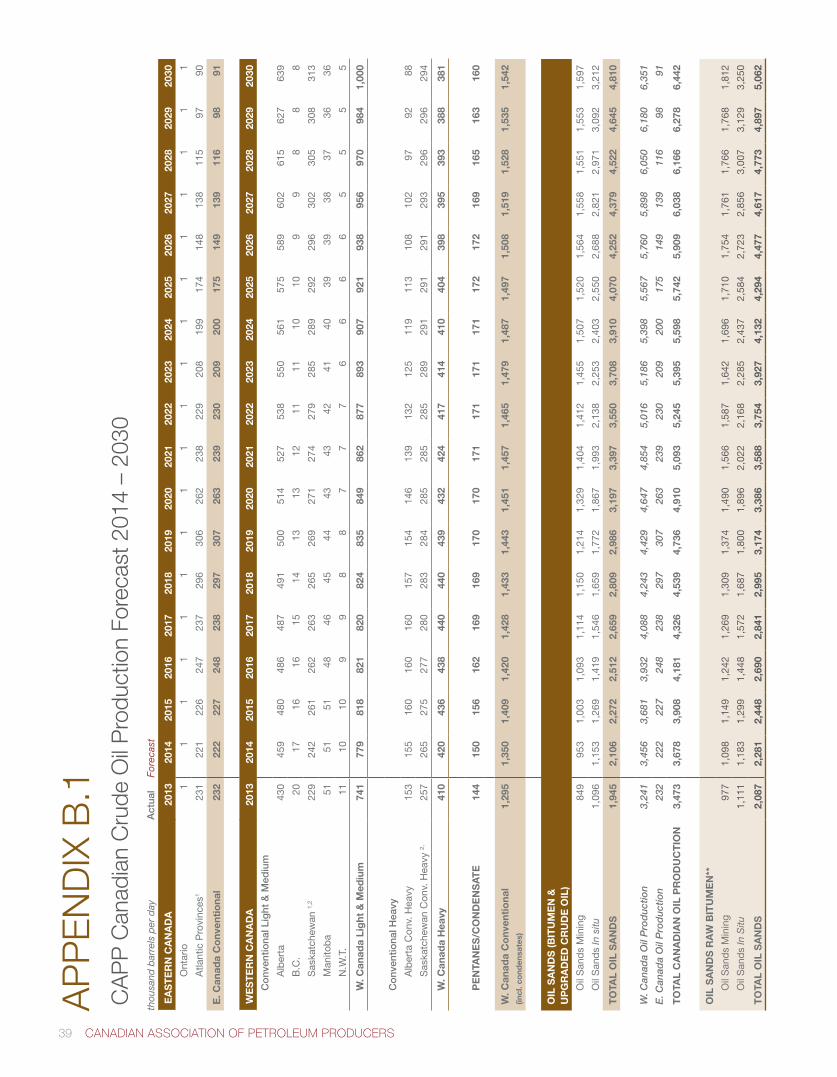
39 CANADIAN ASSOCIATION OF PETROLEUM PRODUCERS
AP
PE
ND
IX B
.1
CA
PP
Can
adia
n C
rude
Oil
Pro
duct
ion
Fore
cast
201
4 –
2030
thou
sand
bar
rels
per
day
Act
ual
Fore
cast
EA
ST
ER
N C
AN
AD
A20
1320
1420
1520
1620
1720
1820
1920
2020
2120
2220
2320
2420
2520
2620
2720
2820
2920
30
O
ntar
io1
11
11
11
11
11
11
11
11
1
A
tlant
ic P
rovi
nces
1 2
31
221
2
26
247
2
37
296
3
06
262
2
38
229
2
08
199
1
74
148
1
38
115
9
7 9
0
E. C
anad
a C
onv
enti
ona
l23
222
222
724
823
829
730
726
323
923
020
920
017
514
913
911
698
91
WE
ST
ER
N C
AN
AD
A20
1320
1420
1520
1620
1720
1820
1920
2020
2120
2220
2320
2420
2520
2620
2720
2820
2920
30
C
onv
entio
nal L
ight
& M
ediu
m
A
lber
ta43
045
948
048
648
749
150
051
452
753
855
056
157
558
960
261
562
763
9
B
.C.
2017
1616
1514
1313
1211
1110
109
98
88
S
aska
tche
wan
1,2
229
242
261
262
263
265
269
271
274
279
285
289
292
296
302
305
308
313
M
anito
ba
5151
5148
4645
4443
4342
4140
3939
3837
3636
N
.W.T
.11
1010
99
88
77
76
66
65
55
5
W
. Can
ada
Lig
ht &
Med
ium
741
779
818
821
820
824
835
849
862
877
893
907
921
938
956
970
984
1,00
0
C
onv
entio
nal H
eavy
A
lber
ta C
onv.
Hea
vy15
315
516
016
016
015
715
414
613
913
212
511
911
310
810
297
9288
S
aska
tche
wan
Con
v. H
eavy
2,25
726
527
527
728
028
328
428
528
528
528
929
129
129
129
329
629
629
4
W
. Can
ada
Hea
vy41
042
043
643
844
044
043
943
242
441
741
441
040
439
839
539
338
838
1
P
EN
TAN
ES
/CO
ND
EN
SAT
E14
415
015
616
216
916
917
017
017
117
117
117
117
217
216
916
516
316
0
W. C
anad
a C
onv
enti
ona
l (in
cl. c
ond
ensa
tes)
1,29
51,
350
1,40
91,
420
1,42
81,
433
1,44
31,
451
1,45
71,
465
1,47
91,
487
1,49
71,
508
1,51
91,
528
1,53
51,
542
OIL
SA
ND
S (B
ITU
ME
N &
U
PG
RA
DE
D C
RU
DE
OIL
)
O
il S
and
s M
inin
g 84
995
31,
003
1,09
31,
114
1,15
01,
214
1,32
91,
404
1,41
21,
455
1,50
71,
520
1,56
41,
558
1,55
11,
553
1,59
7
O
il S
and
s In
situ
1,09
61,
153
1,26
91,
419
1,54
61,
659
1,77
21,
867
1,99
32,
138
2,25
32,
403
2,55
02,
688
2,82
12,
971
3,09
23,
212
TO
TAL
OIL
SA
ND
S1,
945
2,10
62,
272
2,51
22,
659
2,80
92,
986
3,19
73,
397
3,55
03,
708
3,91
04,
070
4,25
24,
379
4,52
24,
645
4,81
0
W. C
anad
a O
il P
rod
uctio
n3,
241
3,45
63,
681
3,93
24,
088
4,24
34,
429
4,64
74,
854
5,01
65,
186
5,39
85,
567
5,76
05,
898
6,05
06,
180
6,35
1
E. C
anad
a O
il P
rod
uctio
n23
222
222
724
823
829
730
726
323
923
020
920
017
514
913
911
698
91
TO
TAL
CA
NA
DIA
N O
IL P
RO
DU
CT
ION
3,47
33,
678
3,90
84,
181
4,32
64,
539
4,73
64,
910
5,09
35,
245
5,39
55,
598
5,74
25,
909
6,03
86,
166
6,27
86,
442
OIL
SA
ND
S R
AW
BIT
UM
EN
**
O
il S
and
s M
inin
g 97
71,
098
1,14
91,
242
1,26
91,
309
1,37
41,
490
1,56
61,
587
1,64
21,
696
1,71
01,
754
1,76
11,
766
1,76
81,
812
O
il S
and
s In
Situ
1,11
11,
183
1,29
91,
448
1,57
21,
687
1,80
01,
896
2,02
22,
168
2,28
52,
437
2,58
42,
723
2,85
63,
007
3,12
93,
250
TO
TAL
OIL
SA
ND
S2,
087
2,28
12,
448
2,69
02,
841
2,99
53,
174
3,38
63,
588
3,75
43,
927
4,13
24,
294
4,47
74,
617
4,77
34,
897
5,06
2
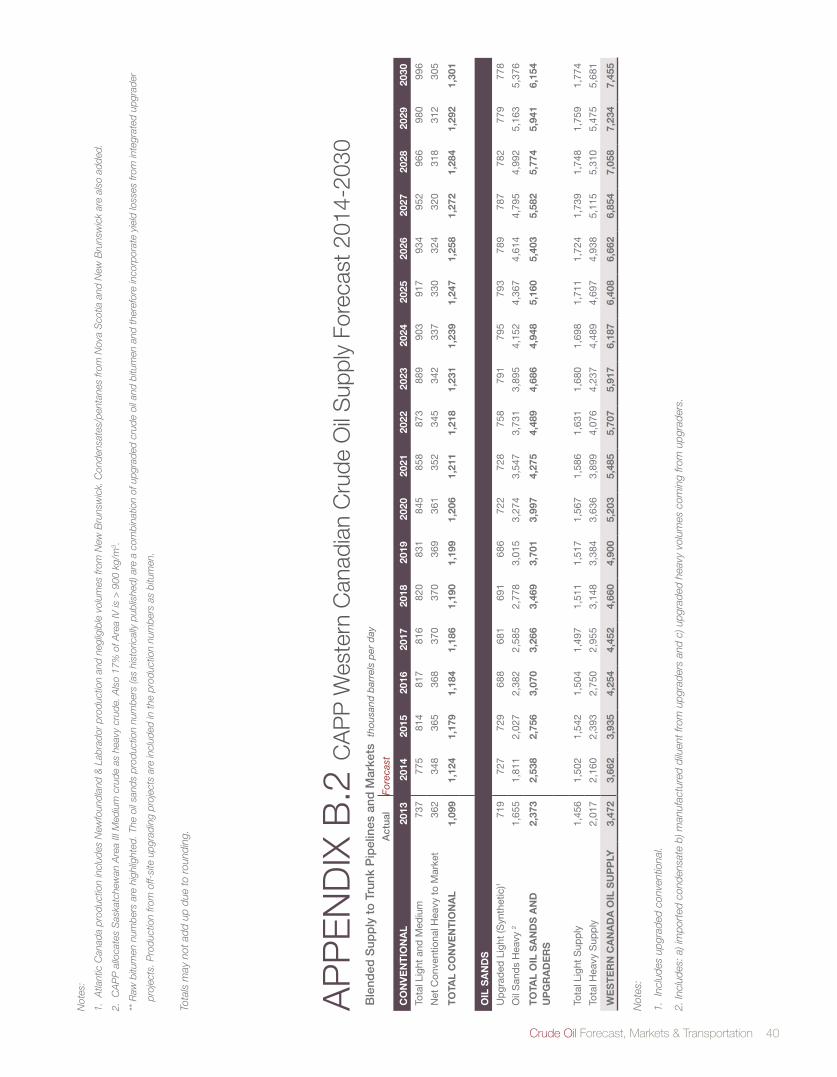
Crude Oil Forecast, Markets & Transportation 40
AP
PE
ND
IX B
.2 C
AP
P W
este
rn C
anad
ian
Cru
de O
il S
uppl
y Fo
reca
st 2
014-
2030
B
lend
ed S
upp
ly t
o T
runk
Pip
elin
es a
nd M
arke
ts t
hous
and
bar
rels
per
day
Act
ual
Fore
cast
CO
NV
EN
TIO
NA
L20
1320
1420
1520
1620
1720
1820
1920
2020
2120
2220
2320
2420
2520
2620
2720
2820
2920
30
Tota
l Lig
ht a
nd M
ediu
m73
777
581
481
781
682
083
184
585
887
388
990
391
793
495
296
698
099
6
Net
Con
vent
iona
l Hea
vy t
o M
arke
t36
234
836
536
837
037
036
936
135
234
534
233
733
032
432
031
831
230
5
TO
TAL
CO
NV
EN
TIO
NA
L1,
099
1,12
41,
179
1,18
41,
186
1,19
01,
199
1,20
61,
211
1,21
81,
231
1,23
91,
247
1,25
81,
272
1,28
41,
292
1,30
1
OIL
SA
ND
S
Up
grad
ed L
ight
(Syn
thet
ic)1
719
727
729
688
681
691
686
722
728
758
791
795
793
789
787
782
779
778
Oil
San
ds
Hea
vy 2
1,65
51,
811
2,02
72,
382
2,58
52,
778
3,01
53,
274
3,54
73,
731
3,89
54,
152
4,36
74,
614
4,79
54,
992
5,16
35,
376
TO
TAL
OIL
SA
ND
S A
ND
U
PG
RA
DE
RS
2,37
32,
538
2,75
63,
070
3,26
63,
469
3,70
13,
997
4,27
54,
489
4,68
64,
948
5,16
05,
403
5,58
25,
774
5,94
16,
154
Tota
l Lig
ht S
upp
ly1,
456
1,50
21,
542
1,50
41,
497
1,51
11,
517
1,56
71,
586
1,63
11,
680
1,69
81,
711
1,72
41,
739
1,74
81,
759
1,77
4
Tota
l Hea
vy S
upp
ly2,
017
2,16
02,
393
2,75
02,
955
3,14
83,
384
3,63
63,
899
4,07
64,
237
4,48
94,
697
4,93
85,
115
5,31
05,
475
5,68
1
WE
ST
ER
N C
AN
AD
A O
IL S
UP
PLY
3,47
23,
662
3,93
54,
254
4,45
24,
660
4,90
05,
203
5,48
55,
707
5,91
76,
187
6,40
86,
662
6,85
47,
058
7,23
47,
455
Not
es:
1. I
nclu
des
upgr
aded
con
vent
iona
l.
2. In
clud
es: a
) im
port
ed c
onde
nsat
e b)
man
ufac
ture
d di
luen
t fro
m u
pgra
ders
and
c) u
pgra
ded
heav
y vo
lum
es c
omin
g fro
m u
pgra
ders
.
Not
es:
1. A
tlant
ic C
anad
a pr
oduc
tion
incl
udes
New
foun
dlan
d &
Lab
rado
r pr
oduc
tion
and
negl
igib
le v
olum
es fr
om N
ew B
runs
wic
k. C
onde
nsat
es/p
enta
nes
from
Nov
a S
cotia
and
New
Bru
nsw
ick
are
also
add
ed.
2. C
AP
P a
lloca
tes
Sas
katc
hew
an A
rea
III M
ediu
m c
rude
as
heav
y cr
ude.
Als
o 17
% o
f Are
a IV
is >
900
kg/
m3 .
** R
aw b
itum
en n
umbe
rs a
re h
ighl
ight
ed. T
he o
il sa
nds
prod
uctio
n nu
mbe
rs (a
s hi
stor
ical
ly p
ublis
hed)
are
a c
ombi
natio
n of
upg
rade
d cr
ude
oil a
nd b
itum
en a
nd th
eref
ore
inco
rpor
ate
yiel
d lo
sses
from
inte
grat
ed u
pgra
der
proj
ects
. Pro
duct
ion
from
off-
site
upg
radi
ng p
roje
cts
are
incl
uded
in th
e pr
oduc
tion
num
bers
as
bitu
men
.
Tota
ls m
ay n
ot a
dd u
p du
e to
rou
ndin
g.
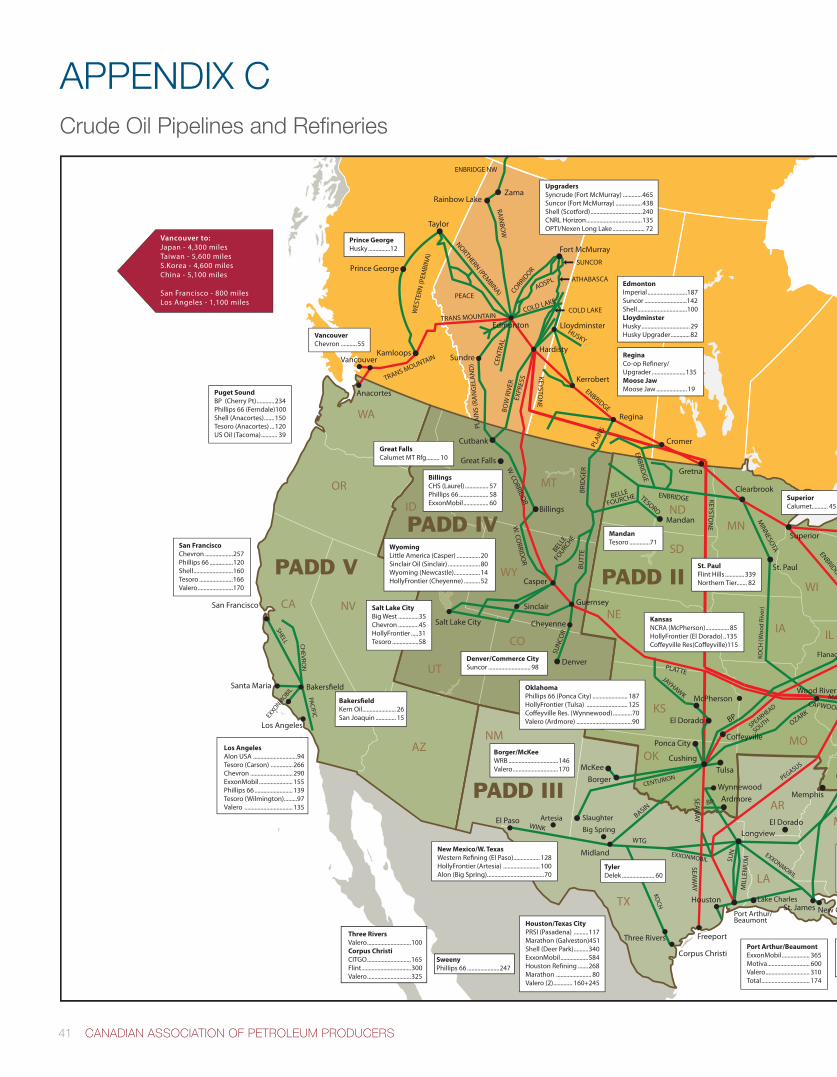
41 CANADIAN ASSOCIATION OF PETROLEUM PRODUCERS
APPENDIX CCrude Oil Pipelines and Refineries
Saint John
Hibernia White Rose
Montréal
Westover
Terra NovaHebron
MONTREALEALTTTREATREA
Vancouver to:Japan - 4,300 milesTaiwan - 5,600 milesS.Korea - 4,600 milesChina - 5,100 miles
San Francisco - 800 milesLos Angeles - 1,100 miles
Prince GeorgeHusky...............12
For Information Contact: (403) 267-1141 / www.capp.ca
2013 Canadian Crude Oil Production 000 m3/d 000 b/d
British Columbia 6 40Alberta 421 2,651Saskatchewan 77 487Manitoba 8 51Northwest Territories 2 11
Western Canada 515 3,241Eastern Canada 37 232Total Canada 552 3,473
Pipeline Tolls for Light Oil (US$ per barrel)Edmonton to Burnaby (Trans Mountain) 2.55 Anacortes (Trans Mountain/Puget) 2.80 Sarnia (Enbridge) 4.00 Chicago (Enbridge) 3.60 Wood River (Enbridge/Mustang/Capwood) 5.00 USGC (Enbridge/Spearhead/Seaway) 7.65*Hardisty to Guernsey (Express/Platte ) 1.60* Wood River (Express/Platte) 1.95* Wood River (Keystone) 4.70** USGC (Keystone/TC Gulf Coast) 7.00**
USEC to Montréal (Portland/Montréal) 1.50
St. James to Wood River (Capline/Capwood) 1.25
Pipeline Tolls for Heavy Oil (US$ per barrel)Hardisty to: Chicago (Enbridge) 4.05 Cushing (Enbridge/Spearhead) 5.20 Cushing (Keystone) 6.15** Cushing (Keystone) 6.50* Wood River (Enbridge/Mustang/Capwood) 5.85 Wood River (Keystone) 5.35** Wood River (Express/Platte) 2.40* USGC (Enbridge/Spearhead/Seaway) 8.65* USGC (Keystone/TC Gulf Coast) 7.95**
Notes 1) Assumed exchange rate = 0.92 US$ / 1C$ (May 2014 average) 2) Tolls rounded to nearest 5 cents 3) Tolls in e�ect July 1, 2014
* 10-year committed toll**20-year committed toll
Major Existing Crude Oil Pipelines carryingCanadian crude oilSelected Other Crude Oil Pipelines
Area Re�neries - Capacities as at Jun 1 , 2014(in ‘000s barrels per day)
Petroleum Administration for Defense District
FlanaganPhiladelphia
Savannah
Port Arthur/Beaumont
Artesia
Big Spring
Slaughter
WA
OR MT
CO
NDMN
IA
WI
IL
IN
MI
SD
NE
KS
MO
TN
TX
NM
LA
AR
AL
NC
VAWV
KY
PA
NY
NH
MA
OH
RICT
VT
ME
NJ
DEMD
SCGA
FL
MS
OK
WY
ID
UT
NVCA
CENTURION
KOCH
SPEARHEAD
SOUTH
ENBRIDGE LINE 9
PEGASUS
Come by Chance
Lake Charles
KOCH
(Woo
d Ri
ver)
SHELL CHEVRO
NPACIFIC
EXXONMOBIL
EXXONMOBIL
EXXONM
OBILKEYSTO
NE
KEYSTON
E
HUSKYRA
INBO
W
ENBRIDGE NW
AZ
VancouverChevron ...........55
Puget SoundBP (Cherry Pt)............234Phillips 66 (Ferndale) 100Shell (Anacortes).......150Tesoro (Anacortes) ...120US Oil (Tacoma)........... 39
San FranciscoChevron ...................257Phillips 66 ................120Shell...........................160Tesoro .......................166Valero........................170
Bakers�eldKern Oil....................... 26San Joaquin .............. 15
Great FallsCalumet MT Rfg......... 10
BillingsCHS (Laurel) ................ 57Phillips 66 .................... 58ExxonMobil................. 60
Los AngelesAlon USA ..............................94Tesoro (Carson) ............... 266Chevron ............................. 290ExxonMobil....................... 155Phillips 66 .......................... 139Tesoro (Wilmington).........97Valero ................................. 135
EdmontonImperial ...........................187Suncor .............................142Shell..................................100LloydminsterHusky.................................29Husky Upgrader.............82
ReginaCo-op Re�nery/Upgrader .......................135Moose JawMoose Jaw .....................19
NewfoundlandNorth Atlantic .................. 115
WyomingLittle America (Casper) ................20Sinclair Oil (Sinclair) ......................80Wyoming (Newcastle)..................14HollyFrontier (Cheyenne) ...........52
OhioBP-Husky (Toledo)...................... 160PBF (Toledo) ................................. 170Marathon (Canton) .......................80Husky (Lima)................................. 160Marathon (Catlettsburg) .......... 240
Mississippi RiverExxonMobil (Baton Rouge) ..... 503Chalmette...................................... 192Marathon (Garyville) ................. 522Motiva (Convent) ........................ 235Motiva (Norco)............................. 220Valero (Norco).............................. 270Valero (Meraux) ........................... 135Phillips 66 (Belle Chasse) ......... 247Alon (Krotz Springs)......................83Shell (St. Rose) *idled* .................55Placid (Port Allen) ..........................60
Houston/Texas CityPRSI (Pasadena) ..........117Marathon (Galveston) 451Shell (Deer Park)..........340ExxonMobil...................584Houston Re�ning .......268Marathon ........................ 80Valero (2)............. 160+245
MississippiChevron (Pascagoula) ............... 330AlabamaHunt (Tuscaloosa) .........................72Shell (Saraland) ..............................85
Three RiversValero..............................100Corpus ChristiCITGO..............................165Flint..................................300Valero..............................325
SweenyPhillips 66 ......................247
Lake CharlesCITGO................................425Phillips 66 ........................239Calcasieu............................ 75
Port Arthur/BeaumontExxonMobil................... 365Motiva............................. 600Valero.............................. 310Total................................. 174
Saint JohnIrving....................320
New JerseyPhillips 66 (Bayway) .....285PBF (Paulsboro) .............180Axeon SP (Paulsboro).... 70DelawarePBF (Delaware City) .....190
MemphisValero...................195El DoradoDelek ...................... 80
TylerDelek ...................... 60
DetroitMarathon............120
OklahomaPhillips 66 (Ponca City) ........................ 187HollyFrontier (Tulsa) ............................ 125Co¢eyville Res. (Wynnewood).............70Valero (Ardmore) ......................................90
New Mexico/W. TexasWestern Re�ning (El Paso).................. 128HollyFrontier (Artesia) ......................... 100Alon (Big Spring).......................................70
Borger/McKeeWRB ..................................146Valero...............................170
Denver/Commerce CitySuncor ............................. 98
Salt Lake CityBig West ..............35Chevron ..............45HollyFrontier .....31Tesoro ..................58
MandanTesoro ..............71
St. PaulFlint Hills .............339Northern Tier....... 82
KansasNCRA (McPherson)................ 85HollyFrontier (El Dorado)..135Co¢eyville Res(Co¢eyville) 115
SuperiorCalumet........... 45
ChicagoBP ............................. 413ExxonMobil............ 250PDV .......................... 180
SarniaImperial ............... 121Nova ........................80Shell.........................77Suncor ....................85NanticokeImperial ............... 112
Montréal/QuébecSuncor .....................137Valero.......................265
PennsylvaniaMonroe Energy.............................. 185Phil. Energy Solutions ................. 330Warren
United ......... 70
UpgradersSyncrude (Fort McMurray) .............465Suncor (Fort McMurray) ..................438Shell (Scotford)...................................240CNRL Horizon......................................135OPTI/Nexen Long Lake...................... 72
Wood RiverWRB .....................................314RobinsonMarathon...........................206Mt VernonCountrymark ...................... 27
& Labrador
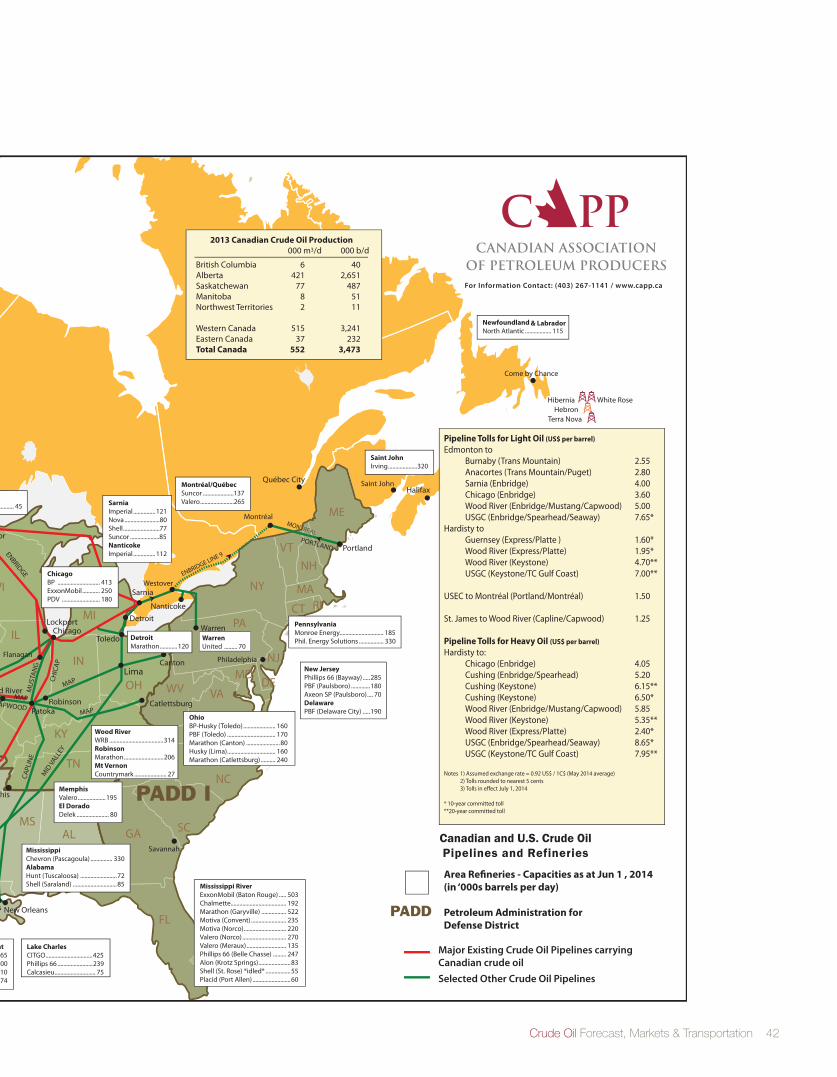
Crude Oil Forecast, Markets & Transportation 42
APPENDIX CCrude Oil Pipelines and Refineries
Saint John
Hibernia White Rose
Montréal
Westover
Terra NovaHebron
MONTREALEALTTTREATREA
Vancouver to:Japan - 4,300 milesTaiwan - 5,600 milesS.Korea - 4,600 milesChina - 5,100 miles
San Francisco - 800 milesLos Angeles - 1,100 miles
Prince GeorgeHusky...............12
For Information Contact: (403) 267-1141 / www.capp.ca
2013 Canadian Crude Oil Production 000 m3/d 000 b/d
British Columbia 6 40Alberta 421 2,651Saskatchewan 77 487Manitoba 8 51Northwest Territories 2 11
Western Canada 515 3,241Eastern Canada 37 232Total Canada 552 3,473
Pipeline Tolls for Light Oil (US$ per barrel)Edmonton to Burnaby (Trans Mountain) 2.55 Anacortes (Trans Mountain/Puget) 2.80 Sarnia (Enbridge) 4.00 Chicago (Enbridge) 3.60 Wood River (Enbridge/Mustang/Capwood) 5.00 USGC (Enbridge/Spearhead/Seaway) 7.65*Hardisty to Guernsey (Express/Platte ) 1.60* Wood River (Express/Platte) 1.95* Wood River (Keystone) 4.70** USGC (Keystone/TC Gulf Coast) 7.00**
USEC to Montréal (Portland/Montréal) 1.50
St. James to Wood River (Capline/Capwood) 1.25
Pipeline Tolls for Heavy Oil (US$ per barrel)Hardisty to: Chicago (Enbridge) 4.05 Cushing (Enbridge/Spearhead) 5.20 Cushing (Keystone) 6.15** Cushing (Keystone) 6.50* Wood River (Enbridge/Mustang/Capwood) 5.85 Wood River (Keystone) 5.35** Wood River (Express/Platte) 2.40* USGC (Enbridge/Spearhead/Seaway) 8.65* USGC (Keystone/TC Gulf Coast) 7.95**
Notes 1) Assumed exchange rate = 0.92 US$ / 1C$ (May 2014 average) 2) Tolls rounded to nearest 5 cents 3) Tolls in e�ect July 1, 2014
* 10-year committed toll**20-year committed toll
Major Existing Crude Oil Pipelines carryingCanadian crude oilSelected Other Crude Oil Pipelines
Area Re�neries - Capacities as at Jun 1 , 2014(in ‘000s barrels per day)
Petroleum Administration for Defense District
FlanaganPhiladelphia
Savannah
Port Arthur/Beaumont
Artesia
Big Spring
Slaughter
WA
OR MT
CO
NDMN
IA
WI
IL
IN
MI
SD
NE
KS
MO
TN
TX
NM
LA
AR
AL
NC
VAWV
KY
PA
NY
NH
MA
OH
RICT
VT
ME
NJ
DEMD
SCGA
FL
MS
OK
WY
ID
UT
NVCA
CENTURION
KOCH
SPEARHEAD
SOUTH
ENBRIDGE LINE 9
PEGASUS
Come by Chance
Lake Charles
KOCH
(Woo
d Ri
ver)
SHELL CHEVRO
NPACIFIC
EXXONMOBIL
EXXONMOBIL
EXXONM
OBIL
KEYSTON
E
KEYSTON
E
HUSKY
RAIN
BOW
ENBRIDGE NW
AZ
VancouverChevron ...........55
Puget SoundBP (Cherry Pt)............234Phillips 66 (Ferndale) 100Shell (Anacortes).......150Tesoro (Anacortes) ...120US Oil (Tacoma)........... 39
San FranciscoChevron ...................257Phillips 66 ................120Shell...........................160Tesoro .......................166Valero........................170
Bakers�eldKern Oil....................... 26San Joaquin .............. 15
Great FallsCalumet MT Rfg......... 10
BillingsCHS (Laurel) ................ 57Phillips 66 .................... 58ExxonMobil................. 60
Los AngelesAlon USA ..............................94Tesoro (Carson) ............... 266Chevron ............................. 290ExxonMobil....................... 155Phillips 66 .......................... 139Tesoro (Wilmington).........97Valero ................................. 135
EdmontonImperial ...........................187Suncor .............................142Shell..................................100LloydminsterHusky.................................29Husky Upgrader.............82
ReginaCo-op Re�nery/Upgrader .......................135Moose JawMoose Jaw .....................19
NewfoundlandNorth Atlantic .................. 115
WyomingLittle America (Casper) ................20Sinclair Oil (Sinclair) ......................80Wyoming (Newcastle)..................14HollyFrontier (Cheyenne) ...........52
OhioBP-Husky (Toledo)...................... 160PBF (Toledo) ................................. 170Marathon (Canton) .......................80Husky (Lima)................................. 160Marathon (Catlettsburg) .......... 240
Mississippi RiverExxonMobil (Baton Rouge) ..... 503Chalmette...................................... 192Marathon (Garyville) ................. 522Motiva (Convent) ........................ 235Motiva (Norco)............................. 220Valero (Norco).............................. 270Valero (Meraux) ........................... 135Phillips 66 (Belle Chasse) ......... 247Alon (Krotz Springs)......................83Shell (St. Rose) *idled* .................55Placid (Port Allen) ..........................60
Houston/Texas CityPRSI (Pasadena) ..........117Marathon (Galveston) 451Shell (Deer Park)..........340ExxonMobil...................584Houston Re�ning .......268Marathon ........................ 80Valero (2)............. 160+245
MississippiChevron (Pascagoula) ............... 330AlabamaHunt (Tuscaloosa) .........................72Shell (Saraland) ..............................85
Three RiversValero..............................100Corpus ChristiCITGO..............................165Flint..................................300Valero..............................325
SweenyPhillips 66 ......................247
Lake CharlesCITGO................................425Phillips 66 ........................239Calcasieu............................ 75
Port Arthur/BeaumontExxonMobil................... 365Motiva............................. 600Valero.............................. 310Total................................. 174
Saint JohnIrving....................320
New JerseyPhillips 66 (Bayway) .....285PBF (Paulsboro) .............180Axeon SP (Paulsboro).... 70DelawarePBF (Delaware City) .....190
MemphisValero...................195El DoradoDelek ...................... 80
TylerDelek ...................... 60
DetroitMarathon............120
OklahomaPhillips 66 (Ponca City) ........................ 187HollyFrontier (Tulsa) ............................ 125Co¢eyville Res. (Wynnewood).............70Valero (Ardmore) ......................................90
New Mexico/W. TexasWestern Re�ning (El Paso).................. 128HollyFrontier (Artesia) ......................... 100Alon (Big Spring).......................................70
Borger/McKeeWRB ..................................146Valero...............................170
Denver/Commerce CitySuncor ............................. 98
Salt Lake CityBig West ..............35Chevron ..............45HollyFrontier .....31Tesoro ..................58
MandanTesoro ..............71
St. PaulFlint Hills .............339Northern Tier....... 82
KansasNCRA (McPherson)................ 85HollyFrontier (El Dorado)..135Co¢eyville Res(Co¢eyville) 115
SuperiorCalumet........... 45
ChicagoBP ............................. 413ExxonMobil............ 250PDV .......................... 180
SarniaImperial ............... 121Nova ........................80Shell.........................77Suncor ....................85NanticokeImperial ............... 112
Montréal/QuébecSuncor .....................137Valero.......................265
PennsylvaniaMonroe Energy.............................. 185Phil. Energy Solutions ................. 330Warren
United ......... 70
UpgradersSyncrude (Fort McMurray) .............465Suncor (Fort McMurray) ..................438Shell (Scotford)...................................240CNRL Horizon......................................135OPTI/Nexen Long Lake...................... 72
Wood RiverWRB .....................................314RobinsonMarathon...........................206Mt VernonCountrymark ...................... 27
& Labrador

43 CANADIAN ASSOCIATION OF PETROLEUM PRODUCERS
Calgary Office:
2100,350-7AvenueSWCalgary, Alberta, Canada
T2P 3N9
Phone:403-267-1100Fax: 403-261-4622
St. John’s Office:
403,235WaterStreetSt. John’s, Newfoundland and Labrador
Canada A1C 1B6
Phone:709-724-4200Fax:709-724-4225
www.capp.ca • [email protected]•June2014•2014-0011
The Canadian Association of Petroleum Producers (CAPP) represents companies, large and small, that explore for, develop and produce natural gas and crude oil throughout Canada. CAPP’s member companies produce about 90 per cent of Canada’s natural gas and crude oil. CAPP’s associate members provide a wide range of services that support the upstream crude oil and natural gas industry. Together CAPP’s members and associate members are an important part of a national industry with revenues of about $110 billion-a-year.
CAPP’s mission is to enhance the economic sustainability of the Canadian upstream petroleum industry in a safe and environmentally and socially responsible manner, through constructive engagement and communication with governments, the public and stakeholders in the communities in which we operate.
Ottawa Office:
1000,275SlaterStreetOttawa, Ontario, Canada
K1P5H9
Phone: 613-288-2126Fax: 613-236-4280
Get in on the oil sands discussion Mobile Application
The Facts on Oil Sands
Available for free download to Android, Apple, and BlackBerry devices by searching “Oil Sands” in the app stores.
Twitter Facebook @OilSandsToday Oil Sands Today
Websites www.oilsandstoday.ca www.capp.ca/upstreamdialogue
Victoria Office:
310, 1321 Blanshard StreetVictoria, British Columbia, Canada
V8W0B5
Phone:778-410-5000Fax:778-410-5001


