Embed Size (px)
Citation preview
Report No.16 of 2018 (Performance Audit)
CHAPTER- 1
ICDs AND CFSs IN INDIA: AN OVERVIEW
Inland Container Depots (ICDs) and Container Freight Stations (CFSs) are also called dry ports as they handle all customs formalities related to import and export of goods at these locations. In a multi modal transport logistics system, ICDs and CFS act as hubs in the logistics chain.
According to Ministry of Commerce and Industry (MoCI) guidelines, an Inland Container Depot (ICD)/Container Freight Station (CFS) may be defined as a common user facility with public authority status equipped with fixed installations and offering services for handling and temporary storage of import/export laden and empty containers carried under Customs control and with Customs and other agencies competent to clear goods for home use, warehousing, temporary admissions, re-export, temporary storage for onward transit and outright export. Transshipment of cargo can also take place from such stations.
1.1 Distinction between ICD and CFS
ICD and CFS offer services for containerization of break- bulk cargo and vice-versa. Most ICDs are connected by rail to the respective gateway port, and this is a key difference between the ICD and CFS. CFSs are typically adjoining or are in close proximity to the mother port and often do not have rail connectivity.
An ICD is generally located in the interiors (outside the port towns) of the country away from the gateway ports. CFS, on the other hand, is an off-dock facility located near the servicing ports which helps in decongesting the port by shifting cargo and Customs related activities outside the port area. CFSs are largely expected to deal with break-bulk cargo originating/terminating in the immediate hinterland of a port and may also deal with rail borne traffic to and from inland locations.
1.2 Functions of ICDs and CFSs
The primary functions of ICD or CFS may be summed up as under:
a. Receipt and dispatch/delivery of cargo.
b. Stuffing and stripping of containers.
c. Transit operations by rail/road to and from serving ports.
d. Customs clearance.
e. Consolidation and desegregation of LCL cargo.
f. Temporary storage of cargo and containers.
g. Maintenance and repair of container units.
An overview of ICDs and CFSs is presented below.
1.3 Inland Container Depots
1.3.1 Geographical distribution of ICDs and Volume of Transactions
According to the data maintained by the Department of Commerce (DoC), there were 129 ICDs in the country as of March 2017 (Appendix I). According to the data provided by CBEC (now CBIC), there were 80 active ICDs in the country. These include the ICDs set up before the DoC was made the Nodal agency for setting up of ICDs in 1992.
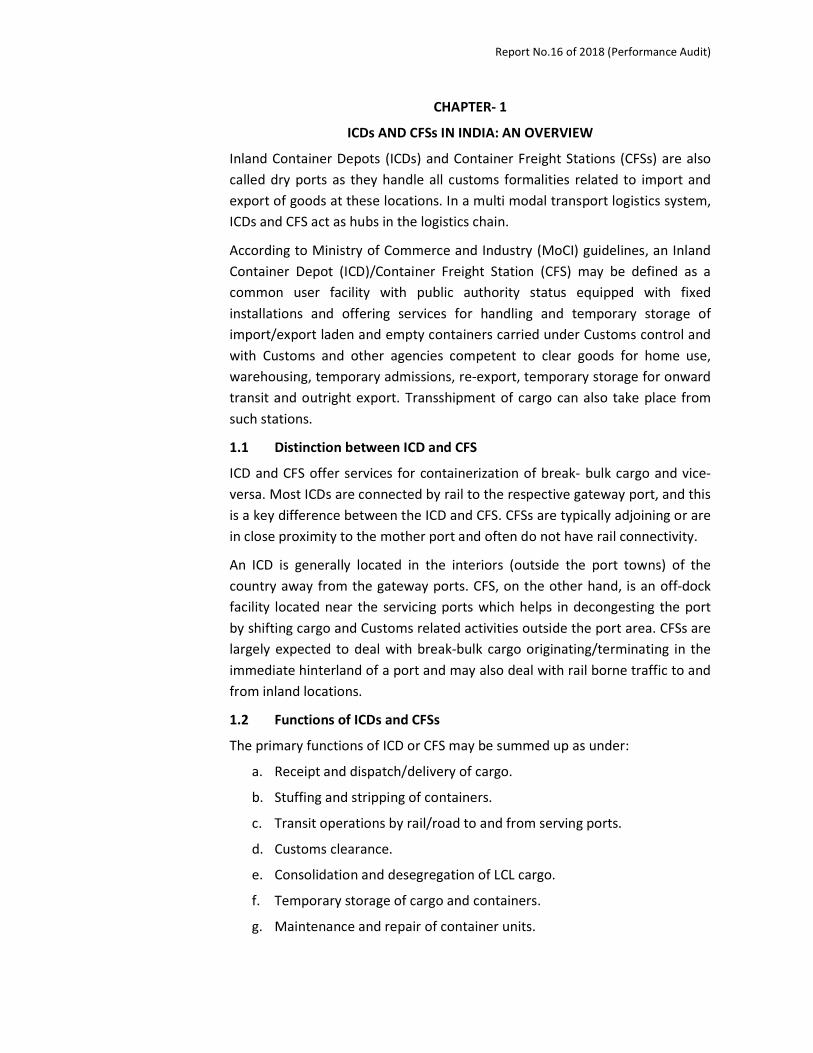
As per the CBEC data on active ICDs, the state-wise distribution indicates that Maharashtra region has the maximum number of ICDs (13), followed by Uttar Pradesh (11), Tamil Nadu (10), Haryana (9) and Gujarat (8).Delhi has the largest ICD in India, namely ICD Tughlakabad. There are no ICDs in the northern-most state of Jammu &Kashmir and there is only one ICD at Amingaon, Assam which caters to the entire north-east.
In terms of volume of transactions, (Bills of Entry for Imports and Shipping Bills for Exports), the highest volume of trade through ICDs was generated in Delhi (22per cent),Uttar Pradesh (16 per cent), Tamil Nadu (14 per cent), Karnataka (10 per cent), Gujarat (8.5per cent) and Maharashtra (7per cent). These six states together accounted for 78per cent of India’s total ICD transaction volumes.
Fig 1: Geographical distribution of ICDs and volume of transactions
Source: ICD transaction data from 2012-13 to 2016-17 for 80 functional ICDs received from DG (Systems), CBEC
Report No.16 of 2018 (Performance Audit)
1.3.2 Value of Imports and Exports handled through ICDs
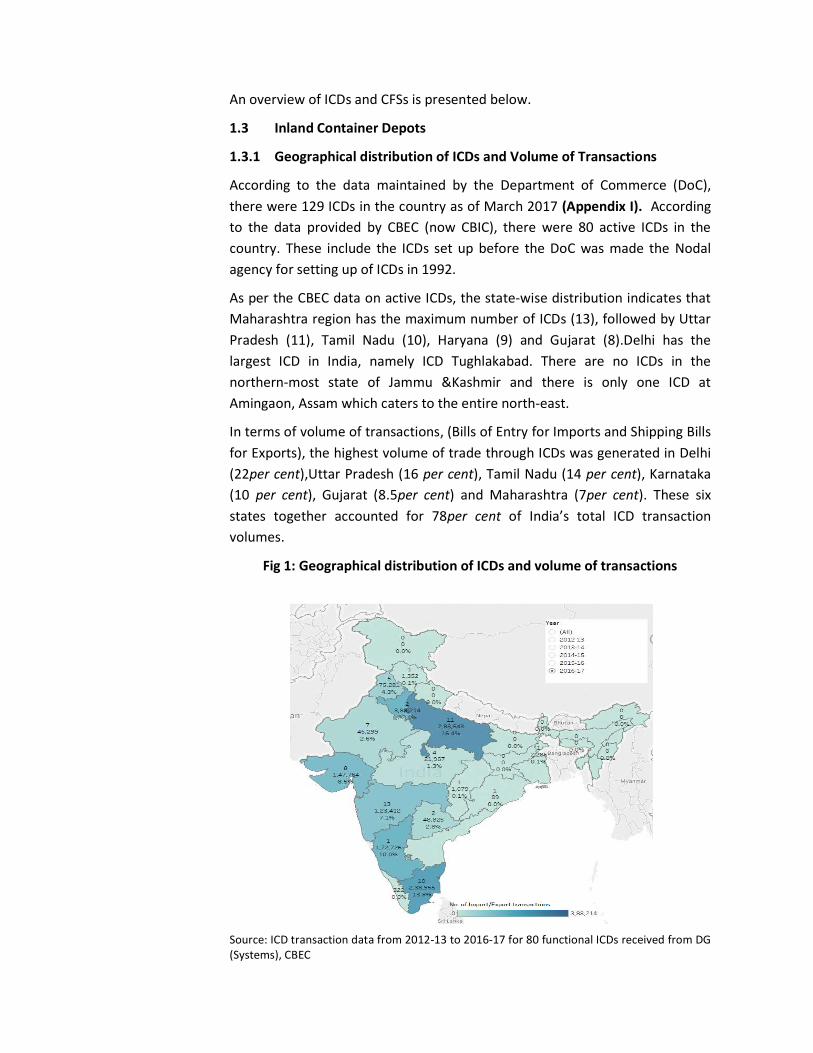
In 2016-17, out of the 80 active ICDs in the country which handled a total of 4,27,404 crore worth of imports and exports, there were ten ICDs which
accounted for 61.2 per cent of the total value of trade. Of these ten, there were five ICDs in particular, which accounted for 1,94,485 crore (45.5 per cent) of the exports and imports. These were ICD Tughlakabad, Delhi (19.8 per cent), ICD Whitefield, Bengaluru (7.4per cent), ICD Sabarmati (7 per cent), ICD Tuticorin (5.8 per cent) and ICD Garhi Harsaru, Gurgaon (5.6 per cent).
Fig 2: Top 10 ICDs by value of Imports &Exports , 2016-17
Source: ICD transaction data from 2012-13 to 2016-17 for 80 functional ICDs received from DG (Systems), CBEC.
(The year-wise position of top ten ICDs handling the maximum value of trade can be seen in the digital version of this Report in the interactive graph by selecting a particular year)
1.3.3 Trend of growth in imports and exports through ICDs
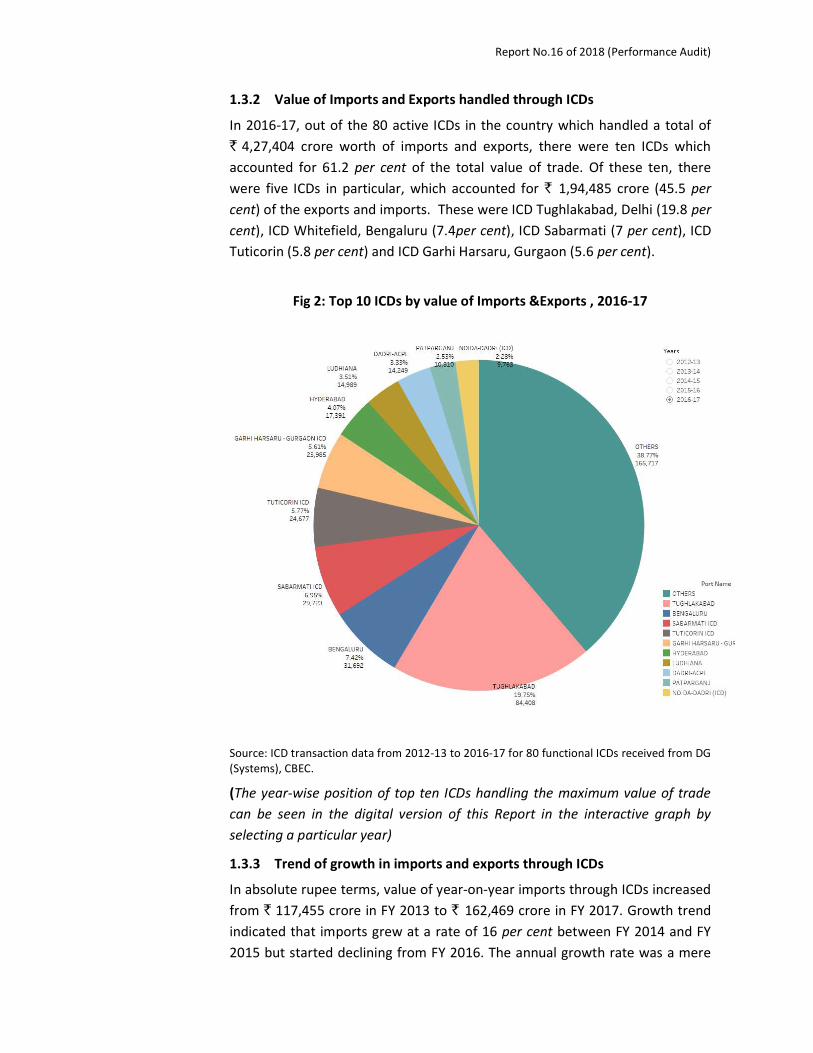
In absolute rupee terms, value of year-on-year imports through ICDs increased from 117,455 crore in FY 2013 to 162,469 crore in FY 2017. Growth trend indicated that imports grew at a rate of 16 per cent between FY 2014 and FY 2015 but started declining from FY 2016. The annual growth rate was a mere
0.6per cent during FY 2016 and picked up only marginally to 1.5per cent during FY 2017.
Value of exports through ICDs increased from 190,249 crore in FY 2013 to 264,935 crore in FY 2017. The annual growth rate was an impressive 27.5 per cent during FY 2014 but dropped to 8.2 per cent during FY 2015, declining further by 3.1 per cent in FY 2016 before the trend was reversed with an increase of a modest 4.2 per cent in FY 2017. The graph below shows the all-India trend of growth in Imports and exports through ICDs.
Fig 3: Year-on-year growth in value of imports & exports through ICDs
Source: ICD transaction data from 2012-13 to 2016-17 for 80 functional ICDs received from DG (Systems), CBEC
(The year-on-year trend of growth in value of imports and exports through individual ICDs can be seen in the digital version of this Report in the interactive graph by selecting a particular ICD port code)
1.3.4 Trend of growth in volume of traffic (in TEUs) handled by ICDs
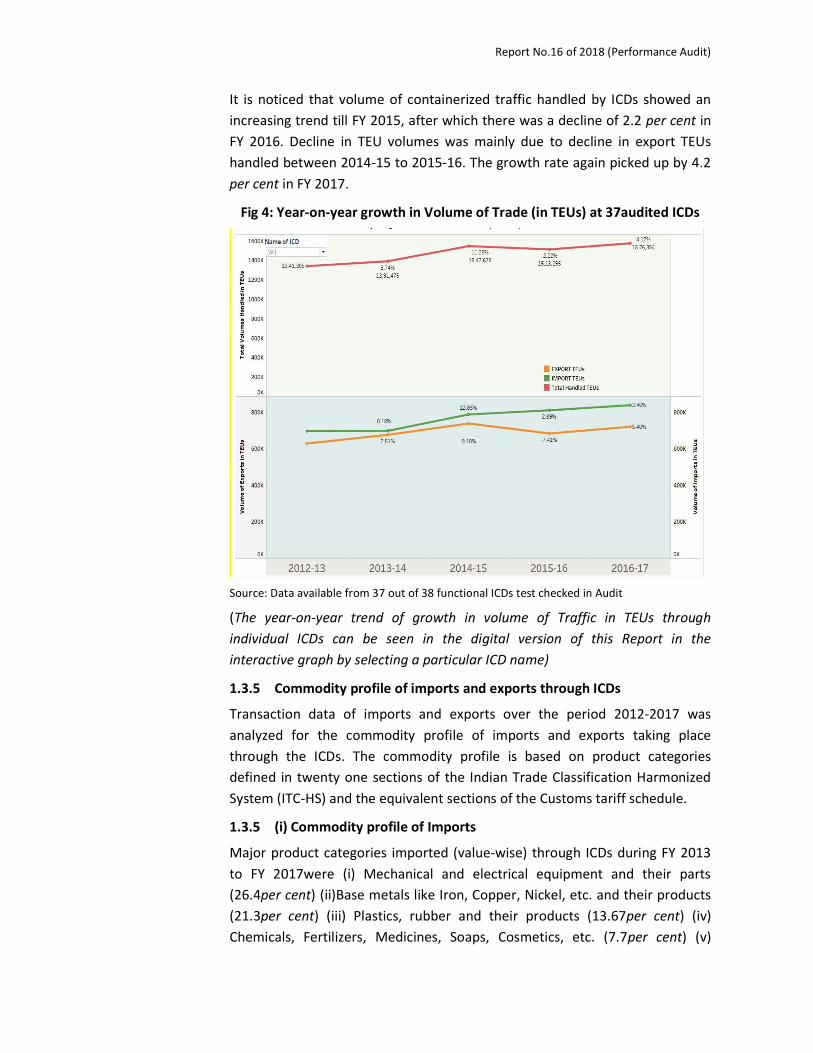
Data on volume of cargo handled annually in TEUs was available for 37 (Appendix IA) out of the 381 functional ICDs test checked in audit, from which it can be seen that TEUs handled by 37 ICDs increased from 13.41 lakh TEUs in FY 2013 to 15.96 lakh TEUs in FY 2017, an increase of 19 per cent over a four-year period.
1Out of a total sample of 44 ICDs selected for test check in Audit, 38 ICDs were functional during the audit period andremaining 6 were closed/non-functional
Report No.16 of 2018 (Performance Audit)
It is noticed that volume of containerized traffic handled by ICDs showed an increasing trend till FY 2015, after which there was a decline of 2.2 per cent in FY 2016. Decline in TEU volumes was mainly due to decline in export TEUs handled between 2014-15 to 2015-16. The growth rate again picked up by 4.2 per cent in FY 2017.
Fig 4: Year-on-year growth in Volume of Trade (in TEUs) at 37audited ICDs
Source: Data available from 37 out of 38 functional ICDs test checked in Audit
(The year-on-year trend of growth in volume of Traffic in TEUs through individual ICDs can be seen in the digital version of this Report in the interactive graph by selecting a particular ICD name)
1.3.5 Commodity profile of imports and exports through ICDs
Transaction data of imports and exports over the period 2012-2017 was analyzed for the commodity profile of imports and exports taking place through the ICDs. The commodity profile is based on product categories defined in twenty one sections of the Indian Trade Classification Harmonized System (ITC-HS) and the equivalent sections of the Customs tariff schedule.
1.3.5 (i) Commodity profile of Imports
Major product categories imported (value-wise) through ICDs during FY 2013 to FY 2017were (i) Mechanical and electrical equipment and their parts (26.4per cent) (ii)Base metals like Iron, Copper, Nickel, etc. and their products (21.3per cent) (iii) Plastics, rubber and their products (13.67per cent) (iv) Chemicals, Fertilizers, Medicines, Soaps, Cosmetics, etc. (7.7per cent) (v)
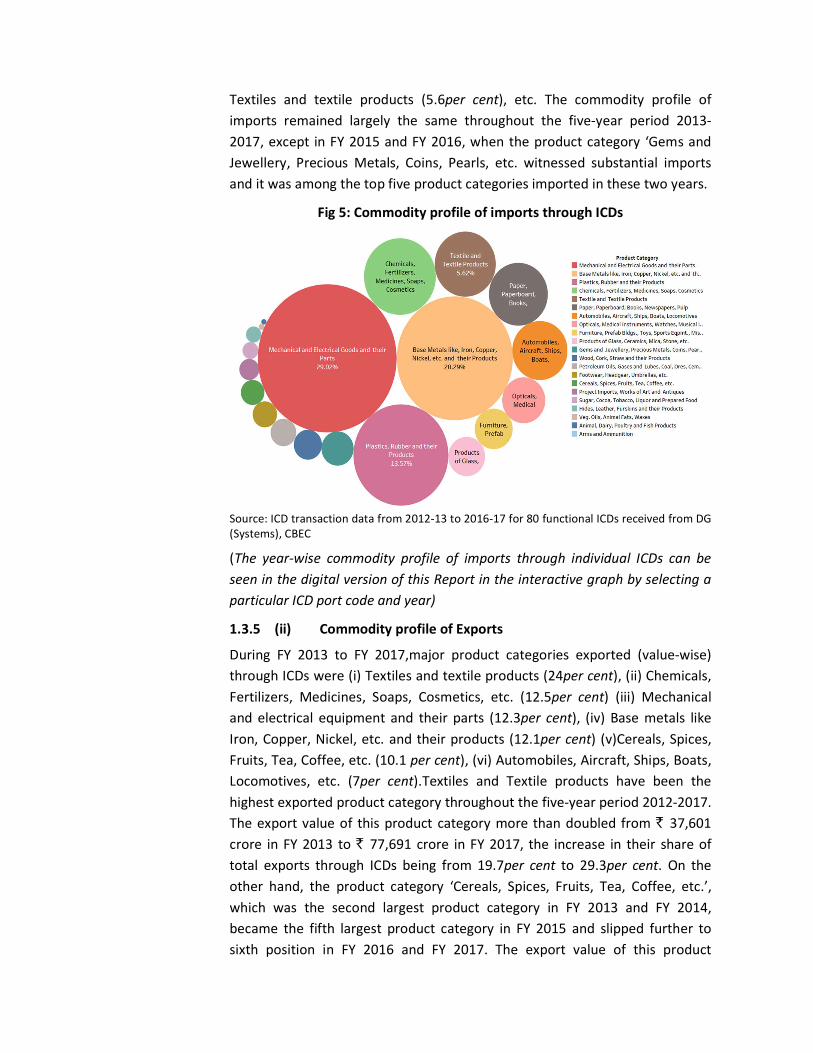
Textiles and textile products (5.6per cent), etc. The commodity profile of imports remained largely the same throughout the five-year period 2013-2017, except in FY 2015 and FY 2016, when the product category ‘Gems and Jewellery, Precious Metals, Coins, Pearls, etc. witnessed substantial imports and it was among the top five product categories imported in these two years.
Fig 5: Commodity profile of imports through ICDs
Source: ICD transaction data from 2012-13 to 2016-17 for 80 functional ICDs received from DG (Systems), CBEC
(The year-wise commodity profile of imports through individual ICDs can be seen in the digital version of this Report in the interactive graph by selecting a particular ICD port code and year)
1.3.5 (ii) Commodity profile of Exports
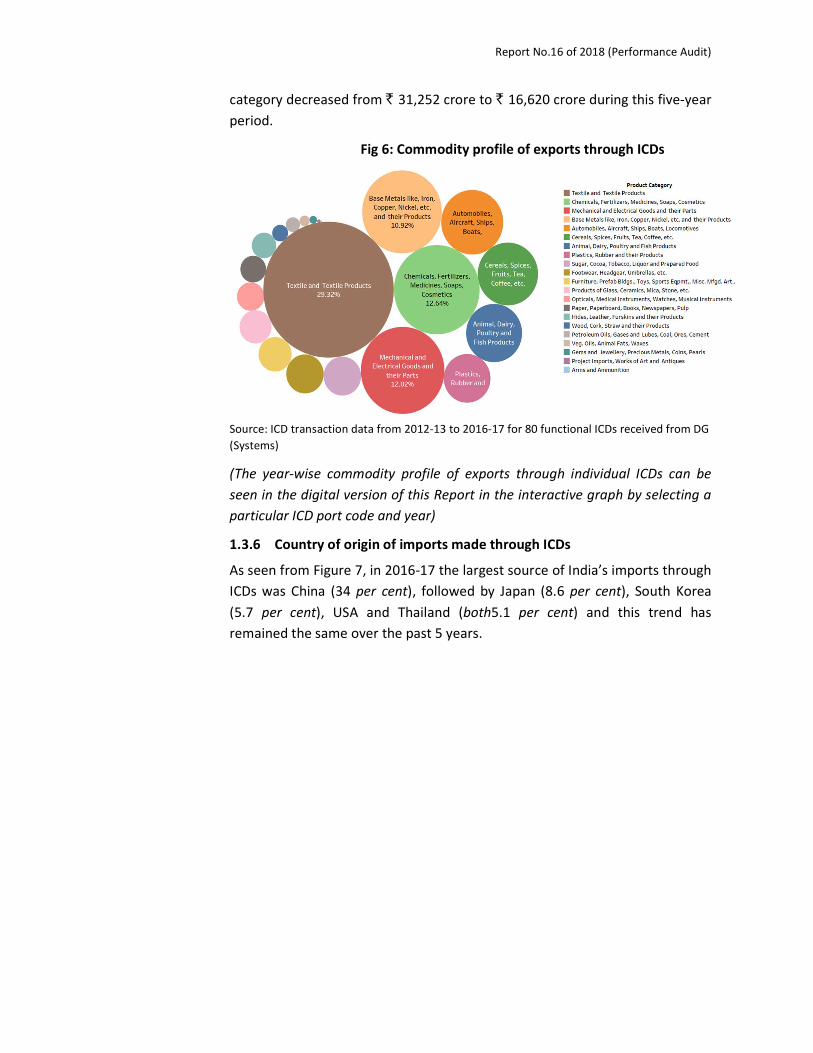
During FY 2013 to FY 2017,major product categories exported (value-wise) through ICDs were (i) Textiles and textile products (24per cent), (ii) Chemicals, Fertilizers, Medicines, Soaps, Cosmetics, etc. (12.5per cent) (iii) Mechanical and electrical equipment and their parts (12.3per cent), (iv) Base metals like Iron, Copper, Nickel, etc. and their products (12.1per cent) (v)Cereals, Spices, Fruits, Tea, Coffee, etc. (10.1 per cent), (vi) Automobiles, Aircraft, Ships, Boats, Locomotives, etc. (7per cent).Textiles and Textile products have been the highest exported product category throughout the five-year period 2012-2017. The export value of this product category more than doubled from 37,601 crore in FY 2013 to 77,691 crore in FY 2017, the increase in their share of total exports through ICDs being from 19.7per cent to 29.3per cent. On the other hand, the product category ‘Cereals, Spices, Fruits, Tea, Coffee, etc.’, which was the second largest product category in FY 2013 and FY 2014, became the fifth largest product category in FY 2015 and slipped further to sixth position in FY 2016 and FY 2017. The export value of this product
Report No.16 of 2018 (Performance Audit)
category decreased from 31,252 crore to 16,620 crore during this five-year period.
Fig 6: Commodity profile of exports through ICDs
Source: ICD transaction data from 2012-13 to 2016-17 for 80 functional ICDs received from DG (Systems)
(The year-wise commodity profile of exports through individual ICDs can be seen in the digital version of this Report in the interactive graph by selecting a particular ICD port code and year)
1.3.6 Country of origin of imports made through ICDs
As seen from Figure 7, in 2016-17 the largest source of India’s imports through ICDs was China (34 per cent), followed by Japan (8.6 per cent), South Korea (5.7 per cent), USA and Thailand (both5.1 per cent) and this trend has remained the same over the past 5 years.
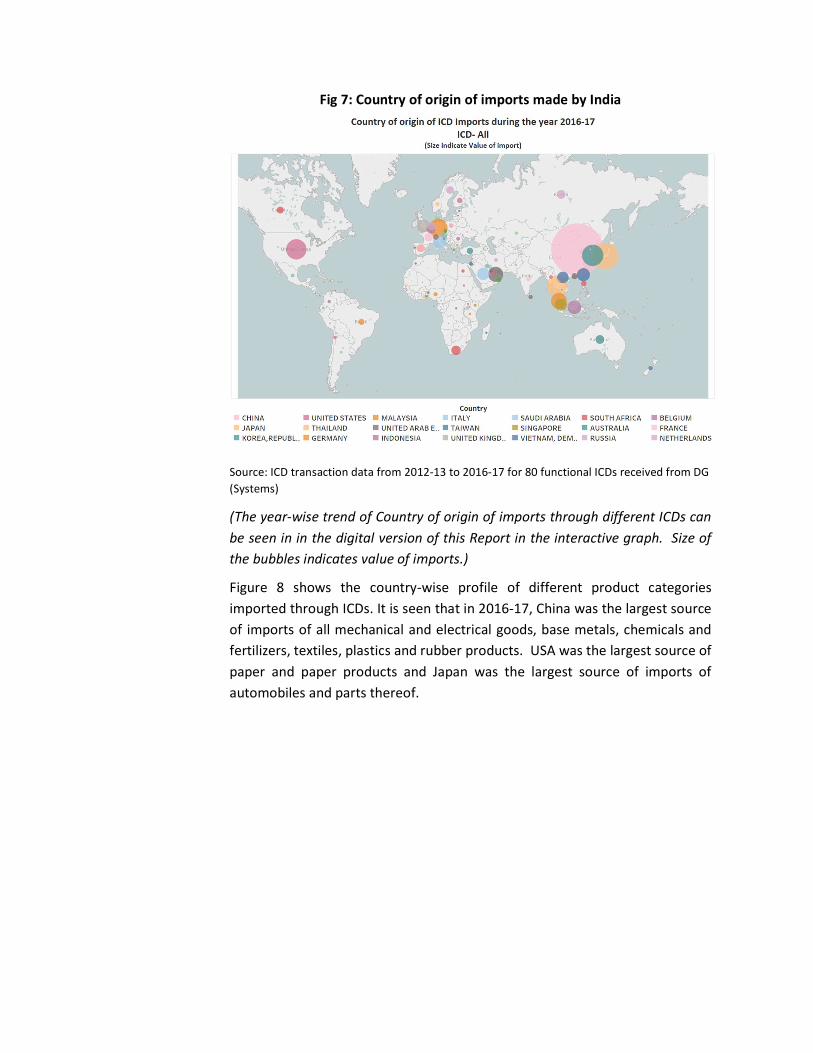
Fig 7: Country of origin of imports made by India
Source: ICD transaction data from 2012-13 to 2016-17 for 80 functional ICDs received from DG (Systems)
(The year-wise trend of Country of origin of imports through different ICDs can be seen in in the digital version of this Report in the interactive graph. Size of the bubbles indicates value of imports.)
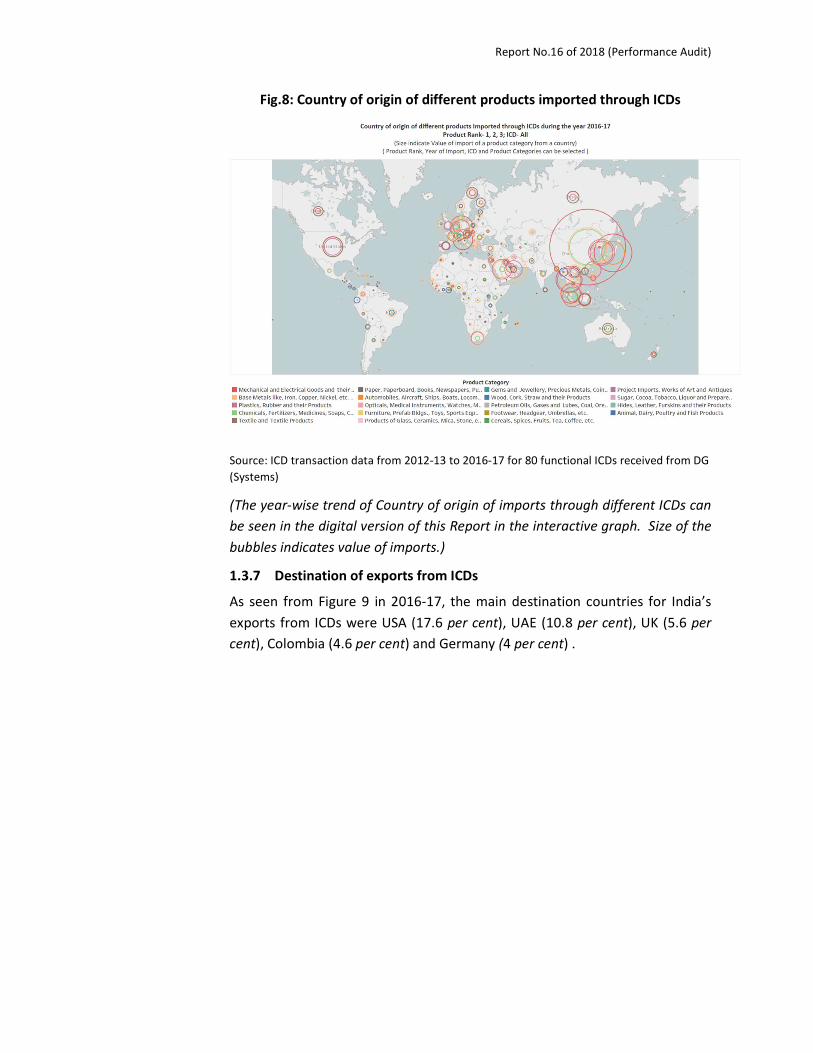
Figure 8 shows the country-wise profile of different product categories imported through ICDs. It is seen that in 2016-17, China was the largest source of imports of all mechanical and electrical goods, base metals, chemicals and fertilizers, textiles, plastics and rubber products. USA was the largest source of paper and paper products and Japan was the largest source of imports of automobiles and parts thereof.
Report No.16 of 2018 (Performance Audit)
Fig.8: Country of origin of different products imported through ICDs
Source: ICD transaction data from 2012-13 to 2016-17 for 80 functional ICDs received from DG (Systems)
(The year-wise trend of Country of origin of imports through different ICDs can be seen in the digital version of this Report in the interactive graph. Size of the bubbles indicates value of imports.)
1.3.7 Destination of exports from ICDs
As seen from Figure 9 in 2016-17, the main destination countries for India’s exports from ICDs were USA (17.6 per cent), UAE (10.8 per cent), UK (5.6 per cent), Colombia (4.6 per cent) and Germany (4 per cent) .
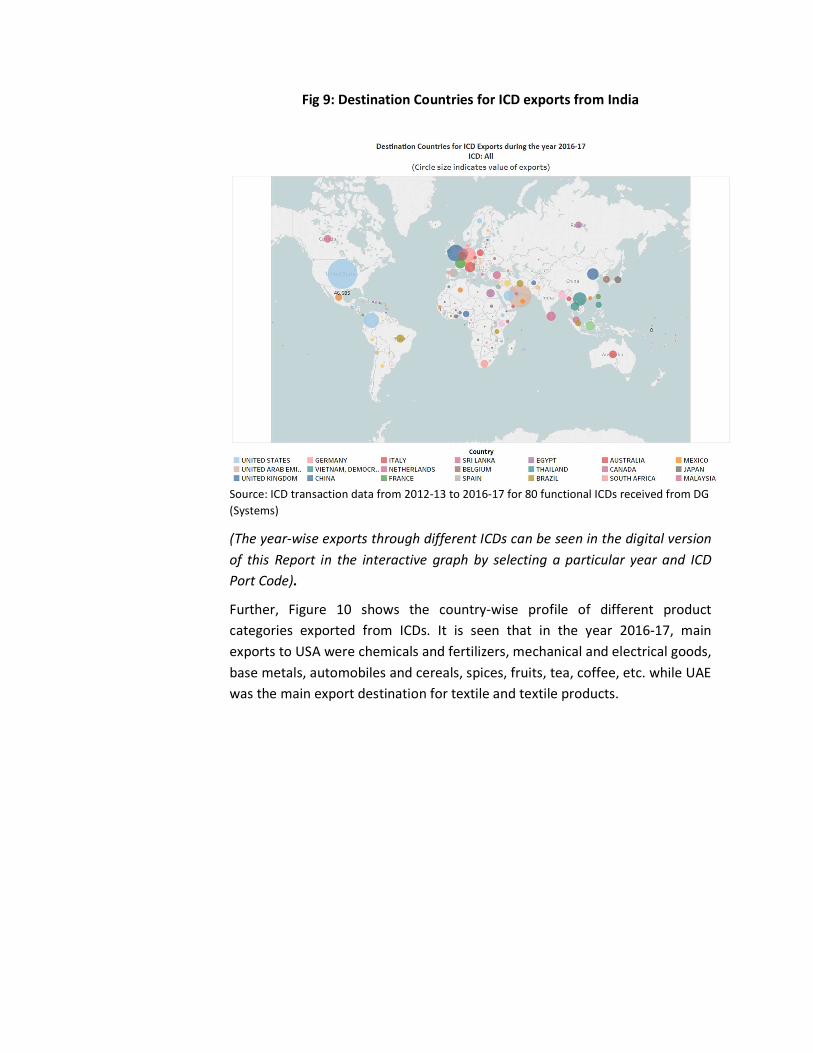
Fig 9: Destination Countries for ICD exports from India
Source: ICD transaction data from 2012-13 to 2016-17 for 80 functional ICDs received from DG (Systems)
(The year-wise exports through different ICDs can be seen in the digital version of this Report in the interactive graph by selecting a particular year and ICD Port Code).
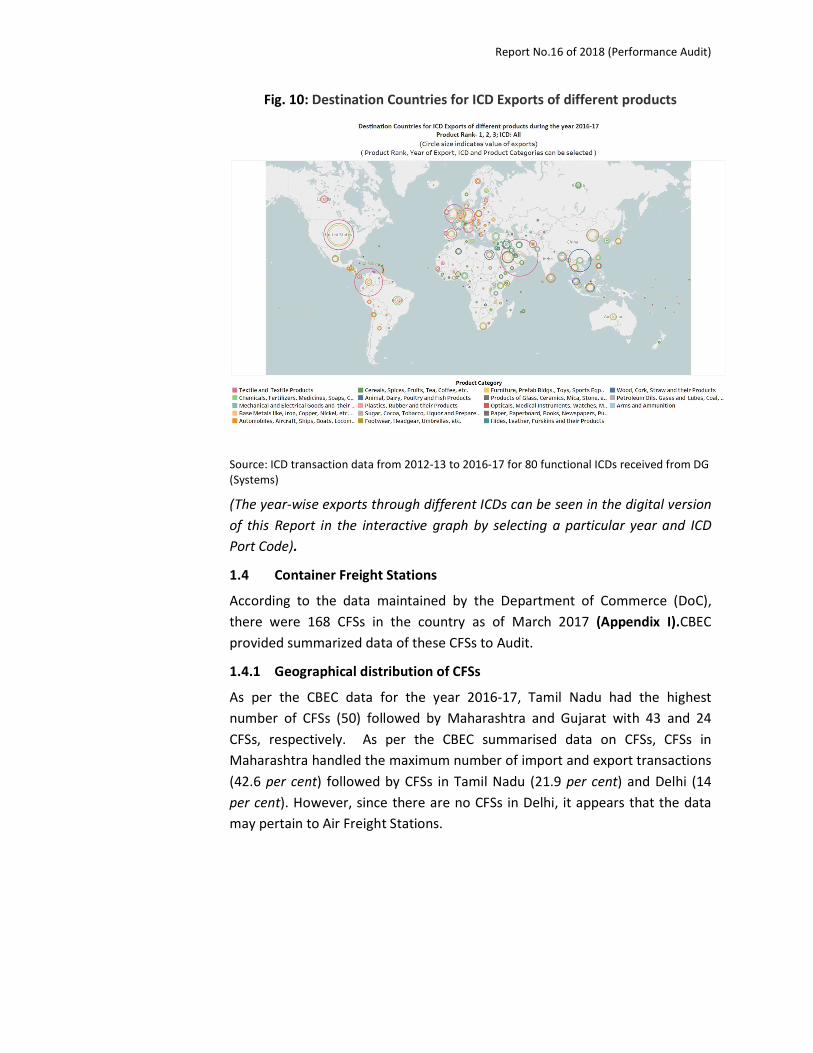
Further, Figure 10 shows the country-wise profile of different product categories exported from ICDs. It is seen that in the year 2016-17, main exports to USA were chemicals and fertilizers, mechanical and electrical goods, base metals, automobiles and cereals, spices, fruits, tea, coffee, etc. while UAE was the main export destination for textile and textile products.
Report No.16 of 2018 (Performance Audit)
Fig. 10: Destination Countries for ICD Exports of different products
Source: ICD transaction data from 2012-13 to 2016-17 for 80 functional ICDs received from DG (Systems)
(The year-wise exports through different ICDs can be seen in the digital version of this Report in the interactive graph by selecting a particular year and ICD Port Code).
1.4 Container Freight Stations
According to the data maintained by the Department of Commerce (DoC), there were 168 CFSs in the country as of March 2017 (Appendix I).CBEC provided summarized data of these CFSs to Audit.
1.4.1 Geographical distribution of CFSs
As per the CBEC data for the year 2016-17, Tamil Nadu had the highest number of CFSs (50) followed by Maharashtra and Gujarat with 43 and 24 CFSs, respectively. As per the CBEC summarised data on CFSs, CFSs in Maharashtra handled the maximum number of import and export transactions (42.6 per cent) followed by CFSs in Tamil Nadu (21.9 per cent) and Delhi (14 per cent). However, since there are no CFSs in Delhi, it appears that the data may pertain to Air Freight Stations.
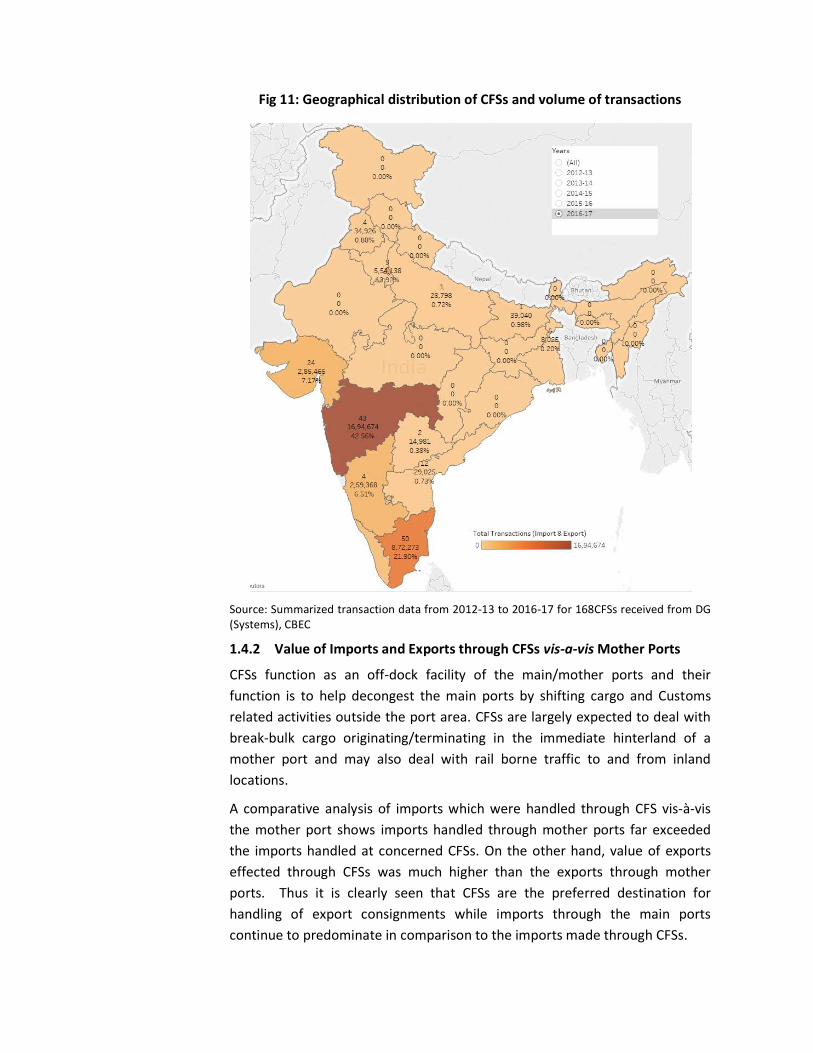
Fig 11: Geographical distribution of CFSs and volume of transactions
Source: Summarized transaction data from 2012-13 to 2016-17 for 168CFSs received from DG (Systems), CBEC
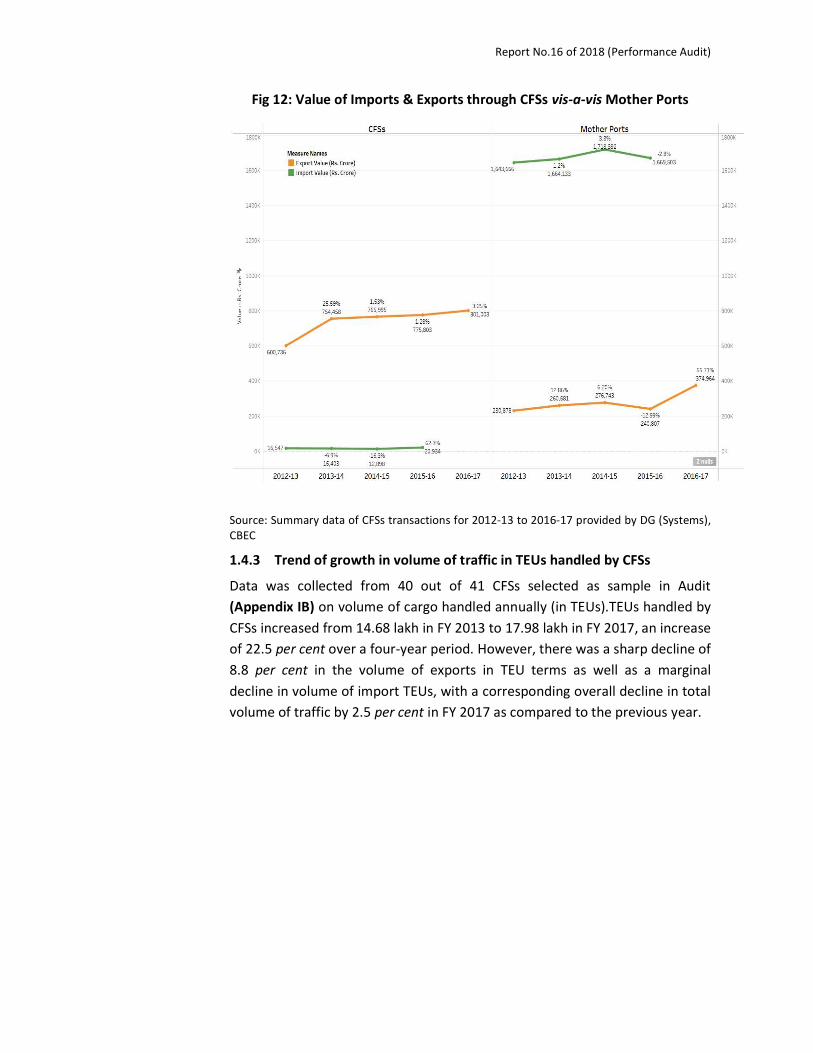
1.4.2 Value of Imports and Exports through CFSs vis-a-vis Mother Ports
CFSs function as an off-dock facility of the main/mother ports and their function is to help decongest the main ports by shifting cargo and Customs related activities outside the port area. CFSs are largely expected to deal with break-bulk cargo originating/terminating in the immediate hinterland of a mother port and may also deal with rail borne traffic to and from inland locations.
A comparative analysis of imports which were handled through CFS vis-à-vis the mother port shows imports handled through mother ports far exceeded the imports handled at concerned CFSs. On the other hand, value of exports effected through CFSs was much higher than the exports through mother ports. Thus it is clearly seen that CFSs are the preferred destination for handling of export consignments while imports through the main ports continue to predominate in comparison to the imports made through CFSs.
Report No.16 of 2018 (Performance Audit)
Fig 12: Value of Imports & Exports through CFSs vis-a-vis Mother Ports
Source: Summary data of CFSs transactions for 2012-13 to 2016-17 provided by DG (Systems), CBEC
1.4.3 Trend of growth in volume of traffic in TEUs handled by CFSs
Data was collected from 40 out of 41 CFSs selected as sample in Audit (Appendix IB) on volume of cargo handled annually (in TEUs).TEUs handled by CFSs increased from 14.68 lakh in FY 2013 to 17.98 lakh in FY 2017, an increase of 22.5 per cent over a four-year period. However, there was a sharp decline of 8.8 per cent in the volume of exports in TEU terms as well as a marginal decline in volume of import TEUs, with a corresponding overall decline in total volume of traffic by 2.5 per cent in FY 2017 as compared to the previous year.
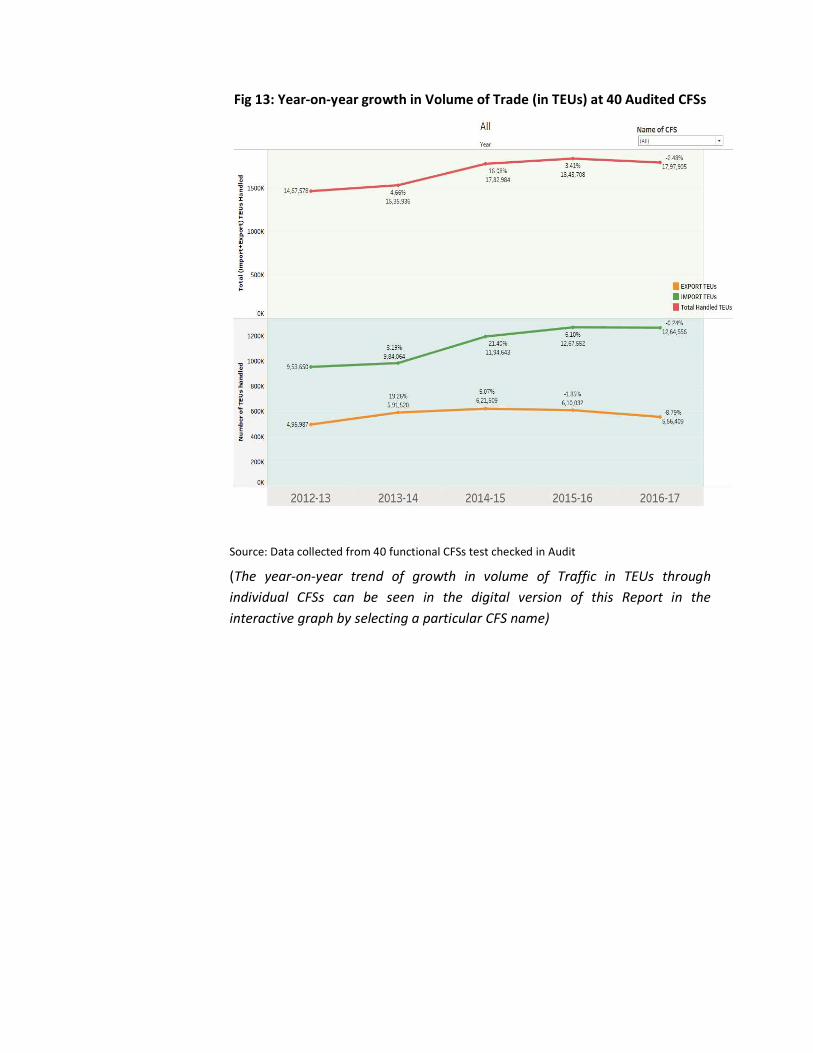
Fig 13: Year-on-year growth in Volume of Trade (in TEUs) at 40 Audited CFSs
Source: Data collected from 40 functional CFSs test checked in Audit
(The year-on-year trend of growth in volume of Traffic in TEUs through individual CFSs can be seen in the digital version of this Report in the interactive graph by selecting a particular CFS name)