Embed Size (px)
Citation preview

Optimization DirectIntroduction & Recent Optimization Case Studies
Agenda
• Introduction, Recent Optimization Case Studies: Alkis Vazacopoulos, Optimization Direct
• Recent advances and future direction(s) in IBM ILOG CPLEX Optimization Studio, Xavier Nodet, IBM
• Analyzing uncertainty and optimizing: a case study in retail, Robert Ashford, Optimization Direct
• Solving Planning and Scheduling with CPLEX. FilippoFocacci, Decision Brain
Optimization Direct
• IBM Business Partner
• More than 30 years of experience in developing and selling Optimization software
• Experience in implementing optimization technology in all the verticals
• Sold to end users – Fortune 500 companies
• Train our customers to get the maximum out of the IBM software
• Help the customers get a kick start and get the maximum from the software right from the start
What software do we sell?
• IBM ILOG CPLEX Optimization Studio
• Cplex is the leader in optimization technology
• Cplex can handle large scale problems and solve them very fast
Which markets
• Travel
• Retail
• Energy
• Financial
• Process
• Big data
Why IBM? Why Cplex?
• Fast
• Reliable
• IBM software
• Large scale
• Gives you the ability to model develop and solve your decision problem
• Complete solution
What types of problems?
• Price & revenue optimization (Travel Industry, etc..,)
• Retail – optimization of campaigns
• Financial: trading, portfolio optimization
• Process industries: schedule your refinery
• Big Data: We see new innovations in human /machine interface and how operation research Experts they solve complicated problems in data mining
How can we help?
• Benchmark your problems
• Help you with next steps for developing your solution!
• Develop optimization prototypes using OPL
Why Optimization Direct?
• Experience
• Responsive
• Benchmark faster against competition
• Expertise
• 15 years of experience competing with CPLEX
• Understand differentiator
• Know how to sell against competitors
Recent Analytics & Optimization Case Studies• Hospital (OPL MODEL + MIP)
• DNA Screening Company (MIP + CP)
• Workforce scheduling Problem (CPLEX + ODH)
• Sports (MIP, MIP + Local Search, Regression)
• Customized Offers Company (Analytics + MIP)
• Packaging and Fulfillment (MIP, MIP+CP)
• Pharma Co (Analytics, Robust Opt, MIP)
• Energy Co (MIP, extend to Stochastic MIP)
• Financial company (Complex QCPs, MIP)
• Retail Clothing (Analytics, MIP)
Hospital Scheduling (non emergency units)• Patients
• Block is combination of Room/Day/week
• Surgeons, nurses and doctors
• PROBLEM A: COMPOSITION & ASSIGNMENTS: Create teams of doctors + stuff to assign to patients
• PROBLEM B: BLOCK ASSIGNMENT: Assign Patients to Block
Hospital Scheduling
• PROBLEM A: Starting to get attention lately in the Health analytics area; Experiments to determine if optimal composition will be beneficial (Health Analytics)
• PROBLEM B: Complex rules, Objective function complexity;• Objective function: Variation between Number of Patients
in Hospital, waiting for surgery and similar objectives• Many experiments large Hospital
• Model develop with OPL and solved MIP with CPLEX
DNA Screening - Scheduling problems
• New Innovative DNA Screening Companies
• Goal: Make custom-built robots to turn blood and saliva samples into purified DNA.
• Samples: These samples come from men and women across the globe.
• DNA Sample and Robots: The robots can analyze thousands of DNA samples at the same time, and can work nonstop seven days a week.

DNA Screening Problem
• This is Flowshop scheduling problem with Many Side Constraints
• Challenge: Increase Utilization of the robots –decrease idle time
• Solver: Constrained programming & MIP combination
• Time Horizon: Determine easily Daily sequences and develop a rolling horizon schedule
Workforce Scheduling
• Schedule entities over 64 periods
• Many Side constraints
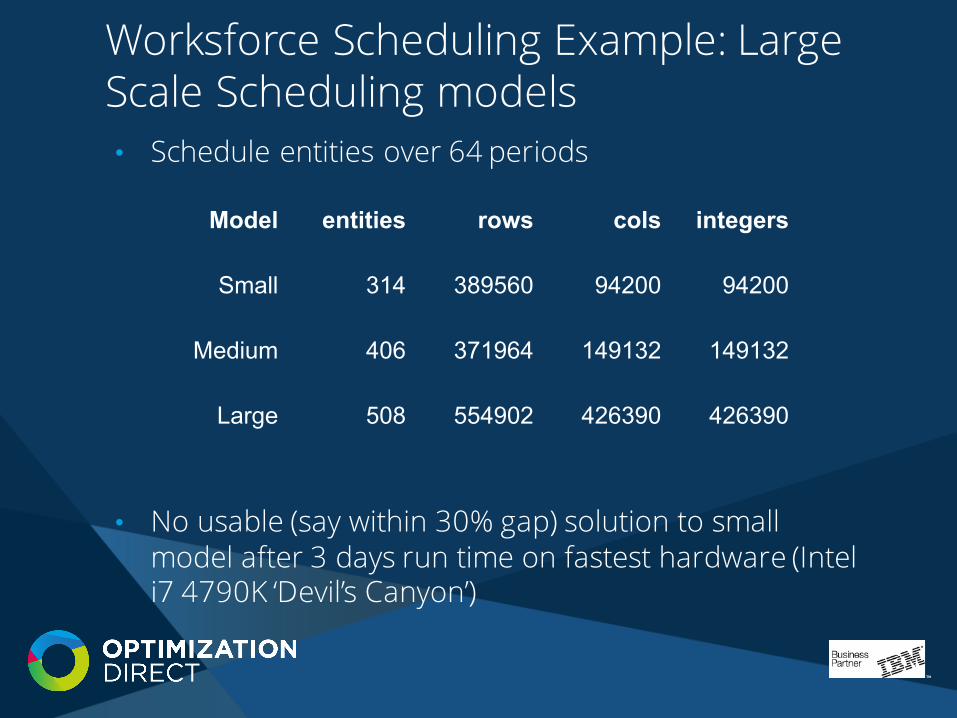
Worksforce Scheduling Example: Large Scale Scheduling models• Schedule entities over 64 periods
• No usable (say within 30% gap) solution to small model after 3 days run time on fastest hardware (Intel i7 4790K ‘Devil’s Canyon’)
Model entities rows cols integers
Small 314 389560 94200 94200
Medium 406 371964 149132 149132
Large 508 554902 426390 426390
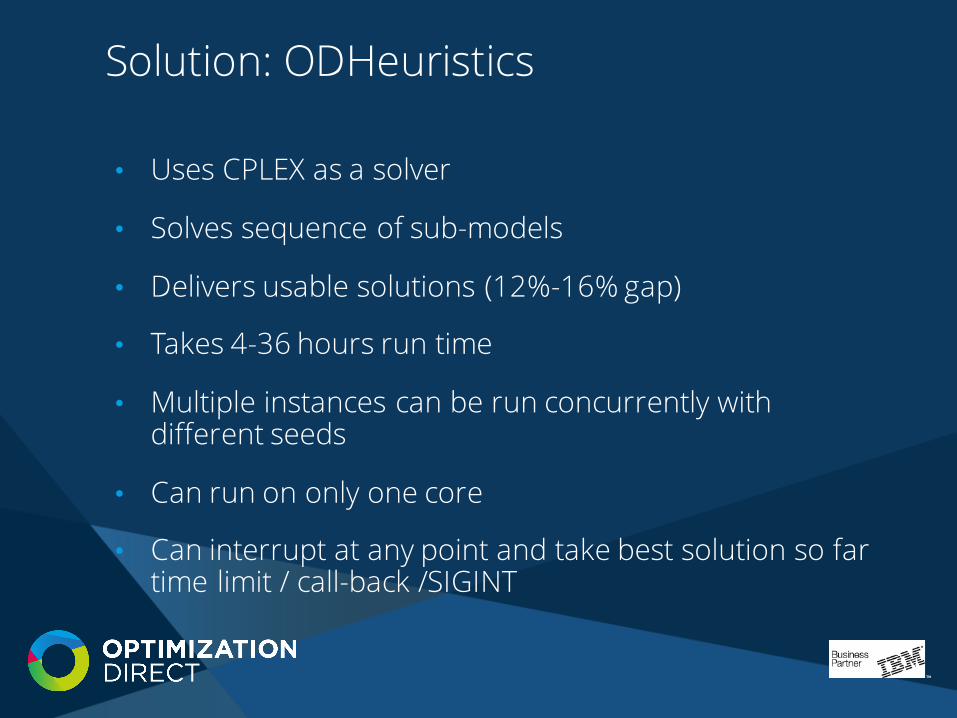
Solution: ODHeuristics
• Uses CPLEX as a solver
• Solves sequence of sub-models
• Delivers usable solutions (12%-16% gap)
• Takes 4-36 hours run time
• Multiple instances can be run concurrently with different seeds
• Can run on only one core
• Can interrupt at any point and take best solution so fartime limit / call-back /SIGINT
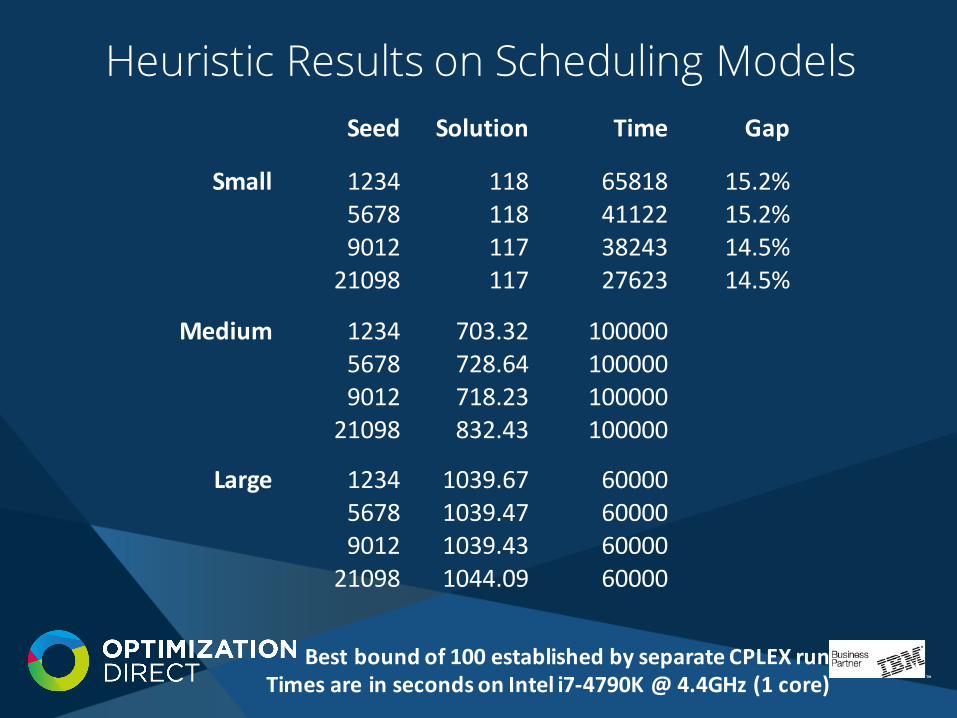
Heuristic Results on Scheduling ModelsSeed Solution Time Gap
Small 1234 118 65818 15.2%5678 118 41122 15.2%9012 117 38243 14.5%21098 117 27623 14.5%
Medium 1234 703.32 1000005678 728.64 1000009012 718.23 10000021098 832.43 100000
Large 1234 1039.67 600005678 1039.47 600009012 1039.43 6000021098 1044.09 60000
Best bound of 100 established by separate CPLEX runTimes are in seconds on Intel i7-‐4790K @ 4.4GHz (1 core)
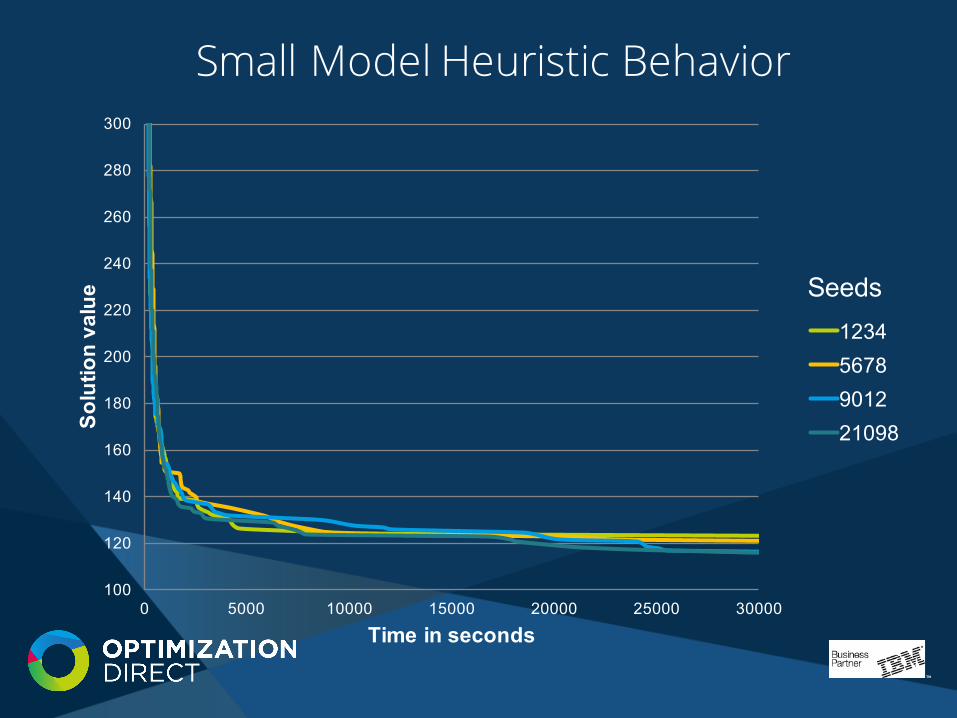
Small Model Heuristic Behavior
100
120
140
160
180
200
220
240
260
280
300
0 5000 10000 15000 20000 25000 30000
Solution value
Time in seconds
12345678901221098
Seeds
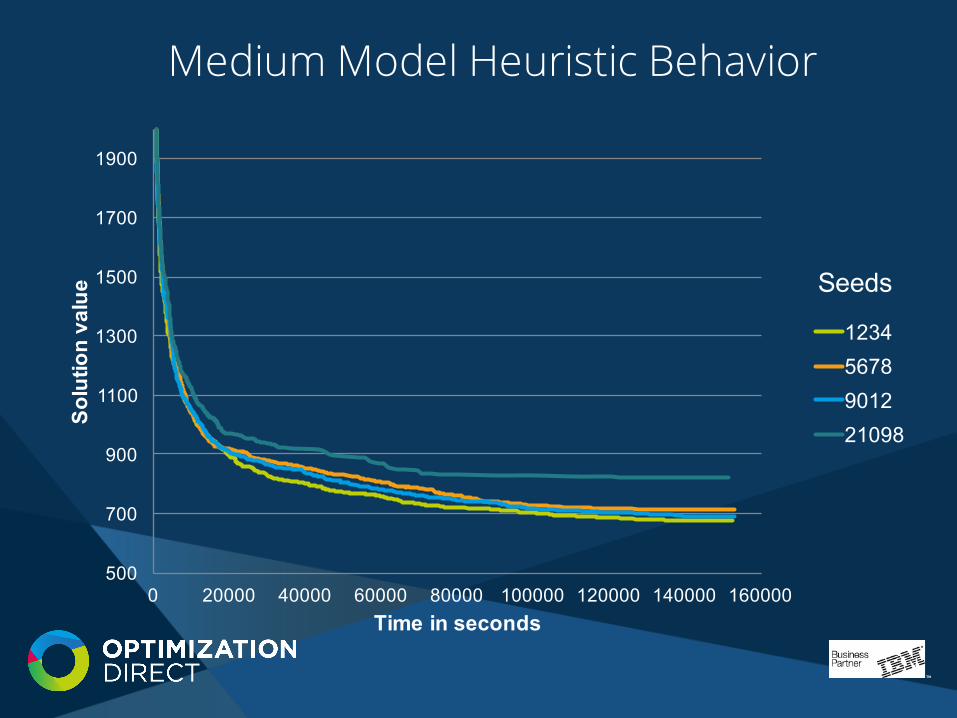
Medium Model Heuristic Behavior
500
700
900
1100
1300
1500
1700
1900
0 20000 40000 60000 80000 100000 120000 140000 160000
Solution value
Time in seconds
12345678901221098
Seeds
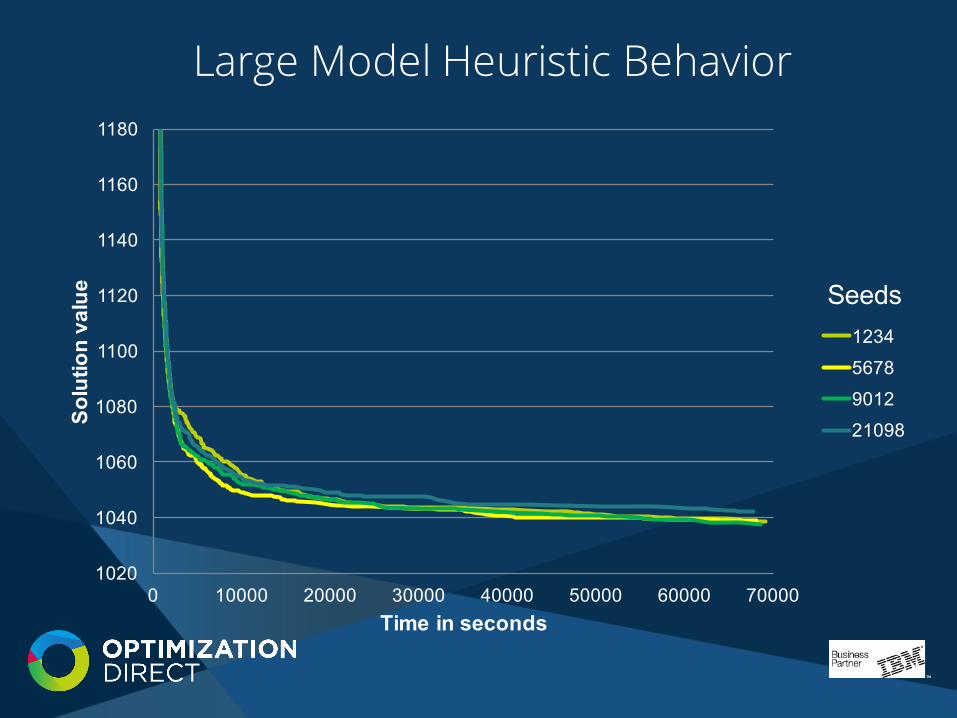
Large Model Heuristic Behavior
1020
1040
1060
1080
1100
1120
1140
1160
1180
0 10000 20000 30000 40000 50000 60000 70000
Solution value
Time in seconds
12345678901221098
Seeds

Parallel Heuristic Approach
• Run several heuristic threads with different seeds simultaneously
• CPLEX callable library very flexible, so• Exchange solution information between runs• Kill sub-model solves when done better elsewhere
• Improves sub-model selection
• 4 instances run on 4 core i7-4790K• Each heuristic thread run with single CPLEX thread
i.e. 1 core each• Compare with serial runs using a single CPLEX thread
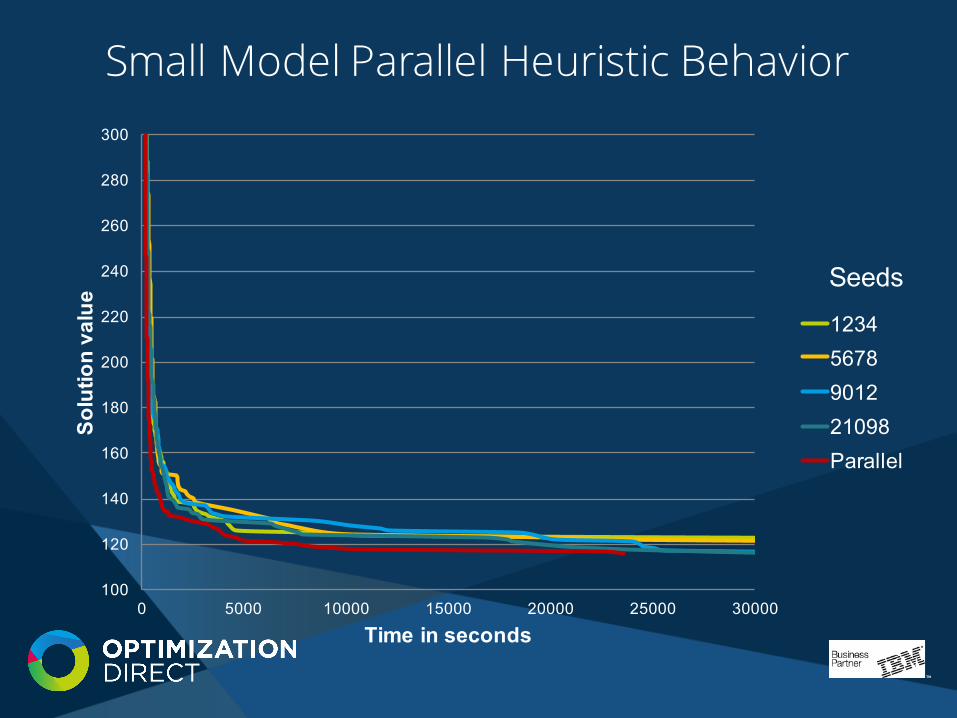
Small Model Parallel Heuristic Behavior
100
120
140
160
180
200
220
240
260
280
300
0 5000 10000 15000 20000 25000 30000
Solution value
Time in seconds
12345678901221098Parallel
Seeds
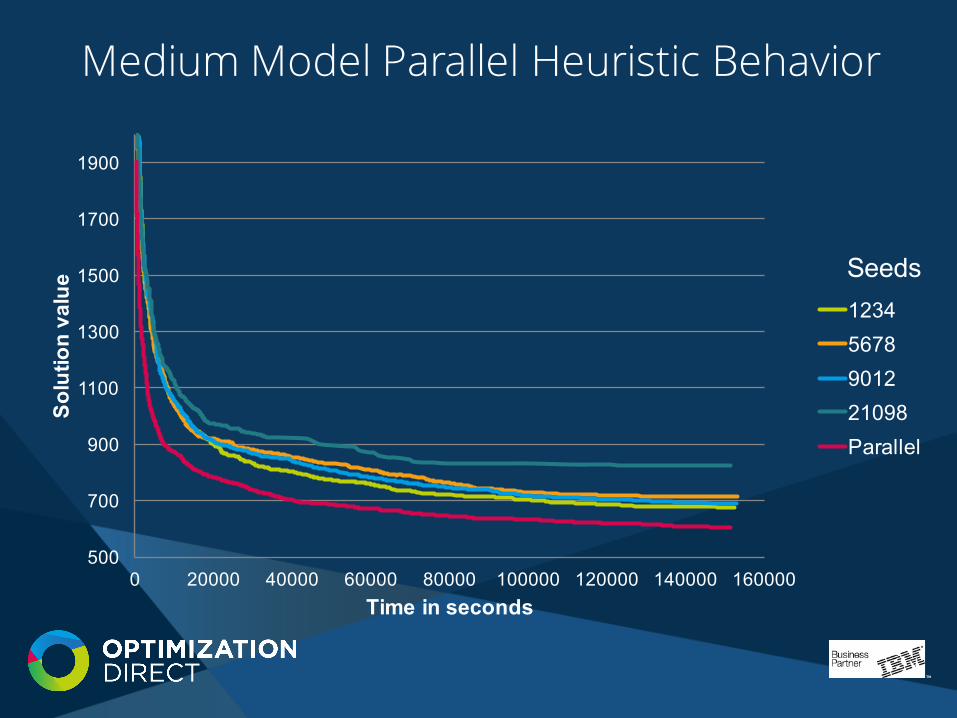
Medium Model Parallel Heuristic Behavior
500
700
900
1100
1300
1500
1700
1900
0 20000 40000 60000 80000 100000 120000 140000 160000
Solution value
Time in seconds
12345678901221098Parallel
Seeds

Large Model Parallel Heuristic Behavior
1020
1040
1060
1080
1100
1120
1140
1160
1180
0 10000 20000 30000 40000 50000 60000 70000
Solution value
Time in seconds
12345678901221098Parallel
Seeds

Parallel Heuristic Advantages
• Better results• Better objective value• More consistent
• Faster• Compare time to interesting (i.e. good) solutions• Speedup depends on model (as with straight MIP)• Depends on which serial run used for comparison
• A factor of 2 to 4 with 4 cores is typical
Model Speedup factorSmall 1.4 to 3.7Medium 2.5 to 8.3Large 1.8 to 2.8
Customized Offers Company:
• Products ( portfolio of products)
• Customers
• More products are added or deleted from the portfolio
• Customers are added or deleted every month; customers have monthly or yearly subscription s
• Objective : retain customers, increase sales
• Action: Send a package recommendation to a customer or–customer has option to cancel or select other package
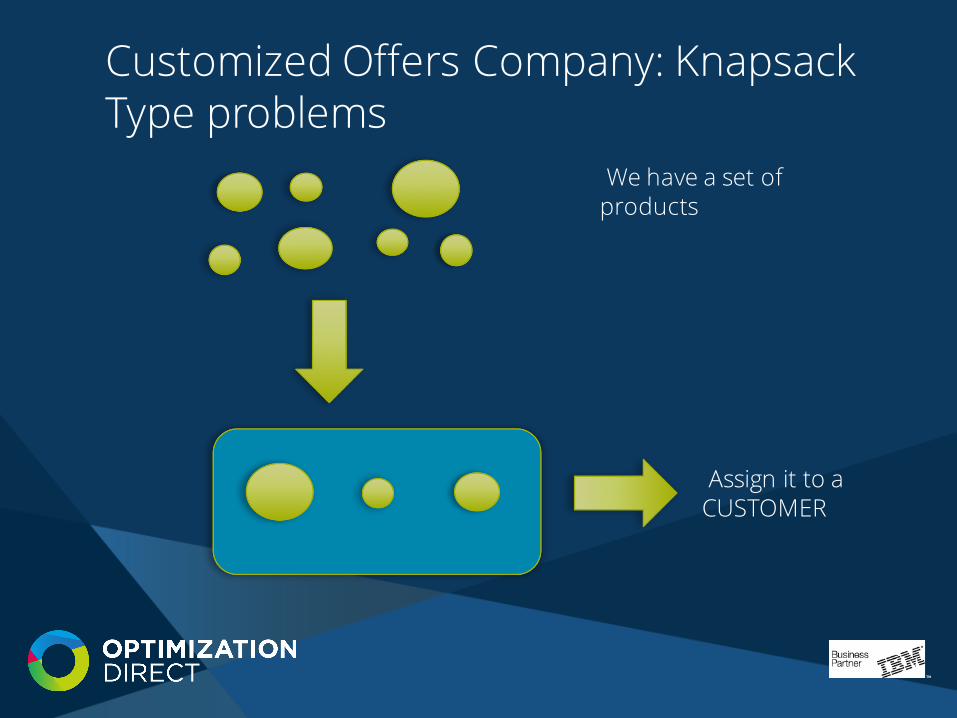
Customized Offers Company: Knapsack Type problems
We have a set of products
Assign it to a CUSTOMER

Solution
• Use CPLEX libraries
• MIP
• Use ODHeuristics to solve some harder problems

Used Case: Dynamic Pricing Using Promotions Markdowns and Clearance strategies
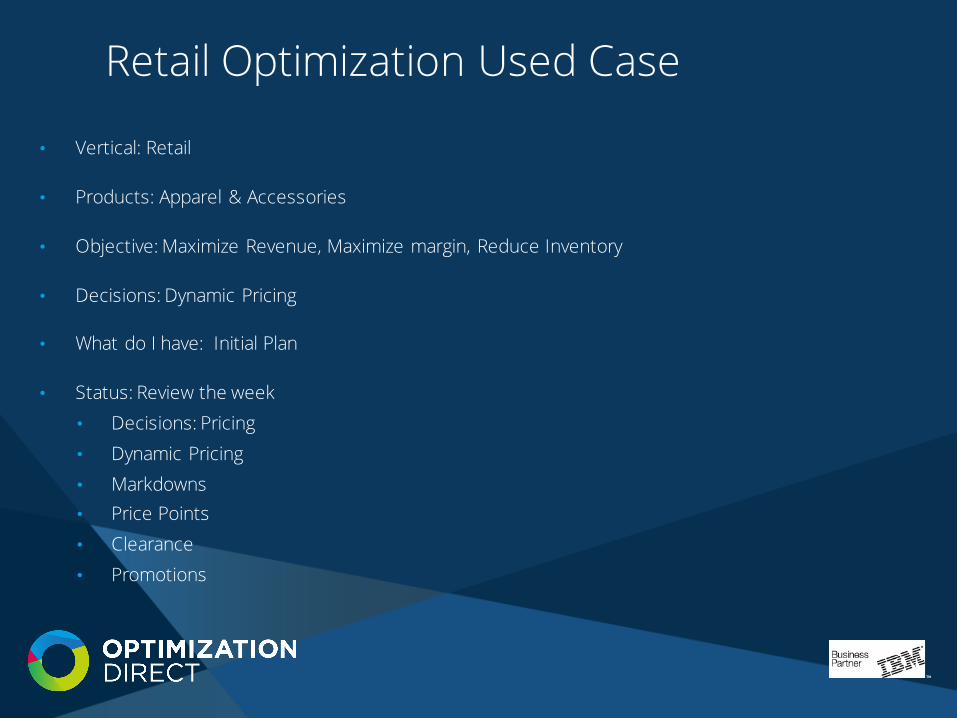
Retail Optimization Used Case
• Vertical: Retail
• Products: Apparel & Accessories
• Objective: Maximize Revenue, Maximize margin, Reduce Inventory
• Decisions: Dynamic Pricing
• What do I have: Initial Plan
• Status: Review the week• Decisions: Pricing• Dynamic Pricing• Markdowns• Price Points• Clearance• Promotions
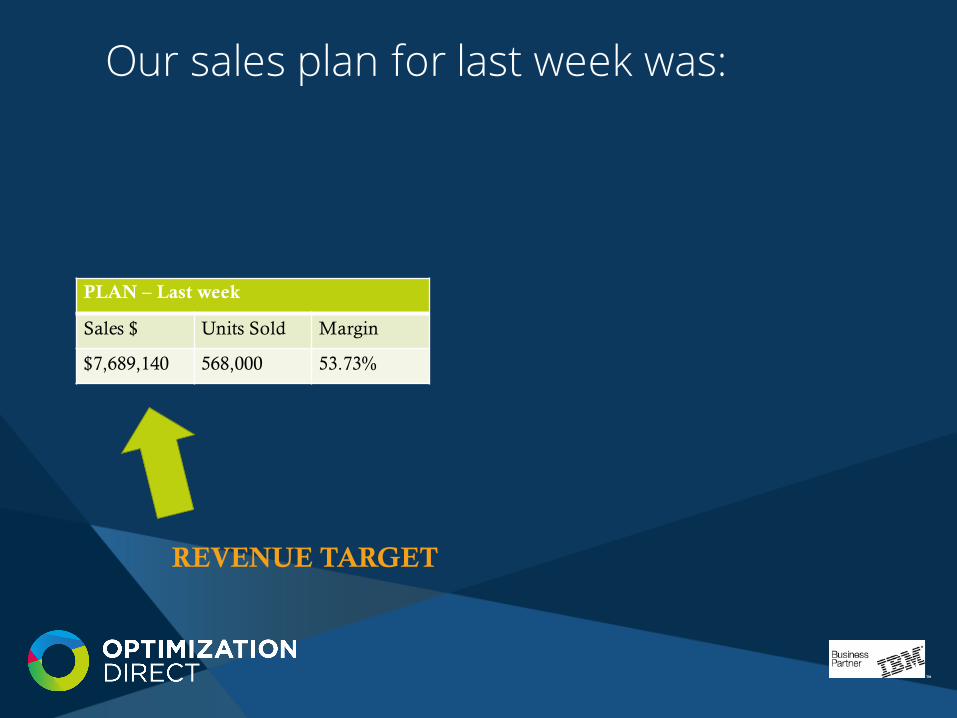
PLAN – Last week
Sales $ Units Sold Margin
$7,689,140 568,000 53.73%
Our sales plan for last week was:
REVENUE TARGET
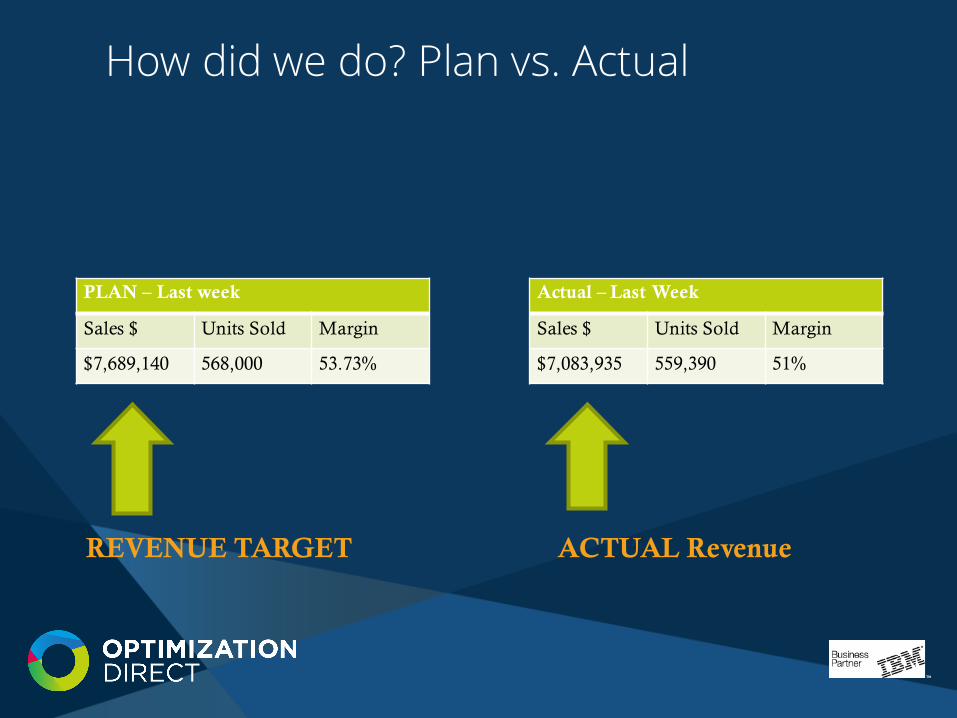
PLAN – Last week
Sales $ Units Sold Margin
$7,689,140 568,000 53.73%
Actual – Last Week
Sales $ Units Sold Margin
$7,083,935 559,390 51%
How did we do? Plan vs. Actual
REVENUE TARGET ACTUAL Revenue
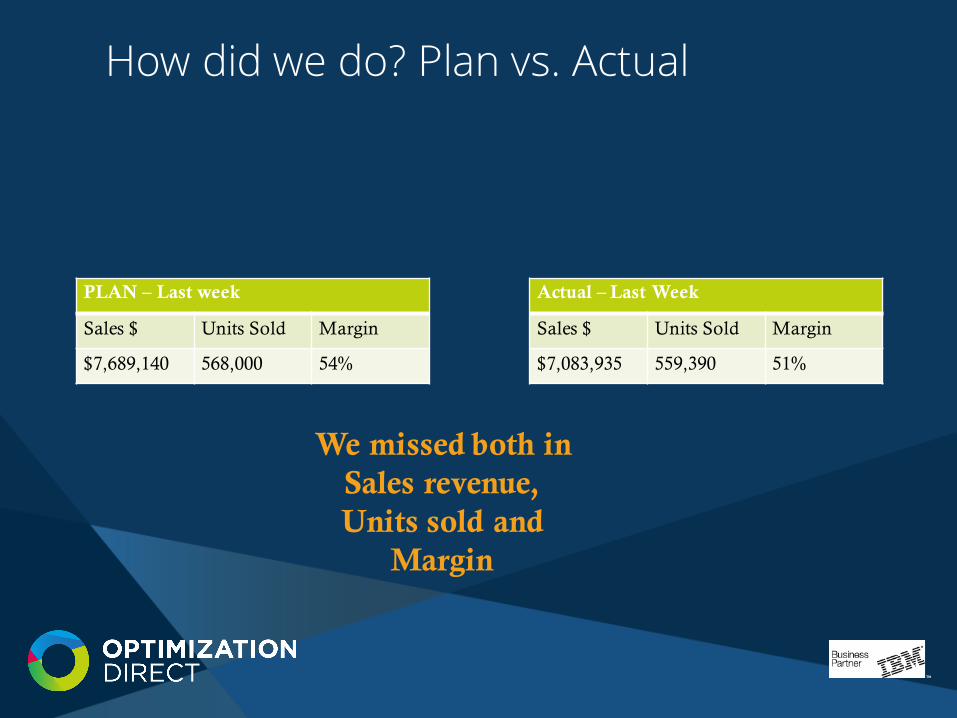
PLAN – Last week
Sales $ Units Sold Margin
$7,689,140 568,000 54%
Actual – Last Week
Sales $ Units Sold Margin
$7,083,935 559,390 51%
How did we do? Plan vs. Actual
We missed both in Sales revenue, Units sold and
Margin
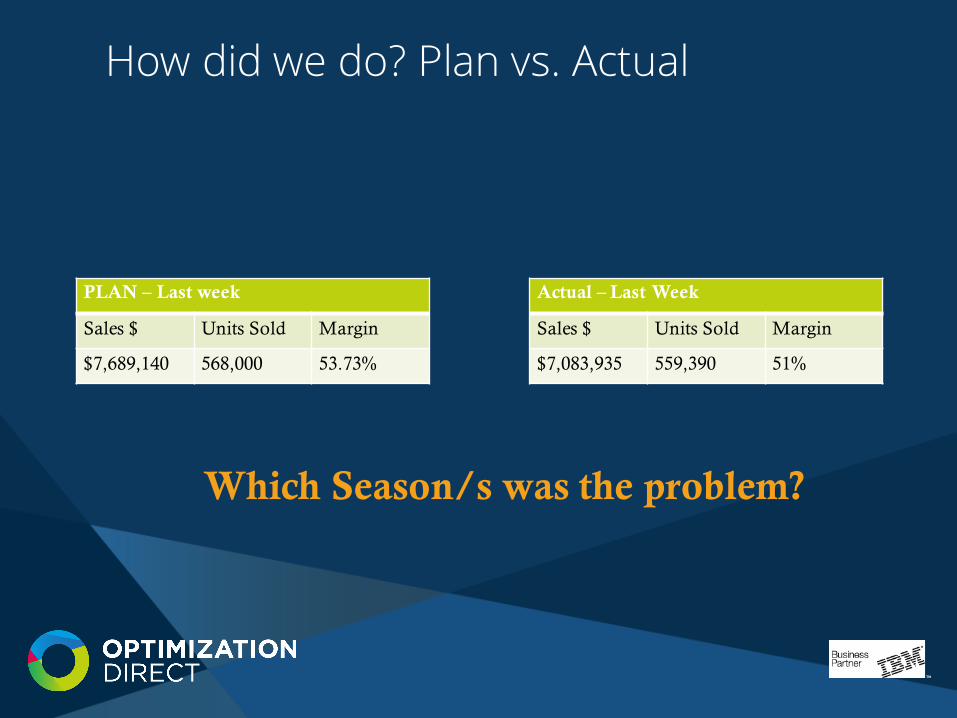
PLAN – Last week
Sales $ Units Sold Margin
$7,689,140 568,000 53.73%
Actual – Last Week
Sales $ Units Sold Margin
$7,083,935 559,390 51%
How did we do? Plan vs. Actual
Which Season/s was the problem?
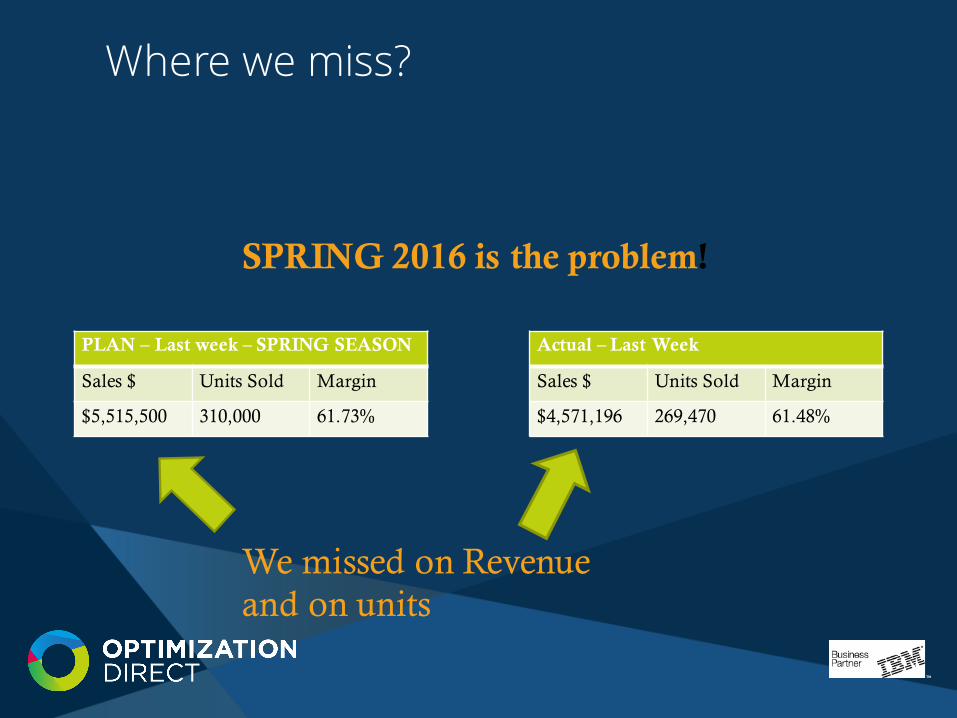
PLAN – Last week – SPRING SEASON
Sales $ Units Sold Margin
$5,515,500 310,000 61.73%
Actual – Last Week
Sales $ Units Sold Margin
$4,571,196 269,470 61.48%
Where we miss?
We missed on Revenue and on units
SPRING 2016 is the problem!
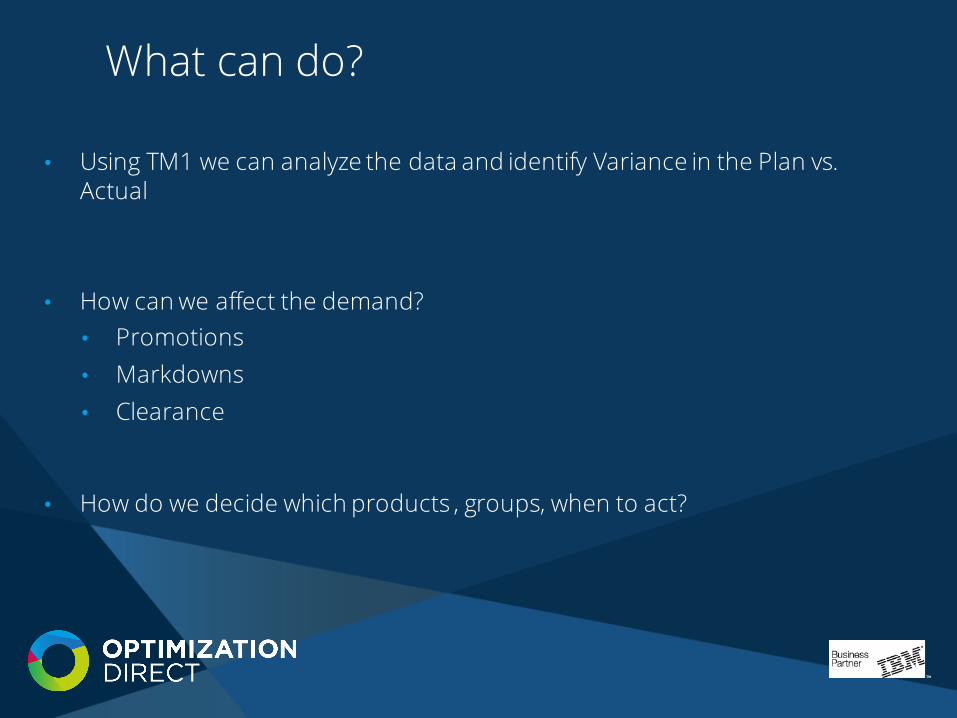
What can do?
• Using TM1 we can analyze the data and identify Variance in the Plan vs. Actual
• How can we affect the demand? • Promotions• Markdowns• Clearance
• How do we decide which products , groups, when to act?
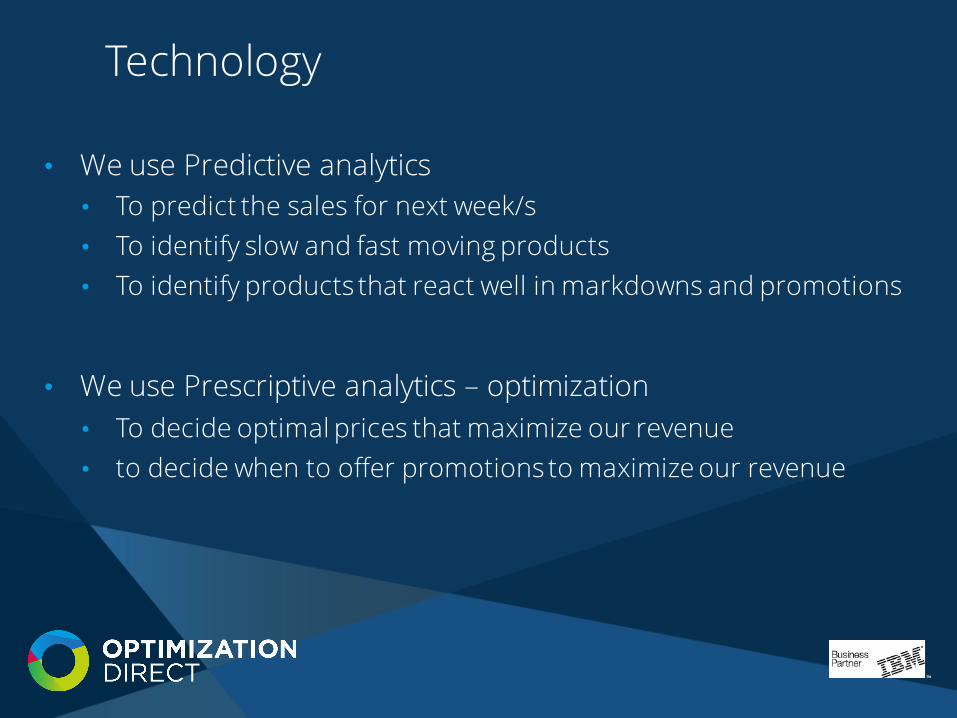
Technology
• We use Predictive analytics• To predict the sales for next week/s• To identify slow and fast moving products• To identify products that react well in markdowns and promotions
• We use Prescriptive analytics – optimization • To decide optimal prices that maximize our revenue• to decide when to offer promotions to maximize our revenue
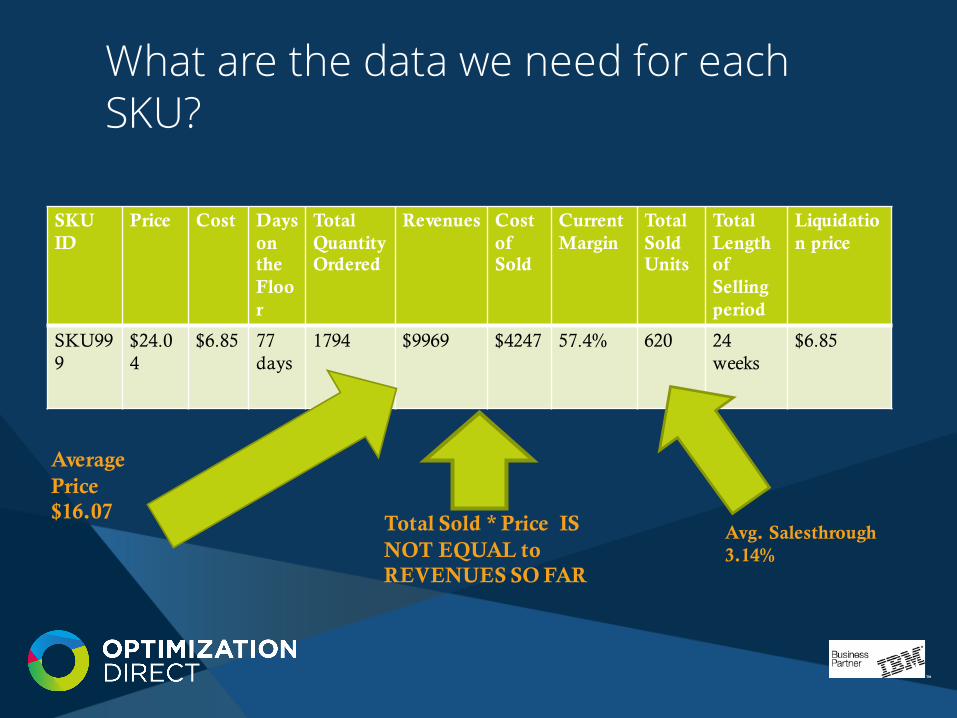
What are the data we need for each SKU?
SKU ID
Price Cost Days on the Floor
Total QuantityOrdered
Revenues Cost of Sold
Current Margin
Total Sold Units
Total Length of Selling period
Liquidation price
SKU999
$24.04
$6.85 77days
1794 $9969 $4247 57.4% 620 24 weeks
$6.85
Total Sold * Price IS NOT EQUAL to REVENUES SO FAR
Average Price$16.07
Avg. Salesthrough3.14%
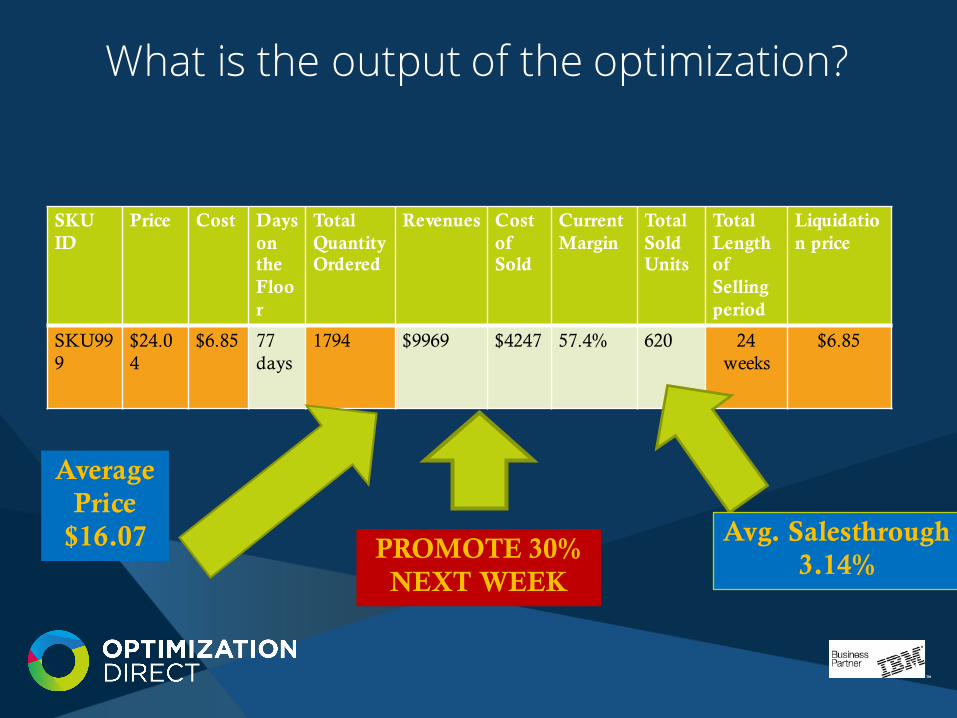
What is the output of the optimization?
SKU ID
Price Cost Days on the Floor
Total QuantityOrdered
Revenues Cost of Sold
Current Margin
Total Sold Units
Total Length of Selling period
Liquidation price
SKU999
$24.04
$6.85 77days
1794 $9969 $4247 57.4% 620 24 weeks
$6.85
PROMOTE 30% NEXT WEEK
Average Price
$16.07 Avg. Salesthrough3.14%
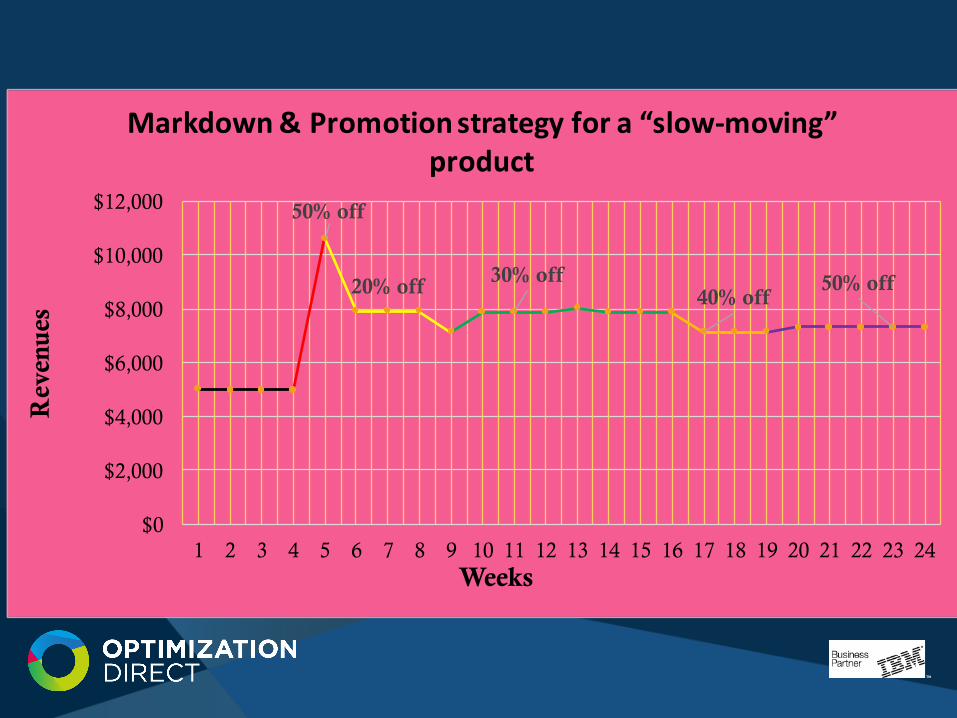
50% off
20% off 30% off40% off
50% off
$0
$2,000
$4,000
$6,000
$8,000
$10,000
$12,000
1 2 3 4 5 6 7 8 9 10 11 12 13 14 15 16 17 18 19 20 21 22 23 24
Rev
enue
s
Weeks
Markdown & Promotion strategy for a “slow-‐moving”product
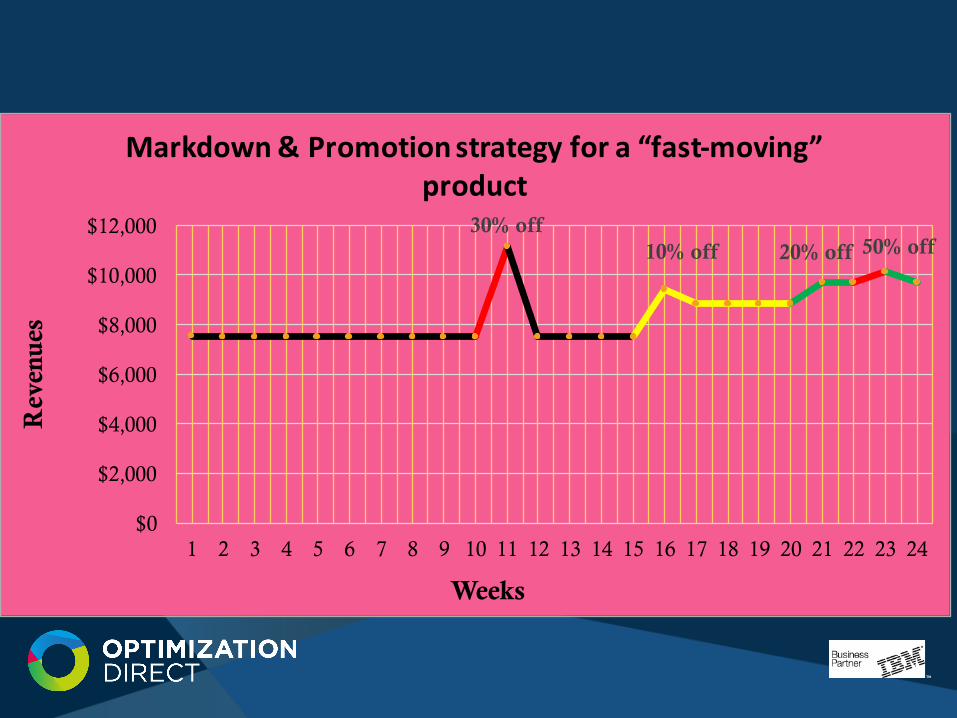
10% off30% off
20% off 50% off
$0
$2,000
$4,000
$6,000
$8,000
$10,000
$12,000
1 2 3 4 5 6 7 8 9 10 11 12 13 14 15 16 17 18 19 20 21 22 23 24
Rev
enue
s
Weeks
Markdown & Promotion strategy for a “fast-‐moving”product

$79,000
$133,000
$187,000
$100,608
$174,846
$204,279
$60,000
$90,000
$120,000
$150,000
$180,000
$210,000
$240,000
Rev
enue
Effect of Markdowns & Promotionson Revenue
Revenue without Markdown & Promotion
Very slow
Slowmoving
Fast-moving
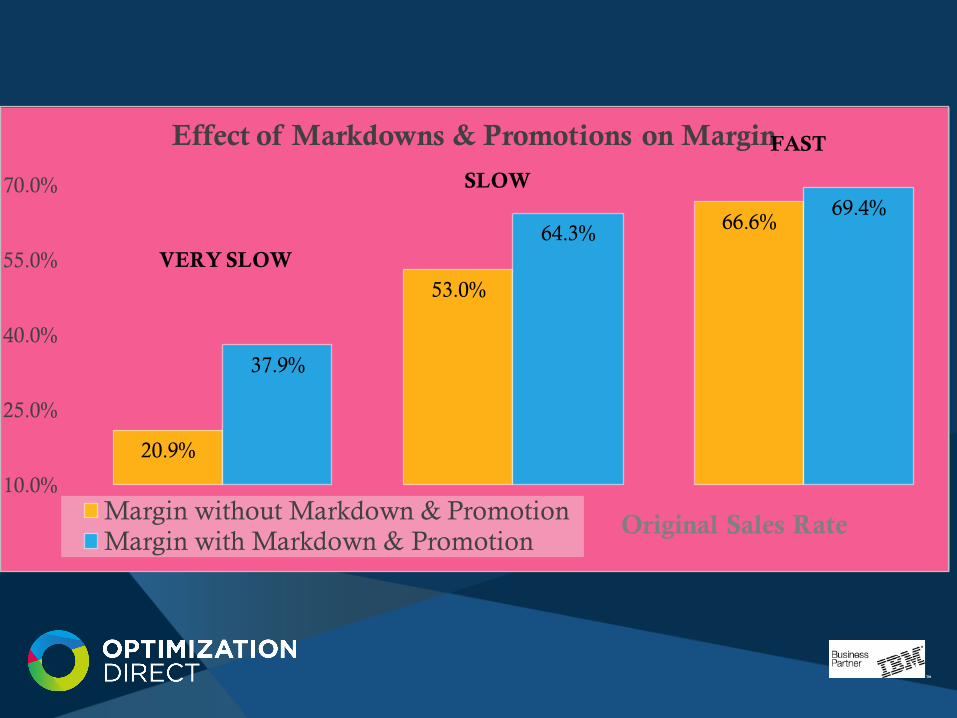
20.9%
53.0%
66.6%
37.9%
64.3%69.4%
10.0%
25.0%
40.0%
55.0%
70.0%
Original Sales Rate
Effect of Markdowns & Promotions on Margin
Margin without Markdown & PromotionMargin with Markdown & Promotion
VERY SLOW
SLOW
FAST
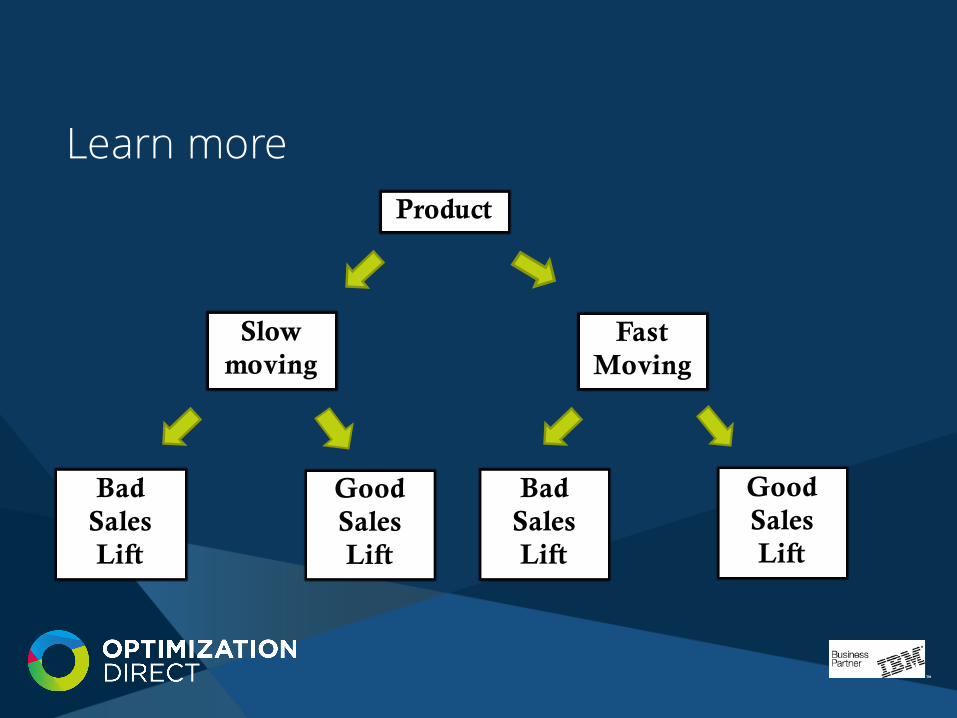
Learn moreProduct
Slow moving
Fast Moving
Bad Sales Lift
Good Sales Lift
Bad Sales Lift
Good Sales Lift
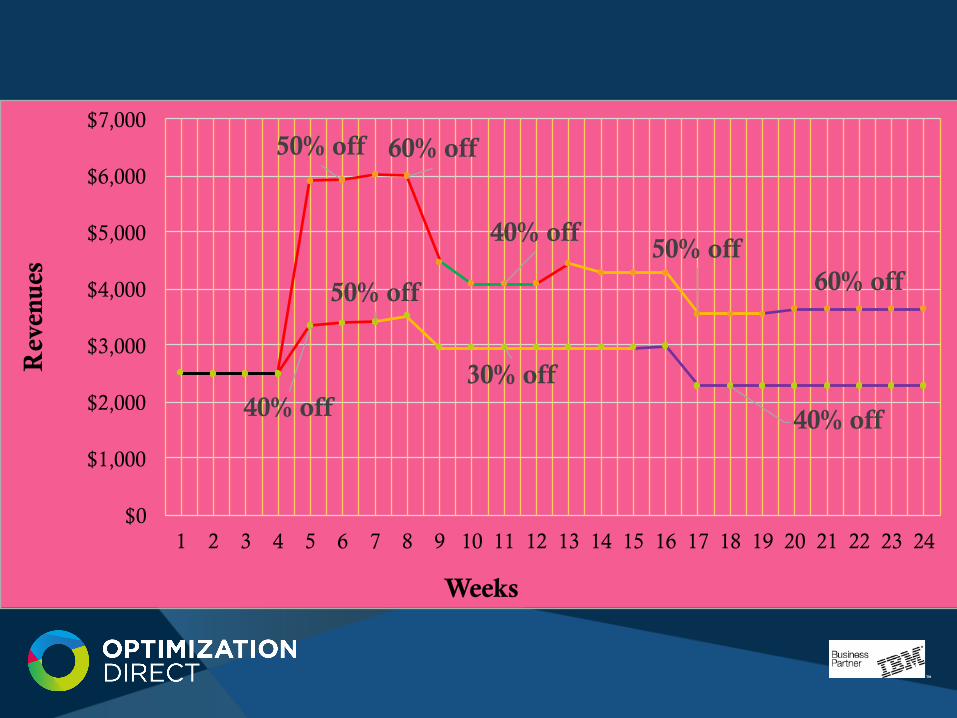
50% off 60% off
40% off50% off
60% off
40% off
50% off
30% off
40% off
$0
$1,000
$2,000
$3,000
$4,000
$5,000
$6,000
$7,000
1 2 3 4 5 6 7 8 9 10 11 12 13 14 15 16 17 18 19 20 21 22 23 24
Rev
enue
s
Weeks
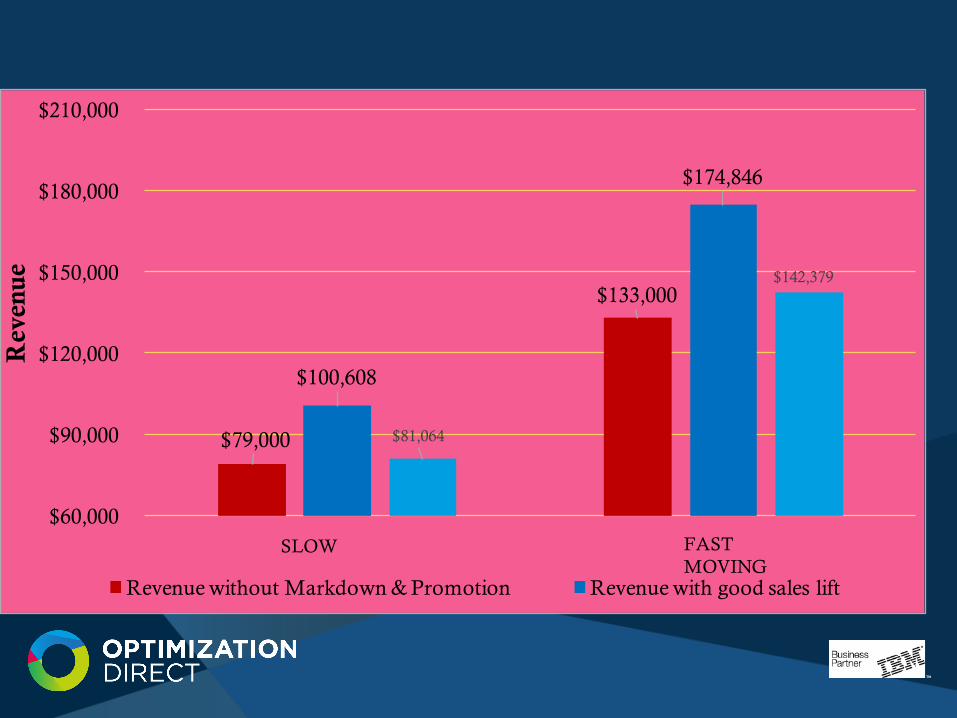
$79,000
$133,000
$100,608
$174,846
$81,064
$142,379
$60,000
$90,000
$120,000
$150,000
$180,000
$210,000
Rev
enue
Revenue without Markdown & Promotion Revenue with good sales lift
SLOW FAST MOVING
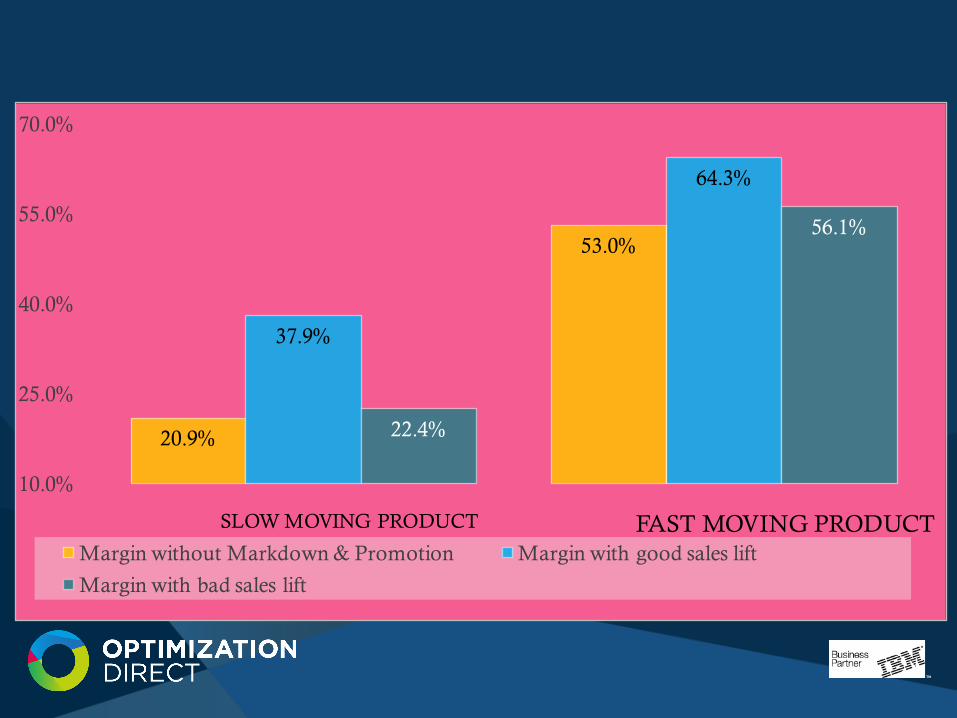
20.9%
53.0%
37.9%
64.3%
22.4%
56.1%
10.0%
25.0%
40.0%
55.0%
70.0%
Margin without Markdown & Promotion Margin with good sales lift
Margin with bad sales lift
FAST MOVING PRODUCTSLOW MOVING PRODUCT
Tutorial: Monday
• Optimization Direct will also be presenting a technology tutorial at INFORMS 2016 on
• Monday April 11 at 3:40pm-4:30pm, Track 10 -Technology Tutorials,
• Regency 6.
• Solving Large Scale Optimization Problems using CPLEX Optimization Studio
Booth 25
• Stop by the booth ……..