Embed Size (px)
Citation preview
ONE
TWO
THREE
FOUR
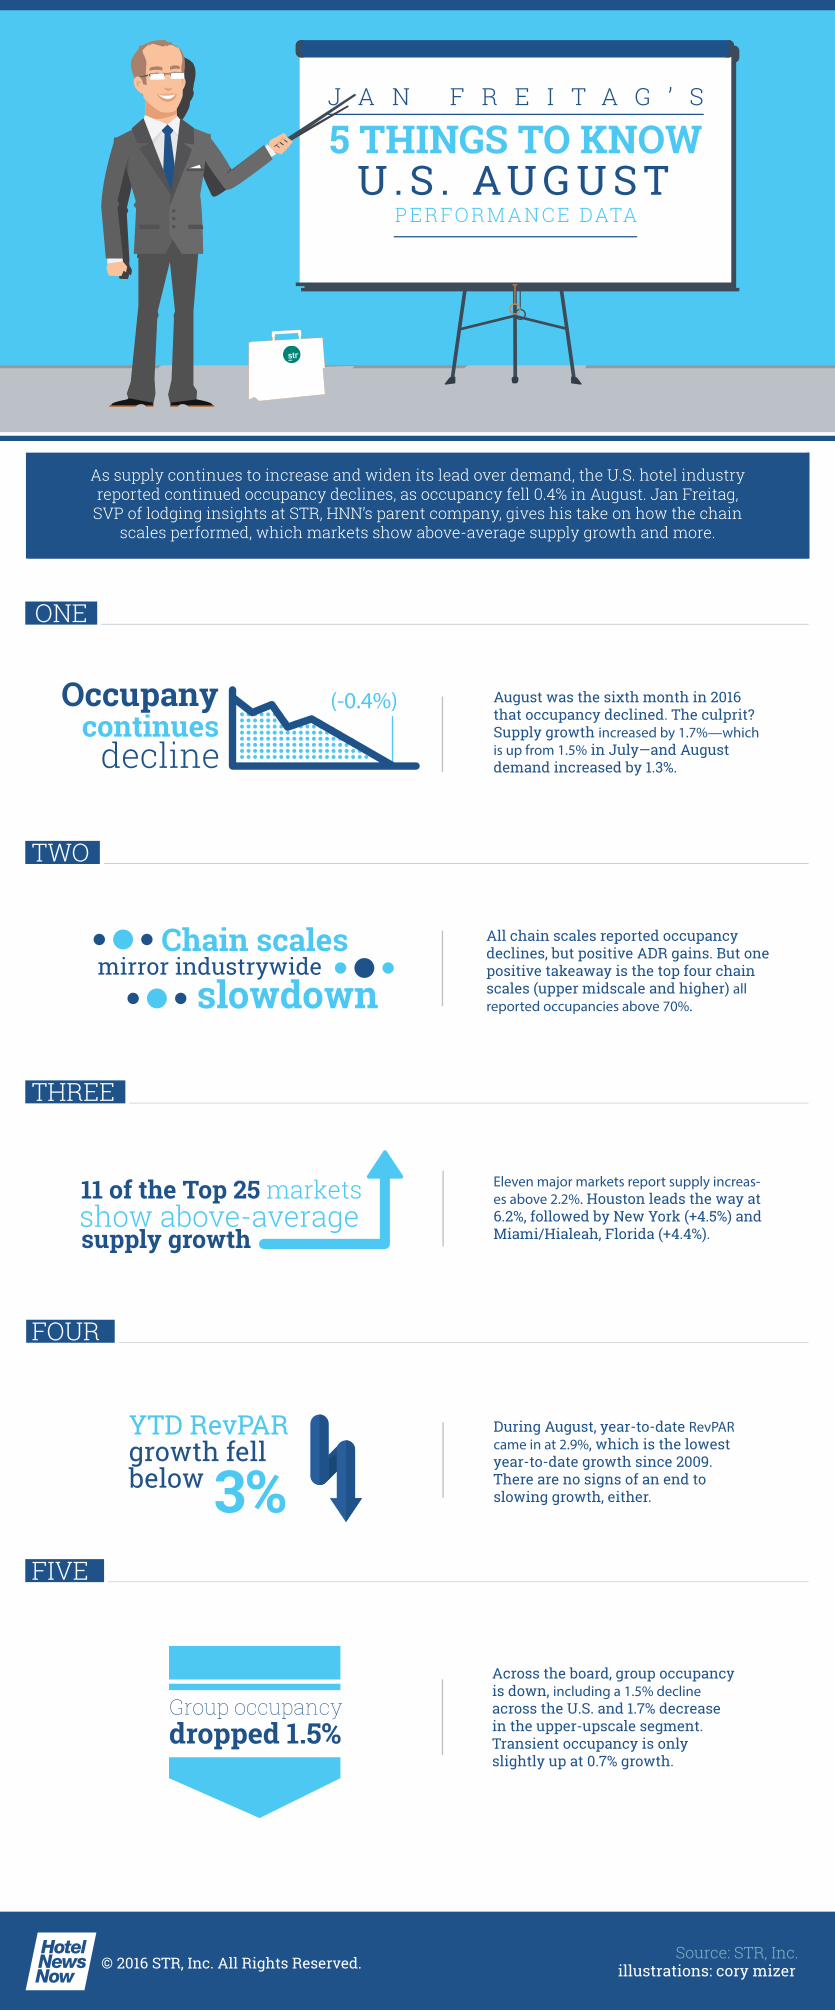
Eleven major markets report supply increas-es above 2.2%. Houston leads the way at 6.2%, followed by New York (+4.5%) and Miami/Hialeah, Florida (+4.4%).
All chain scales reported occupancy declines, but positive ADR gains. But one positive takeaway is the top four chain scales (upper midscale and higher) all reported occupancies above 70%.
During August, year-to-date RevPAR came in at 2.9%, which is the lowest year-to-date growth since 2009. There are no signs of an end to slowing growth, either.
Across the board, group occupancy is down, including a 1.5% decline across the U.S. and 1.7% decrease in the upper-upscale segment. Transient occupancy is only slightly up at 0.7% growth.
FIVE
As supply continues to increase and widen its lead over demand, the U.S. hotel industry reported continued occupancy declines, as occupancy fell 0.4% in August. Jan Freitag,
SVP of lodging insights at STR, HNN’s parent company, gives his take on how the chain scales performed, which markets show above-average supply growth and more.
August was the sixth month in 2016 that occupancy declined. The culprit? Supply growth increased by 1.7%—which is up from 1.5% in July—and August demand increased by 1.3%.
U . S . AU G U S T
(-0.4%)
© 2016 STR, Inc. All Rights Reserved. illustrations: cory mizerSource: STR, Inc.
YTD RevPAR growth fell below