Embed Size (px)
Citation preview

Introductiont JMP f to JMP for StatisticsStatistics
Jeff Skinner, M.S.Biostatistics SpecialistBioinformatics and Computational Biosciences Branch (BCBB)NIH/NIAID/OD/OSMO/OCICBhttp://bioinformatics.niaid.nih.govS i A @ i id [email protected]

JMP Statistical Discovery
• NIAID researchers can request JMP 8.0 for Mac or Windows PC at http://bioinformatics niaid nih govWindows PC at http://bioinformatics.niaid.nih.gov
• Desirable combination of features:Desirable combination of features: Spreadsheet data tables with point-and-click user interface Deep statistical modeling capabilities
Edit bl d i t ti hi h lit hi Editable and interactive high quality graphics “Dynamic variable linking” feature helps you explore your data Comprehensive Design of Experiments (DOE) platform Free NIAID training and support: [email protected]

JMP Starter Window
JMP Starter Window provides shortcuts for useful functions:• JMP Starter Window provides shortcuts for useful functions: Opening data tables, scripts, journals or projects Opening analysis platforms like Design of Experiments, modeling, etc. Setting user preferences for file locations, displayed output, etc.
• Tip of the Day introduces JMP features from tutorials and help menu

Five Types of JMP Files• JMP Data Tables
Spreadsheet files that store data scripts etc Spreadsheet files that store data, scripts, etc.
• JMP Scripts Text files that store JMP Script Language (JSL) codep g g ( )
• JMP Reports Interactive graphs and results from a statistical test
• JMP Journals Publishing files that store read-only data tables, url links, descriptive
figures graphs statistical test results etcfigures, graphs, statistical test results, etc.
• JMP Projects Collection of data tables, scripts, journals and reports, p , j p

Preferences in JMP• General preference settings
Show JMP Starter Window and Tip of the Day at startupDay at startup
• Platforms preferences Customize the output from any statistical
analysis or graph
• File location preferencesFile location preferences Choose default locations for opening and
saving files in Windows

Importing Data
• MS Excel® worksheets can be imported directlycan be imported directly Options for first row header,
multiple sheets, etc. Remember to format your dataRemember to format your data
in MS Excel® first
• Use Text Import PreviewUse Text Import Previewoption to import text files Options for delimited and fixed
width fileswidth files Preview your data columns
before import to save time

Importing from a Database• Windows PC users can open
dBASE and MS Access files di l f JMPdirectly from JMP ODBC drivers are required for
Mac users and other databases
• Open subsets of the database files using click through menus or specific SQL statementsor specific SQL statements Query specific columns or even
select rows of data matching a set of conditions (e.g. sex = male Tip: MS Excel files can be openedset of conditions (e.g. sex male or height < 68 inches).
Click through windows generate SQL statements automatically
Tip: MS Excel files can be opened as database files to import subsets of large files, but subsets of smaller files are best created within JMP

JMP Data Tables
• Table, Columns and Rows menus on the left hand side of the data table• Three places to access Columns and Rows menus:
Columns and rows windows (LHS of the data table) Spreadsheet hotspots (upperleft corner of spreadsheet)
D d i JMP t l b (t f JMP i d ) Drop-down menus in JMP tool bar (top of JMP window)

JMP “Hotspots”• JMP “Hotspots” are clickable red
triangles that provide access totriangles that provide access to additional features in JMP
• Always check the hotspots in your test reports to find additional tests and figures for your analyses
• JMP hotspots make tests more interactive and customizable

Variable Types in JMP• Three types of variables in JMP:
Continuous (blue triangle symbols) Ordinal (ordered green bar symbols) Nominal (unordered red bar symbols)
Ch t t t i bl l b• Character or text variables can only be ordinal or nominal variables in JMP
• Numeric variables can be anything
• Change variable types in the column info• Change variable types in the column info menu or by clicking symbols in the column window (shown right)

JMP Columns (Cols) Menu• Use the column menu to add,
delete, select (go to) or reorder , (g )columns in the data table
• The Column Info menu allowsThe Column Info menu allows you to define the general attributes of your variables
• The Preselect Role menu allows you to specify variable attributes within the analysesattributes within the analyses E.g. ___ is always a response

JMP Columns (Cols) Menu• Label / Unlabel option produces and
removes special labeling in figures for l t d l (t b l)selected columns (tag symbol)
• Hide / Unhide removes columns from view i th d t t bl b t d t thin the data table, but does not remove them from analyses (blindfold symbol)
E l d /U l d t i• Exclude /Unexclude removes certain columns from analyses, but not from the data table (strike through symbol)
• Scroll Lock / Unlock secures the locations of the columns in the data table

JMP Columns (Cols) Menu• The Validation window allows you verify the values
recorded in your data table List Check produces a list of all text responses List Check produces a list of all text responses Range Check reports the min and max for numeric variables,
with a list of possible constraints to remove outliers
• The Recode window allows you to recode text and numeric variables quickly and automatically
The Formula window allows you to create• The Formula window allows you to create transformed variables (e.g. ln(x) ) and generate random data from theoretical distributions
• The Standardize Attributes window allows you to specify identical properties among many columns
JMP Rows Menu
• Add, delete, move and select rows
• Exclude/unexclude, hide/unhide and label/unlabel options same as Cols
• Use Colors and Markers options to identify selected rows in a graphidentify selected rows in a graph
• Powerful data management with RowPowerful data management with Row Editor, Data Filter and Row Selection

Select Where … Option• Click > Rows > Row Selection >
Select Where to open theSelect Where … to open the Select Where window in JMP
• Select rows meeting multiple user-specified conditions Character variable conditions
e.g. Gender = “female” Numeric variable inequalitiesNumeric variable inequalities
e.g. 20% < Percent Body Fat < 45%

JMP Tables Menu
• Summary option creates table of column statistics
• Concatenate to join two tables top-to-bottom if table of column statistics
E.g. mean age, etc.
• Subset option creates a
pthey share columns
• Join tables with unique columns side by sidenew table from selected
rows and columnsSort by column values
columns side-by-side • Update missing values
from a new table• Sort by column values• Stack and Split columns
to rearrange data tables
• Tabulate table stats using drag and drop E g mean age etcto rearrange data tables
• Transpose rows and columns to rotate tables
E.g. mean age, etc.• Missing Data Pattern
finds sampling errors
JMP Toolbar Options
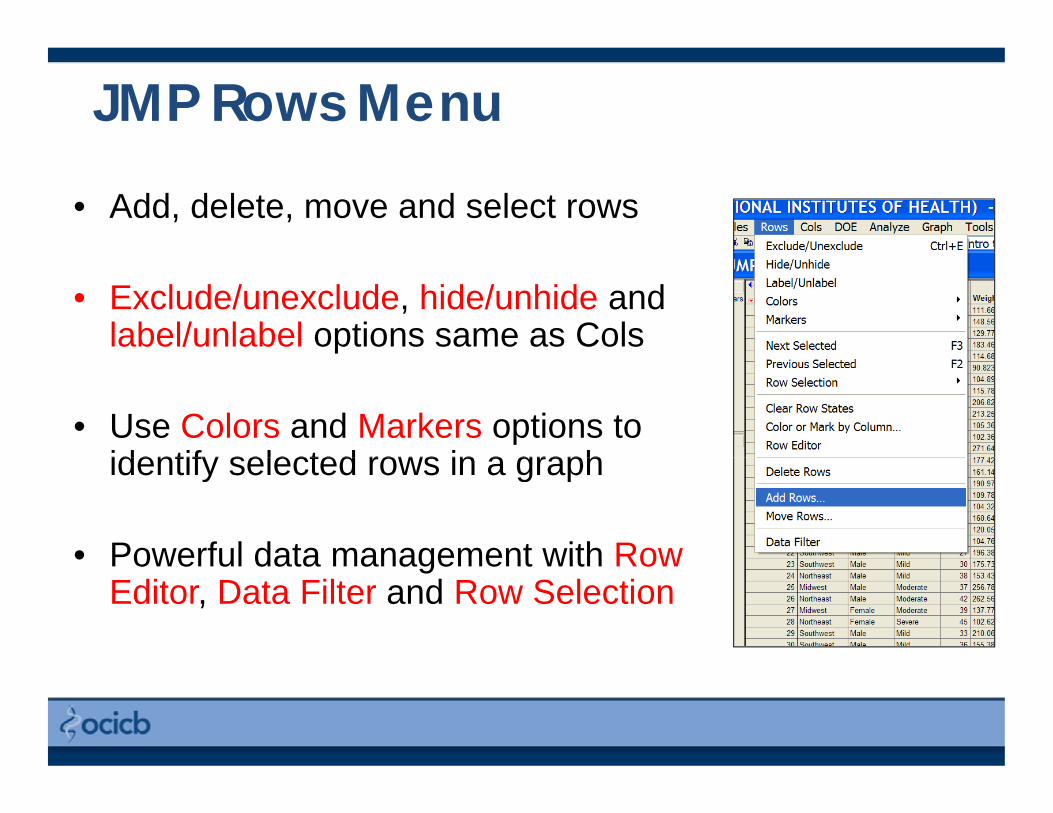
• Arrow tool • Lasso tool Regular cursor arrow
• Help tool Click any JMP object and be
directed its help menus
Select an irregularly-shaped group of points on a graph
• Magnifier tool Zoom in or zoom outdirected its help menus
• Selection tool Select elements of a report or
journal to copy and paste
Zoom in or zoom out• Crosshairs tool
Identify the location of points in a figure or plotj py p
• Scroller tool Precisely scroll in your report
• Grabber tool
g p• Annotate tool
Add notes or captions to a figure or report
Li t l P l t l d Grab and drag axes or other features of a figure
• Brush tool Highlight points on a plot
• Line tool, Polygon tool and Simple Shape tool Draw lines, polygons and simple
shapes on reports Highlight points on a plot p p

JMP Graphs Menu• Use Graph Builder for drag-and-drop
200
250
Bubble Plot of Weight by Calories Sized by Percent Body Fat
• Use Chart for pie charts and bar charts
• Use Overlay and Scatterplot 3D to100
150
Wei
ght
1000 1500 2000 2500 3000 3500Calories
Circle SizeUse Overlay and Scatterplot 3D to create customizable scatter plots
• Animate a Bubble Plot over time
Circle Size
• Animate a Bubble Plot over time
• Use Cell Plot to create “heat maps”Tree Map of Region, Adverse Event
• Use Tree Map to view relationships among categorical variables
Anemia Erythema
Headache
Induration
Leukopenia
Malaise Nausea
Pain Papule
Swelling
Anemia
Ecchymosis
Leukopenia
Malaise Nodule
Pain Swelling
Anemia Headache
Induration
Papule
Anemia
Ecchymosis
Erythema
Headache
Leukopenia
Malaise
Mylagia
Tenderness
Anemia
Arthralgia
Dimpling Headach
Myalgia Nausea
Midwest Northwest Southeast
Southwestamong categorical variablesElavated CH
50
Erythema
Pain Swelling
Tenderness
e
Induration
Leukopenia
Pain Swelling
TendernessNortheast Southwest

JMP Analyze Menu• Distribution procedure
Collect descriptive statistics, create histograms and run hypothesis tests
• Modeling procedures Nonlinear procedures for curve fitting
P titi f d t l tihistograms and run hypothesis tests on individual variables
• Fit Y by X procedure Automatically fits the appropriate
relationship between two variables
Partition for data exploration Neural nets and time series models Categorical platform for log-linear
models and share charts (JMP 7.0) Gaussian processes and screeningrelationship between two variables
Simple linear regression, one-way ANOVA, logistic regression and chi-square tests for table data
• Matched pairs procedure
Gaussian processes and screening platforms (JMP 7.0)
• Multivariate procedures Correlations, PCA, clustering,
discriminant analysis item analysis• Matched pairs procedure Paired t-tests and related figures
• Fit model procedure Used to fit more complicated models
discriminant analysis, item analysis and partial least squares (PLS)
• Survival and Reliability Kaplan-Meier and log-rank testsp
with multiple factors, etc. Includes general linear models (OLS),
stepwise and multivariate procedures, generalized linear models (GLS), etc.
Parametric survival Proportional hazards Recurrence analysis

The Distribution Platform• Descriptive Statistics
Moments: mean, variance, standard deviation, etc. Quantiles: median, interquartile range (IQR), etc
• Descriptive Figuresp g Histograms and boxplots Stem and leaf, empirical cumulative distribution
function (ecdf) and normal quantile-quantile plots
• One-sample Inferences Hypothesis tests for means and standard
deviationsdeviations Confidence, prediction and tolerance intervals Distribution fitting with goodness-of-fit testing

“Broadcasting” Your Hotspot• Sometimes you want to perform several of the
same tests all at the same time
• Two options:p Set your platform preferences to request special tests from the
hotspot every time “Broadcast” your Hotspot options by control clicking any of
the individual results
• Speed up workflow and reduce “click thru”• Speed up workflow and reduce click-thru

JMP Script Features• JMP scripting mostly for “power users” who want
to simplify processing or create new procedures
• Scripting Window also used for “SAS Integration” to access SAS features
T h l f l f t f l• Two helpful features for casual users Save analyses to their respective data tables Leave helpful notes in data tablesLeave helpful notes in data tables

JMP Fit Y by X Platform• Fit Y by X chooses the correct
analysis for any pair of variablesy y p Simple linear regression for continuous
response and predictor variables Logistic regression for categorical response g g g p
and continuous predictor One-way ANOVA for a continuous response
and categorical predictor Contingency tables for categorical response
and predictor variables
30
35
40
45
50
Bod
y Fa
t
Bivariate Fit of Percent Body Fat By Calories
• Fit Y by X often has both parametric and nonparametric tests in hotspots
5
10
15
20
25
Per
cent
B
1000 1500 2000 2500 3000 3500Calories

JMP Fit Model Platform• Used to fit most models with three or
more predictor variablesp• Choose the response variables Y,
the model effects X and the model personality to determine the model JMP will help guide you by providing
appropriate options for your variablesappropriate options for your variables Model types determined by selected
variables and model personality
Multiple regression
Multifactor ANOVA
Linear mixed models
• Contact [email protected] help building models
Generalized linear models (GLIM)
Proportional hazards d i i land parametric survival

Construct Model Effects • Cross two predictors to evaluate an interaction
I.e. synergy of fertilizer and hydration levels on plant yieldI.e. synergy of fertilizer and hydration levels on plant yield
• Nest two predictors when the levels of one variable depend on the levels of anothervariable depend on the levels of another I.e. auto make and model effects (e.g. Ford Mustang)
• Choose the Random effect attribute when factor levels represent a random sample from the larger populationthe larger population E.g. Hospital and subject are random effects drawn from
populations of all possible hospitals and patients
Model Personalities• Standard Least Squares used for most ANOVA and
regression models with continuous response variables
• Use Stepwise personality for model selection
• Use MANOVA for multivariate response variables
• Nominal or Ordinal Logistic for categorical responses
Use Generalized linear models to test for overdispersion• Use Generalized linear models to test for overdispersioneffects in least squares, logistic or log-linear models

SAS Integration• Use JMP to access procedures
from a SAS license E.g. NLMixed, GLIMMIX, etc.
• Click > File > SAS > Server• Click > File > SAS > Server connections to access a SAS license on the local machine or on a remote serveron a remote server
• Submit SAS code directly fromSubmit SAS code directly from a JSL script window

JMP DOE Menu• Design of Experiments (DOE) Platform in
JMP allows you to utilize statistics concepts y pwhile planning your experiments Estimate power and necessary sample sizes Plan efficient experiments intended to find important effects Plan efficient experiments intended to find important effects
or optimize responses
• Designed Experiments in JMP presentations are available for any who are interested