Embed Size (px)
DESCRIPTION
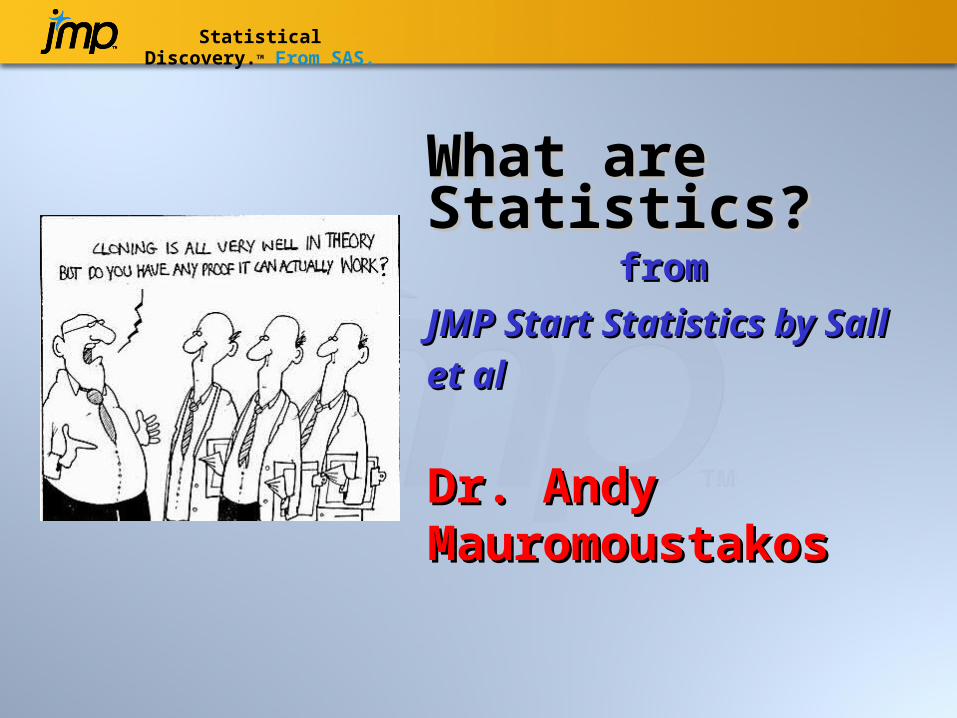
What are Statistics? from JMP Start Statistics by Sall et al. Dr. Andy Mauromoustakos. Business of Statistics. The Discipline of Statistics provides the framework of balance sheets and income statements for scientific knowledge. - PowerPoint PPT Presentation
Citation preview
Statistical Discovery.TM From SAS.
What are Statistics?What are Statistics?from from
JMP Start Statistics by Sall et al JMP Start Statistics by Sall et al
Dr. Andy MauromoustakosDr. Andy Mauromoustakos
Business of StatisticsBusiness of Statistics The Discipline of Statistics provides the framework of balance
sheets and income statements for scientific knowledge. Statistics is an accounting discipline, but instead of accounting for
money, it is accounting for scientific credibility. There are important phenomena that you can’t uncover without
statistics. A special joy in statistics is when it used as discovery tool to find
out new phenomena. Statistics fits models, weighs evidence, helps identify pattern in
data, and then helps find data points that don’t fit patterns. Statistics is induction from experience; it is there to keep score on
evidence that supports scientific models. Statistics is necessary bureaucracy of science.
2

Yin and Yang of StatisticsYin and Yang of Statistics First, there is the Yang of statistics, a shining sun.
The Yang is always illuminating, condensing, evaporating uncertainty, and leaving behind the precipitate of knowledge.
Yang pushes the phenomenon into forms. The Yang mechanically cranks through the ore of knowledge and distills it to
answer.
On the other side, we find the contra positive Yin, the moon, reflecting light.
The Yin catches the shadow of the world, feeling the shape of truth under the umbra.
The Yin draws out the puzzle pieces to tantalize our curiosity. The Yin teases our awareness and tickles our senses of mystery until the climax
of revelation – Eureka!
The Yin and Yang are forever interacting, catalyzed by Random, the agent of uncertainty.
3
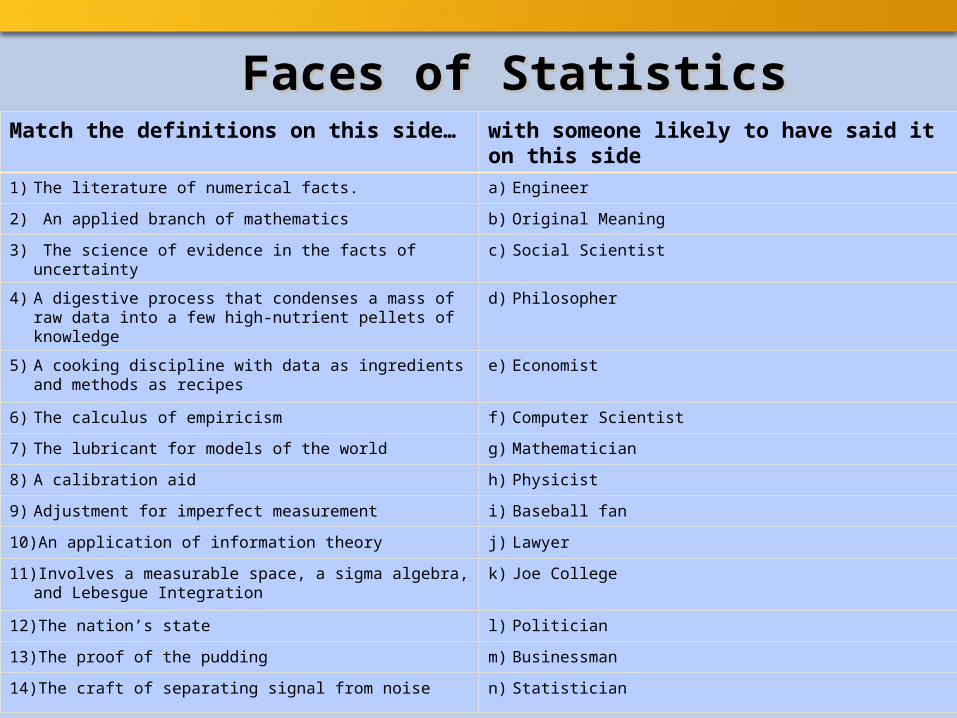
Faces of StatisticsFaces of Statistics
4
Match the definitions on this side… with someone likely to have said it on this side
1) The literature of numerical facts. a) Engineer
2) An applied branch of mathematics b) Original Meaning
3) The science of evidence in the facts of uncertainty c) Social Scientist
4) A digestive process that condenses a mass of raw data into a few high-nutrient pellets of knowledge
d) Philosopher
5) A cooking discipline with data as ingredients and methods as recipes
e) Economist
6) The calculus of empiricism f) Computer Scientist
7) The lubricant for models of the world g) Mathematician
8) A calibration aid h) Physicist
9) Adjustment for imperfect measurement i) Baseball fan
10)An application of information theory j) Lawyer
11)Involves a measurable space, a sigma algebra, and Lebesgue Integration
k) Joe College
12)The nation’s state l) Politician
13)The proof of the pudding m) Businessman
14)The craft of separating signal from noise n) Statistician

Don’t PanicDon’t Panic Abstract MathematicsAbstract Mathematics
Though statistics can become quite mathematical to those so inclined, applied statistics can be used effectively with only basic mathematics.
LingoLingo Statisticians often don’t bother to translate like “Heteroskedasticity” into “Varying
variances” or “Multicollinearity” into “Closely related variables.
Awkward PhrasingAwkward Phrasing There is a lot of subtlety in statistical statements that can sound awkward, but the
phrasing is very precise and means exactly what it says. Ex: “The Statistical test failed to reject the null hypothesis of no effect at the
specified level of alpha”.
Bad ReputationBad Reputation “Statistics can prove anything.” This is what happens when you twist a term
“nonsignificant” into “no effect”.
UncertaintyUncertainty Although we are comfortable with uncertainty in ordinary life, we are not used to
embrace it in our knowledge of the world. Ex: 90% chance of rain.
5

Three Levels of UncertaintyThree Levels of Uncertainty Random EventsRandom Events
Even if you know everything possible about the current world, unpredictable events still exist.
We make models with random error terms to account of uncertainty due to randomness
Some of the error term may be attributable to ignoring details, some may be measurement
Unknown ParametersUnknown Parameters Not only are you uncertain how an even is going to turn out, you often don’t even
know what the numbers (parameters) are in the model that generates the events. You have to estimate the parameters and test if hypothesized values of them are plausible, given the data.
Unknown ModelsUnknown Models Not only are you uncertain how an even is going to turn out, you often don’t even
know what the numbers (parameters) are in the model that generates the events. You have to estimate the parameters and test if hypothesized values of them are
plausible, given the data.
6
Probability and RandomnessProbability and Randomness In old days, statistics texts all began with chapters on probability. Today, many popular statistics books discuss probability in later
chapters. When we make observations or collect measurements, our
responses are said to have a probability distribution. We calculate statistics using probability distributions, seeking the
safe position of maximum likelihood, which is the position of least improbability.
The significance of an event is reported in terms of probability. We demolish statistical null hypotheses by making their consequences look incredibly improbable.
7
AssumptionsAssumptions Statisticians are normally conservative professionals. Even conclusions are hypothetical with phrases like “if you say the
hypothesis is false, then the probability of being wrong is less than 0.05”.
Ceteris Paribus: A crucial assumption is the ceteris paribus clause, which is Latin for other
things being equal.
Is the model correct? Most important assumption is that your model is right. Statistics almost always measure one model against a sub model, and
these have no validity if neither model is appropriate in the first place.
Is that Sample Valid? The other supremely important issue is that the data relate to your
model; that is, that you have collected your data in a way that is fair to the questions you ask it.
8

Data MiningData Mining One issue that most researchers are guilty of to a certain extent is
stringing together a whole series of conclusions and assuming that the joint conclusion has the same confidence as the individual ones.
As example of this is Data Mining, in which hundreds of models are tried until one is found with the hoped-for results.
Suppose 20 unrelated researchers do the same experiment, and by random chance one researcher got a 0.05-level significant result. That’s the result gets published.
In light of all the assumptions and pitfalls, it is appropriate that statisticians are cautious in the way they phrase the results. Our trust in our results has limits.
9
Statistical TermsStatistical Terms In the following list, some definitions are same as you are used to,
and some are the opposite. ModelModel A statistical model is a mathematical equation that predicts the response
variable as a function of other variables, together with some distributional statements about the random terms that allow it to not fit exactly.
ParametersParameters To statistician, parameters are unknown coefficients in a model, to be
estimated and to test hypotheses about. Unfortunately, engineers use the same word (parameters) to describe the
factors themselves.
HypothesesHypotheses In science, the hypothesis is the bright idea that you want to confirm. In statistics, this is upside down because it uses logic analogous to a
proof-by-contradiction. The so called null hypothesis is usually the statement that you want to
demolish.
10
Statistical TermsStatistical Terms Two-sided versus One-Sided, Two-tailed versus one-tailedTwo-sided versus One-Sided, Two-tailed versus one-tailed Null hypothesis can be stated as some parameter in a model is zero. The
alternative is that it is not zero, which is called two-sided alternative. You can also substitute the word “tailed” for “sided”. The idea is to get a
big statistics that is way out in the tails of the distribution where it is highly improbable.
You measure how improbable by calculating the area of one of the tails, or other, or both.
Statistical SignificanceStatistical Significance Statistical significance is a precise statistical term that has no
relation to whether an effect is of practical significance in the real world.
There is a real difference in the conclusion made by analyzing ton of data and a very little data.
A nonsignificant result is one that might be the result of random variation rather than a real effect.
11

Statistical TermsStatistical Terms Significance Level, p-value, -levelSignificance Level, p-value, -level To reject a null hypothesis, you want small p-values. The p-value is the probability of being wrong if you declare an effect to
be non-null; that is, the probability of rejecting a ‘true’ null hypothesis. The p-value is sometimes labeled as the significance probability. The -level is your standard of the p-value you claim, so that p-value
below this reject the null hypothesis.
Power, -levelPower, -level Power is how likely you are to detect an effect if it is there. The more
data you have, the more statistical power.
Confidence IntervalConfidence Interval Confidence intervals are now considered one of the best ways to report
results. It is expressed as percentage of 1- , so an 0.05 alpha level for a two-
tailed t-quantile can be used for a 95% confidence interval.
12

Statistical TermsStatistical Terms Biased, UnbiasedBiased, Unbiased An unbiased estimator is one where the expected value of an estimator
is the parameter being estimated.
Sample mean versus True MeanSample mean versus True Mean You can calculate the sample mean from the data – sum divided by the
number. The True mean is the expected value of probability distribution that
generated your data.
Variance and Standard Deviation, Standard ErrorVariance and Standard Deviation, Standard Error Variance is the expected squared deviation of a random variable from its
expected value. Standard deviation is the square root of the variance The term standard error describes an estimate of standard deviation of
another estimate.
13

Statistical TermsStatistical Terms Degrees of FreedomDegrees of Freedom Degrees of freedom (DF) are the specific name for a value that indexes
some popular distribution of test statistics. It is called the degrees of freedom because it relates to differences in
number of parameters that are or could be in the model. The more parameter a model has, the more freedom it has to fit the data
better. The DF for a test statistics is usually the difference in the number of
parameters between two models.
14
Time to play with Statistics!