Embed Size (px)
Citation preview

Portable Gaming Spotlight, 2014 Review February 2015

2
1 2 3
Installed Base Snapshot 2014 Spending Patterns Key Themes & Takeaways

3
Worldwide Smartphones & Tablets Used for Gaming Installed Base Shares by OS, 4Q13 & 4Q14
0%
25%
50%
75%
Android iOS All Others
4Q13
4Q14
+5.2 pts -‐2.8 pts
Source: IDC
-‐2.3 pts
• The installed base (IB) for smartphones and tablets used for gaming exceeded 1B in 4Q14 for the first time
• Android’s share of this installed base approached 75% in 4Q14 • “All Others” is largely Windows, BlackBerry and Symbian devices
4
0 5 10 15 20 25 30 35
Nintendo 3DS & 2DS
Sony PlayStaHon Vita & PSP
Nintendo DS & DSi
Millions (U
nits)
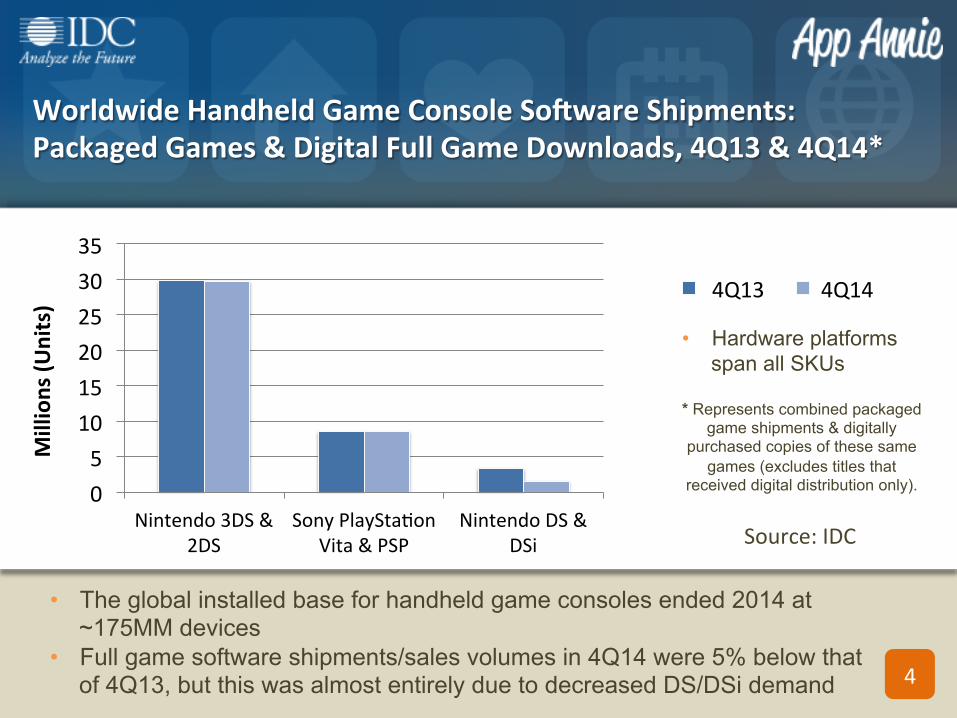
4Q13 4Q14 • Hardware platforms
span all SKUs
* Represents combined packaged game shipments & digitally
purchased copies of these same games (excludes titles that
received digital distribution only).
Worldwide Handheld Game Console SoGware Shipments: Packaged Games & Digital Full Game Downloads, 4Q13 & 4Q14*
• The global installed base for handheld game consoles ended 2014 at ~175MM devices
• Full game software shipments/sales volumes in 4Q14 were 5% below that of 4Q13, but this was almost entirely due to decreased DS/DSi demand
Source: IDC

We hope you found the provided information
helpful.
Click below to download the full presentation.
Download