Embed Size (px)
DESCRIPTION
2011 Economic & Workforce Overview from the Maricopa Community Colleges Center for Workforce Development
Citation preview

1
Economic and Workforce Overview
January 14, 2011
Paradise Valley Community College
John CatapanoResearch and Communications Coordinator
Center for Workforce Development

U.S. Economic Overview
2
The Great Recession is over!(but it hasn’t felt much like a recovery)
The recovery slowed in the second half of 2010.

3
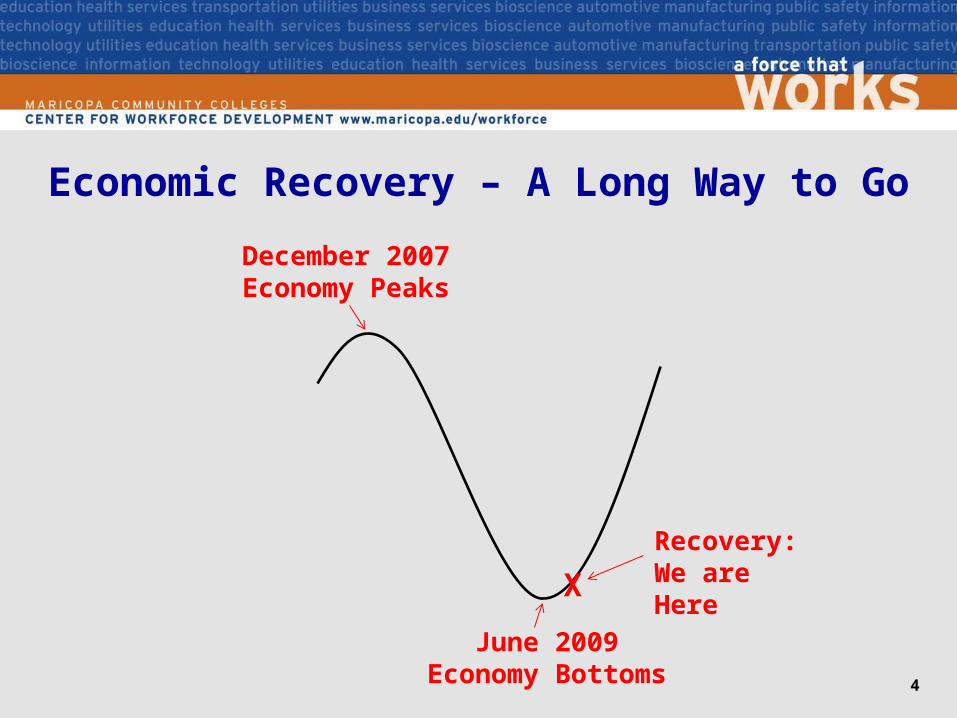
Economic Recovery – A Long Way to Go
December 2007Economy Peaks
June 2009Economy Bottoms
4
Economic Recovery – A Long Way to Go
Recovery: We are Here
December 2007Economy Peaks
X
June 2009Economy Bottoms

Growth in Real GDP2007 Q1 to 2010 Q3 (annualized)
5
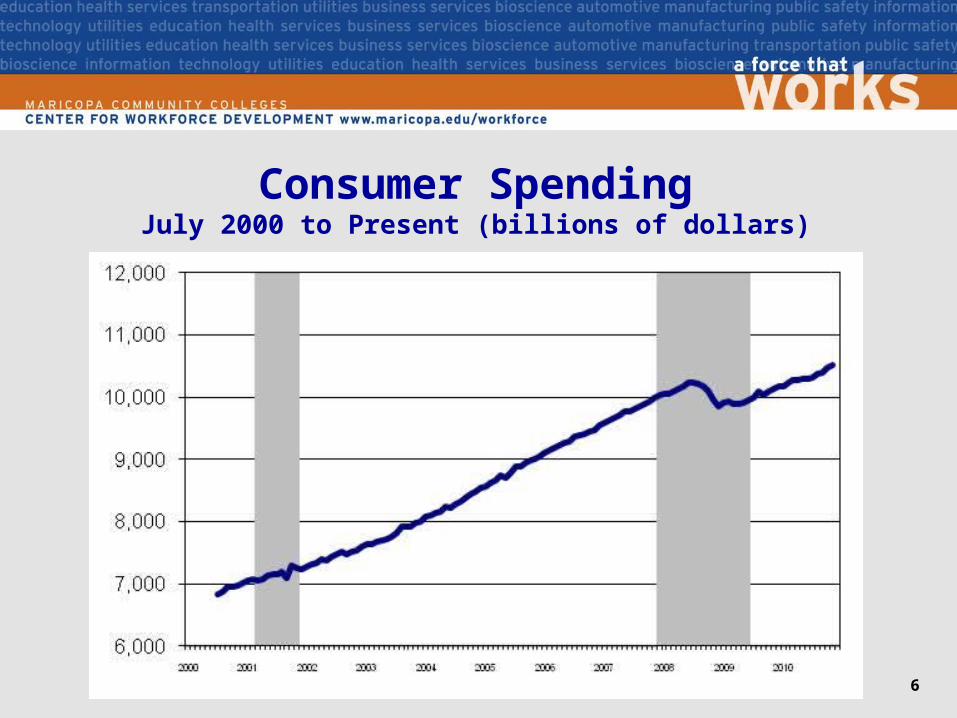
Consumer SpendingJuly 2000 to Present (billions of dollars)
6

Consumer SpendingJuly 2000 to Present (billions of dollars)
7
5.1% Growth Path
3.1% Growth Path

U.S. Employment GrowthJanuary 2007 to Present (month over month, in thousands)
8

U.S. Private Sector Employment GrowthJanuary 2007 to Present (month over month, in thousands)
9

Negative Jobs Feedback Loop
10
Limited Job Growth

Negative Jobs Feedback Loop
11
Limited Job Growth
Little Job Security

Negative Jobs Feedback Loop
12
Limited Job Growth
Little Job Security
Depressed Consumer Confidence

Negative Jobs Feedback Loop
13
Limited Job Growth
Little Job Security
Depressed Consumer Confidence
Modest Consumer Spending

Negative Jobs Feedback Loop
14
Limited Job Growth
Little Job Security
Depressed Consumer Confidence
Modest Consumer Spending
Business Uncertainty
Negative Jobs Feedback Loop
15
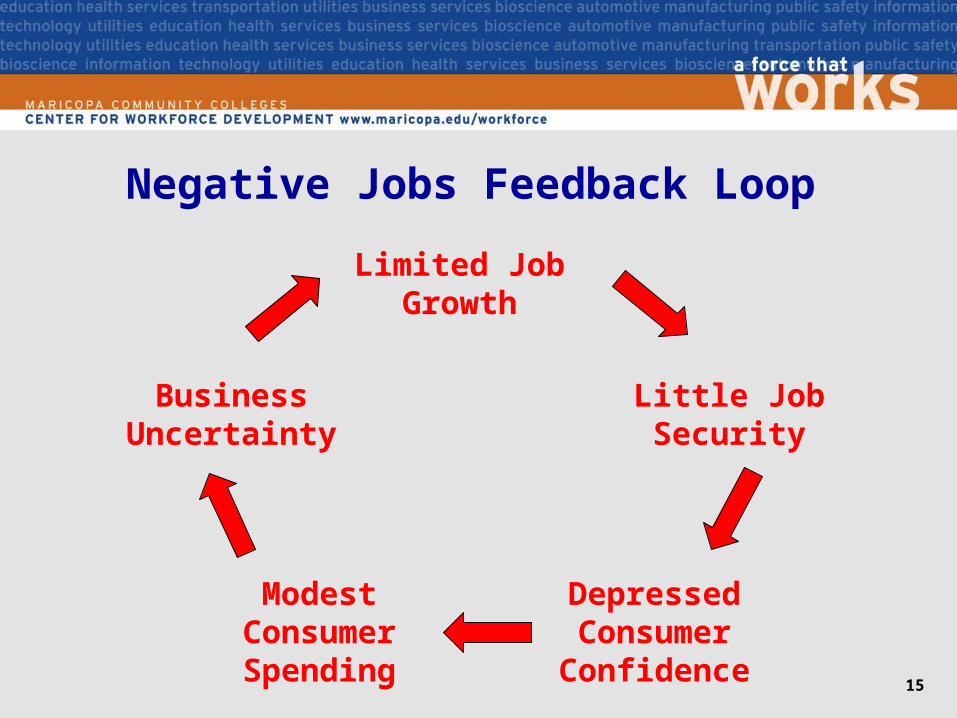
Limited Job Growth
Little Job Security
Depressed Consumer Confidence
Modest Consumer Spending
Business Uncertainty

Percent Job Losses in Post WWII Recessions
16

17
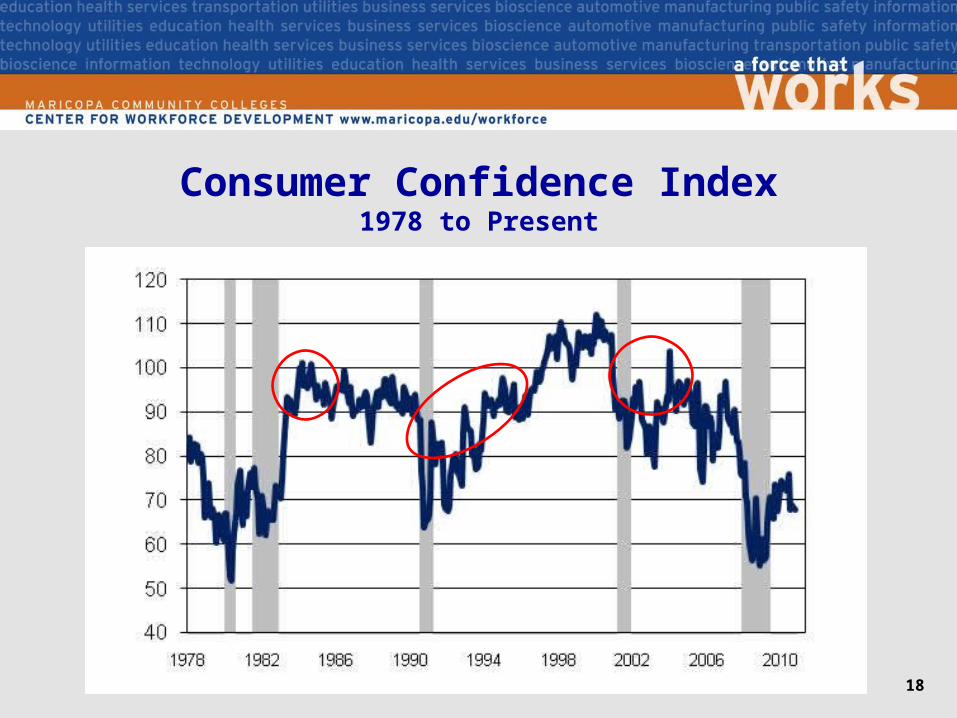
Consumer Confidence1978 to Present
18
Consumer Confidence Index1978 to Present

19
U.S. Unemployment RateJanuary 2000 to Present

U.S. Median Duration of UnemploymentIn Weeks, January 2000 to Present
20

21
U.S. Initial Claims for Unemployment InsuranceJanuary 2007 to Present (in thousands)

Why Did the Recovery Stall?
22
• Stock market down over summer 2010• European debt crisis• Consumer confidence waivered due to poor job prospects• Housing market continues to be a drag on the economy• Banks have been reluctant to lend• Impact of healthcare reform• November elections• Concern about the deficit/debt• End of federal stimulus
Uncertainty

Dow Jones Industrial Average2007 to Present
23

Growth in Real GDP2007 Q1 to 2010 Q3 (annualized)
24

Financial Bailouts and Stimulus Saved Us from Another Great Depression
25
Without Federal Intervention:• GDP in 2010 would have been about 11.5% lower• Employment would be less by 8.5m (on top of 8.4m)• Unemployment rate would be around 16%• The U.S. would now be experiencing deflation

26
• Interest rates are low• Inflation is nowhere in sight• Banks are easing lending standards• Corporate profits are up• Consumers are showing signs of life• Incomes, employee hours, and productivity is up• Manufacturing is growing• The private sector is adding jobs• Unemployment rate is heading down• The global economy is back
The Economy is Expected to Pick Up in 2011 After a Weak Second Half of 2010

27
• Slow job growth• Continued weak housing market• Financial sector holding back on lending• Deficit/debt• Rising energy prices• State/local government budgets
What Could Derail the Recovery?

Arizona Economic Overview
28
Arizona’s recession is over!(About six months after the U.S.)

Arizona Was Hit Hard
29
• The state lost 363,200 nonfarm jobs (13.4%) from peak (December 2007) to trough (July 2010)
• The state is unlikely to recover 2007 employment levels before 2014 – a seven-year correction!
• In 2006 Arizona ranked 2nd in job growth among states, in 2009 we were 49th (thank you, Nevada)
• Arizona ranked 49th in per-capita personal income growth in 2008 (thank you, Nevada), and 45th in 2009
• State GDP decreased 3.9% in 2009, ranking Arizona 47th nationwide
• In 2009 Greater Phoenix was suffering some of the worst employment losses among large metros,

AZ Bounces Back from RecessionState Rank Based on Monthly Year/Year Growth Rates
30

AZ Bounces Back from RecessionState Rank Based on Monthly Year/Year Growth Rates
31
32nd

AZ Bounces Back from RecessionState Rank Based on Monthly Year/Year Growth Rates
32
32nd
2nd

AZ Bounces Back from RecessionState Rank Based on Monthly Year/Year Growth Rates
33
32nd
2nd
18th

AZ Bounces Back from RecessionState Rank Based on Monthly Year/Year Growth Rates
34
32nd
2nd
18th
1st

AZ Bounces Back from RecessionState Rank Based on Monthly Year/Year Growth Rates
35
32nd
2nd
18th
1st
19th

AZ Bounces Back from RecessionState Rank Based on Monthly Year/Year Growth Rates
36
32nd
2nd
18th
1st
19th
2nd

AZ Bounces Back from RecessionState Rank Based on Monthly Year/Year Growth Rates
37
32nd
2nd
18th
1st
19th
2nd
12th

AZ Bounces Back from RecessionState Rank Based on Monthly Year/Year Growth Rates
38
32nd
2nd
18th
1st
19th
2nd
12th
2nd

AZ Bounces Back from RecessionState Rank Based on Monthly Year/Year Growth Rates
39
32nd
2nd
18th
1st
19th
2nd
12th
2nd
49th

AZ Bounces Back from RecessionState Rank Based on Monthly Year/Year Growth Rates
40
32nd
2nd
18th
1st
19th
2nd
12th
2nd
49th
11th

Employment Growth, AZ v. U.S.January 2006 to Present (percent change, year ago)
41

42
Worst Metro Job Loss 2009Job Loss – November 2009 vs. November 2008
Labor Force > One Million
Metro Area Percent Job Loss
1. Los Angeles -3.5% 194,900
2. Chicago -4.1% 186,600
3. New York -2.2% 186,100
4. Detroit -6.8% 128,600
5. Atlanta -4.9% 117,100
6. Phoenix -6.0% 110,200

43
Best Metro Job Growth 2010Job Gains – November 2010 vs. November 2009
Labor Force > One Million
Metro Area Percent Job Gains
1. Washington DC 1.7% 49,200
2. Dallas 1.4% 40,600
3. Boston 1.1% 26,500
4. Phoenix 1.5% 25,500
5. Minneapolis 1.4% 22,900

44
AZ Unemployment RateJanuary 2000 to Present

45
AZ Initial Claims for Unemployment InsuranceJanuary 2007 to Present (four-week moving average)

• Retail sales are up, wages and salaries are improving• Employment growth exceeded U.S. in second half of 2009 (2.6% to
0.4%), but slowed in 2010• Jobs will be added in 2011:
– ADOC - Up 16,500 jobs (or 0.7%)– U of A – Up 39,600 (or 1.7%)– ASU – 47,900 (or 2.0%)
• To get back to 2007 employment levels, Arizona will need to add 66,000 jobs a year for four years
• Negative population growth?• Headwinds to recovery:
– Housing market– State budget– Consumers
Arizona’s Early Recovery – Mixed Results
46

47
AZ Industries in RecoveryEmployment Today is Greater Than a Year Ago
Peak-to-Trough Employment Loss
Construction -55.3%
Mining -26.4%
Professional /Business Services -17.4%
Retail Trade -15.2%
Transportation and Warehousing -13.9%
Wholesale Trade -11.1%
Healthcare Never Lost Jobs
Education Never Lost Jobs

48
AZ Industries Still StrugglingEmployment Today is Less Than a Year Ago
Peak-to-Trough Employment
Loss
State Government -23.5%
Manufacturing -22.4%
Information -21.7%
Federal Government -20.6%
Local Government -19.1%
Financial Activities -13.8%
Leisure and Hospitality -10.9%
Utilities -4.7%
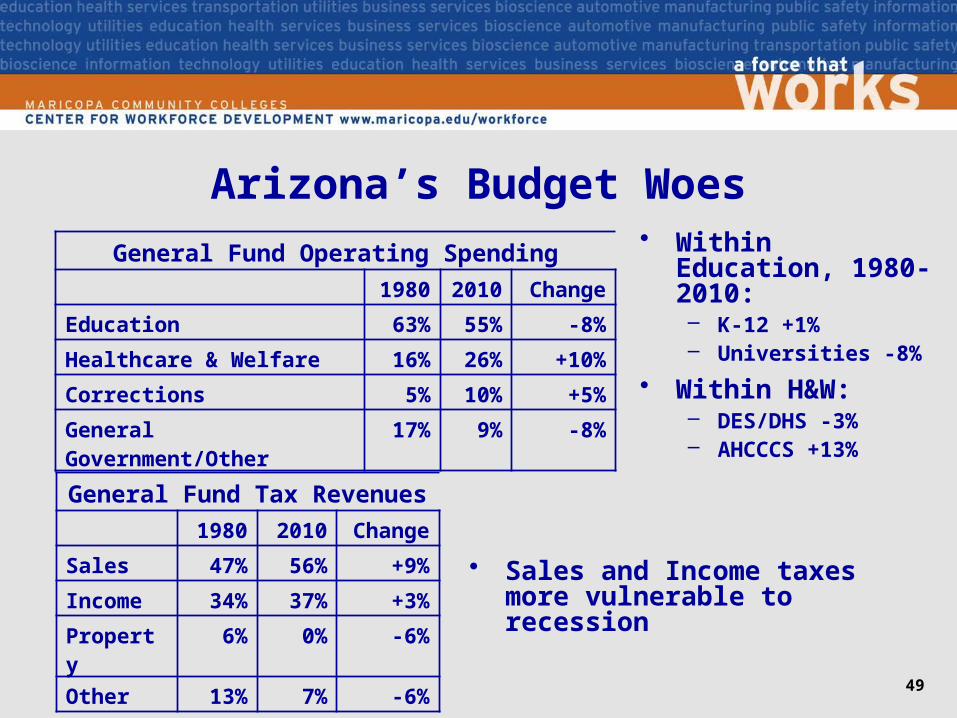
• Sales and Income taxes more vulnerable to recession
Arizona’s Budget Woes
49
General Fund Operating Spending
1980 2010 Change
Education 63% 55% -8%
Healthcare & Welfare 16% 26% +10%
Corrections 5% 10% +5%
General Government/Other 17% 9% -8%
General Fund Tax Revenues
1980 2010 Change
Sales 47% 56% +9%
Income 34% 37% +3%
Property 6% 0% -6%
Other 13% 7% -6%
• Within Education, 1980-2010:– K-12 +1%– Universities -8%
• Within H&W:– DES/DHS -3%– AHCCCS +13%
50
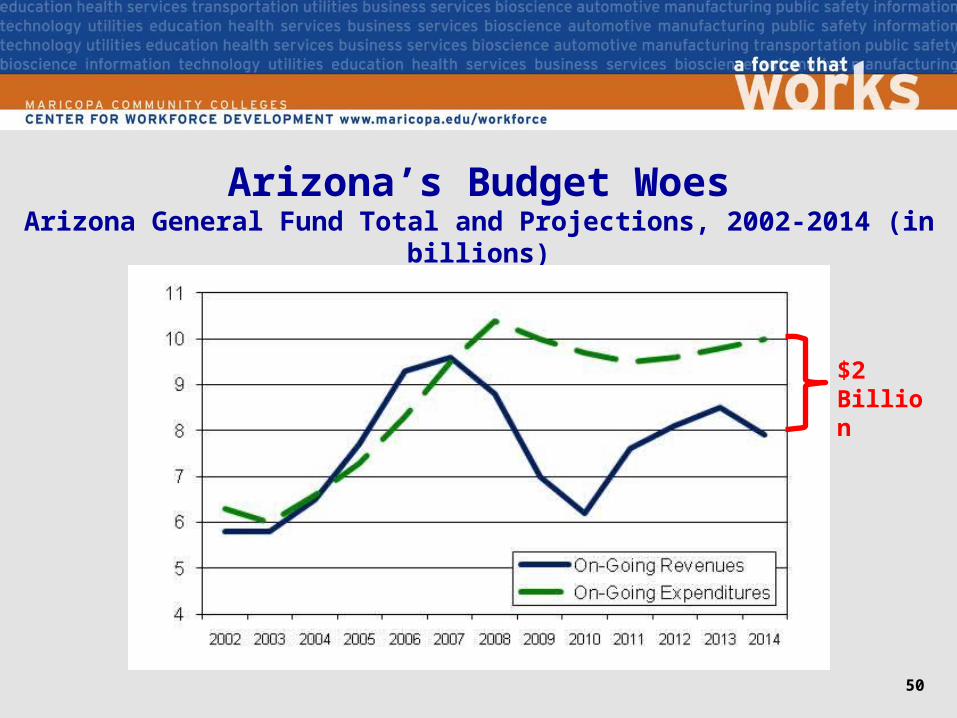
Arizona’s Budget WoesArizona General Fund Total and Projections, 2002-2014 (in billions)
$2 Billion
51
• Excess supply of homes – 50,000 to 75,000 in Greater Phoenix alone
• Home prices down about 50%• Arizona is one of the worst performing states for mortgage
delinquencies and foreclosures• New home construction has all but ceased• Commercial real estate market is hurting• Housing and jobs – a negative feedback loop• On the positive side - housing is now much more affordable, and
interest rates are at historic lows
Arizona Won’t Truly Recover Until Housing Improves
52
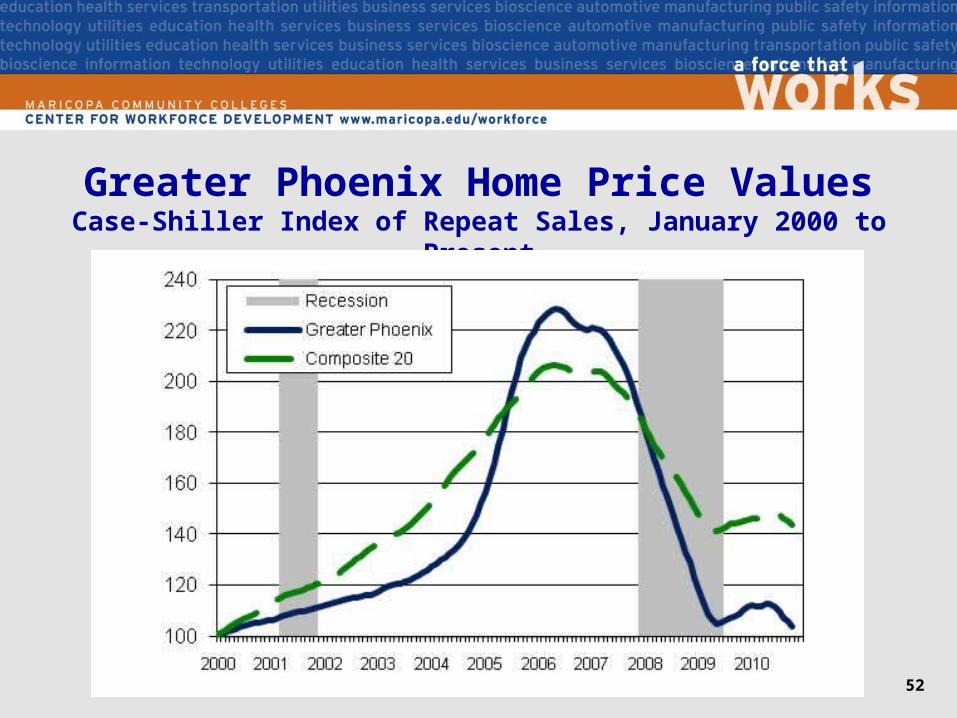
Greater Phoenix Home Price ValuesCase-Shiller Index of Repeat Sales, January 2000 to Present

Implications for MCCCD
53
• For MCCCD, the recession is a double-edged sword– Enrollment is up– But fewer resources are available
• Look for new program area opportunities, but don’t forget the bread-and-butter (healthcare, IT, business, public safety)
• Short-term - Negative population growth in Arizona?• Long-term - Arizona is projected to add 2.6m nonfarm jobs
between 2010 and 2040. Many will be in Maricopa County. MCCCD will play a vital role in training
• The district’s continued focus should be on high-wage, high-skill jobs to reduce the region’s vulnerability to recessionary cycles


![[XLS] Object Summary.xlsx · Web view5/26/2010 5/26/2010. 5/2/2011 5/2/2011. 9/30/2011 9/30/2011. 7/6/2011 7/6/2011. 11/28/2011 11/28/2011. 12/6/2011 12/6/2011. 11/28/2011 11/28/2011](https://img.dokumen.tips/doc/110x75/5ae744ba7f8b9a87048f0cd5/xls-object-summaryxlsxweb-view5262010-5262010-522011-522011-9302011.jpg)