Embed Size (px)
Citation preview

Section 2-3The Line of Best Fit
Warm-upFind several points on the line y = -3x + 8. Then find the mean of the independent variables and of
the corresponding dependent variables. Is the ordered pair (mean of the independent variables,
mean of dependent variables) on the line?

Observed Value: Data that is collected from what has actually happened.
Predicted/Expected Values: Points that are predicted by a linear model. They allow us to have an idea of what to expect.
Errors/Deviations: The difference between the observed and predicted values of the dependent variable.
Line of Best Fit: The line with the smallest value when you sum the squares of the errors.
Method of Least Squares: This is how you actually find the line of BEST FIT. Sum the squares of the errors and look for the smallest (LEAST) value.
Center of Gravity: You find it by finding the mean of the observed independent variables and the mean of the observed dependent variables and make an ordered pair, like today’s warm-up!
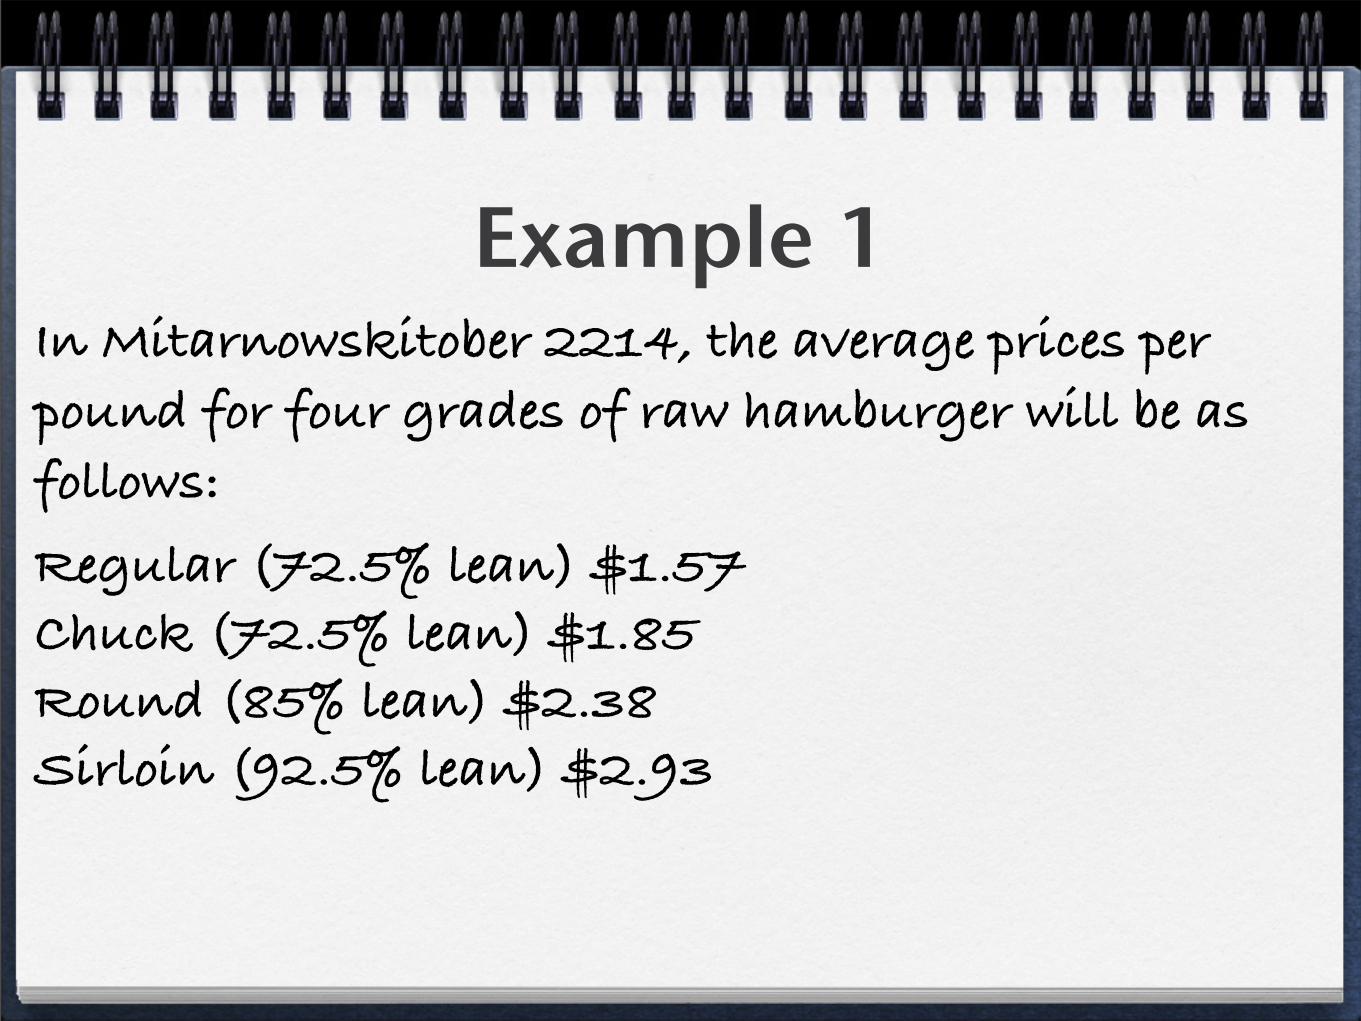
In Mitarnowskitober 2214, the average prices per pound for four grades of raw hamburger will be as follows:
Example 1
Regular (72.5% lean) $1.57Chuck (72.5% lean) $1.85Round (85% lean) $2.38Sirloin (92.5% lean) $2.93

a. Graph the points and draw a line of best fit by hand. Then find the equation of the line you drew.
$0
$0.75
$1.50
$2.25
$3.00
70.00% 76.25% 82.50% 88.75% 95.00%

b. Find the regression line using your graphing calculator.

c. Verify that the center of gravity of the four points is on the line of best fit found on your calculator.
72.5 + 80 + 85 + 92.5
4= 82.5
1.57 + 1.85 + 2.38 + 2.93
4= 2.1825
When you press “TRACE,” it should give us the point (82.5, 2.1825), which is the center of gravity.

d. Use a table to find the sum of the squares of errors for both your line of best fit and for the line of best fit found by the calculator. Which one has a better value and why?
What, you want the table here? You need to do this by hand, too, Mr. Lamb! I’m not going to do all of your work!

e. According to the line of best fit, how much would a pound of meat that is 87% lean cost? What if it was 57% lean?
Oh, c’mon! Use the trace function on your calculator!
87% lean: $2.50/lb 57% lean: $.39/lb

Homework
p. 101 #1 - 20