Embed Size (px)
Citation preview

A
PROJECT REPORT
ON
EQUITY RESEARCH (FUNDAMENTAL ANALYSIS)
FORINDIA INFOLINE LTD.
SUBMITTED TO UNIVERSITY OF PUNE IN PARTIAL FULFILLMENT OF 2 YEARS FULL TIME COURSE
MASTERS IN BUSINESS ADMINISTRATION (M.B.A.)
SUBMITTED BYCHOTHANI HITESH HASMUKH
( BATCH - 2006-08 )
BRACT’sVISHWAKARMA INSTITUTE OF MANAGEMENT,
KODHAWA PUNE- 411014.
1

ACKNOWLEDGEMENT
This project bears imprint of all those who have directly or
indirectly helped and extended their kind support in completing this
project.
At the time of making this report I express my sincere gratitude to
all of them.
I must first express my gratitude to Ms. Reena Singh, Branch
Manager (Sohrab Hall Branch) and the staff members for having
accorded me the permission to undertake a project in India Infoline Ltd.
I also must show my deepest gratitude to Director Dr. Sharad
Joshi and Prof. Smita Sovani for their valuable suggestions, guidance
and advice in bringing out this project.
- Chothani Hitesh H.
2

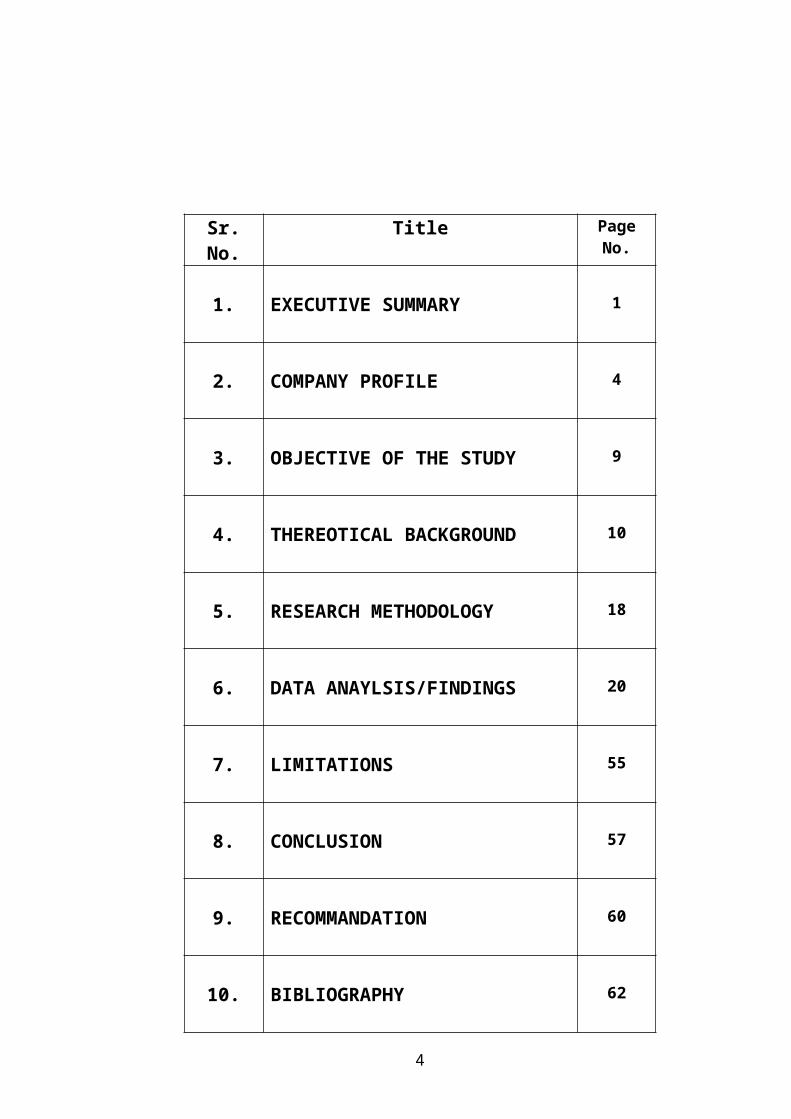
INDEX
Sr. No. Title Page No.
1. EXECUTIVE SUMMARY 1
2. COMPANY PROFILE 4
3. OBJECTIVE OF THE STUDY 9
4. THEREOTICAL BACKGROUND 10
5. RESEARCH METHODOLOGY 18
6. DATA ANAYLSIS/FINDINGS 20
7. LIMITATIONS 55
8. CONCLUSION 57
9. RECOMMANDATION 60
10. BIBLIOGRAPHY 62
3
INTRODUCTION
The stock markets are the most volatile markets and are difficult to understand
as the weather. Though this does not mean that the markets cannot be predicted but
it only means that trends may change without warning, as with weather.
The stock markets are characterized by almost all factors, again starting right
from weather and ending at the political environment. Effects of one market also
causes a spillover into the other and an external cause in one market can lead to the
reaction in another market. For instance, it’s been proved that a delayed monsoon in
India will create the problems of flooding in the European countries, effecting
adversely economies of both the regions.
The pulse of the market also depends upon timely exit and entry. For arriving
at a correct conclusion reasonable data is required to understand the mechanics of
the stock and the industry – vis-à-vis global and local in which the company
operates. While a practical long-term view will help reduce risks, marrying the stock
on the other hand may totally increase risks.
By going through the Industry Reports, Financials the investor can arm
himself with reasonable information about the stocks, which are being tracked by
the investor. However, for consistent monitoring of stocks, it is imperative that the
investor has limited exposure to the stocks, which are being capable of being tracked
by him – a too big a portfolio will divert attention and ultimately harm investor
interests.
In the present project an attempt is made to study the importance of fundamental
analysis for investors.
Shares: -
4

The companies Act 1956 defines Shares as “a share in the capital of a company and
includes stock except where distinction between stock and share is expressed or
implied. A share is regarded as property, which can be bought and sold like any other
property. It also consists other rights given by Articles of Association of company.
Equity or ordinary shares: -
These are those shares, which do not enjoy any special rights in respect of payment of
dividend or repayment of capital. The return of capital to equity shareholders is not
guaranteed. Also when the company is wound up, capital of equity shareholders is
lastly paid, only after all other claims have been paid in full. That is why equity is also
called as “The Risk Bearing or Venture Capital.”
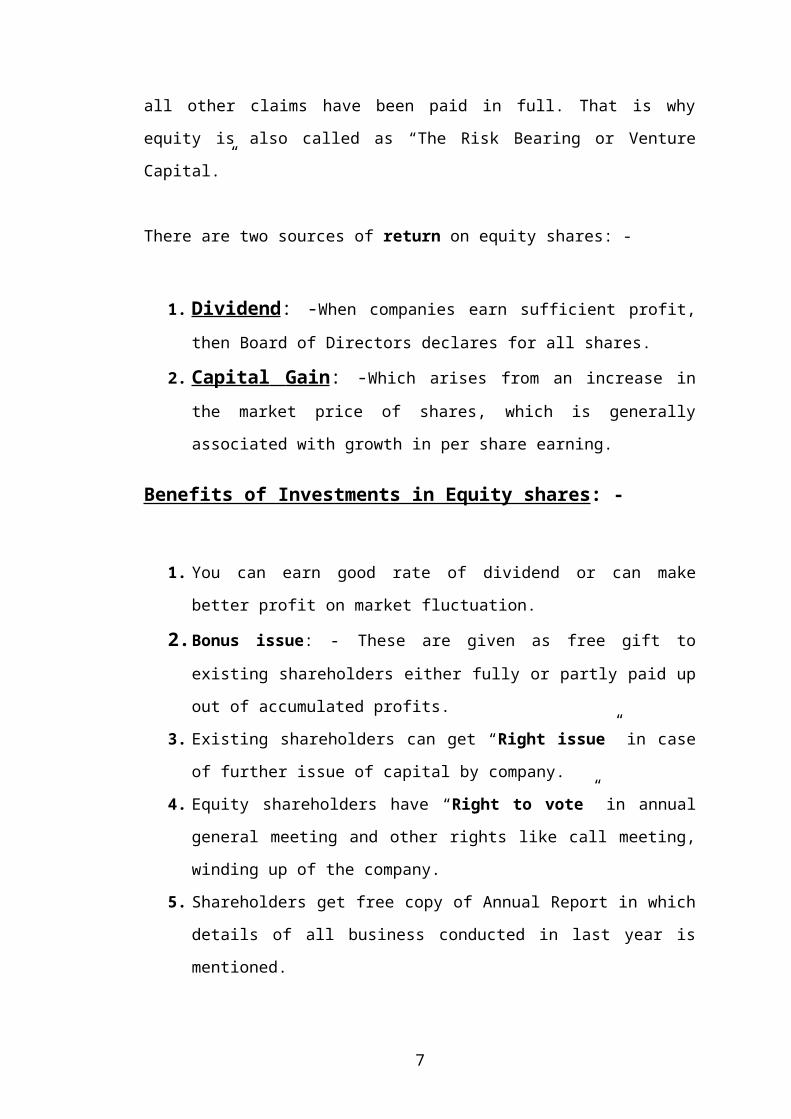
There are two sources of return on equity shares: -
1. Dividend : -When companies earn sufficient profit, then Board of Directors
declares for all shares.
2. Capital Gain : -Which arises from an increase in the market price of shares,
which is generally associated with growth in per share earning.
Benefits of Investments in Equity shares: -
1. You can earn good rate of dividend or can make better profit on market
fluctuation.
2. Bonus issue: - These are given as free gift to existing shareholders either fully
or partly paid up out of accumulated profits.
3. Existing shareholders can get “Right issue” in case of further issue of capital
by company.
4. Equity shareholders have “Right to vote” in annual general meeting and other
rights like call meeting, winding up of the company.
5. Shareholders get free copy of Annual Report in which details of all business
conducted in last year is mentioned.
5

6. A share is “Transferable Property”. It can be transferred or transmitted by
shareholder to any other person.
7. Tax Exemption: -As per Income Tax Act, Dividend is not taxable in the
hands of shareholders similarly Long Term Capital Gain on shares is
exempted up to March 2007.
8. Liquidity: -Because of large market for share investor can convert his
investments into liquid money easily.
What is Fundamental analysis?
Fundamental analysis is the examination of the underlying forces that affect
the well being of the economy, industry groups, and companies. As with most
analysis, the goal is to derive a forecast and profit from future price movements. At
the company level, fundamental analysis may involve examination of financial data,
management, business concept and competition. At the industry level, there might be
an examination of supply and demand forces for the products offered. For the national
economy, fundamental analysis might focus on economic data to assess the present
and future growth of the economy. To forecast future stock prices, fundamental
analysis combines economic, industry, and company analysis to derive a stock's
current fair value and forecast future value. If fair value is not equal to the current
stock price, fundamental analysts believe that the stock is either over or under valued
and the market price will ultimately gravitate towards fair value. Fundamentalists do
not heed the advice of the random walkers and believe that markets are weak-form
efficient. By believing that prices do not accurately reflect all available information,
fundamental analysts look to capitalize on perceived price discrepancies.
Fundamental analysis is a method used to determine the value of a stock by
analyzing the financial data that is 'fundamental' to the company. That means that
fundamental analysis takes into consideration only those variables that are directly
related to the company itself, such as its earnings, its dividends, and its sales.
Fundamental analysis does not look at the overall state of the market nor does it
include behavioral variables in its methodology. It focuses exclusively on the
6
company's business in order to determine whether or not the stock should be bought
or sold.
7

EXECUTIVE SUMMARY
8

In India many traditional people are very risk averse. They are not aware of
the investment opportunities in the stock market. They consider stock market as a
game of gambling. But the original scenario is quite different. There is no doubt that
there are speculators who try to hike the price of a stock artificially. Investing in
equities involves high risk and the return on it totally depends on the companies
performance. But investing in the right stock at the right price and holding for a
longer time horizon would surely be a better investment.
The strategy of selecting stocks that trade for less than their intrinsic value is
called value investing. Value investors actively seek stocks of companies that they
believe the market has undervalued. They believe the market overreacts to good and
bad news, causing stock price movements that do not correspond with the company's
long-term fundamentals. The result is an opportunity for value investors to profit by
buying when the price is deflated. The very definition of value investing is subjective.
Some value investors only look at present assets/earnings and don't place any value on
future growth. Other value investors base strategies completely around the estimation
of future growth and cash flows. Despite the different methodologies, it all comes
back to trying to buy something for less than its worth. The purpose behind this
project was to learn the mannerisms of the stock market trading and analyzing a stock
for a good investment opportunity.
The reason behind choosing this project is that it provides hands on experience
with what goes on in the stock market on a day to day basis. The field of equity
research is very vast and one has to look into various aspects of the functioning of the
company to get to any conclusion about the possible performance of the company in
the market. Investors like warren buffet made a fortune out of investments in the stock
market, which is quiet impossible without proper research about the companies. The
field of equity research is full of challenges.
9

The project is done with India Infoline Securities Limited a very well known
company in the field of stock broking and capital market services sector. This project
gave me a chance to get valuable insights from a hoard of vastly experienced people
in this field and to get various approaches each one adopts to evaluate various
companies. The duration of the project was two months. These two months were not
only limited to learning and devoting time towards equity research but it also
provided an insight on what various services such broking houses provide and what
efforts are required to manage such organizations.
10

COMPANY PROFILE
11

INDIA INFOLINE LTD
India Infoline limited is listed on both the leading stock exchanges in India,
i.e. The Bombay Stock Exchange (BSE) and the National Stock Exchange (NSE). It is
engaged in the business of Equities broking, Wealth Advisory Services and Portfolio
Management Services. It offers broking services in the Cash and Derivatives
segments of the NSE as well as the Cash segment of the BSE. It is registered with the
National Securities Depository Ltd. (NSDL) as well as Central Depository Services
Ltd. (CDSL) as a depository participant, providing a one-stop solution for client
trading in the equities market. A SEBI authorized Portfolio Manager; it offers
Portfolio Management Services to clients.
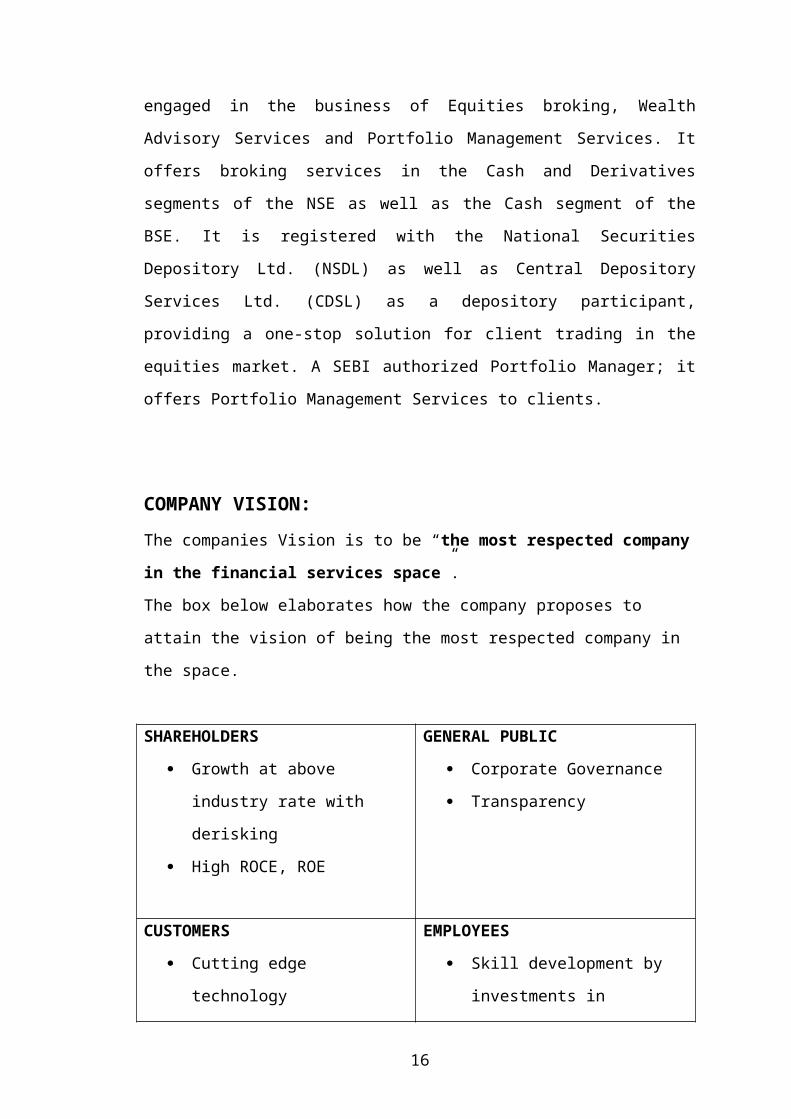
COMPANY VISION:
The companies Vision is to be “the most respected company in the financial
services space”.
The box below elaborates how the company proposes to attain the vision of being the
most respected company in the space.
SHAREHOLDERS
Growth at above industry rate
with derisking
High ROCE, ROE
GENERAL PUBLIC
Corporate Governance
Transparency
CUSTOMERS
Cutting edge technology
High service standards
EMPLOYEES
Skill development by investments
in training
Empowerment and conducive
work environment
12

SLOGAN:
“IT’S ALL ABOUT MONEY, HONEY!”
PRODUCT AND SERVICES:
We are a one-stop financial services shop, most respected for quality of its advice,
personalised service and cutting-edge technology.
Equities Broking:
India Infoline provided the prospect of researched investing to its clients, which
was hitherto restricted only to the institutions. Research for the retail investor did not
exist prior to India Infoline. India Infoline leveraged technology to bring the
convenience of trading to the investor’s location of preference (residence or office)
through computerized access. India Infoline made it possible for clients to view
transaction costs and ledger updates in real time.
Portfolio Management Services:
Our Portfolio Management Service is a product wherein an equity investment
portfolio is created to suit the investment objectives of a client. We at Indiainfoline
invest your resources into stocks from different sectors, depending on your risk-return
profile. This service is particularly advisable for investors who cannot afford to give
time or don't have that expertise for day-to-day management of their equity portfolio.
Research:
Sound investment decisions depend upon reliable fundamental data and stock
selection techniques. India Infoline Equity Research is proud of its reputation for, and
we want you to find the facts that you need. Equity investment professionals routinely
use our research and models as integral tools in their work. They choose Ford Equity
Research when they can clear your doubts.
13

Commodities:
India Infoline’s extension into commodities trading reconciles its strategic intent
to emerge as a one-stop solutions financial intermediary. Its experience in securities
broking has empowered it with requisite skills and technologies. The Company’s
commodities business provides a contra-cyclical alternative to equities broking. The
Company was among the first to offer the facility of commodities trading in India’s
young commodities market (the MCX commenced operations only in 2003). Average
monthly turnover on the commodity exchanges increased from Rs 0.34 bn to Rs 20.02
bn. The commodities market has several products with different and non-correlated
cycles. On the whole, the business is fairly insulated against cyclical gyrations in the
business.
Insurance:
An entry into this segment helped complete the client’s product basket;
concurrently, it graduated the Company into a one-stop retail financial solutions
provider. To ensure maximum reach to customers across India, we have employed a
multi pronged approach and reach out to customers via our Network, Direct and
Affiliate channels. Following the opening of the sector in 1999-2000, a number of
private sector insurance service providers commenced operations aggressively and
helped grow the market.
The Company’s entry into the insurance sector derisked the Company from a
predominant dependence on broking and equity-linked revenues. The annuity based
income generated from insurance intermediation result in solid core revenues across
the tenure of the policy.
Invest In Mutual Fund
India Infoline offers you a host of mutual fund choices under one roof, backed by
in-depth research and advice from research house and tools configured as investor
friendly.
14

Wealth Management Services:
Imagine a financial firm with the heart and soul of a two-person organization. A
world-leading wealth management company that sits down with you to understand
your needs and goals. We offer you a dedicated group for giving you the most
personal attention at every level.
Mortgages:
During the year under review, Indiainfoline acquired a 75% stake in Moneytree
Consultancy Services to mark its foray into the business of mortgages and other loan
products distribution. The business is still in the investing phase and at the time of the
acquisition was present only in the cities of Mumbai and Pune. The Company brings
on board expertise in the loans business coupled with existing relationships across a
number of principals in the mortgage and personal loans businesses. Indiainfoline
now has plans to roll the business out across its pan-Indian network to provide it with
a truly national scale in operations.
HEAD OFFICE:
India Infoline Ltd.,
75, Nirlon Complex,
Off. Western Express Highway,
Goregaon (East),
Mumbai 400063.
WEB ADDRESS:
www.indiainfoline.com
www.5paise.com
15
OBJECTIVE OF THE PROJECT
TO UNDERSTAND THE CONCEPT AND TECHNIQUES OF FUNDAMENTAL ANALYSIS.
TO STUDY THE PUBLIC SECTOR BANKS AND KEY PLAYERS IN THE INDIAN STOCK MARKET.
TO RECOMMEND THE BEST AS A VALUE INVESTMENT
16
THEREOTICAL BACKGROUND
17

ABOUT PUBLIC SECTOR BANKS.
The shares undertaken here for the analysis belongs to the banking industry.
All the firms herein mention are from the public sector. This means that all the banks
are Public Sector Undertaking (PSU’s).
A Public sector undertaking is a wherein the majority of the stake is with
either the state or the central government. A better word instead of stake can be
control, i.e. either the control is in the hands of the state government or the central
government. We can see in each of the bank that the majority of the shares are held by
the promoters that is the government.
Nationalization of the banks took place on 19th July, 1969. Initially fourteen
banks were nationalized. Later on six more banks were added to the list. At present
nineteen banks are under the public sector.
The government had contributed an aggregate of Rs. 20,446.12 crore towards
recapitalization of the nationalized banks by the end of March 1999. The government
of India decided to allow some of the public sector banks to tap directly the domestic
capital markets. In order to enable the nationalized banks to access the capital markets
to strengthen their capital base and meet the capital adequacy norms. The authorized
capital of each of the public sector banks was been set at Rs. 1500, crore divided into
150 crore fully paid up share of Rs. 10 each.
Oriental Bank of Commerce was the first nationalized bank to have access to
the capital markets. It raised a sum of Rs. 387.24 crore in October 1994, reducing the
government shareholding to 66.5%. In these way all the the public sector banks came
down to the capital market as and when required. The government share holding is
still the highest in all the public sector banks though all the banks have bought their
IPO’s to the market.
18

Why Public Sector Banks?
A Public sector undertaking is a wherein the majority of the stake is with
either the state or the central government. A better word instead of stake can be
control, i.e. either the control is in the hands of the state government or the central
government. We can see in each of the bank that the majority of the shares are held by
the promoters that is the government.
The public sector banks are one of the major sources of finance for small,
medium as well as large firms. These banks are very important from the point of
deposit mobilization. The public sector banks are those which have a strong network
of branches and they have reached the remote areas of the country. For e.g. the state
bank of India has a great network of branches and ATM’s. SBI is the largest bank of
the country and is an agent of the Reserve bank Of India.
The public sector is a great source for fund mobilization and asset allocation.
The banks considered herein are the banks that have highest market capitalization
among the Public Sector Banks of the banking industry.
The banks if ranked according to their market capitalization:
State Bank of India.
Punjab National Bank.
Bank of Baroda.
Bank of India.
19

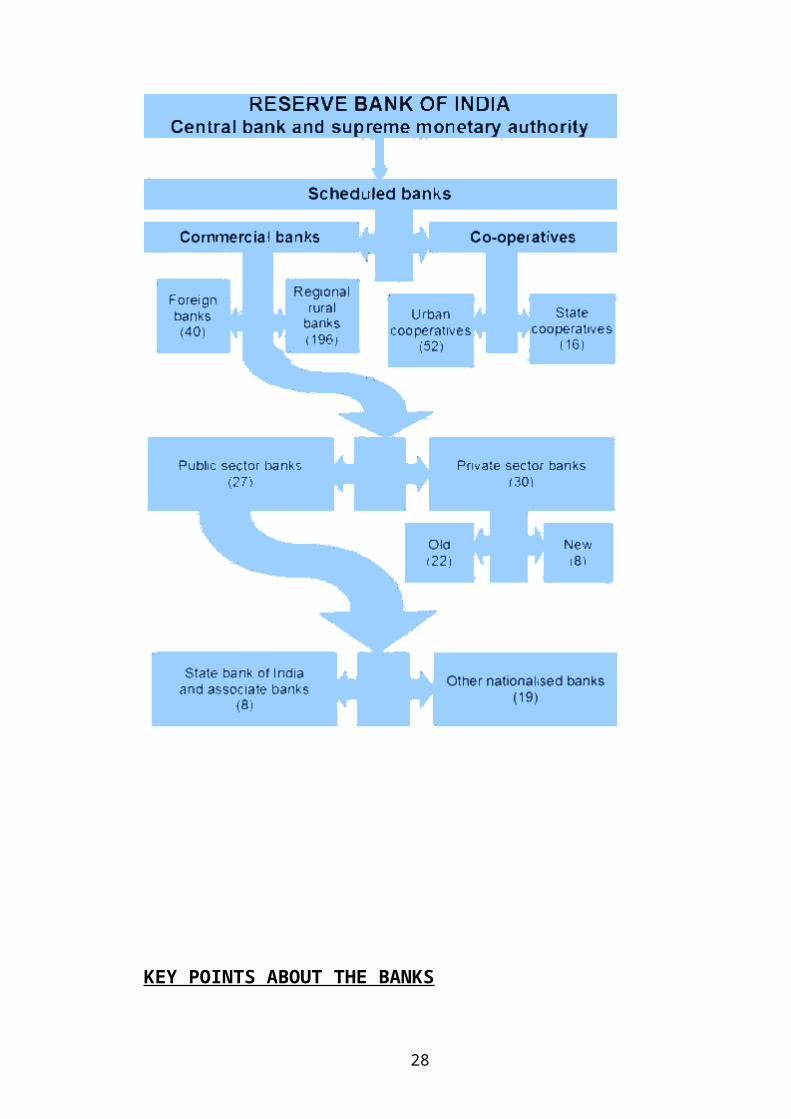
BANKING STRUCTURE OF INDIAN BANK
20

KEY POINTS ABOUT THE BANKS
Demand
Indian economy is growing at an impressive rate. The Industrial production
remained robust during April-May 2007, recording a year-on-year expansion of 11.7
per cent. The manufacturing sector remained the key driver of industrial activity, with
growth of 12.7 per cent. While growth of the mining sector remained subdued, that of
the electricity sector was higher than that during April-May 2006. The manufacturing
sector’s robust performance was largely contributed by ‘machinery and equipment’,
‘food products’, ‘basic metal and alloy industries’ and ‘chemicals and chemical
products’. The higher growth in ‘food products’ and ‘wood and wood products’ could
be partly attributed to the base effect.
Robust growth in bank deposits and nonfood credit off take and exports of
business process outsourcing and information technology-enabled services helped in
sustaining the growth of the sub-sector ‘financing, insurance, real estate and business
services’. All these sectors are directly or indirectly connected to the bank or are
dependent on the banks for the growth.
Barriers to entry
Getting license for opening a bank is a rigorous process. The Reserve Bank of
India has laid down many criteria for getting a license for any organization to run a
banking business. It requires a specific amount of capital as prescribed by the RBI.
There is a huge investment in technology. Now days the business houses are in
requirement of speed banking so investment in technology is very important. For
growth of the bank it is very important for a bank to build a strong branch network.
Again there are rules laid out by the RBI for opening of the branches. Banks have to
open branches in the rural area to get a license to open a branch in the urban area.
21

Bargaining power of suppliers:
The bargaining power of the supplier is high during periods of tight liquidity.
Trade unions in public sector banks can be anti reforms. Depositors may invest
elsewhere if interest rates fall.
Competition:
There is high competition in the banking sector because of various kinds of
banks working in India. There are public sector banks, private sector and foreign
banks. The private sector banks are the banks which attracts the business house and
the high income class people. They normally are providing better service than the
public sector bank. The foreign banks operating in India are doing their business quite
efficiently. They have shown higher return on asset than the domestic banks, higher
non – interest income, attained higher capital adequacy ratio and lower NPA’s. The
public sector banks are facing a good competition from the scheduled co-operative
bank like The Cosmos Co –operative bank. The non banking financial companies
(NBFC) are also giving a good competition being in similar business lines.
Supply:
Liquidity is controlled by the Reserve Bank of India (RBI). This may be done
by the RBI by the means of CRR or SLR.
CRR, BANKS AND SHARE PRICE
One of the major factors affecting profitability of the bank and thus the share
price of the banks is the CRR. Let’s understand how.
CRR stands for the cash reserve ratio. This is the specified proportion of
deposits that a bank has to maintain with the RBI. At present the cash reserve ratio is
7.00%. When there is a change in the CRR, the first impact is seen on the banks. For
22

banks, the rise in CRR would mean that a larger proportion of funds will be with RBI,
while a fall in rate will mean a lower proportion will be with the apex bank.
There are specific angles that one has to consider while evaluating the impact
of CRR on banks. In time of boom, like is the currently, lending will give a higher
rate of return to banks. Hence, if they have to keep a large proportion of their funds
away from lending and in the form of deposits, it is a loss of opportunity for them.
This will bring down their earnings.
An increase in CRR would also mean that money is sucked out of the system.
This would mean that funds are hard to come by and hence banks will have to pay
more to depositors in order to induce them to keep their funds banks. This will push
up the cost of funds for banks. Due to this banks will also have to raise lending rates
in order to meet the increased cost while maintaining their margins.
The market will analyze banks on the basis of their margins, and whether they
will be able to maintain this going forward. A CRR rise in it self means tougher
condition for banks but what is important is that they should also be able to keep pace
with this entire situation. That is the key to the way in which the bank stocks will
perform in the market.
RBI’s moves on the CRR.
Effective Since Cash Reserve Ratio
March 31, 2004 4.50
September 18, 2004 4.75 (+0.25)
October 2, 2004 5.00 (+0.25)
January 24, 2006 5.00
October 31, 2006 5.00
December 23, 2006 5.25 (+0.25)
January 6, 2007 5.50 (+0.25)
January 31, 2007 5.50
February 17, 2007 5.75 (+0.25)
March 3, 2007 6.00 (+0.25)
April 14, 2007 6.25 (+0.25)
April 28, 2007 6.50 (+0.25)
23

There may also be an over all impact on companies in terms of scarcity of
funds along with an increase in costs due to which the overall interest charges for
capital intensive companies will increase. There is also the worry that a lower lending
could lead to a contraction in activities, which might slow down demand in various
sector. This in turn could act as a dampener for several companies. It also affects
share prices of companies that operate in the affected sector over the medium term.
24

RESEARCH METHODOLOGY
25

The present study is the outcome of systematic procedures adopted by the
researcher, which includes primary data collection as well as secondary data
collection. They are explained below:
1. PRIMARY DATA COLLECTION:
Primary data is originally gathered specifically on project hand. One can
obtain information from dealers, salesmen, etc. It offers much greater accuracy
and reliability.
In this study, the facts and figures are raw material with which researcher works.
Thus, in primary data collection researcher come across many methods as follows:
Observation method
2. SECONDARY DATA COLLECTION:
Secondary data is the data already collected by someone else. This data is not
especially collected to solve present or specific problem. The information is relevant
and can be used for our purpose.
After doing the data collection in primary method, the researcher did the collection
through the secondary data. In this there are several types such as:
General library
Trade-Books
Internet etc.
26

DATA ANALYSIS AND FINDINGS
27
THE CURRENT ECONOMIC SCENARIO
The status of the economy has a major impact on the overall stock prices.
Economic analysis is the study of the economic trends in the economy. The major
factors contributing to the economy analysis are as follows.
THE GROWTH OF THE GDP.
The Indian economy continued to record robust growth in 2006-07 for the
fourth successive year, buoyed by the sustained momentum in the services and
manufacturing sectors. The latest estimates released by the Central Statistical
Organisation (CSO) in May 2007 revised real GDP growth upwards to 9.4 percent
during 2006-07 from 9.2 per cent in the advance estimates.
The upward revision was mainly due to manufacturing (12.3 per cent from the
earlier estimate of 11.3 per cent) and construction (10.7 per cent from 9.4 per cent),
partly offset by downward revision in financing, insurance, real estate and business
services (10.6 per cent from 11.1 per cent). Real GDP growth averaged 8.6 per cent
per annum during 2003-04 to 2006-07 and 7.6 per cent per annum for the Tenth Plan
period (2002-03 to 2006-07)
Indian economy grew 9.3% in April-June 2007 fuelled by industrial and
services sectors. The real GDP growth during the same quarter of last year was at
9.6%. While the agricultural sector grew at 3.6%, industrial and services grew 10.6%
each on Y-o-Y basis.
Despite the higher than expected growth during the first quarter, economists
expect growth momentum to slow down in the coming quarters due to high level of
interest rates and rupee appreciation.
28

The Growth of the GDP:
7.59
9.4
0
2
4
6
8
10
GDP Growth %
2004-05 2005-06 2006-07
Year
GDP Trend
THE TREND OF INFLATION.
Simply put, inflation is a rise in prices items over a period of time. It is
measured through various indices & each provides specific information about the
prices of items that it represents. The index could be the Wholesale Price Index (WPI)
or the Consumer Price Index (CPI) for specified categories of people like agricultural
workers or urban non - manual employees. Each of the indices created in the specific
manner with the certain year as the base year and they consider the price change over
the year. The rate of inflation declared every week has an impression on the stock
market. In the graph you can see the trend followed by the inflation.
29

The Trend of Inflation
Inflation Trend
6
4.54.9
5.3
6.4 6.76
6.5 6.5 6.3
0
1
2
3
4
5
6
7
8
29/04/05 26/10/06 9/6/2006 31/10/06 6/1/2007 31/01/07 17/02/07 3/3/2007 30/03/07 14/04/07
Date
Infl
atio
n (
%)
INFLATION AND THE MARKETS?
To tame inflation, the government usually hikes interest rates. This tends to
make debt instrument attractive relative to equities as the former carry a lower
risk(small saving instruments are risk free as they are guaranteed by the government).
This result in some amount investment shifting from equity to debt. However, high
inflation is not always bad and low inflation need not always be good for equity
markets, as the impact will differ for companies and sector across different time
horizons. The first thing to consider is the items where prices are rising. For e.g. a rise
in oil prices will impact a wide range of items from food products to those that require
transportation.
BALANCE OF PAYMENTS
India’s balance of payments in 2006-07 reflected a number of positive
features, merchandise trade continue to exhibit robust growth during 2006-07,
although there was some loss of pace from a strong growth of 2005-06. The higher
growth of imports vis-à-vis experts lead to a persistent rise in trade deficit, on the
balance of payments basis. Nonetheless the current account deficits as per cent of
GDP remain unchanged (1.1% of GDP) from the previous year since the widening of
30

the merchandise trade deficit was offset to a large extent by the continuing buoyancy
in net invisibles surplus.
Net capital inflows to India remained buoyant (4.9% of GDP), fart exceeding
the current account deficit. Higher capital flows could be attributed to the
strengthening of micro economic fundamentals, greater investor confidence and
ample global liquidity. Net FDI inflows from abroad US$ 19.4 billion exceeded FII
inflows (net) during 2006-07 aggregating US$ 3.2 billion the debt flows (net) at US$
25.0 billion were led by external commercial borrowings reflecting strong investment
demand. Net capital flows, after financing the current account deficit, led to accretion
of US$ 36.6 billion, excluding valuation changes, to foreign exchange reserves during
2006-07.
31

THE CURRENT BANKING SCENARIO
Currently (2007), overall, banking in India is considered as fairly mature in
terms of supply, product range and reach-even though reach in rural India still
remains a challenge for the private sector and foreign banks. Even in terms of quality
of assets and capital adequacy, Indian banks are considered to have clean, strong and
transparent balance sheets-as compared to other banks in comparable economies in its
region. The Reserve Bank of India is an autonomous body, with minimal pressure
from the government. The stated policy of the Bank on the Indian Rupee is to manage
volatility-without any stated exchange rate-and this has mostly been true.
With the growth in the Indian economy expected to be strong for quite some
time-especially in its services sector, the demand for banking services-especially retail
banking, mortgages and investment services are expected to be strong. M&As,
takeovers, asset sales and much more action (as it is unravelling in China) will happen
on this front in India.
This is the first time an investor has been allowed to hold more than 5% in a
private sector bank since the RBI announced norms in 2005 that any stake exceeding
5% in the private sector banks would need to be vetted by them.
Currently, India has 88 scheduled commercial banks (SCBs) - 28 public sector
banks (that is with the Government of India holding a stake), 29 private banks (these
do not have government stake; they may be publicly listed and traded on stock
exchanges) and 31 foreign banks. They have a combined network of over 53,000
branches and 17,000 ATMs. According to a report by ICRA Limited, a rating agency,
the public sector banks hold over 75 percent of total assets of the banking industry,
with the private and foreign banks holding 18.2% and 6.5% respectively.
32

STATE BANK OF INDIA
BSE: 500112 NSE: SBININDUSTRY: Banking PSU.
33

BANK PROFILE:
State Bank of India was established on the 1st July, 1955, by acquiring the total
asset and the liabilities of the Imperial Bank of India. The State Bank of India has a
paid up capital of Rs. 526.30 crore.
Reserve Bank of India is the single largest shareholder of the bank. SBI’s shares and
bonds are listed for trading on all the major Indian stock exchanges viz., Bombay,
New Delhi, Kolkata, Chennai and Ahemdabad; and at the National Stock exchange.
SBI has one of the largest market capitalization of all the companies traded on the
exchanges. The banks GDRs are listed on the London Stock Exchange.
State Bank of India (SBI), formed in 1955 is the largest public sector bank in India.
The Government of India holds 59.73 percent of the total equity shares of the bank;
institutional investors hold 23.48 percent shares, while the Public holds 6.36 percent.
Mr. T. S. Bhattacharya is the chairman of the bank.
Core sectors to which services of the bank extends are Personal banking, NRI's,
Agricultural and Rural sectors, International banking, Corporate banking, Small and
Medium Sized Enterprises (SME), Government banking, etc. Some of the primary
services provided are working capital finance, project finance, deferred payment
guarantees, capex loans, corporate term loans, structured finance, dealer financing,
channel financing, equipment leasing, loan syndication, financing Indian overseas
firms, packing credit, external commercial borrowings, foreign currency loans, Letter
of Credits, guarantees, etc. Facilities provided by the bank are ATM services, Internet
banking, e-payments, e-rail booking, safe deposit locker, gift cheques, foreign inward
remittance, foreign travel card etc. The bank also provides non-banking services in
areas like capital markets, mutual funds, security trading, insurance, factoring services
and credit card business etc., through its subsidiaries.
The registered office of SBI is in Mumbai. The bank operates through a network of
14 Local Head Offices, 57 Zonal Offices and 5217 ATMs all over India. It also has 52
foreign offices in 34 countries across the globe. It has 3 training institutes located at
34

Hyderabad and an academy at Gurgaon. The bank has also acquired two new
branches at Sydney and Muscat.
Shareholding Pattern
Indian Promoters 59.7%Foreign collaborators 0.01%Indian inst/Mutual Fund 11.0%FIIs 11.9%ADR/GDR 0.0%Free float 17.3%Shareholders 526,782
Market related data as on 18/06/07
Market Capital 69387 (Rs Crore)
Face ValueRs. 10
52 Wks High/Low1455/684
Market Price1318
35

FINANCIAL ANALYSIS
BALANCE SHEET OF STATE BANK OF INDIA FOR THE LAST THREE YEARS.
Rs in Crore MARCH 2005 MARCH 2006 MARCH 2007Capital and LiabilitiesEquity Share Capital 526.30 526.30 526.30Preference Share Capital
0.00 0.00 0.00
Reserves 23,545.84 27,117.79 30,772.26Revaluation Reserves 0.00 0.00 0.00Deposits 367,047.52 380,046.06 435,521.09Borrowings 19,184.31 30,641.24 39,703.33Other Liabilities & Provisions
49,767.97 55,829.23 60,283.15
Total Liabilities 460,071.94 494,160.62 566,806.13ASSETSCash & Balance with RBI
16,810.33 21,652.70 29,076.43
Balance with Banks, Money at Call
22,511.77 22,907.30 22,892.26
Advances 202,374.45 261,800.94 337,336.49Investments 197,097.91 162,534.24 149,148.88Net Block 2,576.42 2,673.11 2,676.92Capital Work in Progress
121.27 79.82 141.95
Other Assets 18,579.79 22,512.51 25,533.20Total Assets 460,071.94 494,160.62 566,806.13
36

PROFIT AND LOSS ACCOUNT OF STATE BANK OF INDIA FOR THE LAST THREE YEARS.
Rs in Crore MARCH 2005 MARCH 2006 MARCH 2007INCOMEInterest Earned 32,428.00 35,979.57 39,491.03Other Income 7,121.73 7,528.16 7,498.94Total Income 39,549.73 43,507.73 46,989.97EXPENDITUREInterest expended 18,483.37 20,390.45 23,436.82Employee Cost 6,907.35 8,123.05 7,932.58Selling and Admin Expenses
2,414.61 2,872.92 3,288.55
Depreciation 752.21 763.68 631.51Miscellaneous Expenses
6,687.67 6,950.96 7,159.20
Preoperative Exp Capitalised
0.00 0.00 0.00
Operating Expenses 10,076.00 11,759.65 13,530.15Provisions & Contingencies
6,685.84 6,950.96 5,481.69
Total Expenditure 35,245.21 39,101.06 42,448.66Net Profit for the Year
4,304.52 4,406.67 4,541.31
Profit brought forward
0.34 0.34 0.34
Total Profit 4,304.86 4,407.01 4,541.65Equity Dividend (%) 125.00 140.00 140.00No of Share 526300000 526300000 526300000
37

NET PROFIT GROWTH
4,304.864407.01
4541.65
4,150.004,200.004,250.004,300.004,350.004,400.004,450.004,500.004,550.00
Net Profit (Rs in Crores)
2005 2006 2007
Year
SBI
STOCK PRICE
SBI
654.8 681.9
938 908.15 968.5727.75
1028.651245.6
994.45
1525
0200400600800
10001200140016001800
Date
31/03
/05
30/06
/05
30/09
/05
31/12
/05
31/03
/06
30/06
/06
30/09
/06
31/12
/06
31/03
/07
Date
Pri
ce
38

MARKET PRICE AS ON BALANCE SHEET DATE:
(in Rs ) MARCH 2005 MARCH 2006 MARCH 2007Market price per share
654.8 968 994
KEY FINANCIAL RATIOS
Particulars MARCH 2005 MARCH 2006 MARCH 2007ROE 17.88 16.25 14.51EPS 81.79 83.73 86.29Dividend Payout Ratio
15.28 16.72 16.22
Book Value Per Share 457.38 525.63 594.69P/E Ratio % 8.05 11.56 11.51
INTERPRATATION:
The profit of the bank is not increasing much, which can be the reason which
has bought the return on equity down. The other reason for ROE decreasing may be
high distribution of dividend. Slow growth of the EPS must not be the reason for the
shareholder to worry because the bank is being giving more than 100% dividend
which brings the profit down and therefore the EPS.
As against this the P/E is on an increase. The increasing book value shows that
the bank has collected a good sum for the shareholders as reserves. The dividend
payout ratio is growing which is good for the holders who like to have some kind of
cash flow from their investments. The market price of the share shows a substantial
capital appreciation in the year 2005-60, but shows volatility.
39

BANK OF INDIA
BSE – 532149 NSE - BANKINDIAINDUSTRY – Banking PSU.
40

BANK PROFILE
Bank of India was founded on 7th September, 1906 by a group of eminent
businessmen from Mumbai. The Bank was under private ownership and control till
July 1969 when it was nationalized along with 13 other banks.
Beginning with one office in Mumbai, with a paid-up capital of Rs.50 lakh and 50
employees, the Bank has made a rapid growth over the years and blossomed into a
mighty institution with a strong national presence and sizable international operations.
In business volume, the Bank occupies a premier position among the nationalized
banks.
The Bank has 2644 branches in India spread over all states/ union territories including
93 specialized branches. These branches are controlled through 48 Zonal Offices.
There are 24 branches/ offices (including three representative offices) abroad.
The Bank came out with its maiden public issue in 1997. Total number of
shareholders as on 30/09/2006 is 2, 25,704.
While firmly adhering to a policy of prudence and caution, the Bank has been in the
forefront of introducing various innovative services and systems. Business has been
conducted with the successful blend of traditional values and ethics and the most
modern infrastructure. The Bank has been the first among the nationalized banks to
establish a fully computerized branch and ATM facility at the Mahalaxmi Branch at
Mumbai way back in 1989. The Bank is also a Founder Member of SWIFT in India. It
pioneered the introduction of the Health Code System in 1982, for evaluating/ rating
its credit portfolio.
The Bank's association with the capital market goes back to 1921 when it entered into
an agreement with the Bombay Stock Exchange (BSE) to manage the BSE Clearing
House. It is an association that has blossomed into a joint venture with BSE, called
the BOI Shareholding Ltd. to extend depository services to the stock broking
community. Bank of India was the first Indian Bank to open a branch outside the
country, at London, in 1946, and also the first to open a branch in Europe, Paris in
41

1974. The Bank has sizable presence abroad, with a network of 23 branches
(including three representative offices) at key banking and financial centers viz.
London, New York, Paris, Tokyo, Hong-Kong, and Singapore. The international
business accounts for around 20.10% of Bank's total business.
Shareholding Pattern
Indian Promoters 69.5%Foreign collaborators 0.0%Indian inst/Mutual Fund 5.7%FIIs 16.1%ADR/GDR 0.0%Free float 8.8%Shareholders 211,473
Market related data as on 18/06/07
Market Capital 9338 (Rs Crore)
Face ValueRs. 10
52 Wks High/Low217/80
Market Price191
42

FINANCIAL ANALYSIS
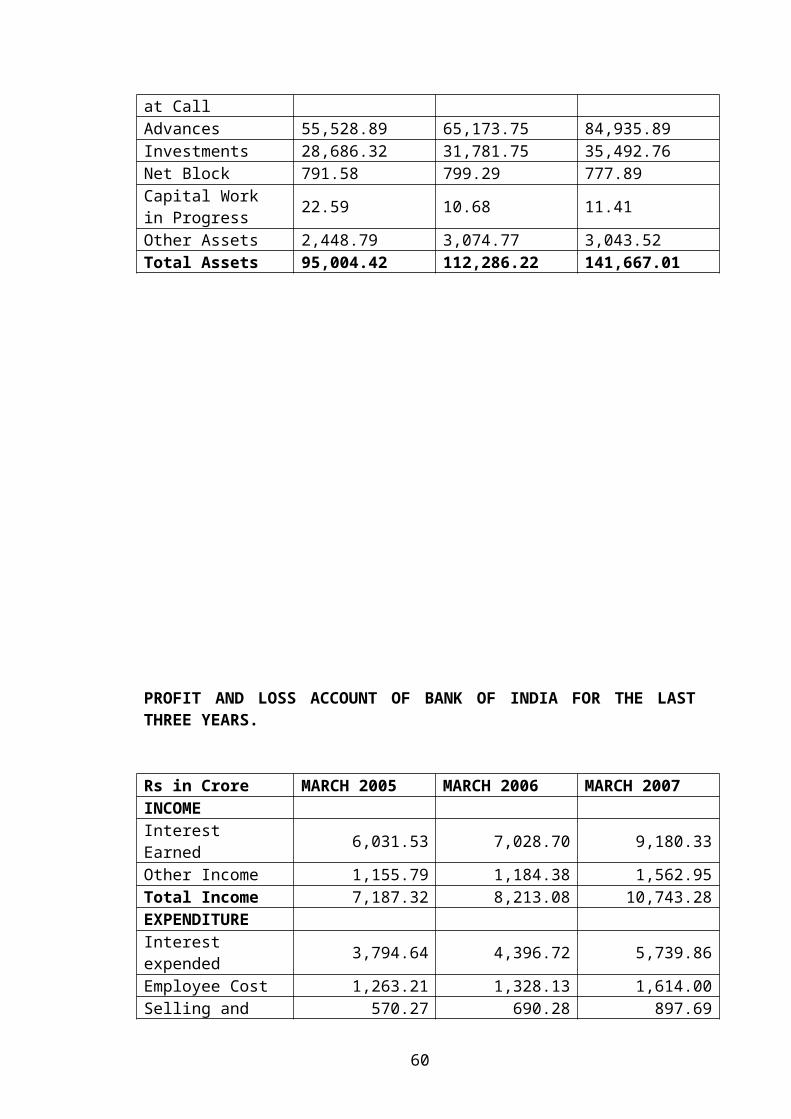
BALANCE SHEET OF BANK OF INDIA FOR THE LAST THREE YEARS.
Rs in Crore MARCH 2005 MARCH 2006 MARCH 2007Capital and LiabilitiesEquity Share Capital 488.14 488.14 488.14Preference Share Capital
0.00 0.00 0.00
Reserves 3811.12 4338.40 5257.75Revaluation Reserves 165.61 157.35 149.48Deposits 78,821.44 93,932.03 119,881.74Borrowings 5,961.95 5,893.91 6,620.83Other Liabilities & Provisions
5,756.16 7,476.39 9,269.07
Total Liabilities 95,004.42 112,286.22 141,667.01ASSETSCash & Balance with RBI
3,904.73 5,588.41 7,196.89
Balance with Banks, Money at Call
3,621.52 5,857.57 10,208.65
Advances 55,528.89 65,173.75 84,935.89Investments 28,686.32 31,781.75 35,492.76Net Block 791.58 799.29 777.89Capital Work in Progress
22.59 10.68 11.41
Other Assets 2,448.79 3,074.77 3,043.52Total Assets 95,004.42 112,286.22 141,667.01
43

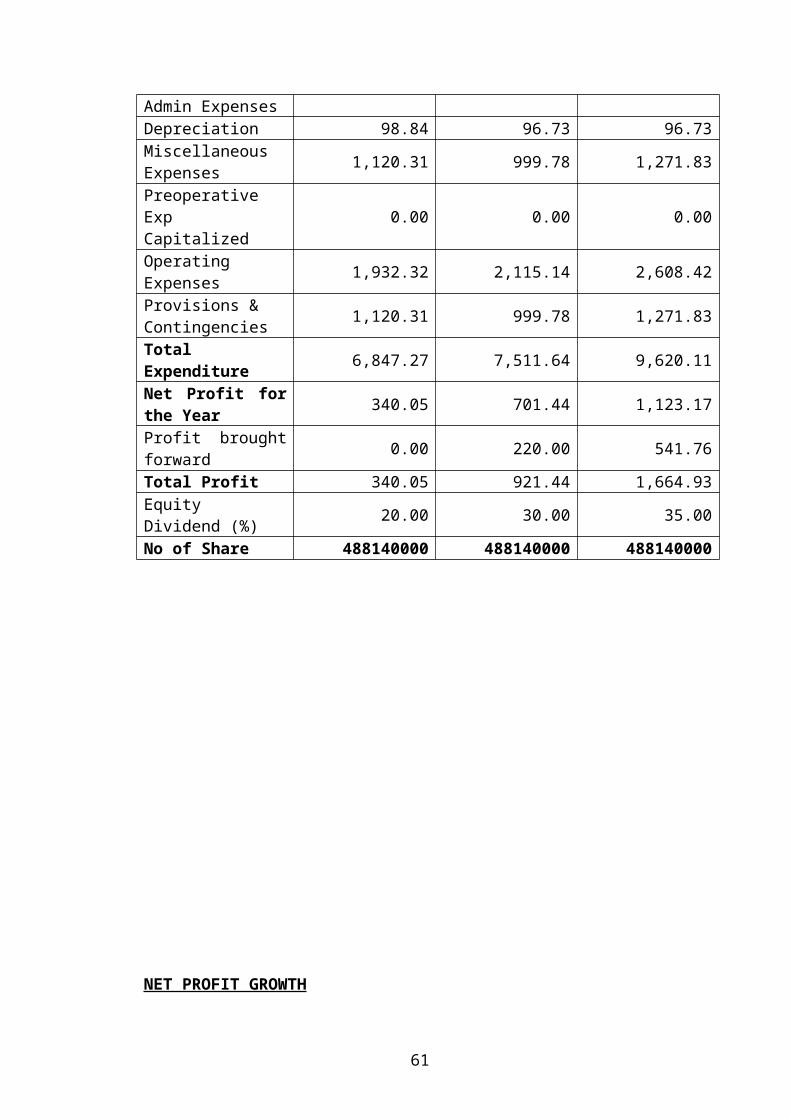
PROFIT AND LOSS ACCOUNT OF BANK OF INDIA FOR THE LAST THREE YEARS.
Rs in Crore MARCH 2005 MARCH 2006 MARCH 2007INCOMEInterest Earned 6,031.53 7,028.70 9,180.33Other Income 1,155.79 1,184.38 1,562.95Total Income 7,187.32 8,213.08 10,743.28EXPENDITUREInterest expended 3,794.64 4,396.72 5,739.86Employee Cost 1,263.21 1,328.13 1,614.00Selling and Admin Expenses
570.27 690.28 897.69
Depreciation 98.84 96.73 96.73Miscellaneous Expenses
1,120.31 999.78 1,271.83
Preoperative Exp Capitalized
0.00 0.00 0.00
Operating Expenses 1,932.32 2,115.14 2,608.42Provisions & Contingencies
1,120.31 999.78 1,271.83
Total Expenditure 6,847.27 7,511.64 9,620.11Net Profit for the Year
340.05 701.44 1,123.17
Profit brought forward
0.00 220.00 541.76
Total Profit 340.05 921.44 1,664.93Equity Dividend (%) 20.00 30.00 35.00No of Share 488140000 488140000 488140000
44

NET PROFIT GROWTH
340.05
921.44
1664.93
0
500
1000
1500
2000
Net Profit (Rs in Crores)
2005 2006 2007
Year
BOI
STOCK PRICE
BOI Price
103.65 103.5122.9 126.9 133.45
100.3
162
207.4
168
231.7
0
50
100
150
200
250
31/03
/05
30/06
/05
30/09
/05
31/12
/05
31/03
/06
30/06
/06
30/09
/06
31/12
/06
31/03
/07
31/06
/07
Date
Pri
ce
45

MARKET PRICE OF THE SHARE AS ON 31 ST MARCH:
(in Rs ) MARCH 2005 MARCH 2006 MARCH 2007Market price per share
103.65 133.45 167.8
KEY FINANCIAL RATIOS:
Particulars MARCH 2005 MARCH 2006 MARCH 2007ROE (%) 7.62 18.49 28.24EPS (Rs) 6.96 18.89 34.10Dividend Payout Ratio 28.73 15.88 10.26P/E Ratio 14.89 7.07 4.92Book Value Per Share (Rs)
91.47 102.09 120.77
INTERPRETATION:
Percentage wise the net profit of the bank is very favorable. The growth in
return on equity is also showing that the bank is earning sufficiently for the
shareholders. The growing profits are leading towards the growth of the EPS. The
price trend also shows that the share is not much volatile and also shows an upward
trend. Holders for long term are benefited from the capital appreciation.
The P/E ratio showing a down trend may be because of the price not
increasing to the proportion of the profit. A lower P/E ratio is considered one of the
most important criteria for investment purpose. The growing book value indicates that
the bank has huge reserves and can be a potential for bonus.
46

PUNJAB NATIONAL BANK
BSE: 532461 NSE: PNB
INDUSTRY: Banking PSU
47

BANK PROFILE:
Established in 1895 at Lahore, undivided India, Punjab National Bank (PNB)
has the distinction of being the first Indian bank to have been started solely with
Indian capital.The bank was nationalised in July 1969 along with 13 other banks.
From its modest beginning, the bank has grown in size and stature to become a front-
line banking institution in India at present.
Punjab National Bank is the fourth largest banking entity in the country (in
terms of asset size) with 4.2% share of the total credit disbursals at the end of FY07.
Given its geographic concentration in the northern regions, the bank was a laggard in
terms of credit growth until FY04, which led to it barely sustaining its share of non-
food credit at 4.5%. However, not able to keep up with its private sector peers in
incremental credit disbursements and low retail credit exposure resulted in a loss of
market share (from 4.5% in FY04 to 4% in FY06). Nevertheless, an operating
overhaul in terms of asset quality and retention of high margins has helped the bank
position itself favourably amongst its peers and marginally enhance its share in FY07.
Adequate capital, high NPA coverage and interest rate insulation pegs the bank
amongst the frontrunners in the public sector banking space.
A professionally managed bank with a successful track record of over 110
years. Largest branch network in India – 4525 offices including 432 Extension
counters spread throughout the country. Strategic business area covers the large Indo
– Gangetic belt and the metropolitan centers. Rupee drawing arrangements with M/s
UAE Exchange Centre, UAE, M/s Al Fardan Exchange Co. Doha, Qatar,M/s
Bahrain Exchange Co, Kuwait, M/s Bahrain Finance Co, Bahrain,M/s Thomas Cook
Al Rostamani Exchange Co. Dubai,UAE, and M/s Musandam Exchange, Ruwi,
Sultanate of Oman.
48

Share Holding Pattern
Indian Promoters 57.8%Foreign collaborators 0.0%Indian inst/Mut Fund 16.2%FIIs 20.1%ADR/GDR 0.0%Free float 6.0%Shareholders 240,135
Market related data as on 18/06/07
Market Capital 15434 (Rs Crore)
Face ValueRs. 10
52 Wks High/Low585/300
Market Price490
49

FINANCIAL ANALYSIS
BALANCE SHEET OF PUNJAB NATIONAL BANK FOR THE LAST THREE YEARS.
(Rs in Crore) MARCH 2005 MARCH 2006 MARCH 2007Capital and LiabilitiesEquity Share Capital
315.30 315.30 315.30
Preference Share Capital
0.00 0.00 0.00
Reserves 7,533.51 8,758.68 9,826.31Revaluation Reserves
312.49 302.38 293.85
Deposits 103,166.89 119,684.92 139,859.67Borrowings 2,718.29 6,664.87 1,948.86Other Liabilities & Provisions
12,222.24 9,623.64 10,285.14
Total Liabilities 126,268.72 145,349.79 162,529.13ASSETSCash & Balance with RBI
9,460.20 23,394.55 12,372.03
Balance with Banks, Money at Call
1,628.83 1,397.14 3,273.49
Advances 60,412.75 74,627.37 96,596.52Investments 50,672.83 41,055.31 45,189.84Net Block 965.23 1,030.23 1,009.82Capital Work in Progress
0.00 0.00 0.00
Other Assets 3,128.88 3,845.19 4,087.43Total Assets 126,268.72 145,349.79 162,529.13
50

PROFIT AND LOSS ACCOUNT OF PUNJAB NATIONAL BANK FOR THE LAST THREE YEARS.
Rs in Crore MARCH 2005 MARCH 2006 MARCH 2007INCOMEInterest Earned 8,459.85 9,584.15 11,537.48Other Income 2,186.36 1,901.00 1,932.71Total Income 10,646.21 11,485.15 13,470.19EXPENDITUREInterest expended 4,453.11 4,917.39 6,022.91Employee Cost 2,121.23 2,114.98 2,352.45Selling and Admin Expenses
670.70 721.53 778.97
Depreciation 183.28 186.64 194.80Miscellaneous Expenses
1,807.77 2,105.30 2,580.98
Preoperative Exp Capitalised
0.00 0.00 0.00
Operating Expenses
3,437.48 3,300.70 4,216.64
Provisions & Contingencies
1,345.50 1,827.75 1,690.56
Total Expenditure 9,236.09 10,045.84 11,930.11Net Profit for the Year
1,410.12 1,439.31 1,540.08
Extraordionary Items
0.00 0.00 -13.27
Profit brought forward
0.00 0.00 183.49
Total Profit 1,410.12 1,439.31 1,710.30Equity Dividend (%)
60.00 90.00 100.00
No of Share 315300000 315300000 315300000
51

NET PROFIT GROWTH
1410.12 1439.311710.3
0200400600800
10001200140016001800
Net Profit (Rs in crore)
2005 2006 2007
Year
PNB
STOCK PRICE
PNB Price
393.35 379.5
450.6 466.25 470.4
369.5
507474.4
541.25
0
100
200
300
400
500
600
31/03/05 30/06/05 30/09/05 31/12/05 31/03/06 30/06/06 30/09/06 31/12/06 31/03/07
Date
Pri
ce
52

MARKET PRICE OF THE SHARE AS ON 31 ST MARCH:
(in Rs ) MARCH 2005 MARCH 2006 MARCH 2007Market price per share
393.35 470.4 474.4
KEY FINANCIAL RATIOS:
MARCH 2005 MARCH 2006 MARCH 2007ROE (%) 17.28 15.35 16.40EPS (Rs) 44.72 45.64 54.24Dividend Payout Ratio 13.42 19.72 18.44Price Earning Ratio 8.80 10.30 8.30Book Value Per Share (Rs)
258.84 297.40 330.97
INTERPRETATION:
The trends of profits are leading the EPS; i. e. the profit has shown a small
growth in the year 2005 – 06 and shows an increase in the year 2006 – 07, similarly
the EPS follows the trend. The dividend payout ratio is increasing and the share
holders are enjoying the current inflow of cash.
The P/E ratio is volatile because of the price volatility. The company with the
help of the growing profit is retaining the profit which in turn is supporting to the
book value of the share.
The investor must look over the return on equity and the deviations of the
share price that is depicted in the price graph. Investor with low risk profile must be
careful if they have this stock in their portfolio.
53

BANK OF BARODA
BSE: 532134 NSE: BANKBARODA
INDUSTRY: Banking PSU
54

BANK PROFILE:
Bank of Baroda is the fifth largest banking entity in the country (in terms of
asset size) with 4% share of the total credit disbursals at the end of FY06. Given its
geographic concentration in the northern regions, the bank was a laggard in terms of
credit growth in the initial years of this decade, which resulted in a loss of market
share. However, brand and operating overhaul led to accelerated growth in the last
two fiscals, thus helping the bank stabilise its share and position itself favourably
amongst its peers.
Bank of Baroda (BSE: 532134) is a bank in India established on July 20, 1908
by Maharaja of Baroda Sir Sayajirao Gaekwad III in the princely state of Baroda, in
Gujarat. The bank, along with 13 other major commercial banks of India, was
nationalisd on 19th July, 1969, by the Government of India.
Bank of Baroda is the fifth largest bank in India. It has total assets in excess of
Rs. 1.78 lakh crores, or Rs. 1,780 bn., a network of over 2800 branches and offices,
and about 700 ATMs. Bank of Baroda offers a wide range of banking products and
financial services to corporate and retail customers through a variety of delivery
channels and through its specialised subsidiaries and affiliates in the areas of
investment banking, credit cards and asset management. In its international expansion
Bank of Baroda followed the Indian diaspora, and especially that of the Gujaratis. The
bank has received Reserve Bank of India approval to open offices in Australia, the
Maldives, and New Zealand. It is seeking approval for operatons in Bahrain,
Johannesburg, Kuwait, Mozambique, and Qatar, and is seeking to establish a joint
venture or subsidiary in Ghana and Trinidad and Tobago.
55

Shareholding Pattern
Indian Promoters 53.8%Foreign collaborators 0.0%Indian inst/Mutual Fund 14.7%FIIs 20.1%ADR/GDR 0.0%Free float 11.4%Shareholders 224, 161
Market related data as on 18/06/07
Market Capital 9480 (Rs Crore)
Face ValueRs. 10
52 Wks High/Low296/176
Market Price260
56

FINANCIAL ANALYSIS
BALANCE SHEET OF BANK OF BARODA FOR THE LAST THREE YEARS.
(Rs in Crore) MARCH 2005 MARCH 2006 MARCH 2007Capital and LiabilitiesEquity Share Capital
294.53 365.53 365.53
Preference Share Capital
0.00 0.00 0.00
Reserves 5,333.23 7,478.91 8,284.41Revaluation Reserves
0.00 0.00 0.00
Deposits 81,333.46 93,661.99 124,915.98Borrowings 1,640.83 4,802.20 1,142.56Other Liabilities & Provisions
6,062.18 7,083.90 8,437.70
Total Liabilities 94,664.23 113,392.53 143,146.18ASSETSCash & Balance with RBI
2,712.32 3,333.43 6,413.52
Balance with Banks, Money at Call
6,541.88 10,121.21 11,866.85
Advances 43,400.38 59,911.78 83,620.87Investments 37,074.44 35,114.22 34,943.63Net Block 860.80 920.73 1,088.81Capital Work in Progress
0.00 0.00 0.00
Other Assets 4,074.41 3,991.16 5,212.50Total Assets 94,664.23 113,392.53 143,146.18
57

PROFIT AND LOSS ACCOUNT OF BANK OF BARODA FOR THE LAST THREE YEARS.
Rs in Crore MARCH 2005 MARCH 2006 MARCH 2007INCOMEInterest Earned 6,431.42 7,049.95 9,212.64Other Income 1,344.39 1,394.05 1,434.03Total Income 7,775.81 8,444.00 10,646.67EXPENDITUREInterest expended 3,452.15 3,875.09 5,426.56Employee Cost 1,381.05 1,523.79 1,644.07Selling and Admin Expenses
516.87 749.83 705.97
Depreciation 81.88 111.13 194.28Miscellaneous Expenses
1,667.02 1,357.20 1,649.33
Preoperative Exp Capitalised
0.00 0.00 0.00
Operating Expenses
2,010.81 2,547.14 2,797.04
Provisions & Contingencies
1,636.01 1,194.81 1,396.61
Total Expenditure 7,098.97 7,617.04 9,620.21Net Profit for the Year
676.84 826.96 1,026.46
Extraordionary Items
0.00 0.00 0.00
Profit brought forward
0.00 0.00 0.00
Total Profit 676.84 826.96 1,026.46Equity Dividend (%)
50.00 50.00 60.00
No of Share 264530000 365530000 365530000
58

NET PROFIT GROWTH
676.84826.96
1026.46
0
200
400
600
800
1000
1200
Net Profit (Rs in Crores)
2005 2006 2007
Year
BOB
STOCK PRICE
BOB Price
217.75196.65
249 241.05 230.55196.25
288.45
240215.05
0
50
100
150
200
250
300
350
31/03/05 30/06/05 30/09/05 31/12/05 31/03/06 30/06/06 30/09/06 31/12/06 31/03/07
Date
Pri
ce
59
MARKET PRICE OF THE SHARE AS ON 31 ST MARCH:
(in Rs ) MARCH 2005 MARCH 2006 MARCH 2007Market price per share
217.75 230.15 215.05
KEY FINANCIAL RATIOS:
MARCH 2005 MARCH 2006 MARCH 2007ROE (%) 12.02 10.54 11.87EPS (Rs) 25.59 22.62 28.03Dividend Payout Ratio 19.54 22.10 21.37Price Earning Ratio 8.51 10.17 7.67Book Value Per Share (Rs)
212.75 214.60 236.64
INTERPRETATION:
The profit for the bank has increase but the return on equity is showing a
downward trend in the earlier year and then again rising. The issue of additional
equity share may be the reason for such a trend. The bank is also giving good
dividend to the shareholder.
The volatility of the share price can be the reason for displaying such a P/E
trend. The dividend payout ratio shows a minor downtrend. The share is quit volatile.
We can say this because the price has almost not shown any movement over the
period.
60
FINDINGS
COMPERATIVE ANANLYSIS OF THE BANKS
Bank Name
ROE EPS (Rs.) P/E Price as on
30/06/07
Mar-05 Mar-07 Change Mar-05 Mar-07 ChangeMar-
07SBI 17.88 14.51 -3.37 81.79 86.29 4.5 11.51 1525.8BOI 7.62 28.24 20.62 6.96 34.1 27.14 4.92 231.7PNB 17.28 16.4 -0.88 44.72 54.24 9.52 8.3 541.25BOB 12.02 11.87 -0.15 25.59 28.03 2.44 7.67 270.25
INTERPRATION
On comparing the major players of the public sector banking, we can see that
bank of India is being greater increase in the return of equity and EPS than the other
players. The return on equity is the highest for Bank of India. The profit of the bank is
also growing at quicker rate. The P/E is considered one of the important factor that
attract the buyer. The P/E ratio is the lowest indicating that a multiple of 5 of price to
earnings exhibits some potential for capital appreciation in the case of Bank of India.
The price of the share is also low so small investors are also attracted for investment.
The ratios considered above thus show that Bank of India has generated good
profit over the years. The lower P/E multiple shows that the stock is undervalued and
has a great potential to grow.
61

LIMITATIONS
62

Fundamental analysis has some limitation involved in it. This limitation can be
explained as under:
Time Constrain:
Fundamental analysis may offer excellent insights, but it can be
extraordinarily time-consuming. Time-consuming models often produce valuations
that are contradictory to the current price prevailing on the exchange. This is not to
say that there are not misunderstood companies out there
Industry/Company Specific:
Valuation techniques vary depending on the industry group and specifics of
each company. For this reason, a different technique and model is required for
different industries and different companies. This can get quite time-consuming,
which can limit the amount of research that can be performed.
The sales and inventory ratio may be very important for the cement sector
company but these ratios are not very useful for the banking sector.
Vastness Of Fundamental Analysis
Fundamental analysis is a very vast concept. It was difficult to analyse each and
every component involved in it. Here an attempt is made to learn the basic of
Fundamental Analysis because it is difficult to carry out the whole process of
fundamental analysis with in two months because of the vastness.
63

CONCLUSION
64

Fundamental analysis holds that no investment decision should be
without processing and analyzing all relevant information. It strength lies in the fact
the information analyzed is real as opposed to hunches or assumptions. On the other
hand, while fundamental analysis deals with tangible fact, it does not tend to ignore
the fact that human beings do not always act rationally. Market prices do sometimes
deviate from fundamentals. Prices rise or fall due to insider trading, speculation,
rumour, and a host of other factors.
This is true to an extent but strength of fundamental analysis is that an
investment decision is arrived at after analyzing information and making logical
assumptions and deductions. Furthermore, fundamental analysis ensures that one does
not recklessly buy or sell shares- especially buy.
Fundamental analysis can be valuable, but it should be approached with
caution. If you are reading research written by a sell-side analyst, it is important to be
familiar with the analyst behind the report. We all have personal biases, and every
analyst has some sort of bias. There is nothing wrong with this, and the research can
still be of great value. Learn what the ratings mean and the track record of an analyst
before jumping off the deep end. Corporate statements and press releases offer good
information, but they should be read with a healthy degree of skepticism to separate
the facts from the spin. Press releases don't happen by accident; they are an important
PR tool for companies. Investors should become skilled readers to weed out the
important information and ignore the hype.
65

To conclude we can say that:
Fundamentals of any company are the most important information that any
investor must collect and analyse.
The public sector banks will see an upswing in the near future because there is
a huge requirement of the funds from both the sector goods as well as services.
The banking industry sees a bright future ahead. This industry has huge
growth prospects.
On comparing various Public sector banks with each other on the basis of the
financials Bank of India was found to be the best for a value investment.
Fundamental analysis helps an investor to take rational decisions on buying or
selling of a specific stock – especially buying.
66

RECOMMANDATION
67

The analysis carried out at India Infoline of the public sector banks, their profit
and loss account, balance sheet and ratios I shall suggests the investors to give priority
to BANK OF INDIA than other banks as a value investment. The reason is obvious
that the bank is fundamentally very strong.
The return that the bank has given on the shareholders investment is substantially
good. The profit growth of a company is a true indicator of a company’s true
performance and due weight age must be given to it. The price of the stock is low
which attracts small investors. The kind of profit the bank is generating over the
period is quit appreciable. The capital appreciation of the share is also good for the
investor. The fundamental of the economy are also strong and looks that the market
would be touching new highs.
68

BIBLIOGRAPHY:
Websites:www.moneycontrol.comwww.bankofbaroda.comwww.bankofindia.comwww.nseindia.comwww.indiainfoline.comwww.equitymaster.comwww.rbi.org.inwww.wikipedia.com
Magazines: Dalal Street.
Financial Daily:
Economic Times.
Books: Security Analysis and Portfolio Management – Prasana Chandra Banking Law and Practice. – H. C. Agarwal
69

ANNEXURE
Formulae for Investment Ratios:
Return on Equity:Equity Earnings (Profit) / Equity (Net worth) * 100.
Earning Per Share:Equity Earnings (Profit) / No. of Outstanding Shares.
Dividend Payout Ratio:Equity Dividends / Equity Earnings (Profit).
Price/Earning Ratio: Market Price Per Share/ Earning Per Share
Book Value Per Share: Paid – up Equity Capital + Reserves and Surplus / No. of Outstanding Shares.
70