Embed Size (px)
Citation preview

1
Soil Classification
B. Munwar Basha
Sieve Analysis, Liquid Limit and Plastic Limit
2
If I give you a bag of 1-Kg soil taken from an under construction site and ask you the following
questions.
1. What is the most basic classification of soil?
2. What are the methods of soil gradation or grain size distribution?
3. How do you define the soil types? Clay, Silt, Sand, Gravel or cobble and boulder
4. Calculate D10, D30 and D60 of this soil using the sieve analysis?
5. Calculate both the Cu and CC of this soil?
6. Is this soil poorly, gap or well graded, Liquid limit and Plastic limit? How do you define theses terms?
You will learn in today’s practical class
Answer all the above questions in your first report.

3
Purpose:
• This test is performed to determine the percentage of different grain sizes contained within a soil.
• The mechanical or sieve analysis is performed to determine the distribution of the coarser, larger-sized particles, and the hydrometer method is used to determine the distribution of the finer particles.
Significance:
• The distribution of different grain sizes affects the engineering properties of soil.
• Grain size analysis provides the grain size distribution, and it is required in classifying the soil.

4
Major Soil Groups
0.002 4.750.075
Grain size (mm)
BoulderClay Silt Sand Gravel Cobble
Fine grain soils
Coarse grain soils
Granular soils or Cohesionless soils
Cohesive soils

5
Grain Size Distribution
To know the relative proportions of different grain sizes.
An important factor influencing the geotechnical characteristics of a coarse grain soil.
Not important in fine grain soils.
Significance of GSD:

6
Grain Size Distribution
In coarse grain soils …... By sieve analysisDetermination of GSD:
In fine grain soils …... By hydrometer analysis
Sieve Analysis Hydrometer Analysis
soil/water suspension
hydrometer
stack of sieves
sieve shaker

7
Sieve Analyses

8
Sieve Analysis

9
Sieve Designation - Large
Sieves larger than the #4 sieve are designated by the size of the openings in the sieve

10
Sieve Designation - Smaller
10 openings per inch
# 10 sieve
1-inch
Smaller sieves are numbered according to the number of openings per inch

11
Sieving procedure(1) Write down the weight of each sieve as well as the bottom pan to be used in the analysis.
(2) Record the weight of the given dry soil sample.
(3) Make sure that all the sieves are clean, and assemble them in the ascending order of sieve numbers (#4 sieve at top and #200 sieve at bottom). Place the pan below #200 sieve. Carefully pour the soil sample into the top sieve and place the cap over it.
(4) Place the sieve stack in the mechanical shaker and shake for 10 minutes.
(5) Remove the stack from the shaker and carefully weigh and record the weight of each sieve with its retained soil. In addition, remember to weigh and record the weight of the bottom pan with its retained fine soil.

12

13

14
Data Analysis:
(1) Obtain the mass of soil retained on each sieve by subtracting the weight of the empty sieve from the mass of the sieve + retained soil, and record this mass as the weight retained on the data sheet. The sum of these retained masses should be approximately equals the initial mass of the soil sample. A loss of more than two percent is unsatisfactory.
(2) Calculate the percent retained on each sieve by dividing the weight retained on each sieve by the original sample mass.
(3) Calculate the percent passing (or percent finer) by starting with 100 percent and subtracting the percent retained on each sieve as a cumulative procedure.

15

16

17
For example: Total mass = 500 g,
Mass retained on No. 4 sieve = 9.7 g
For the No.4 sieve:
Quantity passing = Total mass - Mass retained
= 500 - 9.7 = 490.3 g
The percent retained is calculated as;
% retained = Mass retained/Total mass
= (9.7/500) X 100 = 1.9 %
From this, the % passing = 100 - 1.9 = 98.1 %

18
Grain size distribution
0.0001 0.001 0.01 0.1 1 10 1000
20
40
60
80
100
Particle size (mm)
% F
iner

19
Unified Soil Classification Each soil is given a 2 letter classification (e.g. SW).
The following procedure is used.
Coarse grained (>50% larger than 75 mm)
Prefix S if > 50% of coarse is Sand Prefix G if > 50% of coarse is Gravel
Suffix depends on %fines
if %fines < 5% suffix is either W or P if %fines > 12% suffix is either M or C if 5% < %fines < 12% Dual symbols are used

20
Unified Soil ClassificationTo determine W or P, calculate Cu and Cc
CD
Du = 60
10
CD
D Dc =×302
60 10( )
0.0001 0.001 0.01 0.1 1 10 1000
20
40
60
80
100
Particle size (mm)
% F
iner
x% of the soil has particles smaller than Dx

21
Grading curves
0.0001 0.001 0.01 0.1 1 10 1000
20
40
60
80
100
Particle size (mm)
% F
iner
W Well graded

22
Grading curves
0.0001 0.001 0.01 0.1 1 10 1000
20
40
60
80
100
Particle size (mm)
% F
iner
W Well graded
U Uniform

23
Grading curves
0.0001 0.001 0.01 0.1 1 10 1000
20
40
60
80
100
Particle size (mm)
% F
iner
W Well graded
U Uniform
P Poorly graded

24
Grading curves
0.0001 0.001 0.01 0.1 1 10 1000
20
40
60
80
100
Particle size (mm)
% F
iner
W Well graded
U Uniform
P Poorly graded
C Well graded with some clay

25
Grading curves
0.0001 0.001 0.01 0.1 1 10 1000
20
40
60
80
100
Particle size (mm)
% F
iner
W Well graded
U Uniform
P Poorly graded
C Well graded with some clay
F Well graded with an excess of fines

Grain Size Distribution Curve
can find % of gravels, sands, fines
define D10, D30, D60.. as above.
0
20
40
60
80
100
0.001 0.01 0.1 1 10 100
Grain size (mm)
D30
sievehydrometer
D10 = 0.013 mm
D30 = 0.47 mm
D60 = 7.4 mm
sands gravelsfines
% P
as
sin
g

27
To determine W or P, calculate Cu and Cc
CD
Du = 60
10
CD
D Dc =×302
60 10( )
0.0001 0.001 0.01 0.1 1 10 1000
20
40
60
80
100
Particle size (mm)
% F
iner
D90 = 3 mm
x% of the soil has particles smaller than Dx

28
Well or Poorly Graded Soils
Well Graded Soils Poorly Graded Soils
Wide range of grain sizes present
Gravels: Cc = 1-3 & Cu >4
Sands: Cc = 1-3 & Cu >6
Others, including two special cases:
(a) Uniform soils – grains of same size
(b) Gap graded soils – no grains in a specific size range

29
Atterberg Limits
Border line water contents, separating the different states of a fine grained soil
Liquidlimit
Shrinkagelimit
Plasticlimit
0water content
liquidsemi-solid
brittle-solid
plastic

30
Purpose:This lab is performed to determine the plastic and liquid limits of a fine grained soil. The Atterberg limits are based on the moisture content of the soil. The plastic limit: is the moisture content that defines where the soil changes from a semi-solid to a plastic (flexible) state. The liquid limit: is the moisture content that defines where the soil changes from a plastic to a viscous fluid state.

31

32
Liquid Limit Definition
The water content at which a soil changes from a plastic consistency to a liquid consistency
Defined by Laboratory Test concept developed by Atterberg in 1911.

33
The liquid limit (LL) is arbitrarily defined as the water content, in percent, at which a pat of soil in a standard cup and cut by a groove of standard dimensions will flow together at the base of the groove for a distance of 12 mm under the impact of 25 blows in the devise. The cup being dropped 10 mm in a standard liquid limit apparatus operated at a rate of two shocks per second.
Defined by Laboratory Test concept developed by Atterberg in 1911.
34
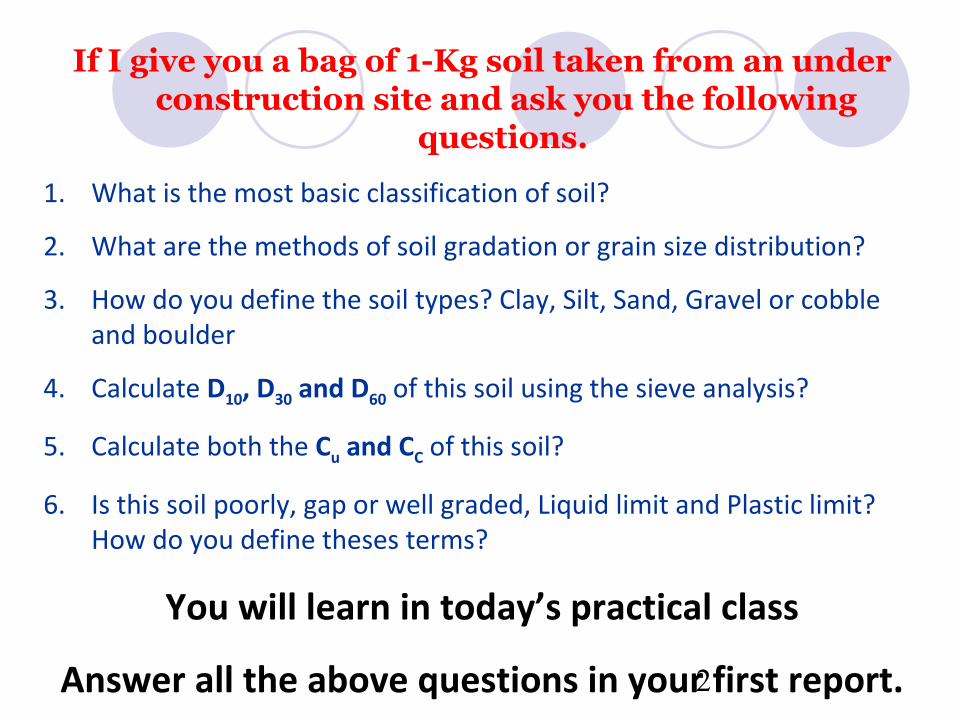
Atterberg Limits
Liquid Limit (wL or LL):
Clay flows like liquid when w > LL
Plastic Limit (wP or PL):
Lowest water content where the clay is still plastic
Shrinkage Limit (wS or SL):
At w<SL, no volume reduction on drying

35
LL Test Procedure
Prepare paste of soil finer than 425 micron sieve
Place Soil in Cup

36
LL Test Procedure
Cut groove in soil paste with standard grooving tool

37
LL Test Procedure
Rotate cam and count number of blows of cup required to close groove by 1/2”

38

39

40
LL Test Procedure
Perform on 3 to 4 specimens that bracket
25 blows to close groove
Obtain water content for each test
Plot water content versus number of blows
on semi-log paper

41
LL Test Results
Log N
water content, %LL= w%
Interpolate LL water content at 25 blows
25

42
LL Values < 16 % not realistic
16 Liquid Limit, %
PI,
%
43
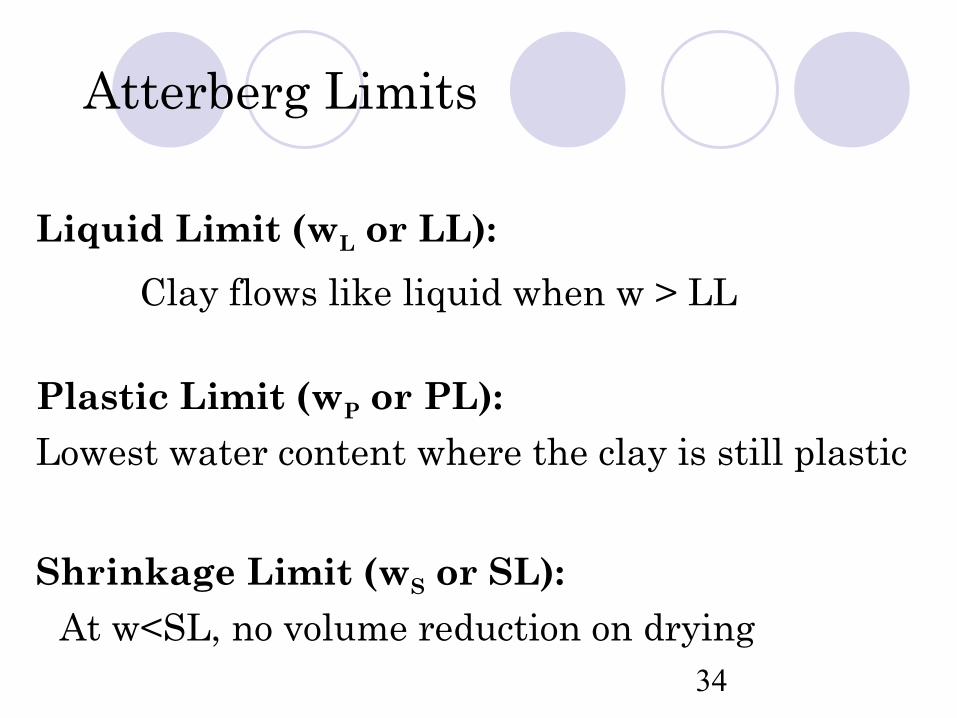
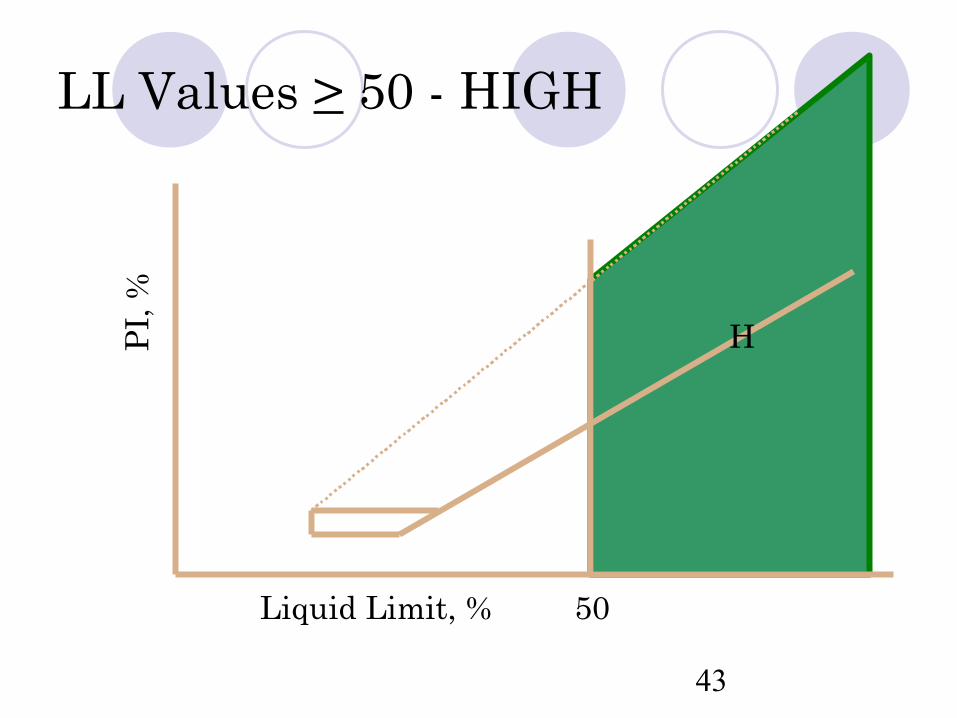
LL Values > 50 - HIGH
Liquid Limit, %
PI,
%
50
H

44
LL Values < 50 - LOW
Liquid Limit, %
PI,
%
50
L

45
Plastic Limit
The minimum water content at which a soil will just begin to crumble when it is rolled into a thread of approximately 3 mm in diameter.

46
Plastic Limit w% procedure
Using paste from LL test, begin drying May add dry soil or spread on plate and air-
dry

47
Plastic Limit w% procedure
When point is reached where thread is cracking and cannot be re-rolled to 3 mm diameter, collect at least 6 grams and measure water content. Defined plastic limit

48

49
1. Calculate the water content of each of the plastic limit moisture cans after they have been in the oven for at least 16 hours.
2. Compute the average of the water contents to determine the plastic limit, PL.
50
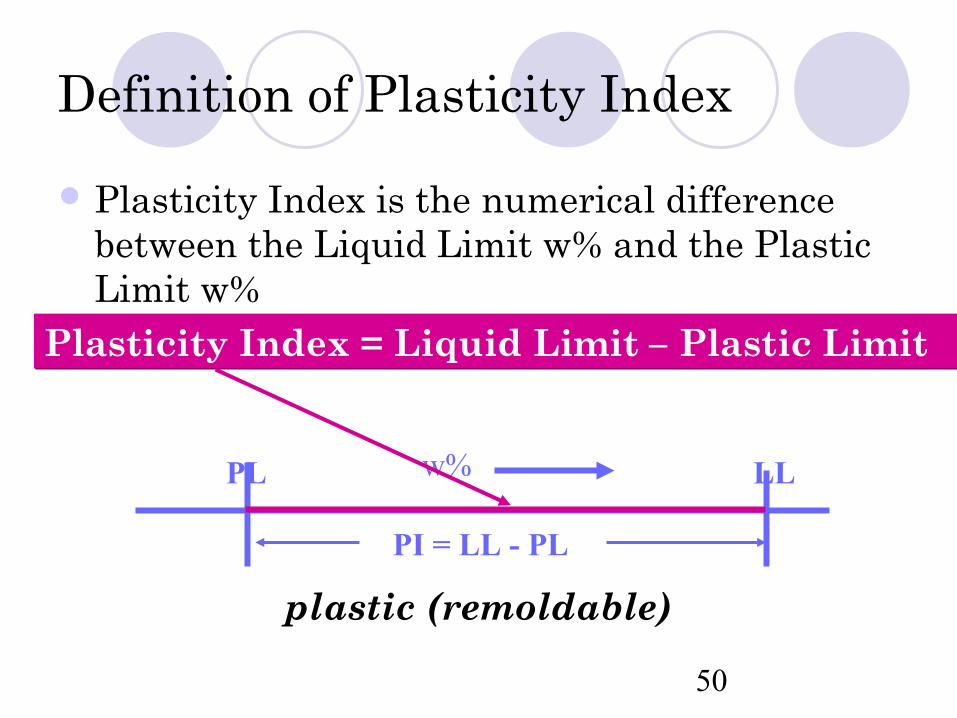
Definition of Plasticity Index
Plasticity Index is the numerical difference between the Liquid Limit w% and the Plastic Limit w%
w% LLPL
PI = LL - PL
Plasticity Index = Liquid Limit – Plastic LimitPlasticity Index = Liquid Limit – Plastic Limit
plastic (remoldable)

51
Low plasticity wL = < 35%
Intermediate plasticity wL = 35 - 50%
High plasticity wL = 50 - 70%
Very high plasticity wL = 70 - 90%
Extremely high plasticity wL = > 90%
Plasticity Chart