Embed Size (px)
Citation preview

Before
Minnetrista Corporation
July 16, 2005
Before
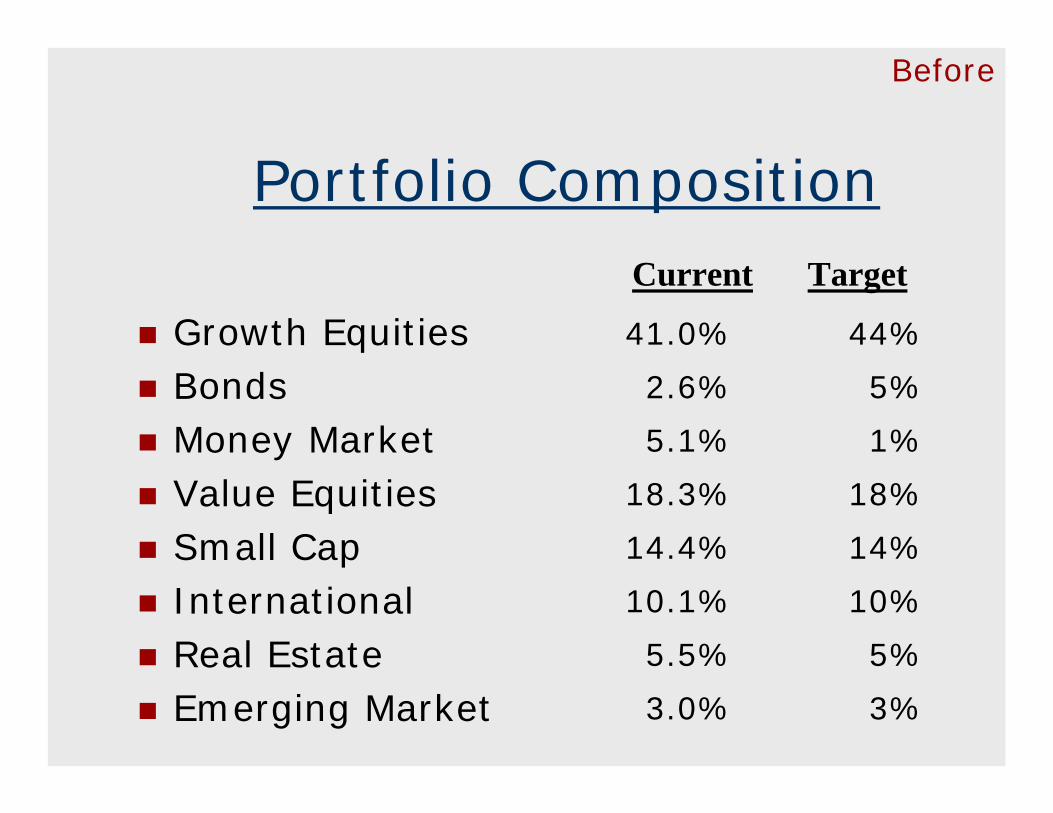
Portfolio Composition
Growth EquitiesBondsMoney MarketValue EquitiesSmall CapInternationalReal EstateEmerging Market
TargetCurrent
41.0%
2.6%
5.1%
18.3%
14.4%
10.1%
5.5%
3.0%
44%
5%
1%
18%
14%
10%
5%
3%

Before
Portfolio 12 Month 12 MonthClass Benchmark Allocation Return Benchmark----Money Mkts and Equivalents 90-Day US Treasury Bill 5.1% 1.7% 2.2%Taxable Bonds Lehman Bros Aggregate Bond Index 2.6% 3.5% 4.8%Real Estate Equities NAREIT Equity REIT Index 5.5% 33.9% 32.6%US Equities Standard and Poors 500 Stock Index 41.0% 6.3% 6.3%Large Cap Value Russell 1000 Value Index 18.3% 12.8% 14.0%Small Cap Equities Russell 2000 Index 14.4% 16.1% 9.5%International Equities MSCI EAFE Gross Index 10.1% 12.9% 14.1%Emerging Market Equities SandP/IFC Investable Composite Index 3.0% 36.3% 34.9%----Total 100% 11.6% 11.0%----
(thru 6/30/05)
Investment Performance (last 12 months)

Before
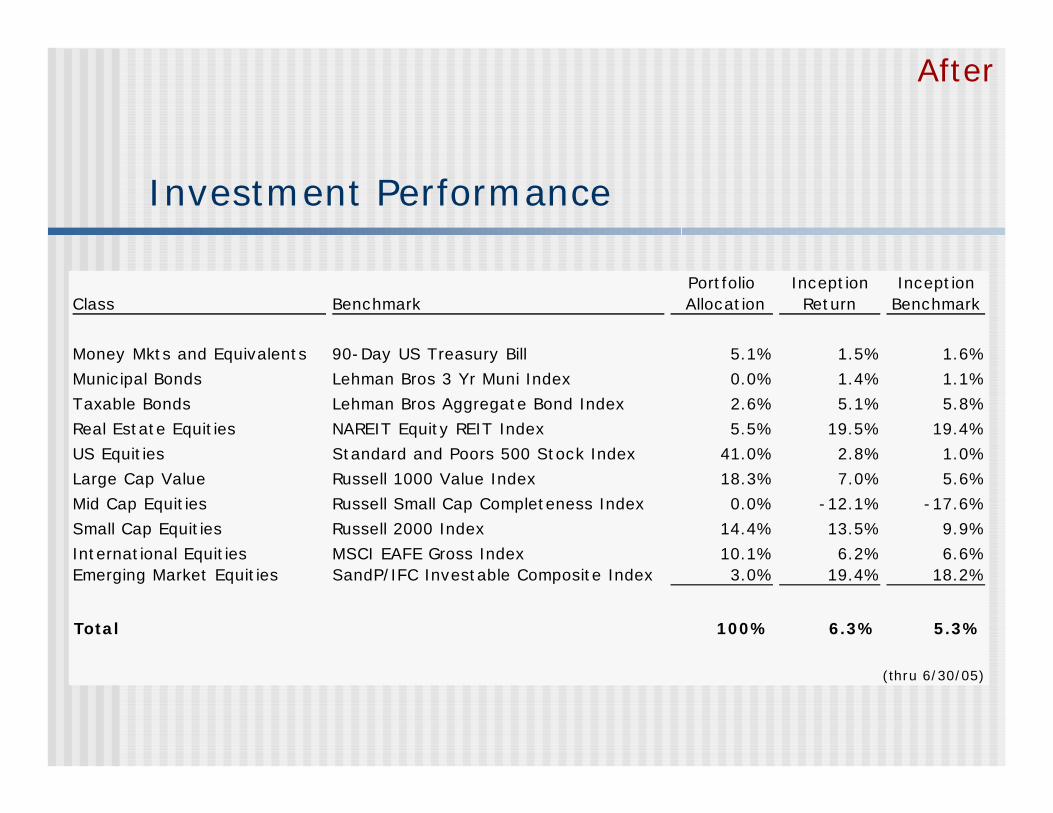
Portfolio Inception InceptionClass Benchmark Allocation Return Benchmark----Money Mkts and Equivalents 90-Day US Treasury Bill 5.1% 1.5% 1.6%Municipal Bonds Lehman Bros 3 Yr Muni Index 0.0% 1.4% 1.1%Taxable Bonds Lehman Bros Aggregate Bond Index 2.6% 5.1% 5.8%Real Estate Equities NAREIT Equity REIT Index 5.5% 19.5% 19.4%US Equities Standard and Poors 500 Stock Index 41.0% 2.8% 1.0%Large Cap Value Russell 1000 Value Index 18.3% 7.0% 5.6%Mid Cap Equities Russell Small Cap Completeness Index 0.0% -12.1% -17.6%Small Cap Equities Russell 2000 Index 14.4% 13.5% 9.9%International Equities MSCI EAFE Gross Index 10.1% 6.2% 6.6%Emerging Market Equities SandP/IFC Investable Composite Index 3.0% 19.4% 18.2%----Total 100% 6.3% 5.3%----
(thru 6/30/05)
Investment Performance
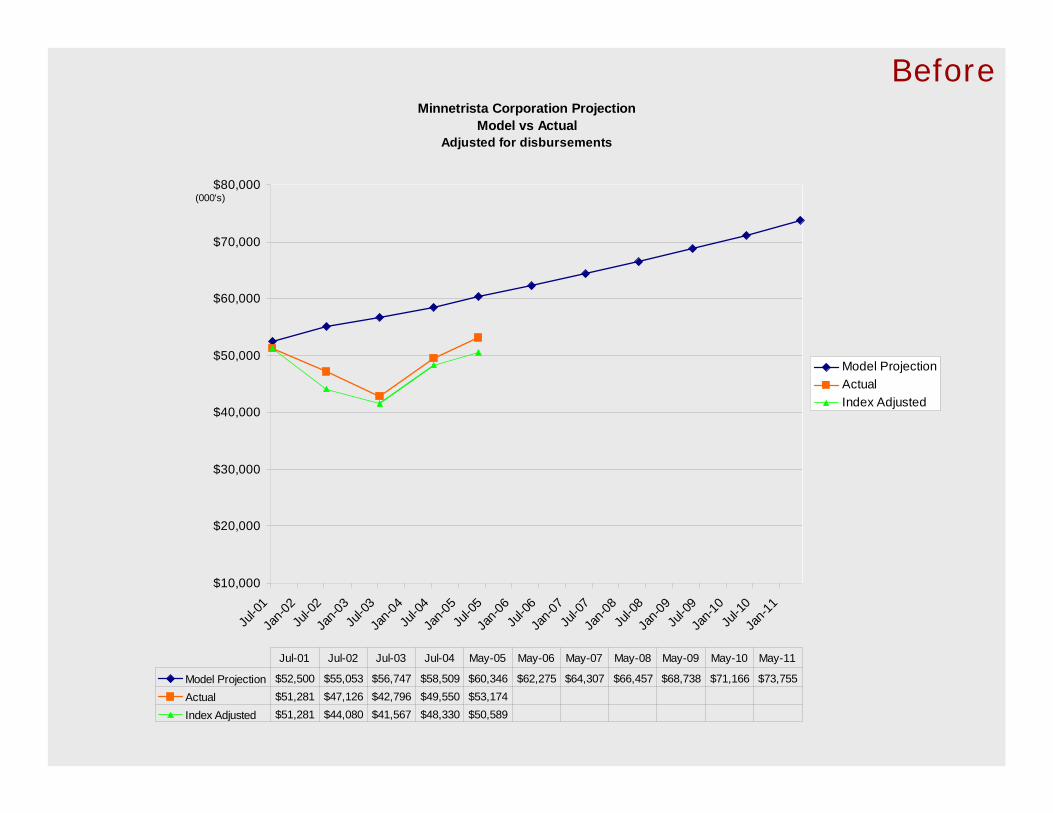
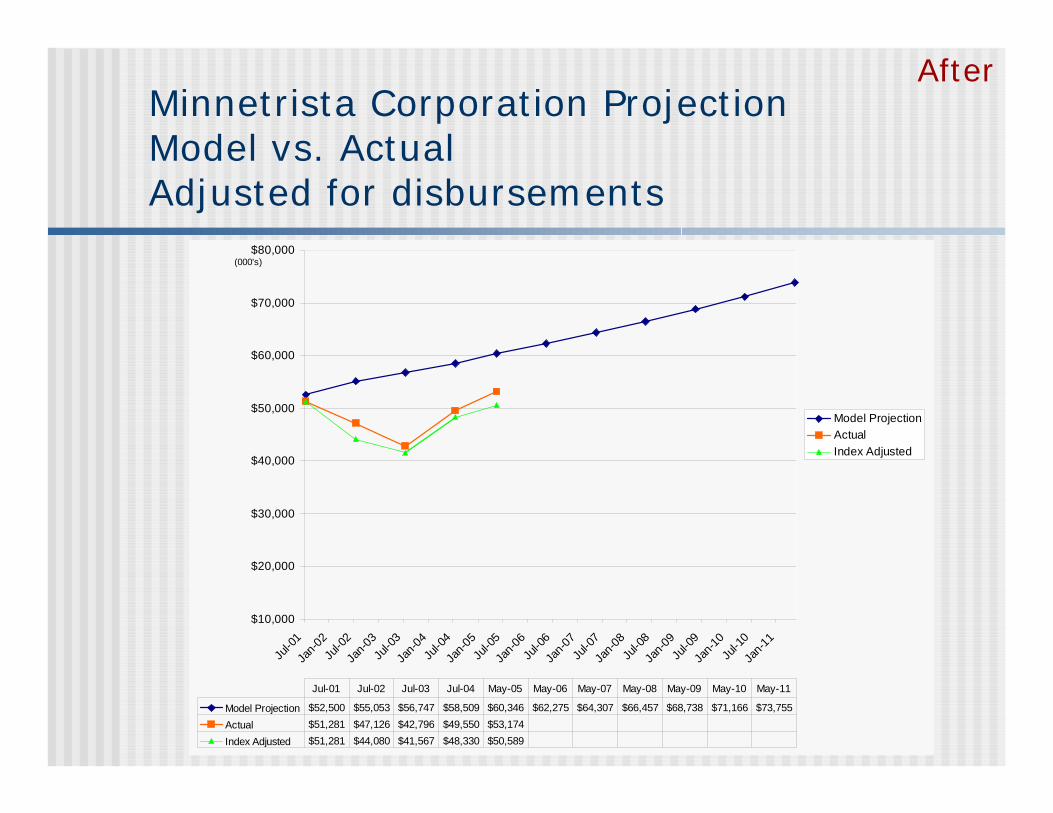
BeforeMinnetrista Corporation Projection
Model vs ActualAdjusted for disbursements
$10,000
$20,000
$30,000
$40,000
$50,000
$60,000
$70,000
$80,000
Jul-0
1Ja
n-02
Jul-0
2Ja
n-03
Jul-0
3Ja
n-04
Jul-0
4Ja
n-05
Jul-0
5Ja
n-06
Jul-0
6Ja
n-07
Jul-0
7Ja
n-08
Jul-0
8Ja
n-09
Jul-0
9Ja
n-10
Jul-1
0Ja
n-11
Model ProjectionActualIndex Adjusted
Model Projection $52,500 $55,053 $56,747 $58,509 $60,346 $62,275 $64,307 $66,457 $68,738 $71,166 $73,755Actual $51,281 $47,126 $42,796 $49,550 $53,174Index Adjusted $51,281 $44,080 $41,567 $48,330 $50,589
Jul-01 Jul-02 Jul-03 Jul-04 May-05 May-06 May-07 May-08 May-09 May-10 May-11
(000's)
Before
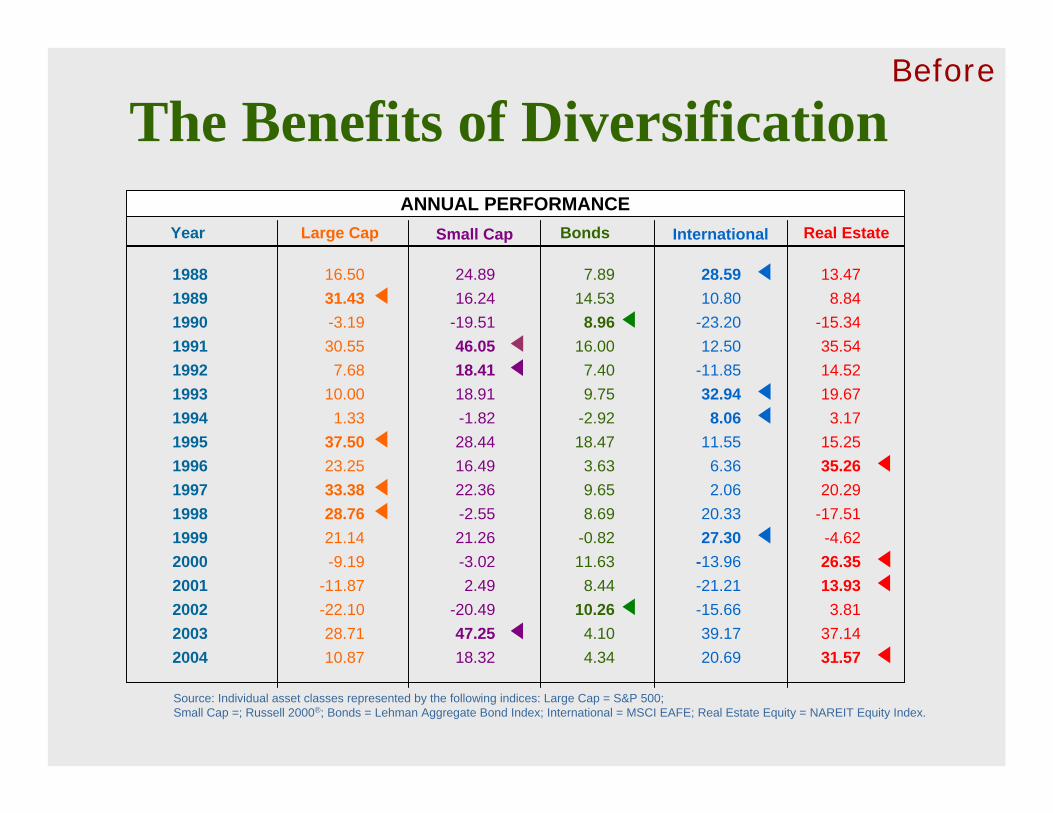
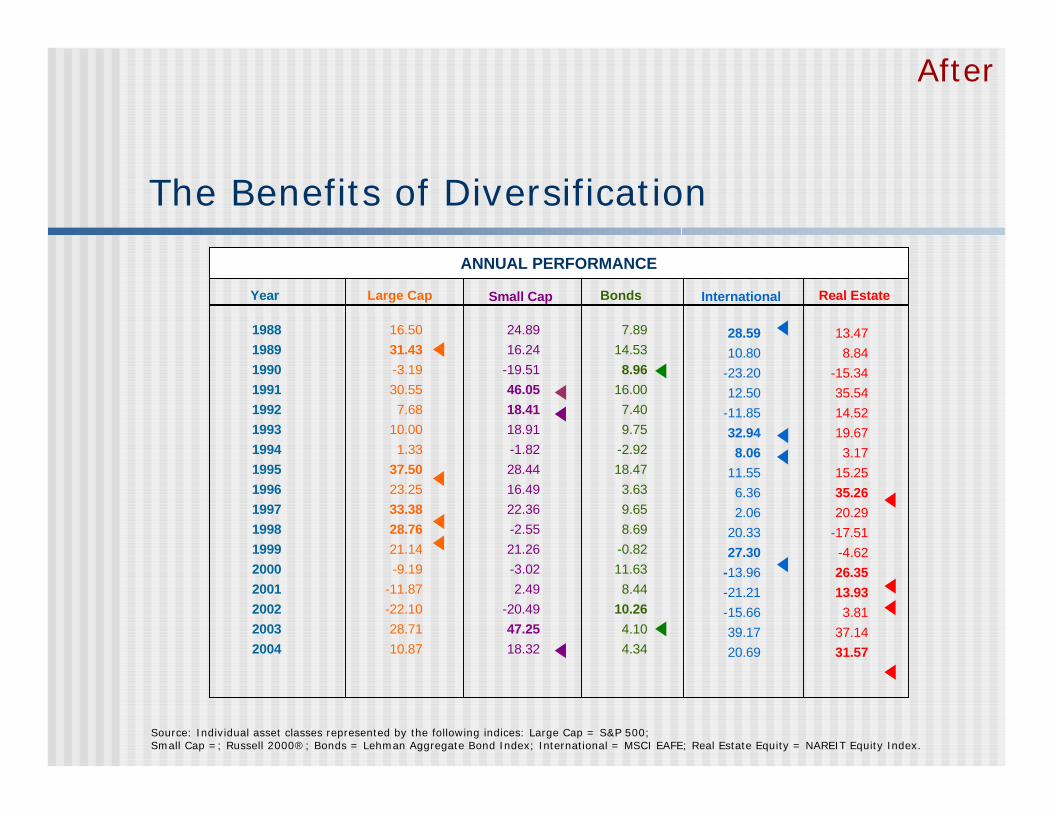
The Benefits of DiversificationANNUAL PERFORMANCE
Year Large Cap Small Cap Bonds International Real Estate
19881989199019911992199319941995199619971998199920002001200220032004
16.5031.43-3.1930.557.68
10.001.33
37.5023.2533.3828.7621.14-9.19
-11.87-22.1028.7110.87
24.8916.24
-19.5146.0518.4118.91-1.8228.4416.4922.36-2.5521.26-3.022.49
-20.4947.2518.32
7.8914.538.96
16.007.409.75
-2.9218.473.639.658.69
-0.8211.638.44
10.264.104.34
28.5910.80
-23.2012.50
-11.8532.948.06
11.556.362.06
20.3327.30
-13.96-21.21-15.6639.1720.69
13.478.84
-15.3435.5414.5219.673.17
15.2535.2620.29
-17.51-4.6226.3513.933.81
37.1431.57
Source: Individual asset classes represented by the following indices: Large Cap = S&P 500; Small Cap =; Russell 2000®; Bonds = Lehman Aggregate Bond Index; International = MSCI EAFE; Real Estate Equity = NAREIT Equity Index.

Before
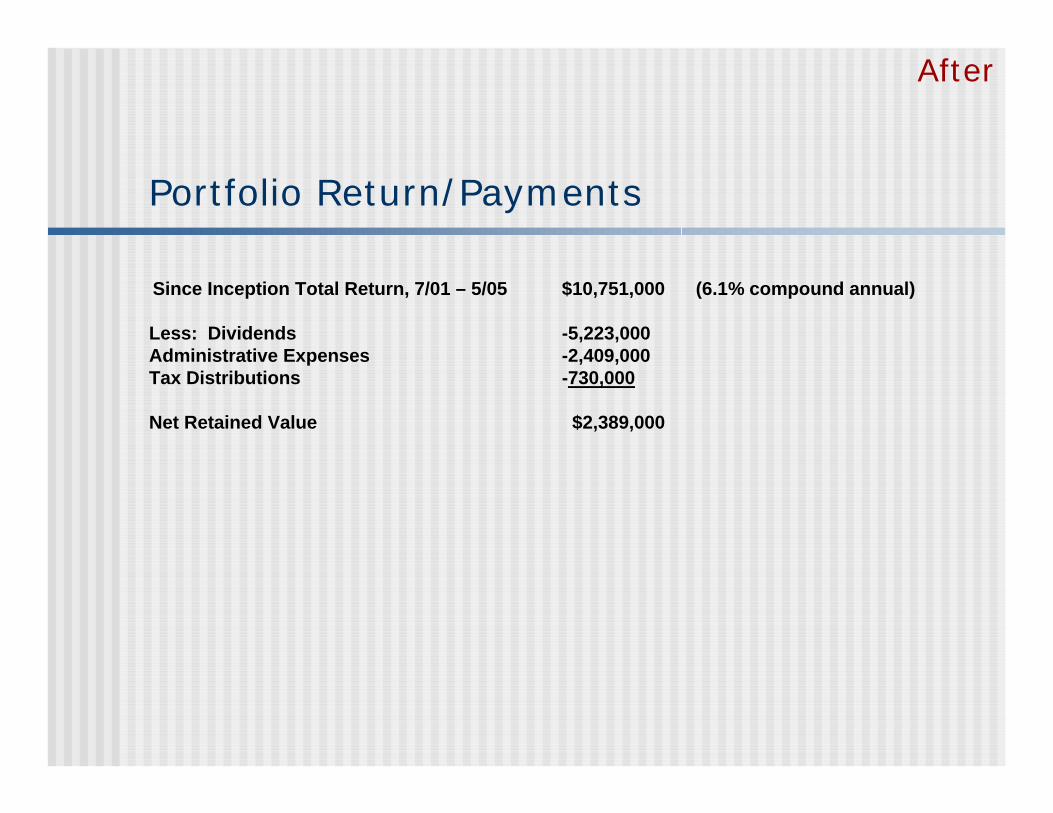
Portfolio Return/Payments

Before
Portfolio Return/Payments
Since Inception Total Return, 7/01 – 5/05 $10,751,000 (6.1% compoundannual)
Less: Dividends -5,223,000Administrative Expenses -2,409,000Tax Distributions -730,000
Net Retained Value $2,389,000

Before
Market
Outlook
Before
•Federal Reserve Policy
Before
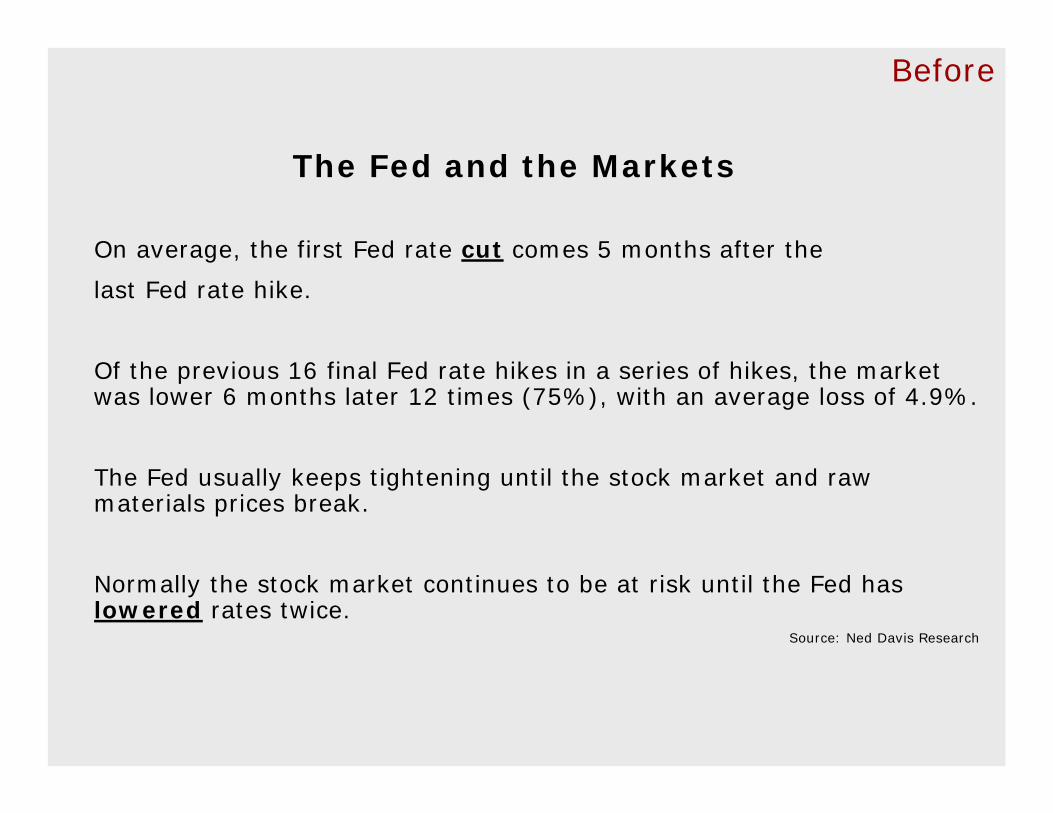
The Fed and the Markets
On average, the first Fed rate cut comes 5 months after the
last Fed rate hike.
Of the previous 16 final Fed rate hikes in a series of hikes, the market was lower 6 months later 12 times (75%), with an average loss of 4.9%.
The Fed usually keeps tightening until the stock market and raw materials prices break.
Normally the stock market continues to be at risk until the Fed has lowered rates twice.
Source: Ned Davis Research

Before
•Federal Reserve Policy
•Consumer Posture
Before
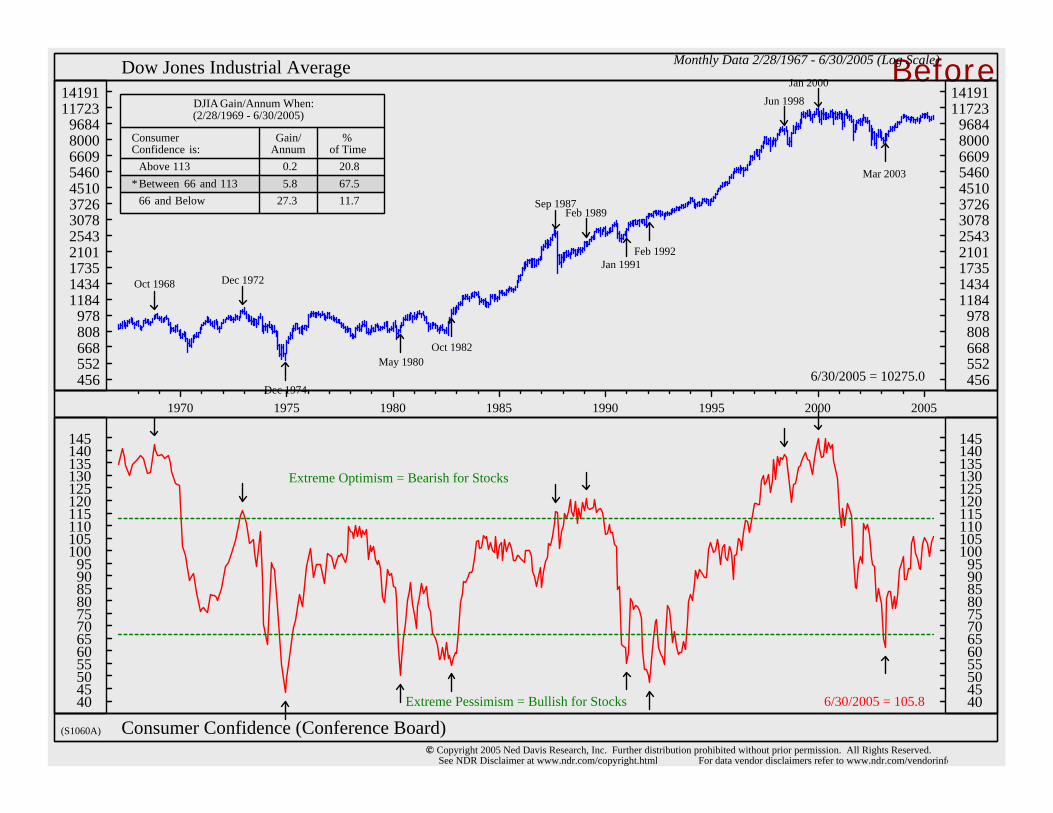
(S1060A)
Monthly Data 2/28/1967 - 6/30/2005 (Log Scale)
Oct 1968 Dec 1972
Sep 1987Feb 1989
Jun 1998
Jan 2000
Dec 1974
May 1980Oct 1982
Jan 1991Feb 1992
Mar 2003
DJIA Gain/Annum When: (2/28/1969 - 6/30/2005)
Consumer Gain/ % Confidence is: Annum of Time
Above 113 0.2 20.8* Between 66 and 113 5.8 67.5
66 and Below 27.3 11.7
6/30/2005 = 10275.0 456 552 668 808 978
118414341735210125433078372645105460660980009684
11723 14191
456 552 668 808 978
118414341735210125433078372645105460660980009684
11723 14191
Extreme Optimism = Bearish for Stocks
Extreme Pessimism = Bullish for Stocks 6/30/2005 = 105.8 404550556065707580859095
100 105 110 115 120 125 130 135 140 145
404550556065707580859095
100 105 110 115 120 125 130 135 140 145
Dow Jones Industrial Average
Consumer Confidence (Conference Board)
1970 1975 1980 1985 1990 1995 2000 2005
Copyright 2005 Ned Davis Research, Inc. Further distribution prohibited without prior permission. All Rights Reserved.See NDR Disclaimer at www.ndr.com/copyright.html For data vendor disclaimers refer to www.ndr.com/vendorinfo

Before
•Federal Reserve Policy
•Consumer Posture
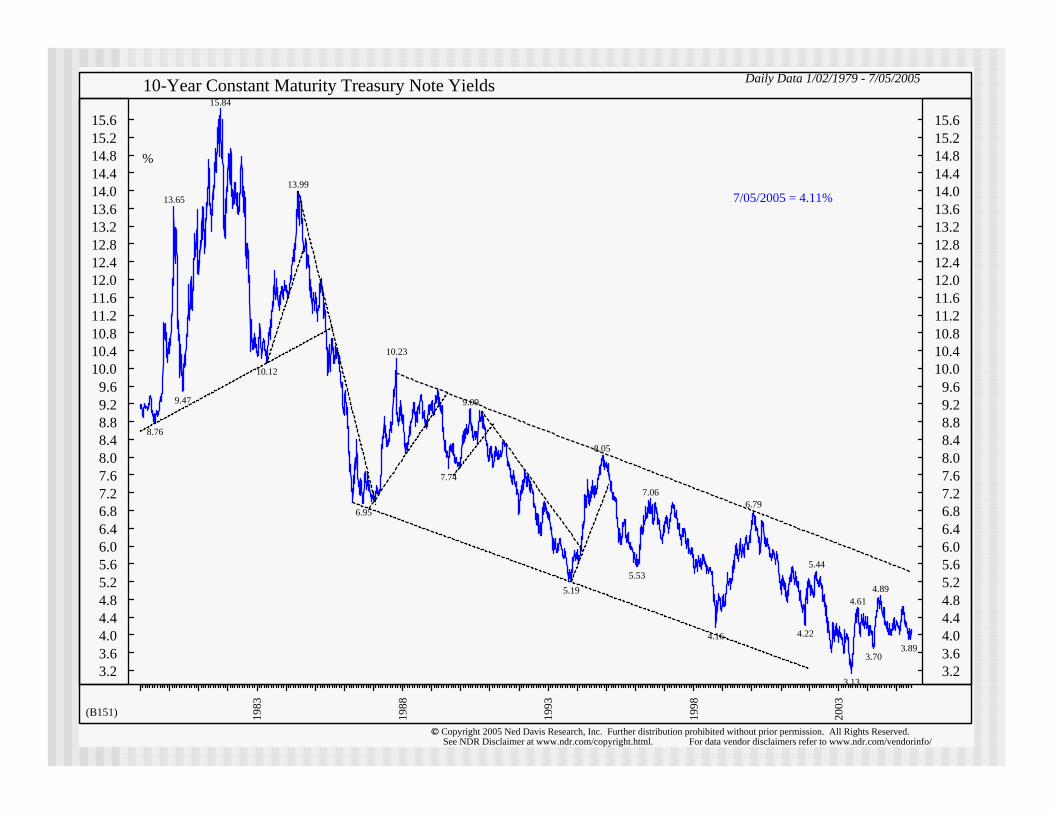
•Interest Rates

Before
(B151)
Daily Data 1/02/1979 - 7/05/2005
%
7/05/2005 = 4.11% 13.65
15.84
13.99
10.23
9.09
8.05
7.066.79
5.44
4.614.89
8.76
9.47
10.12
6.95
7.74
5.195.53
4.16 4.22
3.13
3.703.89
3.2 3.6 4.0 4.4 4.8 5.2 5.6 6.0 6.4 6.8 7.2 7.6 8.0 8.4 8.8 9.2 9.6
10.010.410.811.211.612.012.412.813.213.614.014.414.815.215.6
3.2 3.6 4.0 4.4 4.8 5.2 5.6 6.0 6.4 6.8 7.2 7.6 8.0 8.4 8.8 9.2 9.6
10.010.410.811.211.612.012.412.813.213.614.014.414.815.215.6
1983
1988
1993
1998
2003
10-Year Constant Maturity Treasury Note Yields
Copyright 2005 Ned Davis Research, Inc. Further distribution prohibited without prior permission. All Rights Reserved.See NDR Disclaimer at www.ndr.com/copyright.html For data vendor disclaimers refer to www.ndr.com/vendorinfo
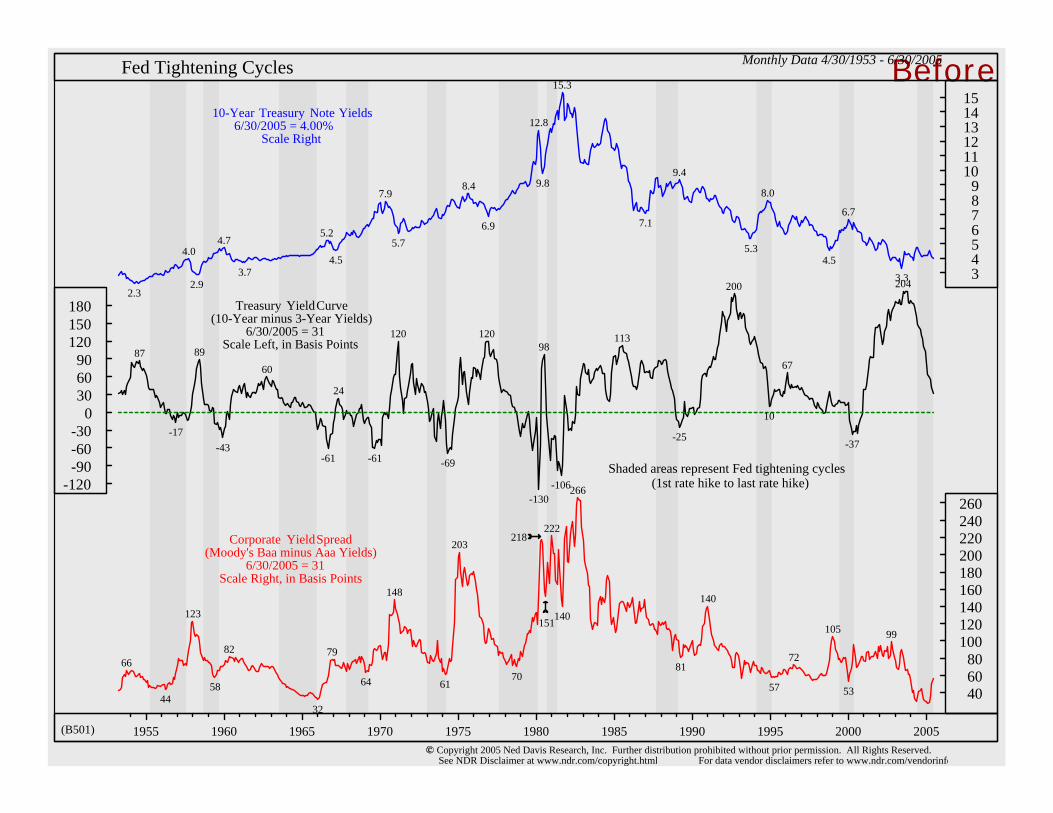
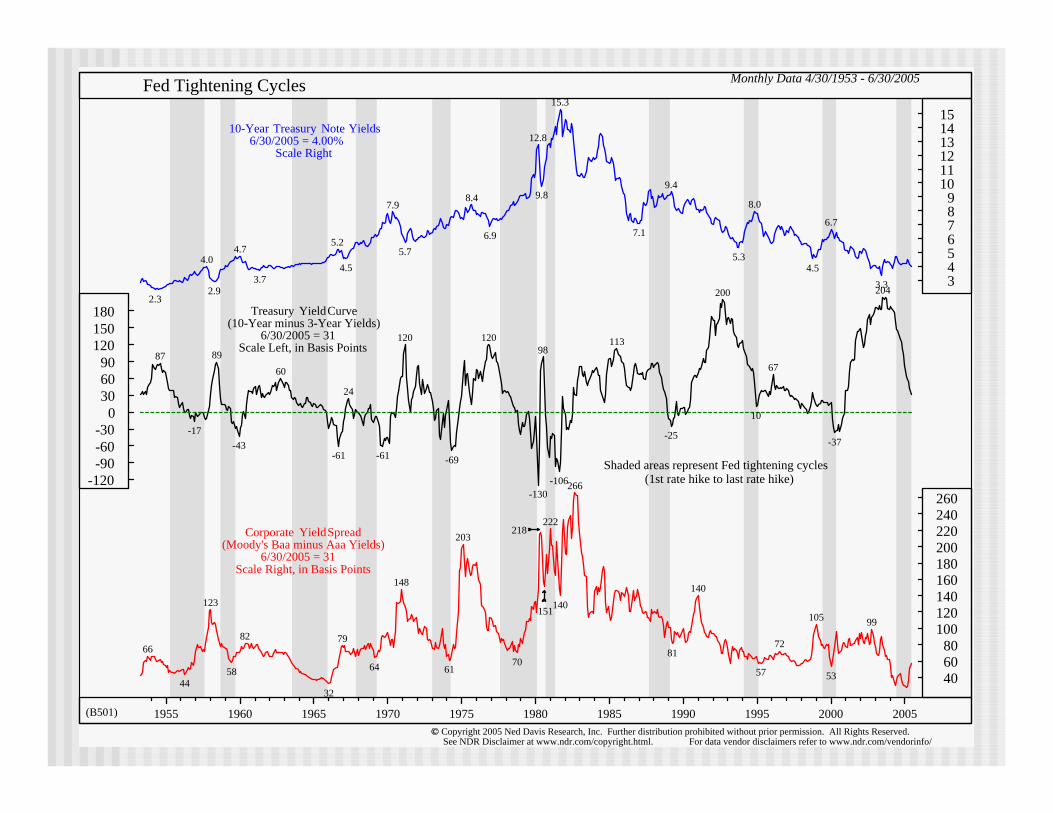
BeforeMonthly Data 4/30/1953 - 6/30/2005
(B501)
10-Year Treasury Note Yields6/30/2005 = 4.00%
Scale Right
4.0 4.7
5.2
7.9 8.4
12.8
15.3
9.4
8.0
6.7
2.3 2.9
3.7 4.5
5.7 6.9
9.8
7.1
5.3 4.5
3.3 3 4 5 6 7 8 9
101112131415
Treasury Yield Curve (10-Year minus 3-Year Yields)
6/30/2005 = 31Scale Left, in Basis Points
Shaded areas represent Fed tightening cycles(1st rate hike to last rate hike)
87 8960
24
120 120 98
113
200
67
204
10-17
-43 -61 -61 -69
-130-106
-25 -37
-120-90 -60 -30
0 306090
120 150 180
Corporate Yield Spread(Moody's Baa minus Aaa Yields)
6/30/2005 = 31Scale Right, in Basis Points
66
123
82 79
148
203 222
266
140
72
105 99
218
4458
32
64 6170
140
81
57 53
151
406080
100 120 140 160 180 200 220 240 260
1955 1960 1965 1970 1975 1980 1985 1990 1995 2000 2005
Fed Tightening Cycles
Copyright 2005 Ned Davis Research, Inc. Further distribution prohibited without prior permission. All Rights Reserved.See NDR Disclaimer at www.ndr.com/copyright.html For data vendor disclaimers refer to www.ndr.com/vendorinfo

Before

Before
Minnetrista CorporationProposed Slate of Directors
Frank E. Ball Joan F. Woods Robert B. Ball C. Robert HeatonCharles F. Ball R. Michael Miner
James A. Fisher D. Neil RadeyChristopher Stack
James B. Goodbody, Jr. Paul L. Sehnert, Jr.
Elizabeth M. Zimmerman

Before
Before
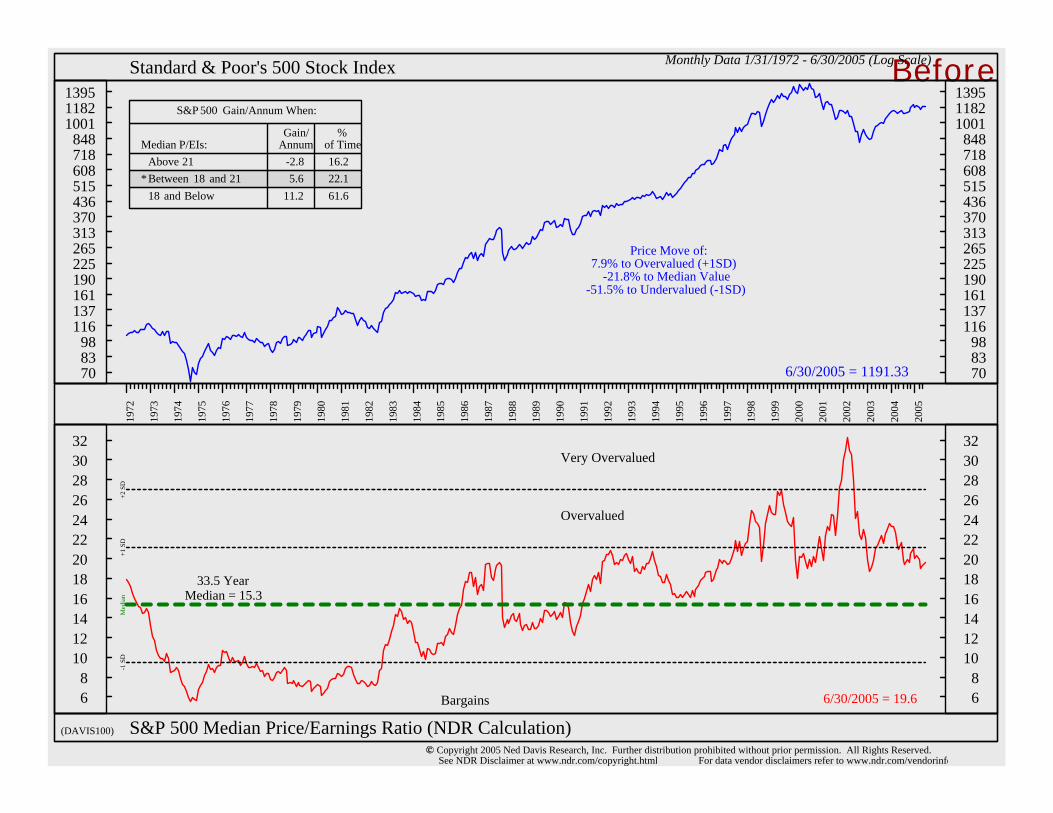
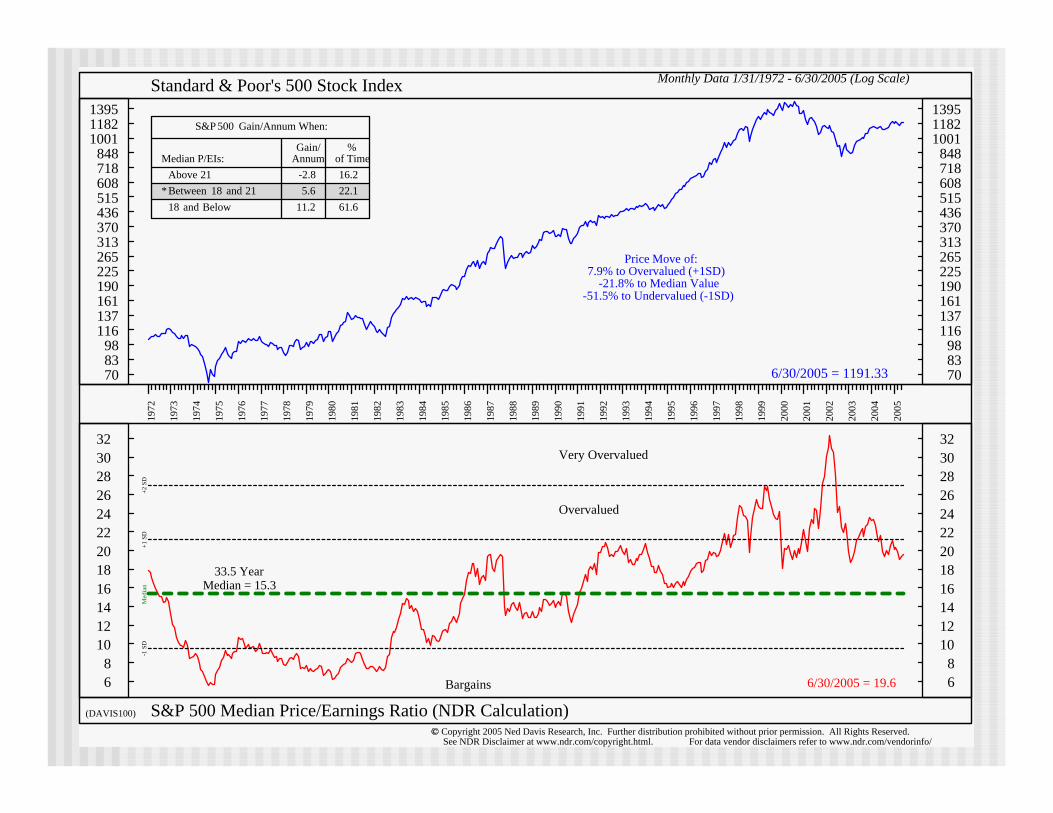
(DAVIS100)
Monthly Data 1/31/1972 - 6/30/2005 (Log Scale)
Price Move of: 7.9% to Overvalued (+1SD)
-21.8% to Median Value-51.5% to Undervalued (-1SD)
S&P 500 Gain/Annum When:
Gain/ % Median P/EIs: Annum of Time
Above 21 -2.8 16.2* Between 18 and 21 5.6 22.1
18 and Below 11.2 61.6
6/30/2005 = 1191.33 708398
116 137 161 190 225 265 313 370 436 515 608 718 848
100111821395
708398
116 137 161 190 225 265 313 370 436 515 608 718 848
100111821395
6/30/2005 = 19.6
Very Overvalued
Overvalued
Bargains
33.5 Year Median = 15.3
Med
ian
+1 S
D
+2 S
D
-1 S
D
6 8
101214161820222426283032
6 8
101214161820222426283032
1972
1973
1974
1975
1976
1977
1978
1979
1980
1981
1982
1983
1984
1985
1986
1987
1988
1989
1990
1991
1992
1993
1994
1995
1996
1997
1998
1999
2000
2001
2002
2003
2004
2005
Standard & Poor's 500 Stock Index
S&P 500 Median Price/Earnings Ratio (NDR Calculation) Copyright 2005 Ned Davis Research, Inc. Further distribution prohibited without prior permission. All Rights Reserved.See NDR Disclaimer at www.ndr.com/copyright.html For data vendor disclaimers refer to www.ndr.com/vendorinfo

After
Minnetrista Corporation
July 16, 2005

After
Growth EquitiesBondsMoney MarketValue EquitiesSmall CapInternationalReal EstateEmerging Market
TargetCurrent
41.0%2.6%5.1%
18.3%14.4%10.1%5.5%3.0%
44%5%1%
18%14%10%5%3%
Portfolio Composition

After
Portfolio 12 Month 12 MonthClass Benchmark Allocation Return Benchmark
Money Mkts and Equivalents 90-Day US Treasury Bill 5.1% 1.7% 2.2%
Taxable Bonds Lehman Bros Aggregate Bond Index 2.6% 3.5% 4.8%
Real Estate Equities NAREIT Equity REIT Index 5.5% 33.9% 32.6%
US Equities Standard and Poors 500 Stock Index 41.0% 6.3% 6.3%
Large Cap Value Russell 1000 Value Index 18.3% 12.8% 14.0%
Small Cap Equities Russell 2000 Index 14.4% 16.1% 9.5%
International Equities MSCI EAFE Gross Index 10.1% 12.9% 14.1%Emerging Market Equities SandP/IFC Investable Composite Index 3.0% 36.3% 34.9%
Total 100% 11.6% 11.0%
(thru 6/30/05)
Investment Performance (last 12 months)
After
Portfolio Inception InceptionClass Benchmark Allocation Return Benchmark
Money Mkts and Equivalents 90-Day US Treasury Bill 5.1% 1.5% 1.6%
Municipal Bonds Lehman Bros 3 Yr Muni Index 0.0% 1.4% 1.1%
Taxable Bonds Lehman Bros Aggregate Bond Index 2.6% 5.1% 5.8%
Real Estate Equities NAREIT Equity REIT Index 5.5% 19.5% 19.4%
US Equities Standard and Poors 500 Stock Index 41.0% 2.8% 1.0%
Large Cap Value Russell 1000 Value Index 18.3% 7.0% 5.6%
Mid Cap Equities Russell Small Cap Completeness Index 0.0% -12.1% -17.6%
Small Cap Equities Russell 2000 Index 14.4% 13.5% 9.9%
International Equities MSCI EAFE Gross Index 10.1% 6.2% 6.6%Emerging Market Equities SandP/IFC Investable Composite Index 3.0% 19.4% 18.2%
Total 100% 6.3% 5.3%
(thru 6/30/05)
Investment Performance
After
$10,000
$20,000
$30,000
$40,000
$50,000
$60,000
$70,000
$80,000
Jul-0
1Ja
n-02
Jul-0
2Ja
n-03
Jul-0
3Ja
n-04
Jul-0
4Ja
n-05
Jul-0
5Ja
n-06
Jul-0
6Ja
n-07
Jul-0
7Ja
n-08
Jul-0
8Ja
n-09
Jul-0
9Ja
n-10
Jul-1
0Ja
n-11
Model ProjectionActualIndex Adjusted
Model Projection $52,500 $55,053 $56,747 $58,509 $60,346 $62,275 $64,307 $66,457 $68,738 $71,166 $73,755Actual $51,281 $47,126 $42,796 $49,550 $53,174Index Adjusted $51,281 $44,080 $41,567 $48,330 $50,589
Jul-01 Jul-02 Jul-03 Jul-04 May-05 May-06 May-07 May-08 May-09 May-10 May-11
(000's)
Minnetrista Corporation ProjectionModel vs. ActualAdjusted for disbursements
After
The Benefits of Diversification
19881989199019911992199319941995199619971998199920002001200220032004
24.8916.24
-19.5146.0518.4118.91-1.8228.4416.4922.36-2.5521.26-3.022.49
-20.4947.2518.32
7.8914.538.96
16.007.409.75
-2.9218.473.639.658.69
-0.8211.638.44
10.264.104.34
28.5910.80
-23.2012.50
-11.8532.948.06
11.556.362.06
20.3327.30
-13.96-21.21-15.6639.1720.69
13.478.84
-15.3435.5414.5219.673.17
15.2535.2620.29
-17.51-4.6226.3513.933.81
37.1431.57
ANNUAL PERFORMANCE
Year Large Cap Small Cap Bonds International Real Estate
16.5031.43-3.1930.557.68
10.001.33
37.5023.2533.3828.7621.14-9.19
-11.87-22.1028.7110.87
Source: Individual asset classes represented by the following indices: Large Cap = S&P 500; Small Cap =; Russell 2000®; Bonds = Lehman Aggregate Bond Index; International = MSCI EAFE; Real Estate Equity = NAREIT Equity Index.

After
Portfolio Return/Payments
After
Since Inception Total Return, 7/01 – 5/05 $10,751,000 (6.1% compound annual)
Less: Dividends -5,223,000Administrative Expenses -2,409,000Tax Distributions -730,000
Net Retained Value $2,389,000
Portfolio Return/Payments

After
Market Outlook
After
Federal Reserve Policy
After
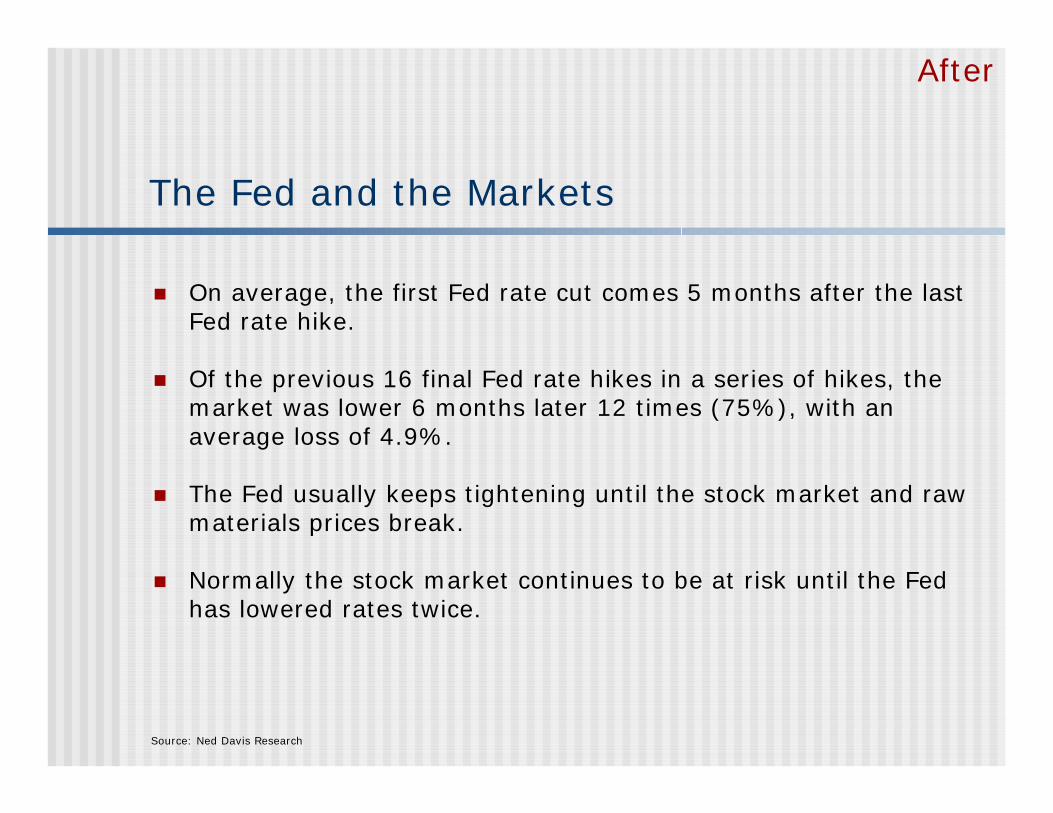
The Fed and the Markets
On average, the first Fed rate cut comes 5 months after the lastFed rate hike.
Of the previous 16 final Fed rate hikes in a series of hikes, the market was lower 6 months later 12 times (75%), with an average loss of 4.9%.
The Fed usually keeps tightening until the stock market and raw materials prices break.
Normally the stock market continues to be at risk until the Fed has lowered rates twice.
Source: Ned Davis Research
After
Federal Reserve Policy
Consumer Posture

(S1060A)
Monthly Data 2/28/1967 - 6/30/2005 (Log Scale)
Oct 1968 Dec 1972
Sep 1987Feb 1989
Jun 1998
Jan 2000
Dec 1974
May 1980Oct 1982
Jan 1991Feb 1992
Mar 2003
DJIA Gain/Annum When: (2/28/1969 - 6/30/2005)
Consumer Gain/ % Confidence is: Annum of Time
Above 113 0.2 20.8* Between 66 and 113 5.8 67.5
66 and Below 27.3 11.7
6/30/2005 = 10275.0 456 552 668 808 978
118414341735210125433078372645105460660980009684
11723 14191
456 552 668 808 978
118414341735210125433078372645105460660980009684
11723 14191
Extreme Optimism = Bearish for Stocks
Extreme Pessimism = Bullish for Stocks 6/30/2005 = 105.8 404550556065707580859095
100 105 110 115 120 125 130 135 140 145
404550556065707580859095
100 105 110 115 120 125 130 135 140 145
Dow Jones Industrial Average
Consumer Confidence (Conference Board)
1970 1975 1980 1985 1990 1995 2000 2005
Copyright 2005 Ned Davis Research, Inc. Further distribution prohibited without prior permission. All Rights Reserved.See NDR Disclaimer at www.ndr.com/copyright.html. For data vendor disclaimers refer to www.ndr.com/vendorinfo/
After
Federal Reserve Policy
Consumer Posture
Interest Rates
(B151)
Daily Data 1/02/1979 - 7/05/2005
%
7/05/2005 = 4.11% 13.65
15.84
13.99
10.23
9.09
8.05
7.066.79
5.44
4.614.89
8.76
9.47
10.12
6.95
7.74
5.195.53
4.16 4.22
3.13
3.703.89
3.2 3.6 4.0 4.4 4.8 5.2 5.6 6.0 6.4 6.8 7.2 7.6 8.0 8.4 8.8 9.2 9.6
10.010.410.811.211.612.012.412.813.213.614.014.414.815.215.6
3.2 3.6 4.0 4.4 4.8 5.2 5.6 6.0 6.4 6.8 7.2 7.6 8.0 8.4 8.8 9.2 9.6
10.010.410.811.211.612.012.412.813.213.614.014.414.815.215.6
1983
1988
1993
1998
2003
10-Year Constant Maturity Treasury Note Yields
Copyright 2005 Ned Davis Research, Inc. Further distribution prohibited without prior permission. All Rights Reserved.See NDR Disclaimer at www.ndr.com/copyright.html. For data vendor disclaimers refer to www.ndr.com/vendorinfo/
Monthly Data 4/30/1953 - 6/30/2005
(B501)
10-Year Treasury Note Yields6/30/2005 = 4.00%
Scale Right
4.0 4.7
5.2
7.9 8.4
12.8
15.3
9.4
8.0
6.7
2.3 2.9
3.7 4.5
5.7 6.9
9.8
7.1
5.3 4.5
3.3 3 4 5 6 7 8 9
101112131415
Treasury Yield Curve (10-Year minus 3-Year Yields)
6/30/2005 = 31Scale Left, in Basis Points
Shaded areas represent Fed tightening cycles(1st rate hike to last rate hike)
87 8960
24
120 120 98
113
200
67
204
10-17
-43 -61 -61 -69
-130-106
-25 -37
-120-90 -60 -30
0 306090
120 150 180
Corporate Yield Spread(Moody's Baa minus Aaa Yields)
6/30/2005 = 31Scale Right, in Basis Points
66
123
82 79
148
203 222
266
140
72
105 99
218
4458
32
64 6170
140
81
57 53
151
406080
100 120 140 160 180 200 220 240 260
1955 1960 1965 1970 1975 1980 1985 1990 1995 2000 2005
Fed Tightening Cycles
Copyright 2005 Ned Davis Research, Inc. Further distribution prohibited without prior permission. All Rights Reserved.See NDR Disclaimer at www.ndr.com/copyright.html. For data vendor disclaimers refer to www.ndr.com/vendorinfo/

After

After
Minnetrista CorporationProposed Slate of Directors
Frank E. BallRobert B. BallCharles F. BallJames A. Fisher Christopher StackJames B. Goodbody, Jr.Paul L. Sehnert, Jr.Elizabeth M. Zimmerman
Joan F. WoodsC. Robert HeatonR. Michael MinerD. Neil Radey
After
(DAVIS100)
Monthly Data 1/31/1972 - 6/30/2005 (Log Scale)
Price Move of: 7.9% to Overvalued (+1SD)
-21.8% to Median Value-51.5% to Undervalued (-1SD)
S&P 500 Gain/Annum When:
Gain/ % Median P/EIs: Annum of Time
Above 21 -2.8 16.2* Between 18 and 21 5.6 22.1
18 and Below 11.2 61.6
6/30/2005 = 1191.33 708398
116 137 161 190 225 265 313 370 436 515 608 718 848
100111821395
708398
116 137 161 190 225 265 313 370 436 515 608 718 848
100111821395
6/30/2005 = 19.6
Very Overvalued
Overvalued
Bargains
33.5 Year Median = 15.3
Med
ian
+1 S
D
+2 S
D
-1 S
D
6 8
101214161820222426283032
6 8
101214161820222426283032
1972
1973
1974
1975
1976
1977
1978
1979
1980
1981
1982
1983
1984
1985
1986
1987
1988
1989
1990
1991
1992
1993
1994
1995
1996
1997
1998
1999
2000
2001
2002
2003
2004
2005
Standard & Poor's 500 Stock Index
S&P 500 Median Price/Earnings Ratio (NDR Calculation) Copyright 2005 Ned Davis Research, Inc. Further distribution prohibited without prior permission. All Rights Reserved.See NDR Disclaimer at www.ndr.com/copyright.html. For data vendor disclaimers refer to www.ndr.com/vendorinfo/
After
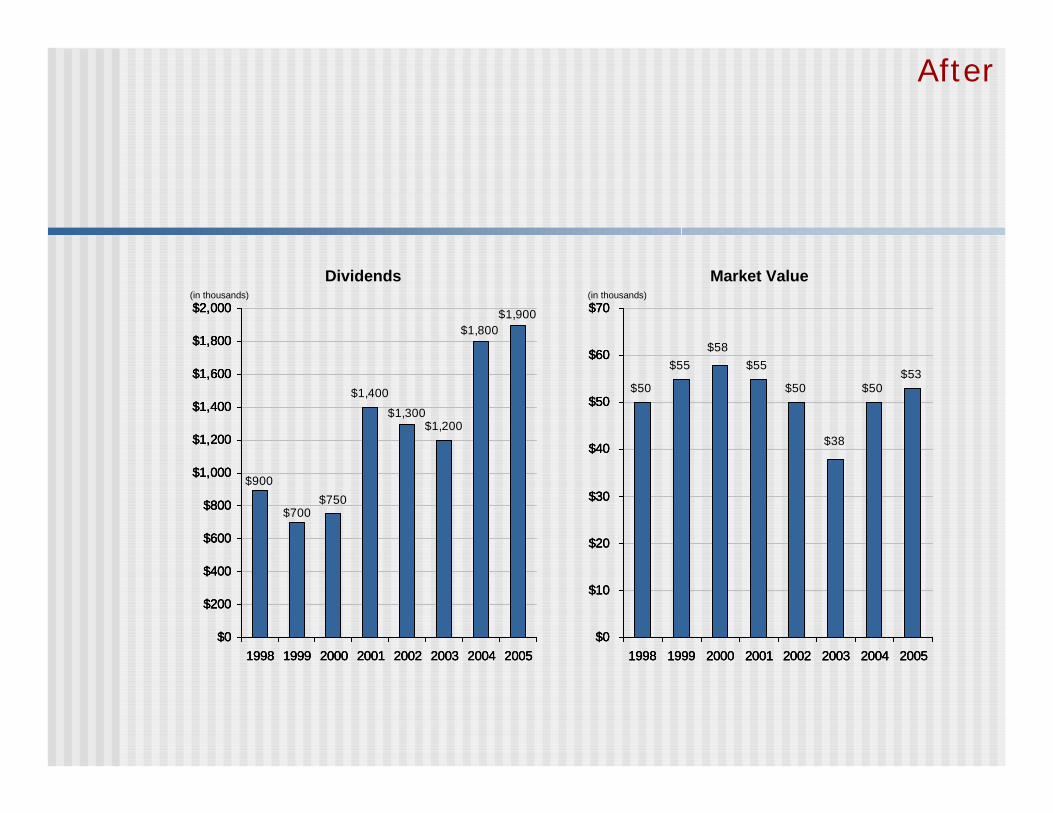
$50
$0
$10
$20
$30
$40
$50
$60
$70
1998 1999 2000 2001 2002 2003 2004 2005
$900
$0
$200
$400
$600
$800
$1,000
$1,200
$1,400
$1,600
$1,800
$2,000
1998 1999 2000 2001 2002 2003 2004 2005
$1,800$1,900
$0
$200
$400
$600
$800
$1,000
$1,200
$1,400
$1,600
$1,800
$2,000
1998 1999 2000 2001 2002 2003 2004 2005
$50$53
$0
$10
$20
$30
$40
$50
$60
$70
1998 1999 2000 2001 2002 2003 2004 2005
$55 $55
$50
$38
$58
$0
$10
$20
$30
$40
$50
$60
$70
1998 1999 2000 2001 2002 2003 2004 2005
$750
$1,400
$1,200$1,300
$700
$0
$200
$400
$600
$800
$1,000
$1,200
$1,400
$1,600
$1,800
$2,000
1998 1999 2000 2001 2002 2003 2004 2005
(in thousands) (in thousands)
Market ValueDividends


![[PPT]Computing Power (in Apollo Control Computer Units)evans/talks/dependable551-f03.ppt · Web viewOpenSSH SSH client before 2.3.0 does not properly disable X11 or agent forwarding,](https://img.dokumen.tips/doc/110x75/5aeaf7777f8b9ae5318d2173/pptcomputing-power-in-apollo-control-computer-units-evanstalksdependable551-f03pptweb.jpg)