Embed Size (px)
DESCRIPTION
Tuning your EC2 web server will help you to improve application server throughput and cost-efficiency as well as reduce request latency. In this session we will walk through tactics to identify bottlenecks using tools such as CloudWatch in order to drive the appropriate allocation of EC2 and EBS resources. In addition, we will also be reviewing some performance optimizations and best practices for popular web servers such as Nginx and Apache in order to take advantage of the latest EC2 capabilities.
Citation preview


HTTP
• Optimize the web server stack


• Remember: optimizations by definition are
app-specific


CloudWatch
0
1
2
3
4
5
10
:00
10
:01
10
:02
10
:03
10
:04
10
:05
10
:06
10
:07
10
:08
10
:09
10
:10
10
:11
10
:12
10
:13
10
:14
10
:15
Average request size
Average request size
Filters


0
50
100
150
200
250
1 6 111621263136414651566166717681869196
Latency at percentile Average Latency
0
200
400
600
800
1000
1200
1400
1600
1800
2000
6 9
12
15
18
21
24
27
30
33
36
39
42
45
48
55
20
4
20
7
21
0
Latency histogram
Frequency

0
5
10
15
20
25
Category 1
Chart Title
response_processing_time
request_processing_time
backend_processing_time

0
5
10
15
20
25
Average latency by type
GET POST
2.85
2.9
2.95
3
3.05
3.1
3.15
3.2
3.25
Average latency
Total


• Whatever makes most sense to you!


Justin Lintz

Who am I?• Senior Web Operations Engineer at Chartbeat
• Previously worked at
– Bitly
– TheStreet.com
– Corsis
@lintzston [email protected]

Chartbeat measures and monetizes attention on the web. Working with 80% of
the top US news sites and global media sites in 50 countries, Chartbeat brings
together editors and advertisers to identify in real time the active time an
audience consumes articles, videos, paid content, and display advertising.

http://chartbeat.com/publishing/demo

• 400–500 servers
• Peak traffic: 275,000 requests/second
• 11–12 million concurrent users across all
sites in our network

Traffic characteristicsEvery 15 seconds
213 byte request + headers
43 byte, response size

Logs

Logging not “free”Sequential writes are fast
Logs grow and then...

What do you do with them?• Rotate
• Compress
• Ship them elsewhere?
All impact latency of your requests!
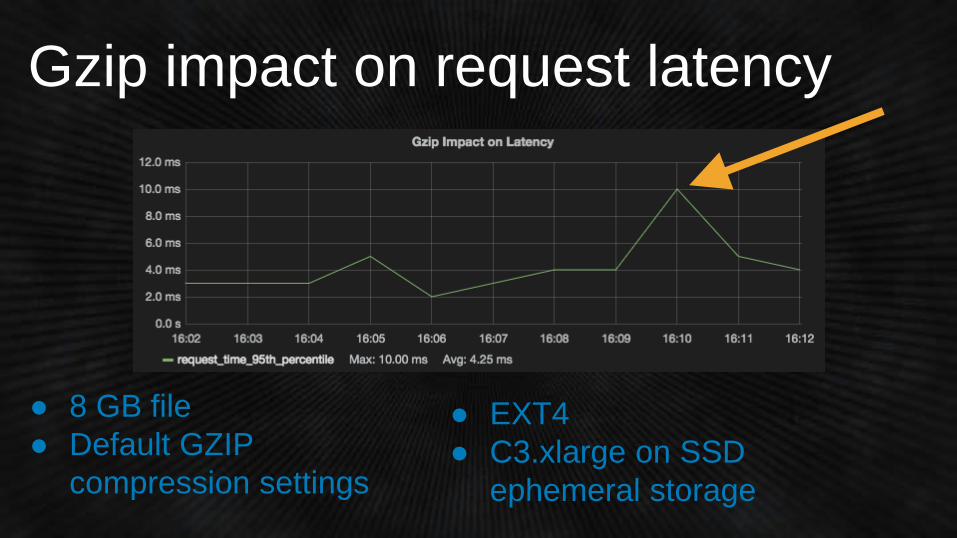
Gzip impact on request latency
● 8 GB file
● Default GZIP
compression settings
● EXT4
● C3.xlarge on SSD
ephemeral storage

Simple tweaks

Hourly rotate• Logrotate doesn’t support out of box
0 * * * * /usr/sbin/logrotate -f /etc/logrotate.d/nginx >
/dev/null 2>&1
Goal: smaller latency spikes spread throughout day

Avoid compression• But if you must, use
– LZ4
– LZO
– Snappy
Order of magnitude faster than gzip or bzip2,
fraction of the CPU

Extent-based file system
EXT4 or XFS

SSD• GP2 Amazon EBS volumes
• New generation Amazon EC2 instance types
– C3
– M3
– R3
– I2

More involved tweaks

Stream logs via Syslog• Max 1 KB line length per RFC3164
• Only supported in Nginx 1.7.1+• Apache supported via CustomLog piping to logger

Only log at load balancer• Only one side of picture
• Can’t log custom headers or format logs
• Logs are delayed

Pull node on rotate• Using prerotate/postrotate in logrotate
– Pull node from ELB via API and place back on
completion
• Requires staggering nodes
• Probably not worth the effort?

Sysctl tweaks

Listen queue backlog
net.core.somaxconn = 128
Apache: ListenBackLog 511
Nginx: listen backlog=511
should be larger

man listen(2)
If the backlog argument is greater than the value in
/proc/sys/net/core/somaxconn, then it is silently
truncated to that value; the default value in this file is
128. In kernels before 2.4.25, this limit was a hard-
coded value, SOMAXCONN, with the value 128.


Additional TCP backlog• net.core.netdev_max_backlog = 1000
– Per CPU backlog
– Network frames
• net.ipv4.tcp_max_syn_backlog = 128
• Half-open connections

Initial congestion window
TCP congestion window - initcwnd (initial)
Starting in Kernel 2.6.39, set to 10
Previous default was 3!http://research.google.com/pubs/pub36640.html
Older Kernel? $ ip route change default via 192.168.1.1 dev eth0 proto static initcwnd 10

net.ipv4.tcp_slow_start_after_idle
• Set to 0 to ensure connections don’t go back to
default TCP window size after being idle too long
Example: HTTP KeepAlive

TIME_WAIT sockets
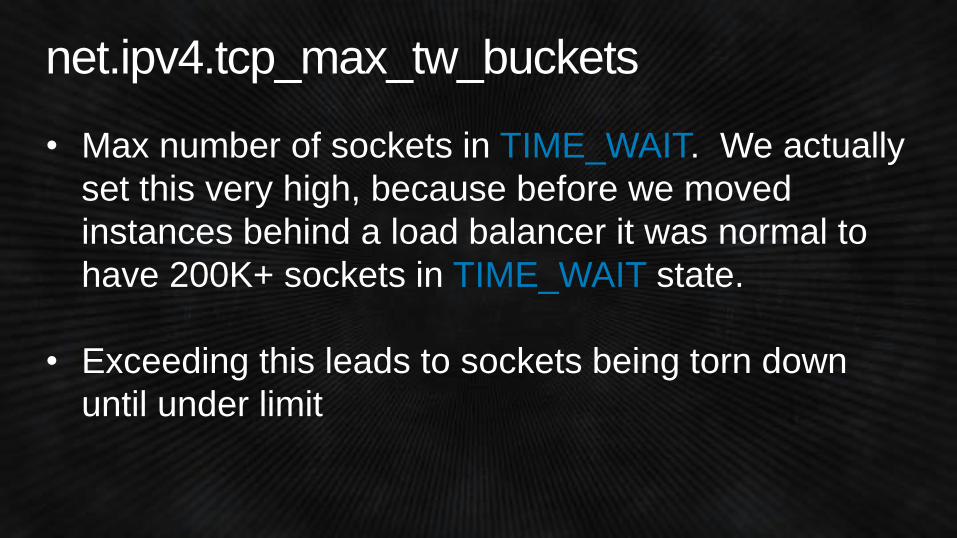
net.ipv4.tcp_max_tw_buckets
• Max number of sockets in TIME_WAIT. We actually
set this very high, because before we moved
instances behind a load balancer it was normal to
have 200K+ sockets in TIME_WAIT state.
• Exceeding this leads to sockets being torn down
until under limit

net.ipv4.tcp_fin_timeout• The time a connection should spend in FIN_WAIT_2
state. Default is 60 seconds, lowering this will free
memory more quickly and transition the socket to
TIME_WAIT.
• This will NOT reduce the time a socket is in
TIME_WAIT which is set to 2 * MSL (max segment
lifetime).

net.ipv4.tcp_fin_timeout continued...
MSL is hardcoded in the kernel at 60 seconds!
https://github.com/torvalds/linux/blob/master/include/
net/tcp.h#L115
#define TCP_TIMEWAIT_LEN (60*HZ) /* how long to wait to destroy TIME-WAIT
* state, about 60 seconds */

“If it is on the Internet then it
must be true, and you can’t
question it”
—Abraham Lincoln

net.ipv4.tcp_tw_recycle DANGEROUS
• Clients behind NAT/stateful FW will get
dropped
• *99.99999999% of time should never be
enabled
* Probably 100%, but there may be a valid case out there


net.ipv4.tcp_tw_reuse
Makes a safer attempt at freeing sockets in
TIME_WAIT state

Recycle vs. reuse deep dive
http://bit.ly/tcp-time-wait
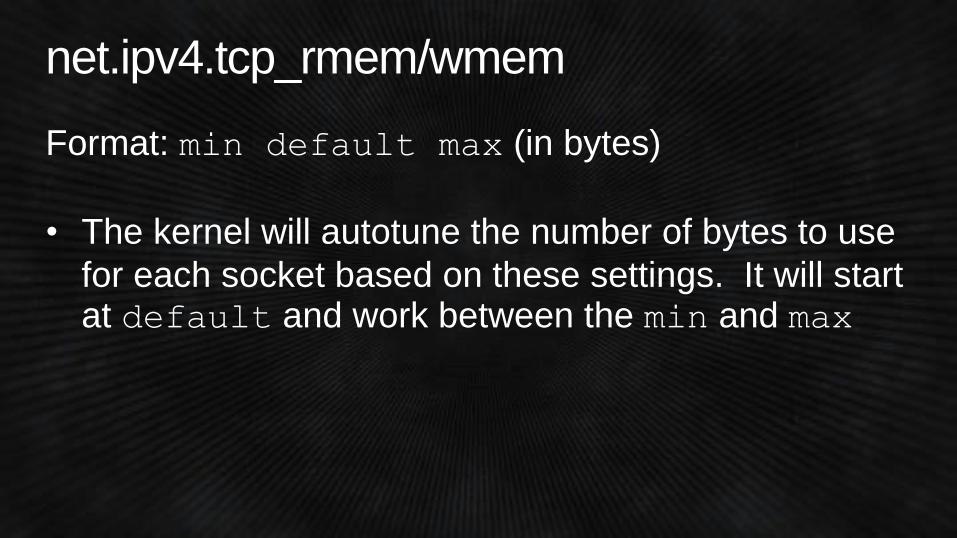
net.ipv4.tcp_rmem/wmem
Format: min default max (in bytes)
• The kernel will autotune the number of bytes to use
for each socket based on these settings. It will start at default and work between the min and max

net.ipv4.tcp_mem
Format: low pressure max (in pages!)
• Below low, Kernel won’t put pressure on sockets to
reduce mem usage. When pressure hits, sockets
reduce memory until low is hit. If max hits, no new
sockets.
Additional readings
https://www.kernel.org/doc/Documentation/networking/ip-sysctl.txt
man tcp(7)

Nginx/Apache

listen backlogApache: ListenBackLog 511
Nginx: listen backlog=511
– limited by net.core.somaxconn

tcp_defer_acceptApache: AcceptFilter http data
AcceptFilter https data
Nginx: listen [deferred]
– Wait till we receive data packet before passing
socket to server. Completing TCP handshake won’t trigger an accept()

sendfileApache: EnableSendfile off
Nginx: sendfile off
– Saves context switching from userspace on
read/write
– “zero copy”; happens in kernel space

tcp_corkApache: Enabled w/ sendfile
Nginx: tcp_nopush off
– aka TCP_CORK sockopt
– allows application to control building of packet;
e.g., pack a packet with full HTTP response
– Only works with sendfile

tcp_nodelay (Nagle’s algo)Apache: On
• No ability to turn off
Nginx: tcp_nodelay on
• Only affects keep-alive connections
• Will add latency if turned off in favor of bandwidth

HTTP Keep-Alive Apache: KeepAlive On
KeepAliveTimeout 5
MaxKeepAliveRequests 100
Nginx: keepalive_timeout 75s
keepalive_requests 100
Note: If using ELB you must match the timeout to the
the ELB timeout setting

HTTP Keep-Alive• Also enable on upstream proxies
– Available since Nginx 1.1.4 proxy_http_version 1.1;
proxy_set_header Connection "";
upstream foo {
server 10.1.1.1;
keepalive 1024;
}

HTTP Keep-Alive


everything
your
quantifiable
continuously

Please give us your feedback on this session.
Complete session evaluations and earn re:Invent swag.
http://bit.ly/awsevals