Embed Size (px)
Citation preview

VERIZON -CASEANALYSIS
by Carlos BardalesUNIVERSITY OF TAMPA
John H. Sykes College of BusinessFALL 2016 / MGT615 – F
Prof. Dr. Thomas Pittz

External Analysis
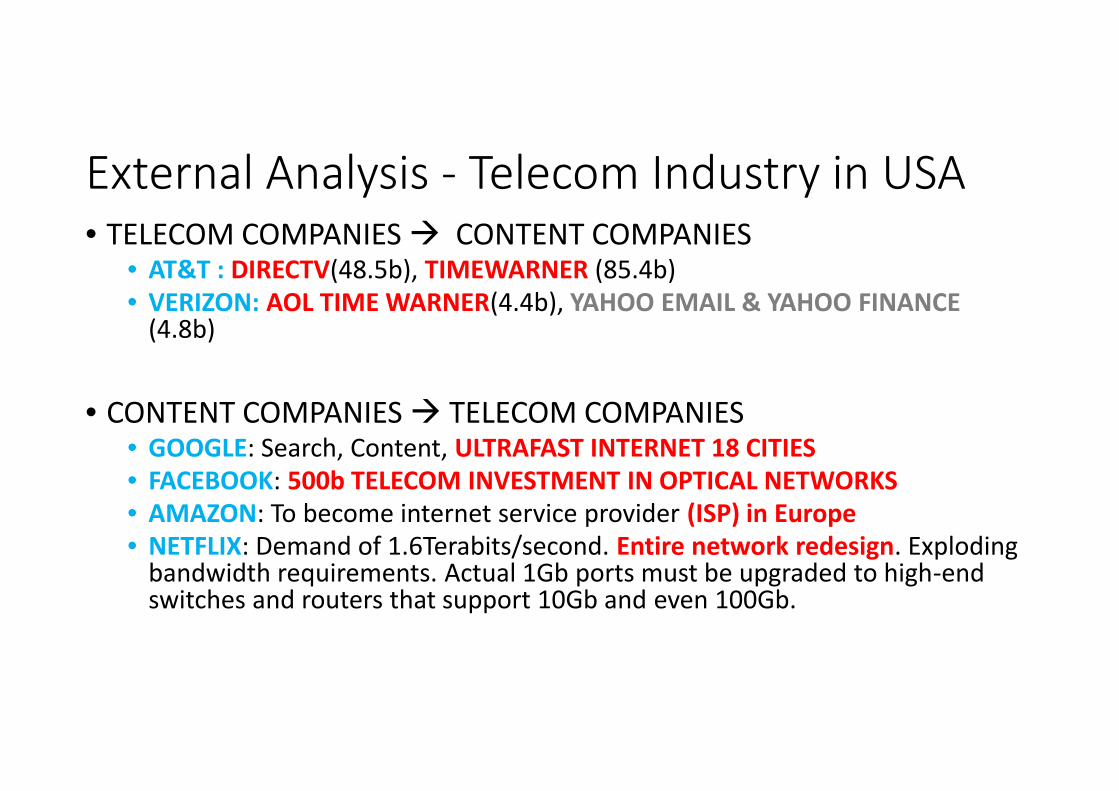
External Analysis - Telecom Industry in USA• TELECOM COMPANIES CONTENT COMPANIES
• AT&T : DIRECTV(48.5b), TIMEWARNER (85.4b)• VERIZON: AOL TIME WARNER(4.4b), YAHOO EMAIL & YAHOO FINANCE
(4.8b)
• CONTENT COMPANIES TELECOM COMPANIES• GOOGLE: Search, Content, ULTRAFAST INTERNET 18 CITIES• FACEBOOK: 500b TELECOM INVESTMENT IN OPTICAL NETWORKS• AMAZON: To become internet service provider (ISP) in Europe• NETFLIX: Demand of 1.6Terabits/second. Entire network redesign. Exploding
bandwidth requirements. Actual 1Gb ports must be upgraded to high-endswitches and routers that support 10Gb and even 100Gb.
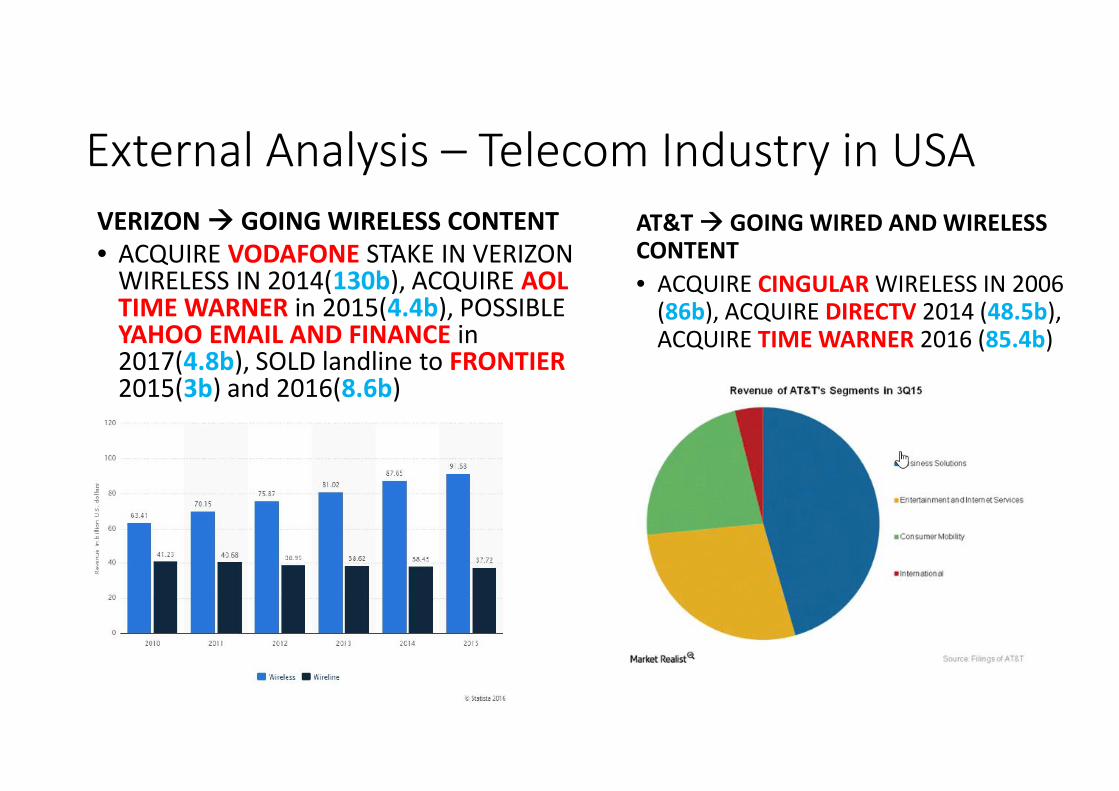
External Analysis – Telecom Industry in USAVERIZON GOING WIRELESS CONTENT• ACQUIRE VODAFONE STAKE IN VERIZON
WIRELESS IN 2014(130b), ACQUIRE AOLTIME WARNER in 2015(4.4b), POSSIBLEYAHOO EMAIL AND FINANCE in2017(4.8b), SOLD landline to FRONTIER2015(3b) and 2016(8.6b)
AT&T GOING WIRED AND WIRELESSCONTENT• ACQUIRE CINGULAR WIRELESS IN 2006
(86b), ACQUIRE DIRECTV 2014 (48.5b),ACQUIRE TIME WARNER 2016 (85.4b)


Trends in Telecom


ECONOMIC CHARACTERISTICS
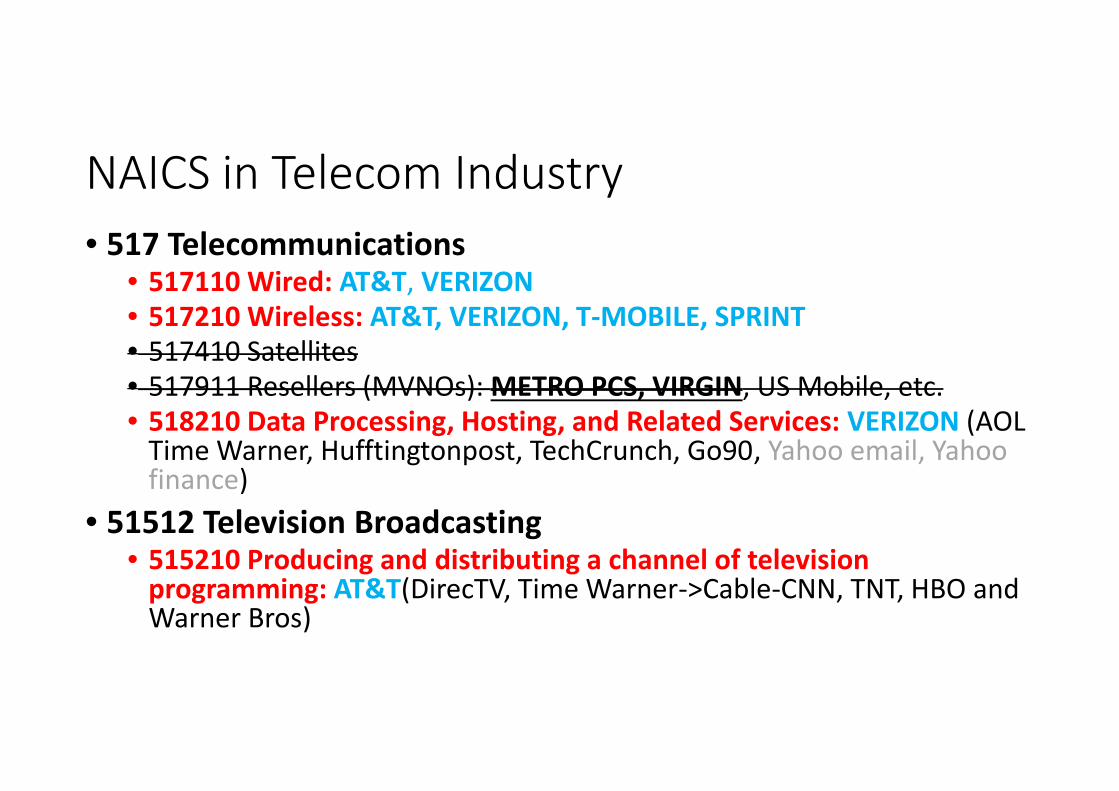
NAICS in Telecom Industry• 517 Telecommunications
• 517110 Wired: AT&T, VERIZON• 517210 Wireless: AT&T, VERIZON, T-MOBILE, SPRINT• 517410 Satellites• 517911 Resellers (MVNOs): METRO PCS, VIRGIN, US Mobile, etc.• 518210 Data Processing, Hosting, and Related Services: VERIZON (AOL
Time Warner, Hufftingtonpost, TechCrunch, Go90, Yahoo email, Yahoofinance)
• 51512 Television Broadcasting• 515210 Producing and distributing a channel of television
programming: AT&T(DirecTV, Time Warner->Cable-CNN, TNT, HBO andWarner Bros)
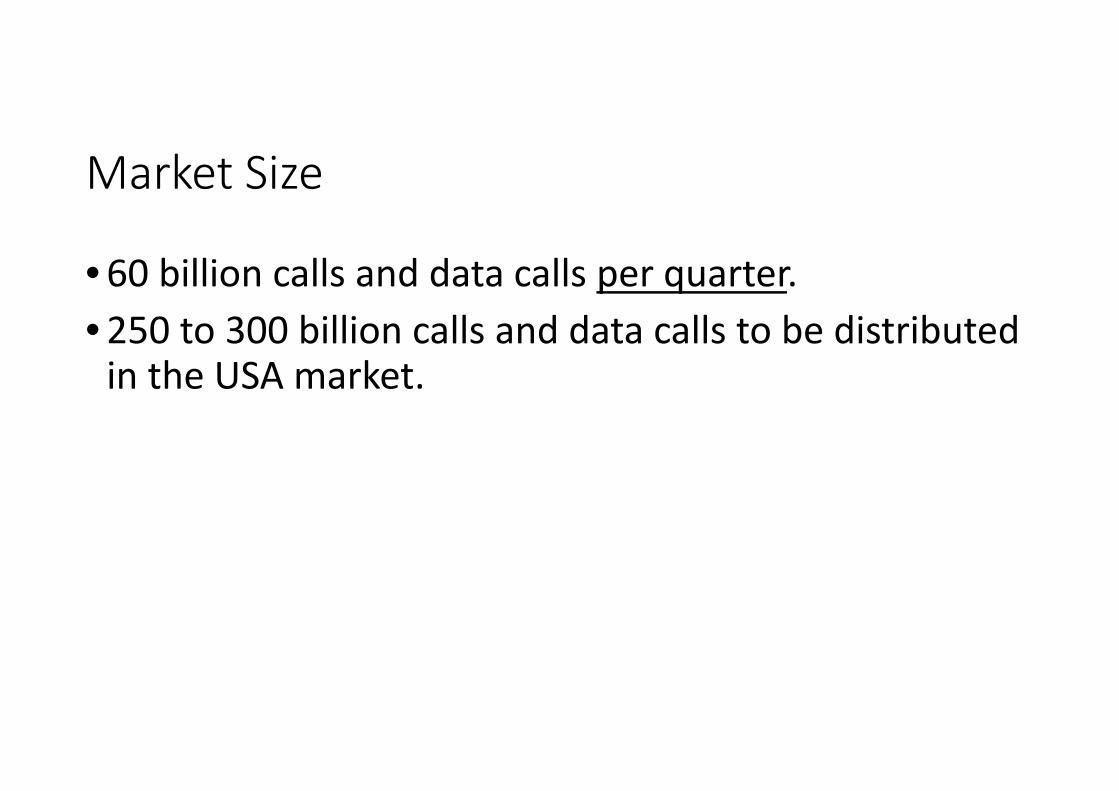
Market Size
• 60 billion calls and data calls per quarter.• 250 to 300 billion calls and data calls to be distributed
in the USA market.
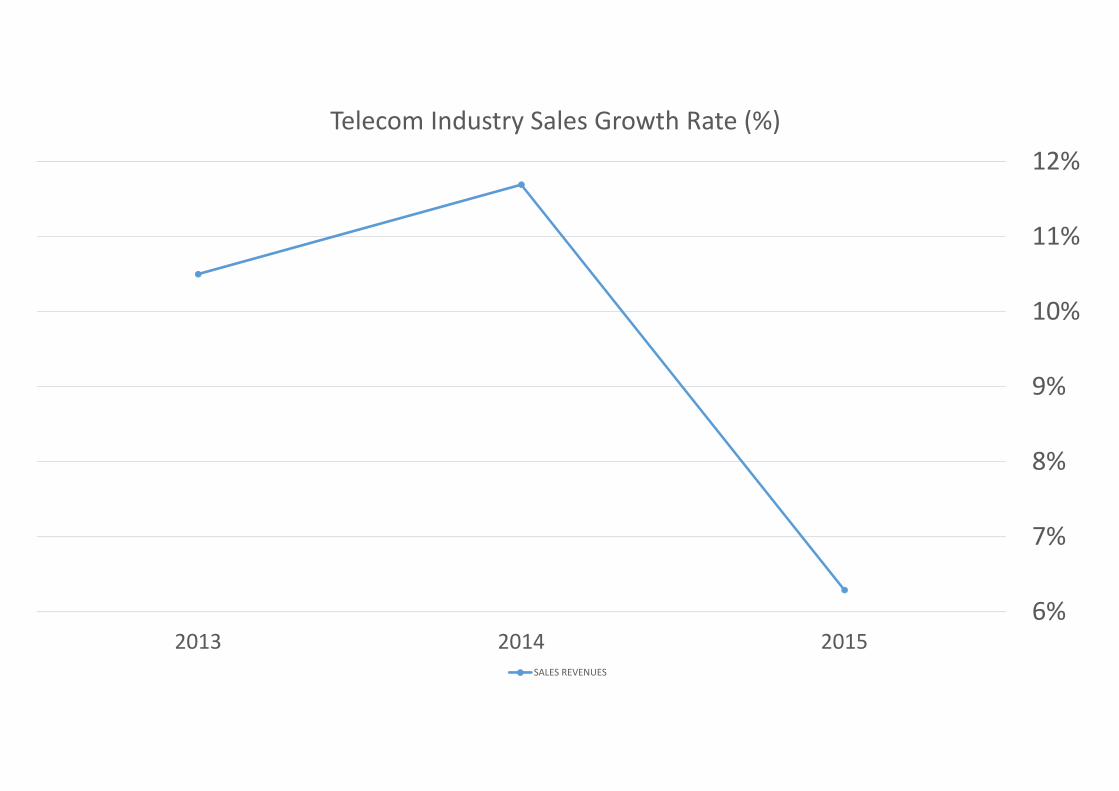
6%
7%
8%
9%
10%
11%
12%
201520142013
Telecom Industry Sales Growth Rate (%)
SALES REVENUES
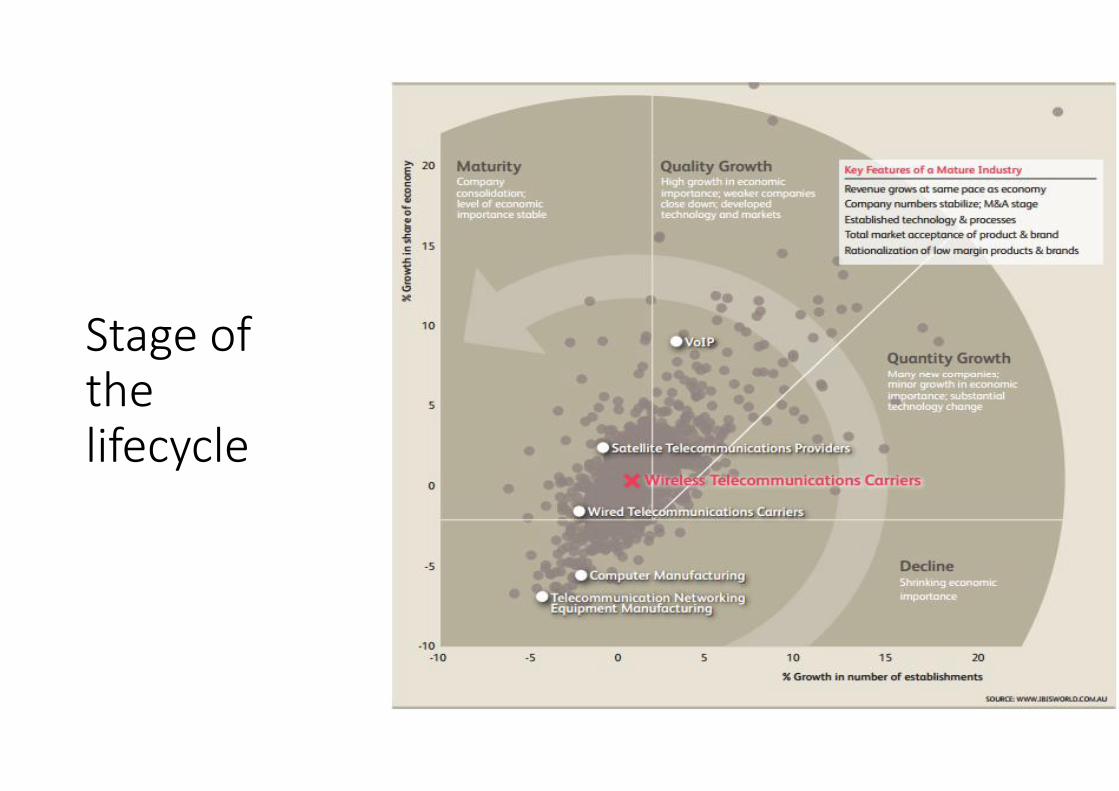
Stage ofthelifecycle
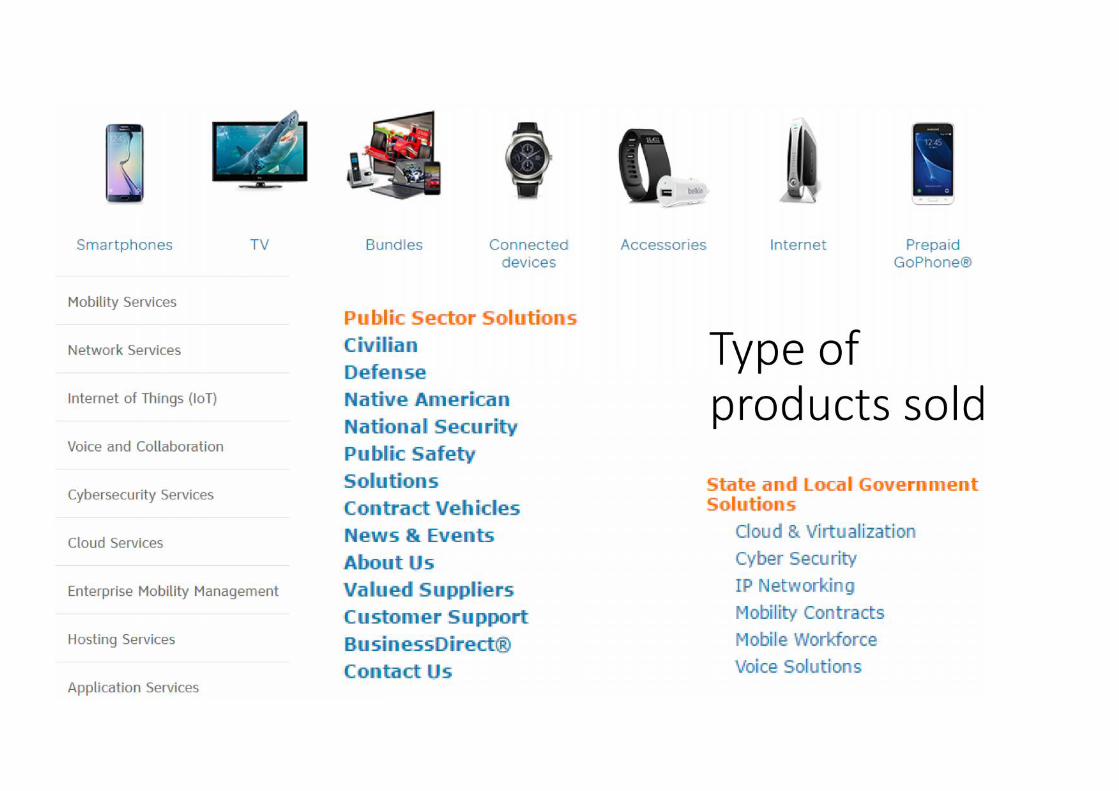
Type ofproducts sold

Variation in Sales
•No cyclicality•No seasonality•Event oriented
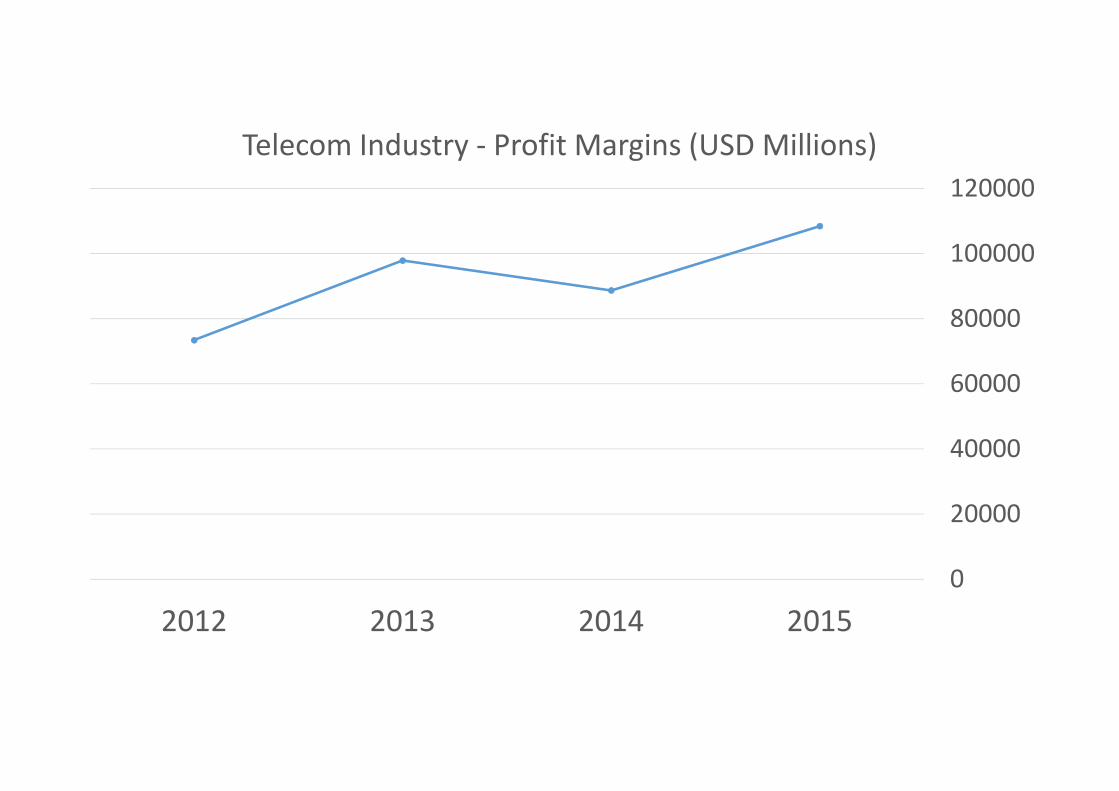
0
20000
40000
60000
80000
100000
120000
2015201420132012
Telecom Industry - Profit Margins (USD Millions)

0100200300400500600700800900
AmericaMovil(AMX)
Orange(ORAN)
TelecomChina
Telefonica(TEF)
Vodafone(VOD)
DeutscheTelekom(DTEGY)
ChinaMobileLimited(CHL)
NipponTelegraph
&Telephone
(NTT)
VerizonWireless
(VZ)
AT&T (T)
SCOPE OF RIVALRY - Global Competitors (Revenues and No ofusers in Millions)
2015 Revenues 2015 No of users

0
20,000
40,000
60,000
80,000
100,000
120,000
140,000
160,000
2015 2014 2013 2012
SCOPE OF RIVALRY - National Competitors (USD Millions SalesRevenues)
Verizon AT&T T-Mobile Sprint
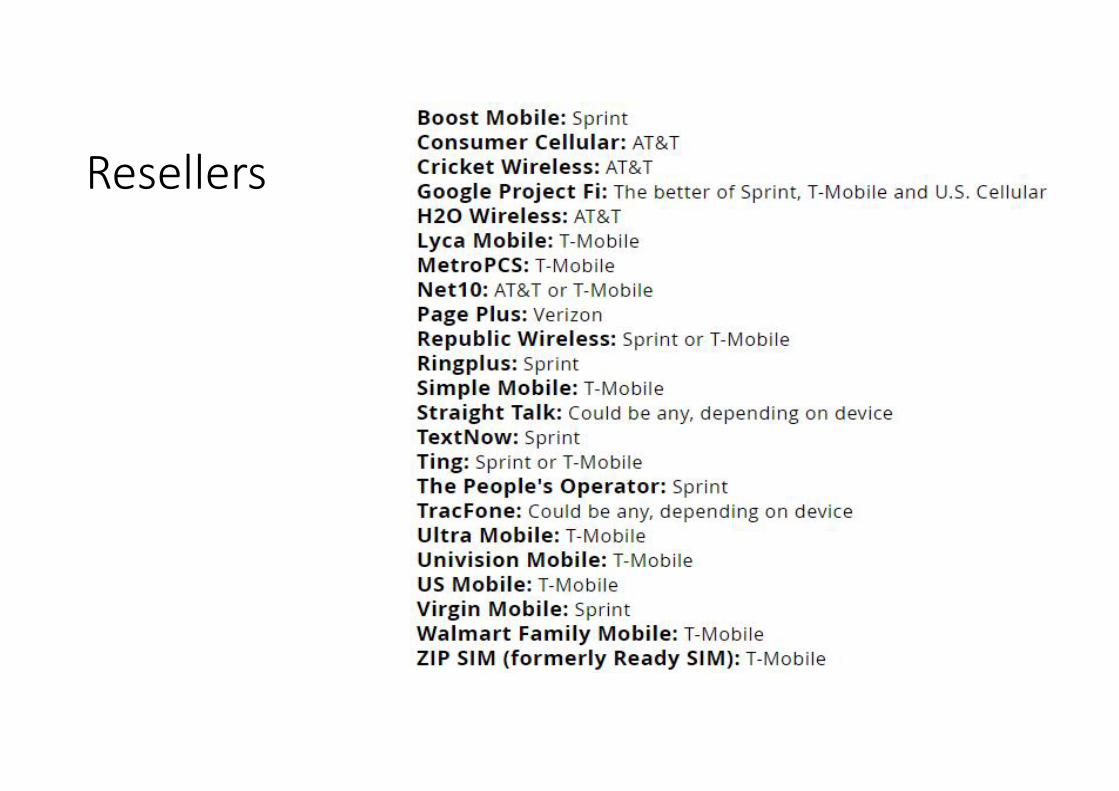
Resellers
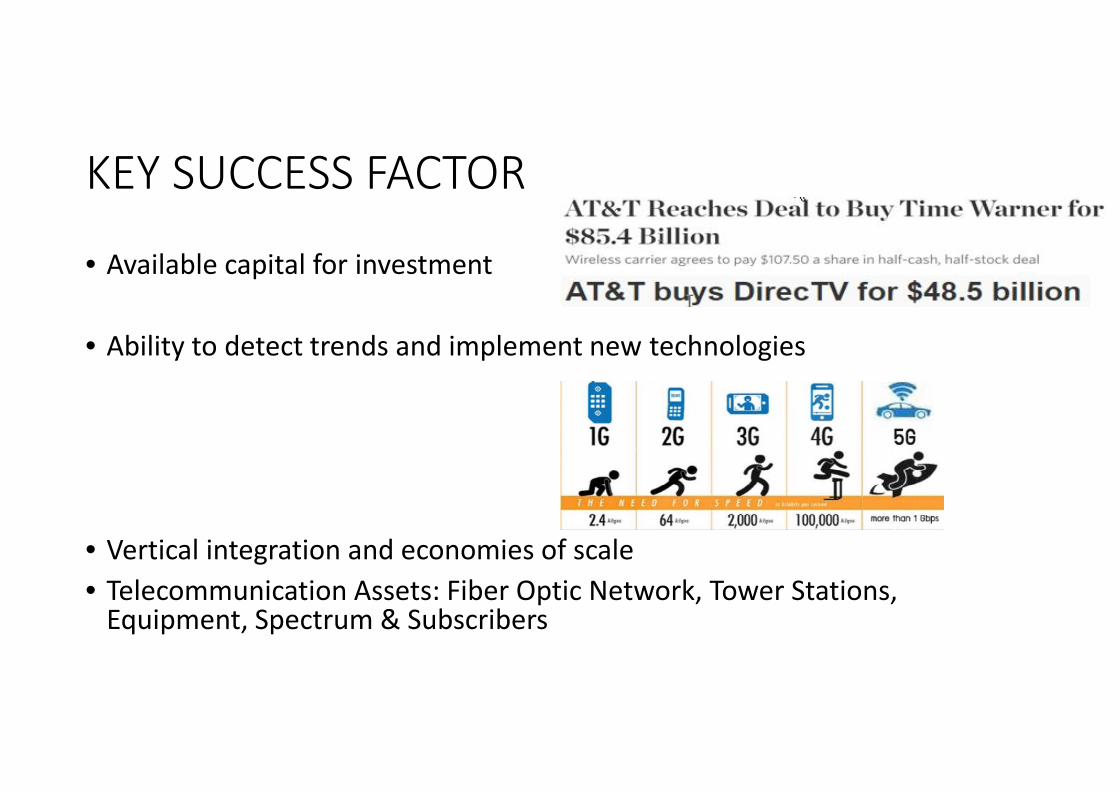
KEY SUCCESS FACTOR
• Available capital for investment
• Ability to detect trends and implement new technologies
• Vertical integration and economies of scale• Telecommunication Assets: Fiber Optic Network, Tower Stations,
Equipment, Spectrum & Subscribers
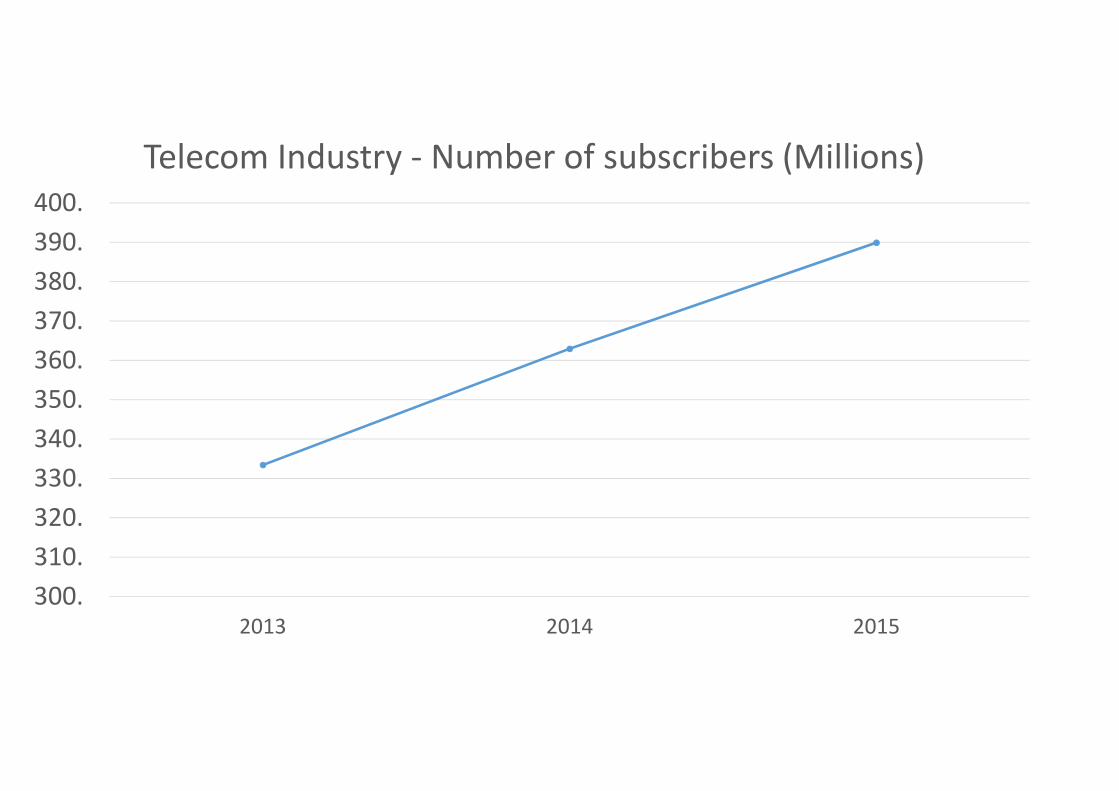
300.310.320.330.340.350.360.370.380.390.400.
2013 2014 2015
Telecom Industry - Number of subscribers (Millions)
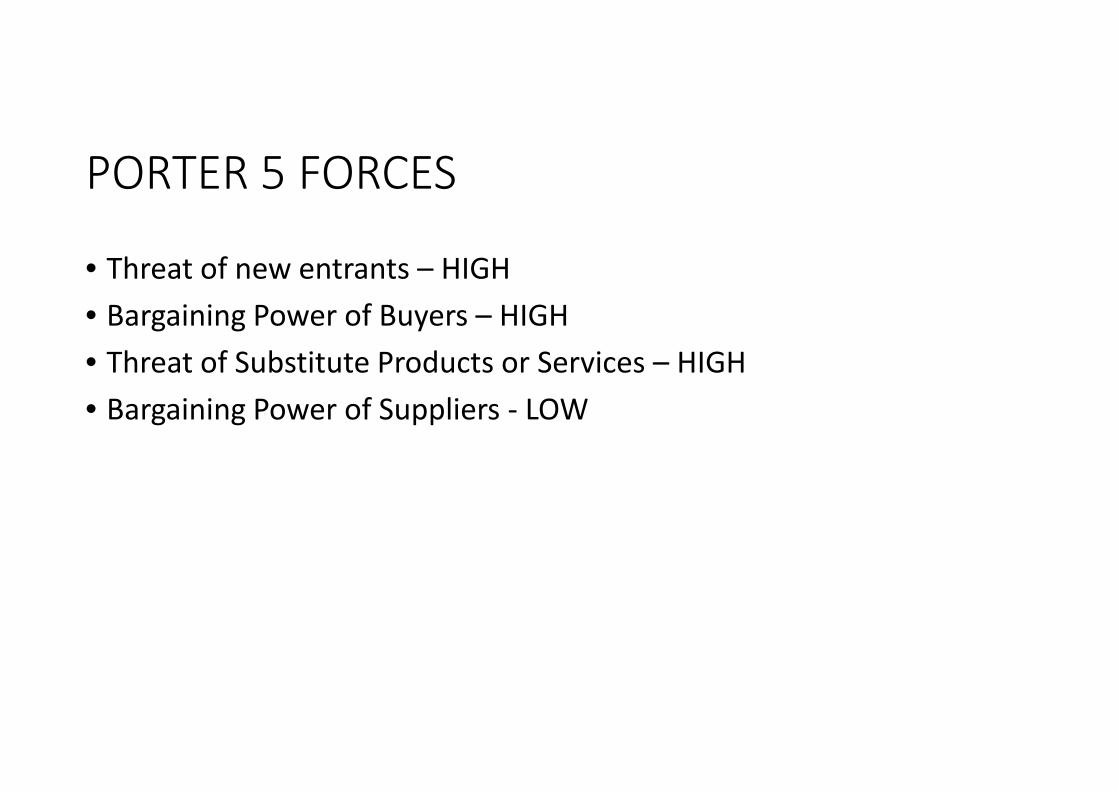
PORTER 5 FORCES
• Threat of new entrants – HIGH• Bargaining Power of Buyers – HIGH• Threat of Substitute Products or Services – HIGH• Bargaining Power of Suppliers - LOW
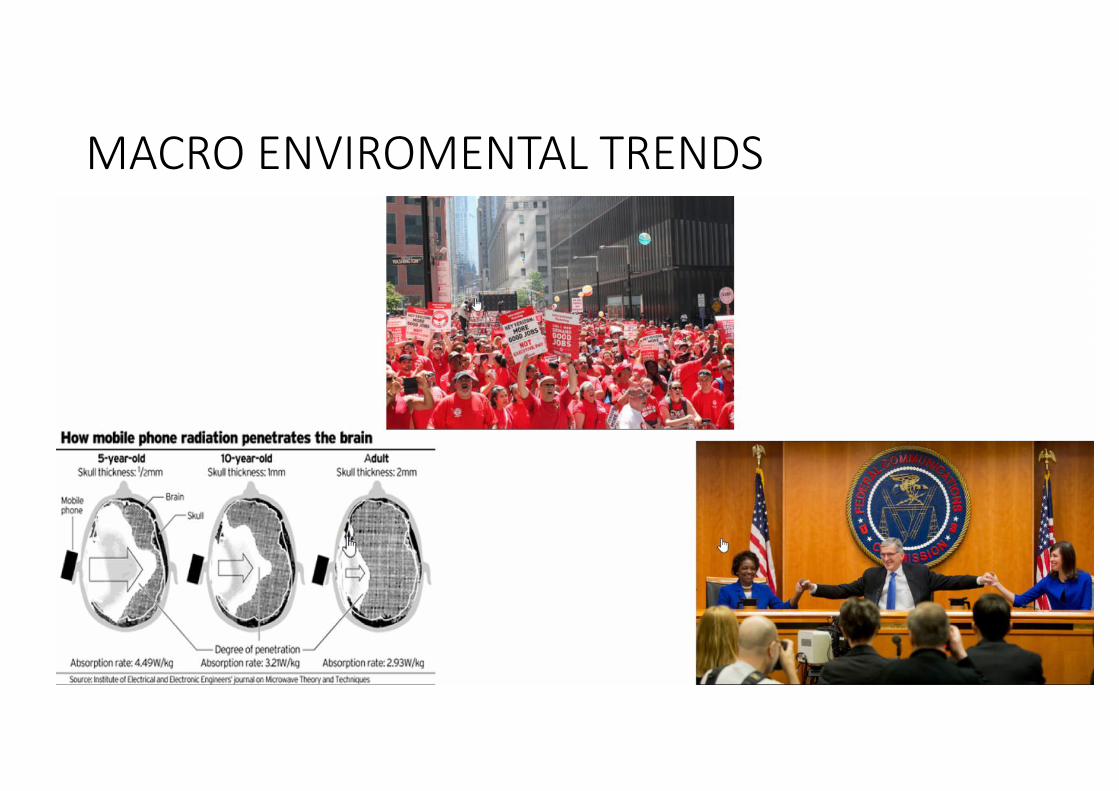
MACRO ENVIROMENTAL TRENDS

Opportunities and threats
for the industry
VERIZON AT&T T-MOBILE SPRINT
Capital for investments 18b profit.
39b cash for investment.
30b invested
(18b capex,
4b acquisitions,
10b AWS-3 spectrum
license).
13b profit. 36b cash for
investment. 49b invested
(19b capex, 12b acquisitions
18b AWS-3 spectrum
license).
678m profit. 5.4b for
investment. 10b invested (3b
increase,
5b capex,
1.8b AWS-3 spectrumlicense)
2b profit.
4b for investment.
6b invested (7b capex,
1b disposal of fix assets)
Implementation of new
technologies
312M persons covered with
4G LTE network.
111b invested in 4G LTE since
2000.
355M people covered by 4G
LTE network.
312M people covered by 4G
LTE network.
300M people covered by 4G
LTE network.
Economies of scale through
merges, joint ventures,
acquisitions and sales.
ACQUIRE VODAFONE
STAKE IN VERIZON
WIRELESS IN 2014(130b),
ACQUIRE AOL in 2015(4.4b),
POSSIBLE YAHOO EMAILAND FINANCE in 2017(4.8b),
SOLD landline to FRONTIER
2015(3b), and in 2016(8.6b)
ACQUIRE CINGULAR
WIRELESS IN 2006 (86b),
ACQUIRE DIRECTV 2014
(48.5b), ACQUIRE TIME
WARNER 2016 (85.4b)
Tried to buy T-Mobile in 2014.
Potential merge with T-Mobile
in 2017.
Subscribers Database 143M 132M 68M 58M

VERIZON
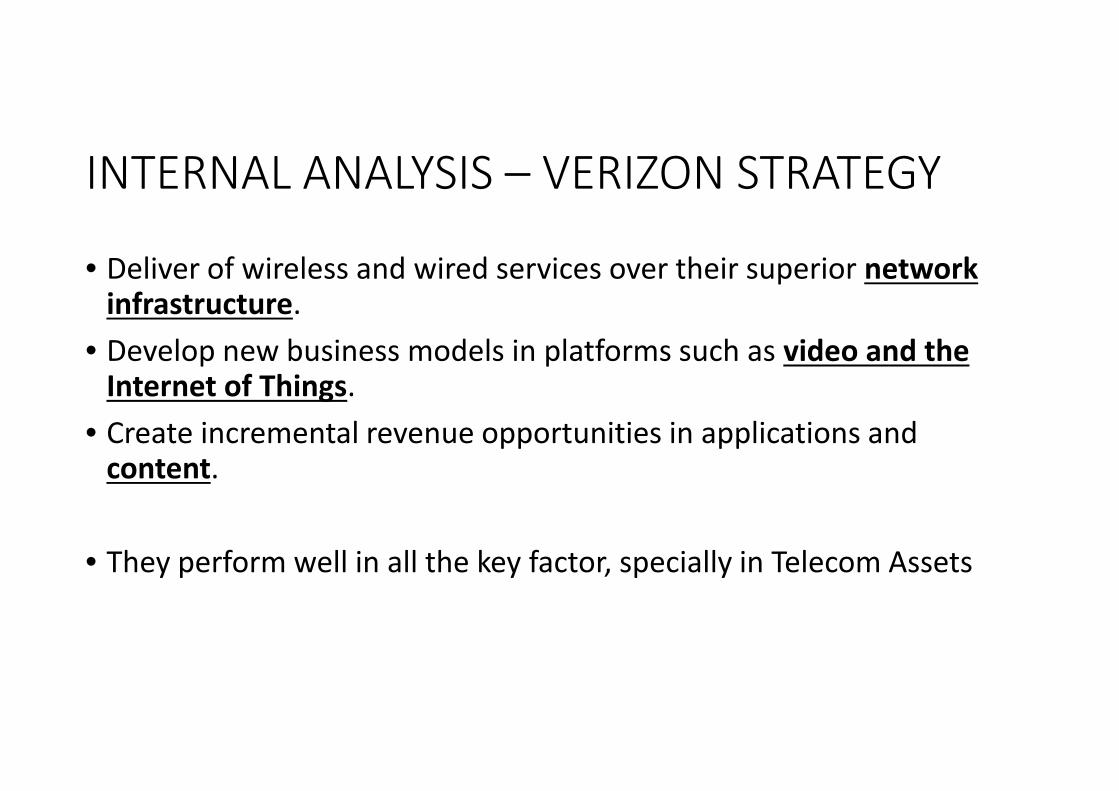
INTERNAL ANALYSIS – VERIZON STRATEGY
• Deliver of wireless and wired services over their superior networkinfrastructure.
• Develop new business models in platforms such as video and theInternet of Things.
• Create incremental revenue opportunities in applications andcontent.
• They perform well in all the key factor, specially in Telecom Assets

#2 Wireless Coverage
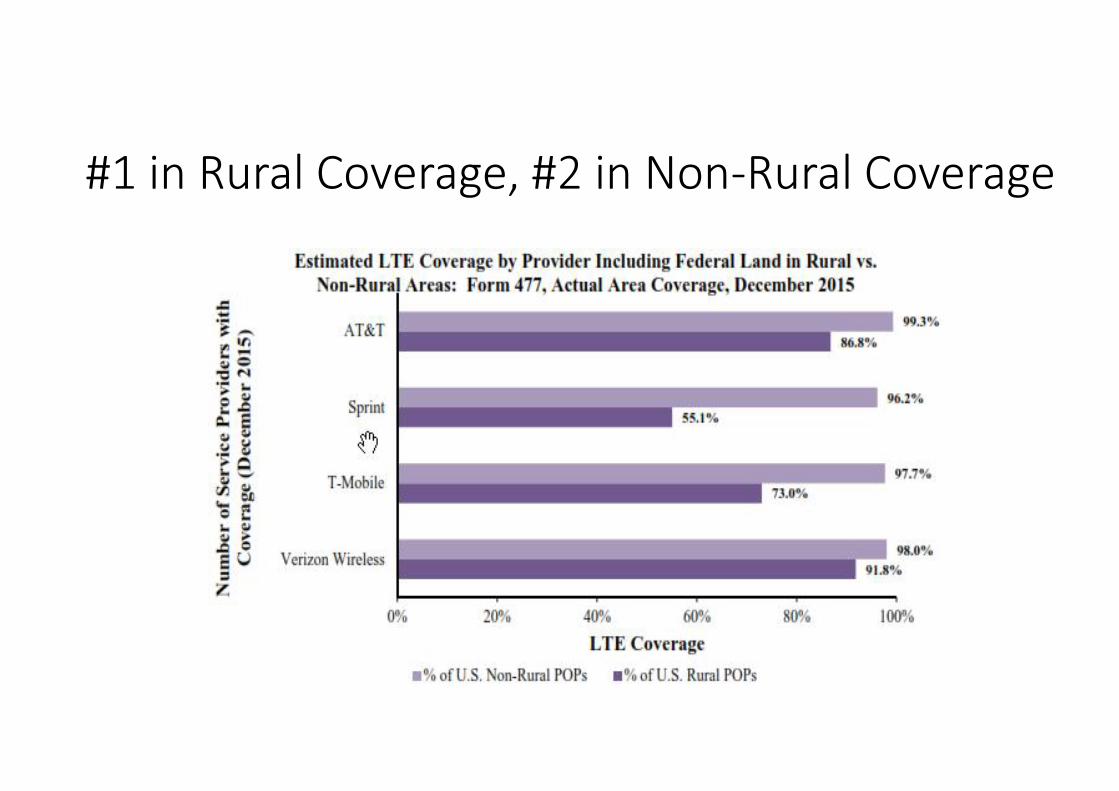
#1 in Rural Coverage, #2 in Non-Rural Coverage

#2 in LTE Download Speed
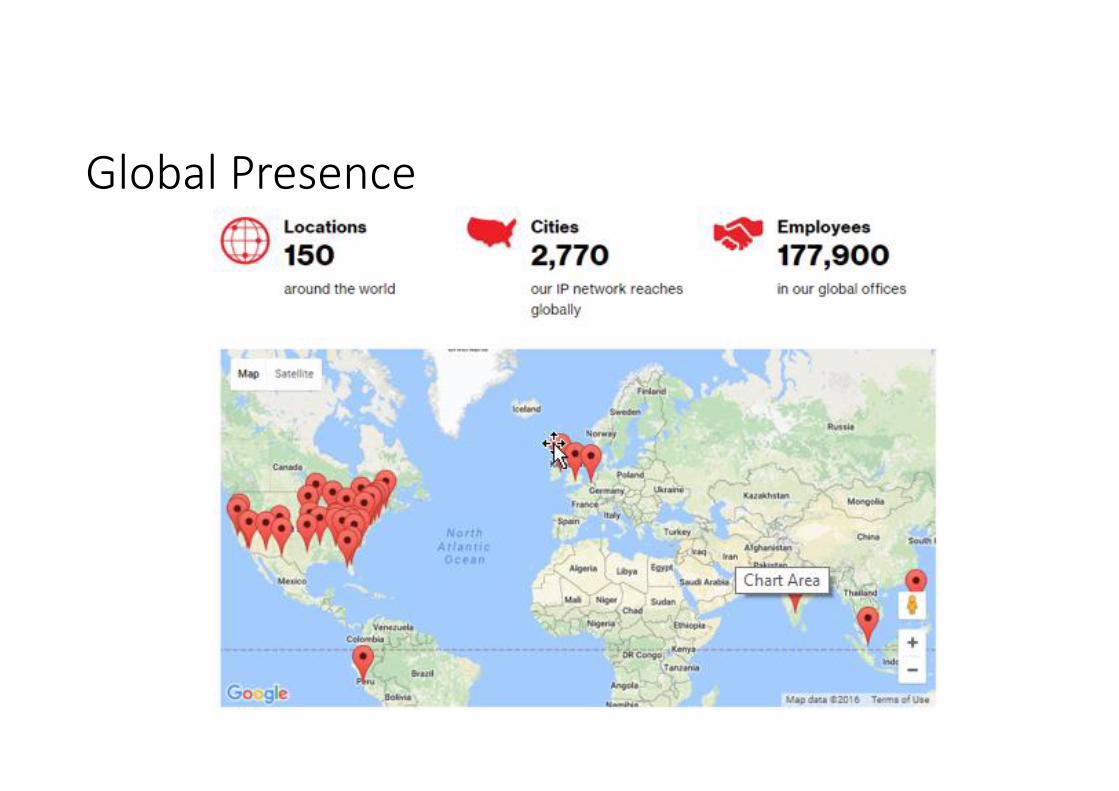
Global Presence

FINANCIAL ANALYSIS
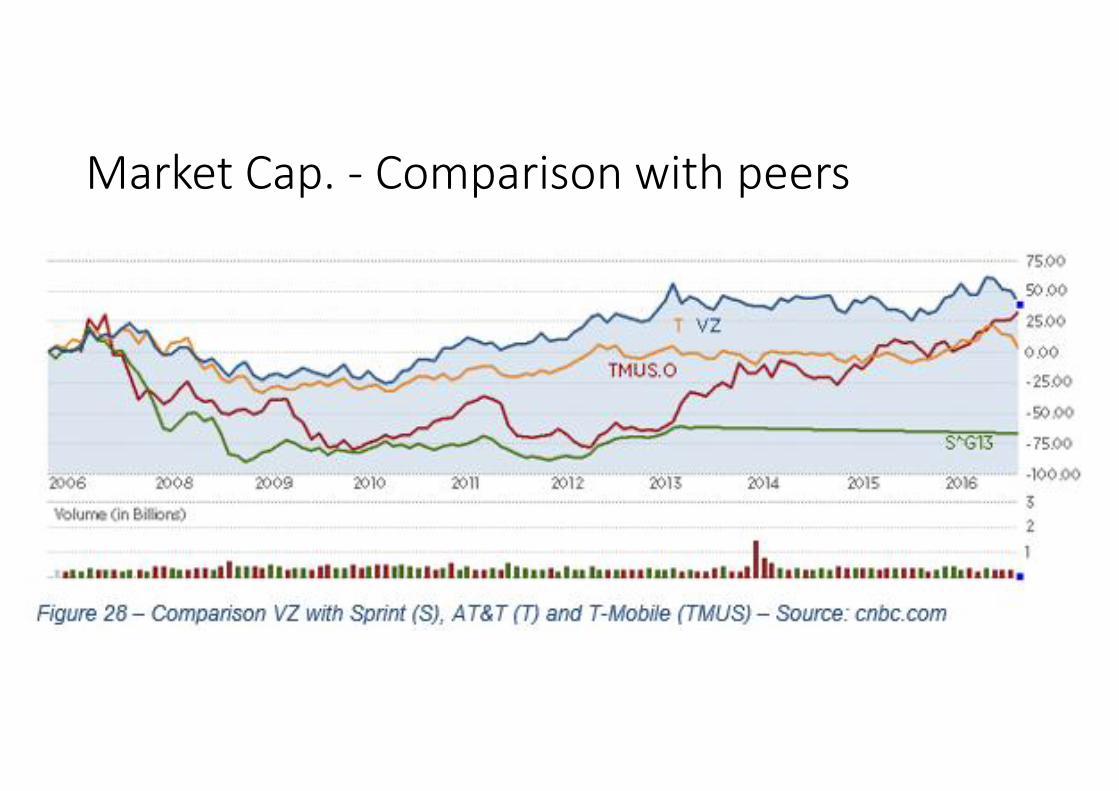
Market Cap. - Comparison with peers

Market Cap. - Comparison with Indices

RATIOS
0.000.501.001.502.002.503.00
12/31/201512/31/201412/31/201312/31/2012
2015201420132012
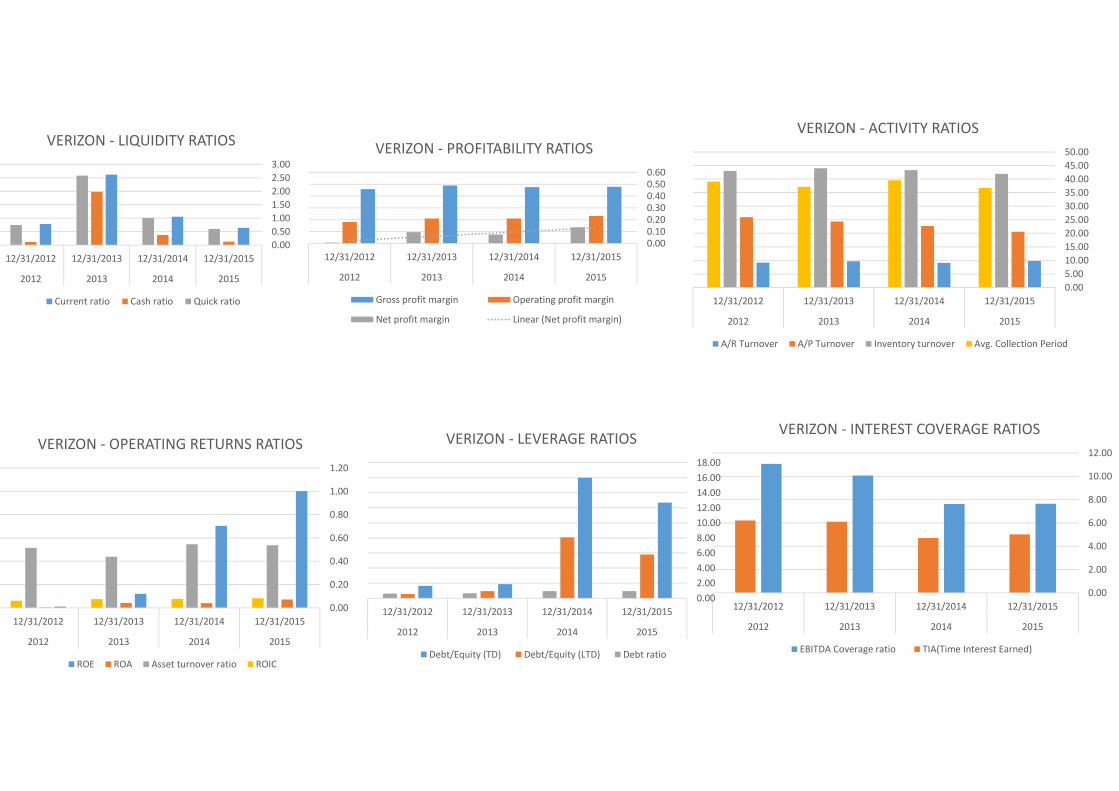
VERIZON - LIQUIDITY RATIOS
Current ratio Cash ratio Quick ratio
0.000.100.200.300.400.500.60
12/31/201512/31/201412/31/201312/31/2012
2015201420132012
VERIZON - PROFITABILITY RATIOS
Gross profit margin Operating profit margin
Net profit margin Linear (Net profit margin)
0.00
2.00
4.00
6.00
8.00
10.00
12.00
12/31/201512/31/201412/31/201312/31/2012
2015201420132012
VERIZON - INTEREST COVERAGE RATIOS
EBITDA Coverage ratio TIA(Time Interest Earned)
0.00
0.20
0.40
0.60
0.80
1.00
1.20
12/31/201512/31/201412/31/201312/31/2012
2015201420132012
VERIZON - OPERATING RETURNS RATIOS
ROE ROA Asset turnover ratio ROIC
0.002.004.006.008.0010.0012.0014.0016.0018.00
12/31/201512/31/201412/31/201312/31/2012
2015201420132012
VERIZON - LEVERAGE RATIOS
Debt/Equity (TD) Debt/Equity (LTD) Debt ratio
0.005.0010.0015.0020.0025.0030.0035.0040.0045.0050.00
12/31/201512/31/201412/31/201312/31/2012
2015201420132012
VERIZON - ACTIVITY RATIOS
A/R Turnover A/P Turnover Inventory turnover Avg. Collection Period

BENCHMARK
0
50,000
100,000
150,000
200,000
2015201420132012
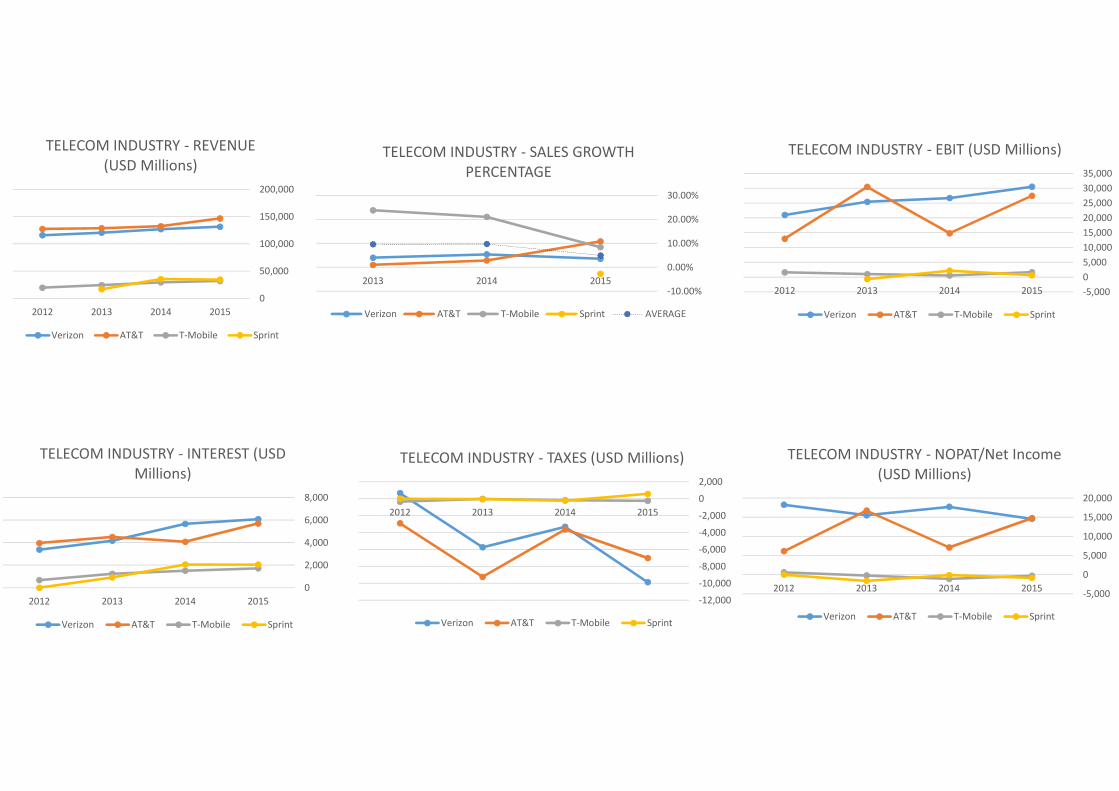
TELECOM INDUSTRY - REVENUE(USD Millions)
Verizon AT&T T-Mobile Sprint
-10.00%
0.00%
10.00%
20.00%
30.00%
201520142013
TELECOM INDUSTRY - SALES GROWTHPERCENTAGE
Verizon AT&T T-Mobile Sprint AVERAGE
-5,00005,00010,00015,00020,00025,00030,00035,000
2015201420132012
TELECOM INDUSTRY - EBIT (USD Millions)
Verizon AT&T T-Mobile Sprint
0
2,000
4,000
6,000
8,000
2015201420132012
TELECOM INDUSTRY - INTEREST (USDMillions)
Verizon AT&T T-Mobile Sprint
-12,000-10,000-8,000-6,000-4,000-2,00002,000
2015201420132012
TELECOM INDUSTRY - TAXES (USD Millions)
Verizon AT&T T-Mobile Sprint
-5,000
0
5,000
10,000
15,000
20,000
2015201420132012
TELECOM INDUSTRY - NOPAT/Net Income(USD Millions)
Verizon AT&T T-Mobile Sprint
-5,00005,00010,00015,00020,00025,00030,00035,00040,00045,000
2015201420132012
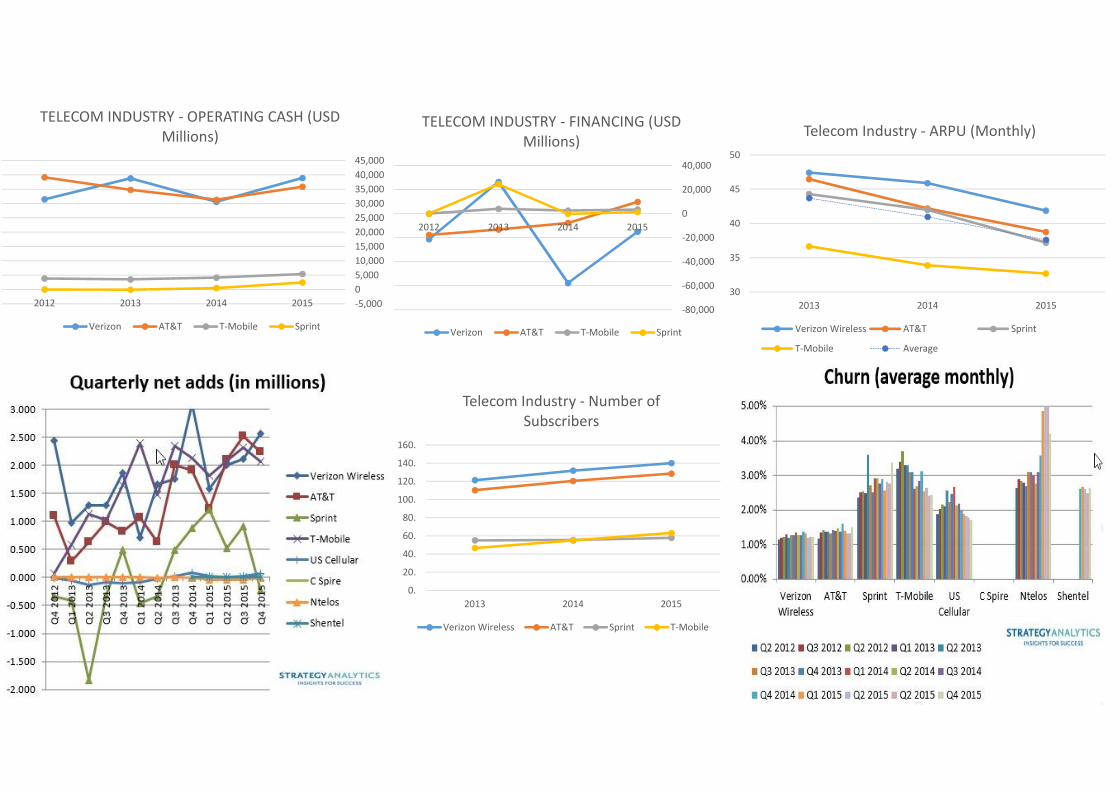
TELECOM INDUSTRY - OPERATING CASH (USDMillions)
Verizon AT&T T-Mobile Sprint-80,000
-60,000
-40,000
-20,000
0
20,000
40,000
2015201420132012
TELECOM INDUSTRY - FINANCING (USDMillions)
Verizon AT&T T-Mobile Sprint
30
35
40
45
50
2013 2014 2015
Telecom Industry - ARPU (Monthly)
Verizon Wireless AT&T Sprint
T-Mobile Average
0.
20.
40.
60.
80.
100.
120.
140.
160.
2013 2014 2015
Telecom Industry - Number ofSubscribers
Verizon Wireless AT&T Sprint T-Mobile
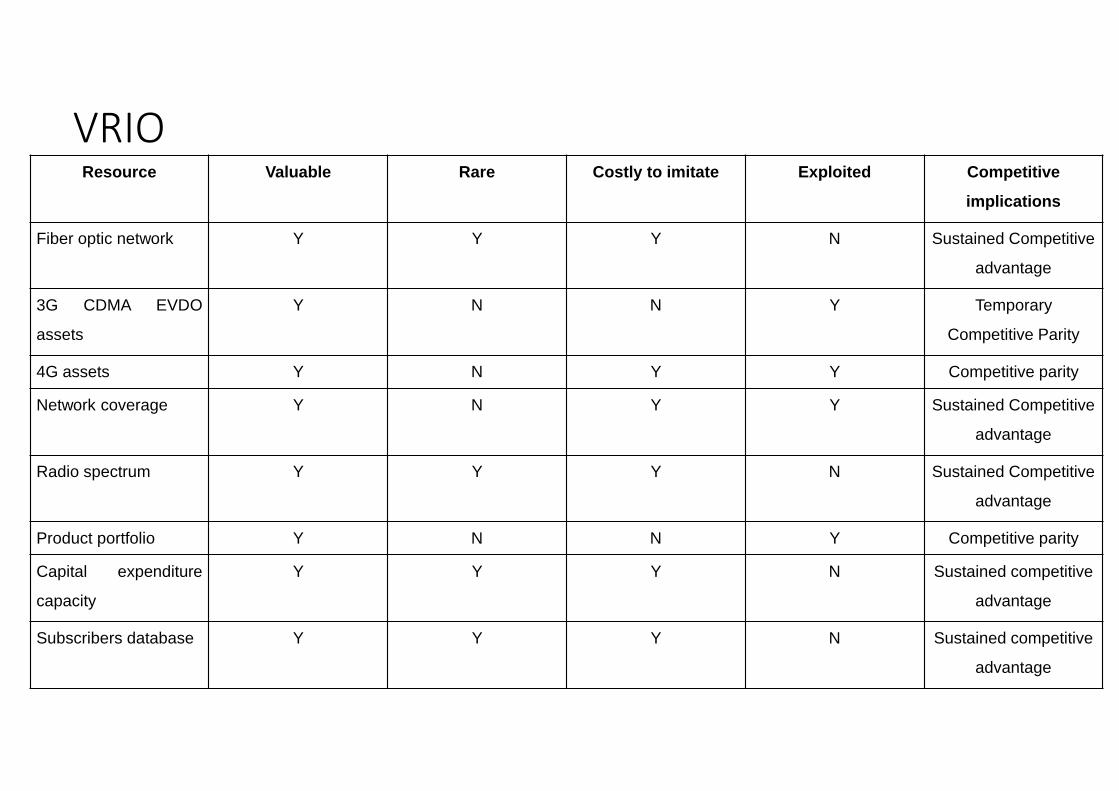
VRIOResource Valuable Rare Costly to imitate Exploited Competitive
implications
Fiber optic network Y Y Y N Sustained Competitive
advantage
3G CDMA EVDO
assets
Y N N Y Temporary
Competitive Parity
4G assets Y N Y Y Competitive parity
Network coverage Y N Y Y Sustained Competitive
advantage
Radio spectrum Y Y Y N Sustained Competitive
advantage
Product portfolio Y N N Y Competitive parity
Capital expenditure
capacity
Y Y Y N Sustained competitive
advantage
Subscribers database Y Y Y N Sustained competitive
advantage
Recommendations for Verizon• Buy Yahoo mail and Yahoo Finance with a discount of 1 billion dollars
due to the breach.• Be more aggressive in the purchase of content companies. AT&T has
spent 130 billions in the last two years buying DirecTV and TimeWarner, Verizon has spent 4.4 billions buying AOL Time Warner andstill deciding if it will buy Yahoo.
• Continue selling not integrated landlines FiOS to operators likeFrontier but creating a company that includes all the workers to avoidpolitical retaliation. Discontinue operation and maintenance of ADSLtechnology (copper) or replace with actual IP technologies: 4G LTE orFiOS.