Embed Size (px)
Citation preview
Quintiq Natural Resource supply chain integration
Dean TsouManaging Consultant, Perth
Lee HochbergSenior Advisor
September 2014
2© 2014 Quintiq 2© 2014 Quintiq
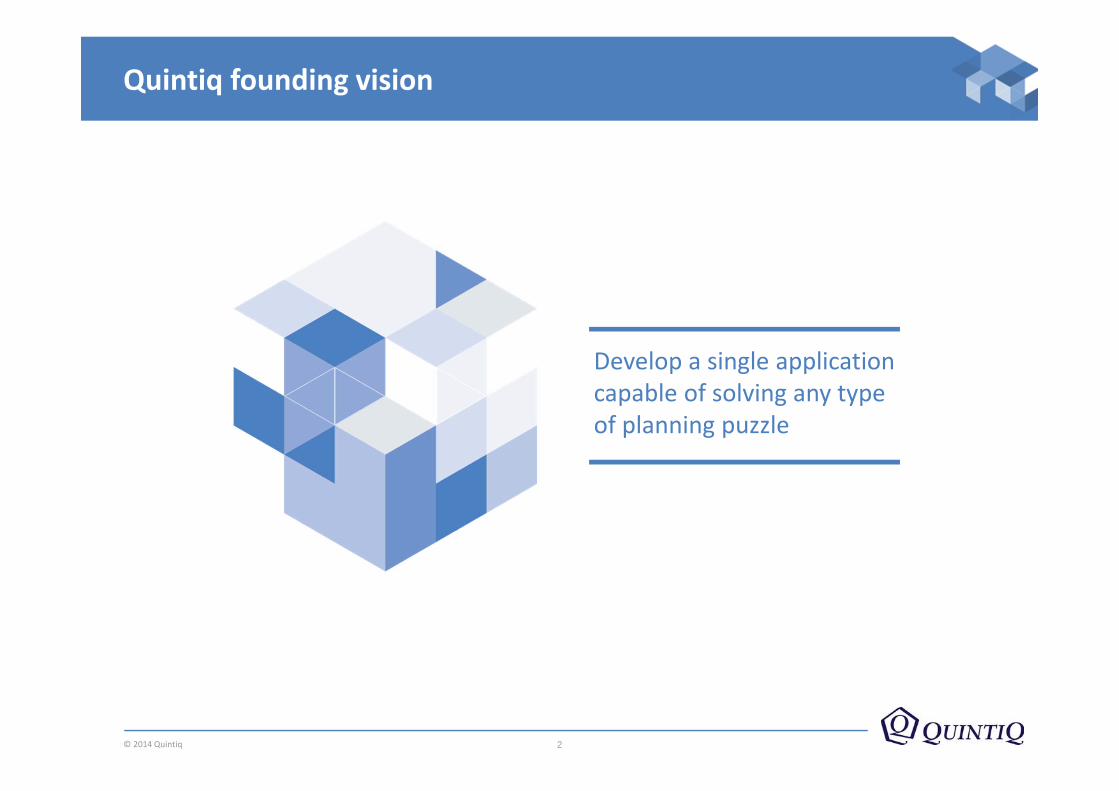
Quintiq founding vision
Develop a single application capable of solving any type of planning puzzle

© 2014 Quintiq. All rights reserved. Quintiq is a registered mark of Quintiq Holding B.V.
17 years on…

4© 2014 Quintiq
Retail Express delivery
ANSP E.U. Rail Freight
Powder coatings
Glass production
Steel production
EnergyRolled
aluminum production
Quintiq customers rank #1 in:
produce 80% of theworld’s rolled aluminum 1997
Aluminum
Include 2 of Europe’s top 3 rail companies with combined 150,000 rolling stock units
Rail2001
include 2 of the world’s top 3 companies and deliver over 1 million packages per day2002
Logistics
roster air traffic controllers that manage 65% of the world’s airspace2005
Air traffic
Today, our customers:
From first customer to dominant industry supplier.
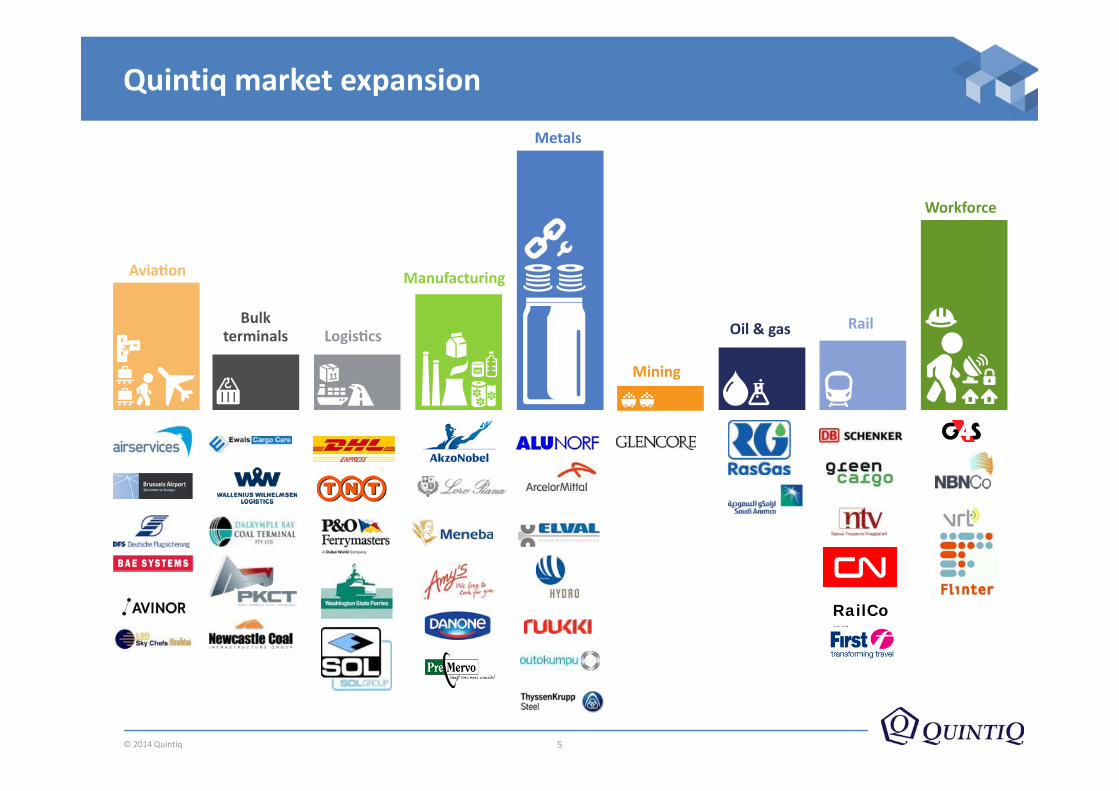
4 of the top 5 O&G producers plan with Quintiq
3 of the 5 global Tier One Miners plan with Quintiq
Market Leaders around the world trust Quintiq
5© 2014 Quintiq 5© 2014 Quintiq
Quintiq market expansion
RailCorp

© 2014 Quintiq. All rights reserved. Quintiq is a registered mark of Quintiq Holding B.V.
PUZZLES!
The common thread

7© 2014 Quintiq 7© 2014 Quintiq
A “simple” puzzle…
• In how many different ways can these people be queued up?
3,628,800

8© 2013 Quintiq
Covering the Mining Supply Chain
Mine planning
Process / refineTransportation
BlendingPorts & shipping
Manufacturing

9© 2013 Quintiq
Mining Capability Map
Strategic (5+ years)
Tactical (2‐5 years)
Operational plan1‐24 months
Operational scheduling0‐12 weeks
Post‐operational
Mine Design & Planning
Strategic Demand & Capex
planning
Master MineProduction Plan
STP (Short Term Plan)
Dynamic Scheduling
Planned vs. scheduled vs. actual analysis
reporting
ProcessingProductionForecasting/
Capex Planning
Processing & Stockpile Planning
Short Term Processing planning
Processing andmaintenance scheduling
Rail NetworkNetworkCapacityAnalysis
Rail and Maintenance
plan
Rail and Maintenance schedule
Rail activitiesand variation/
disruption mgmt
Port OperationsCapacity
Forecasting/Capex Planning
Port and stockpile
operations plan
Port and stockpile scheduling
Port and stockpile activities
Shipping Capacityforecasting
Berth and VesselPlanning
Berth & Vesselscheduling
Dispositionmanagement
Crew Hiring/Training Cyclic rostering Scheduling Crew disposition
Act Plan Do Check

10© 2014 Quintiq
Systems of record
NOW FUTURE
Past Performance
Future Performance
ERP MES OPERATIONS PLANNING & OPTIMIZATION
Results
Best
Future and KPI Focused
11© 2014 Quintiq
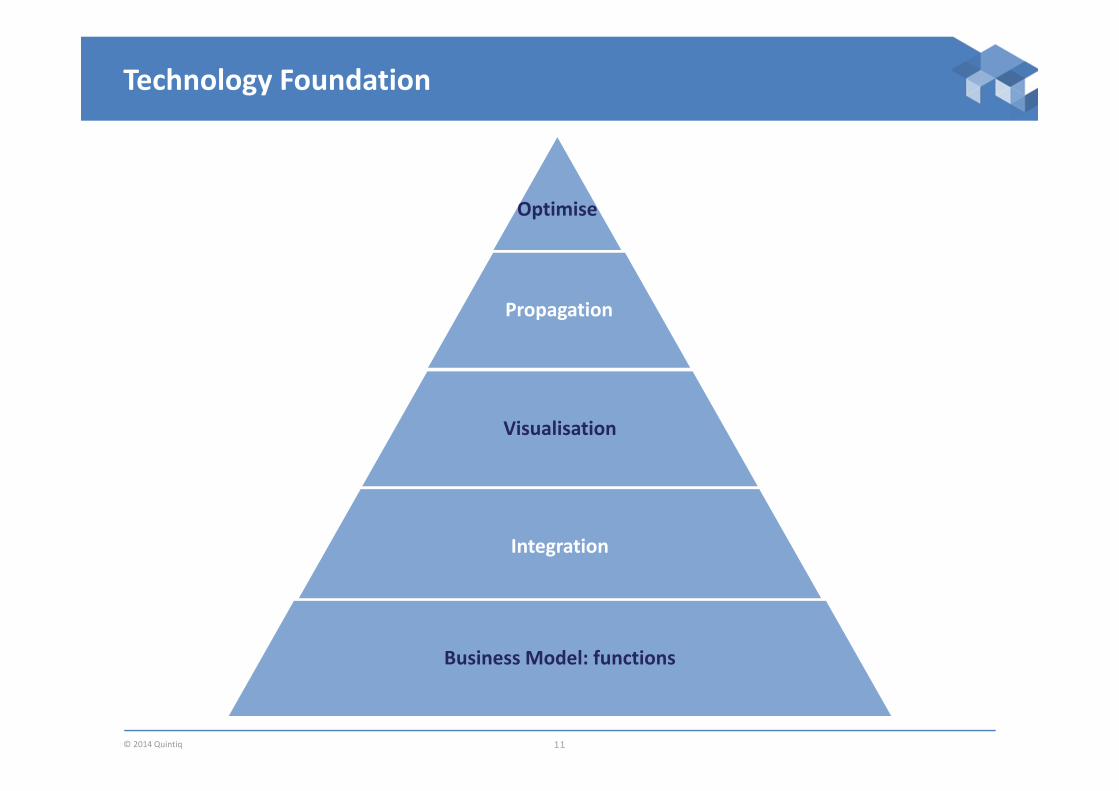
Technology Foundation
Optimise
Propagation
Visualisation
Integration
Business Model: functions
12© 2014 Quintiq
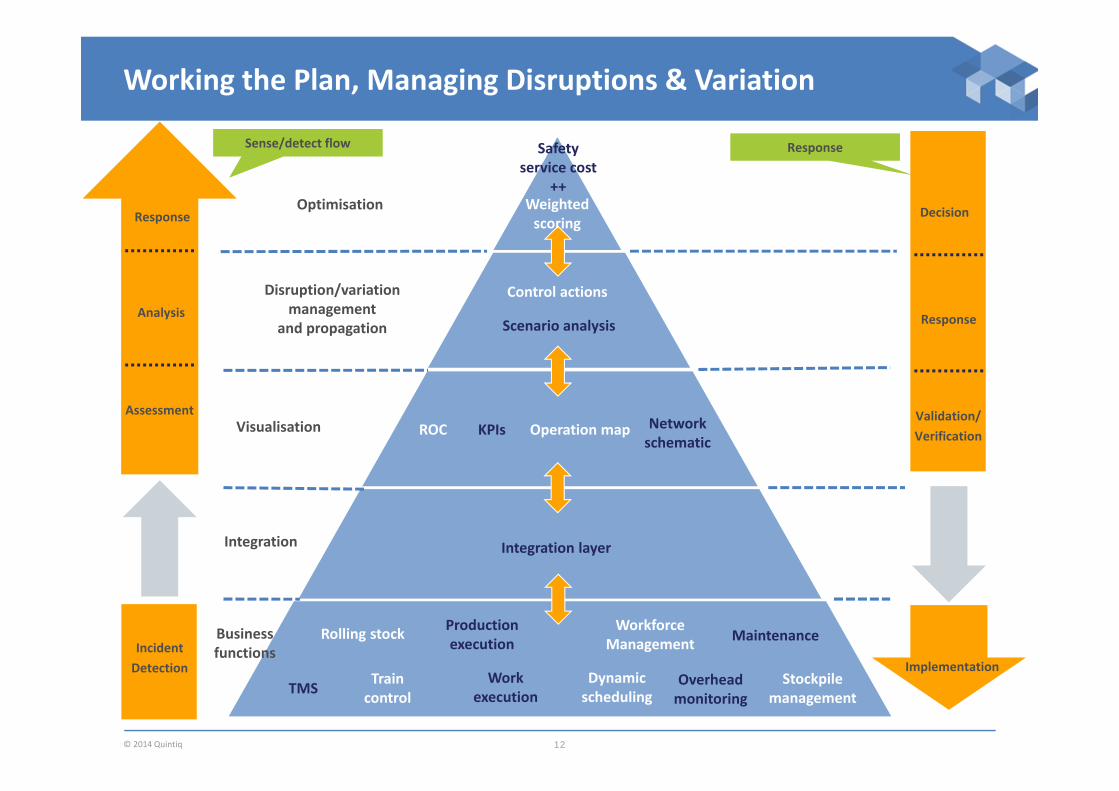
Working the Plan, Managing Disruptions & Variation
Integration layer
Optimisation
Disruption/variation management
and propagation
Visualisation
Integration
Business functions
ROC KPIs Operation map Networkschematic
Scenario analysis
Weighted scoring
Control actions
Dynamic scheduling
Train control
Work execution
Overheadmonitoring
TMS Stockpile management
Rolling stock Workforce Management Maintenance
Production execution
Safety service cost
++
Sense/detect flow
IncidentDetection
Response
Analysis
Assessment
Response
Implementation
Decision
Response
Validation/Verification

13© 2014 Quintiq 13

14© 2014 Quintiq
SELECTDemurrage Tons per shift / person
DEFINECreate loading rotation Assign berthsAssign resources
MODELCranes, birthsStock piles, conveyors
MEASUREThis week’s demurrageThis week’s productivity
OPTIMIZETwenty Foot Equivalent Unit/acre
14

15© 2014 Quintiq
Supply Chain Configuration
User created units, stocking points and
attributes
Fundamental planning data and constraints which drive the model
Supply Chain View• Mines• TLOs• Processing Facilities• Transport
(Rail/Barge)• Unloaders• Ports• Berths• Etc.

16© 2014 Quintiq
Visual Planning & Scheduling
Supply Chain View
Always on screen KPIs to facilitate planning decisions
Gantt Charts to plan and track usage of supply chain assets e.g. Trains,
Barges, Berths, Loader/Unloaders, etc.

17© 2014 Quintiq
Demand FulfilmentMeeting Contract Specifications
Track contract/vessel fulfilment
e.g. we see that there is one shipment which will incur
contract penalties
Supply from user created stocking points is been consumed from the plan and the best plan is selected from the available stocking
points
Specification achieved against
the target
Railings planned to meet the spec. The quality for reach train is the weighted average at the
time
Stockpiles used to supply for this shipment
The shipment specification demanded for each parcel (which could be represented by a product)
18© 2014 Quintiq
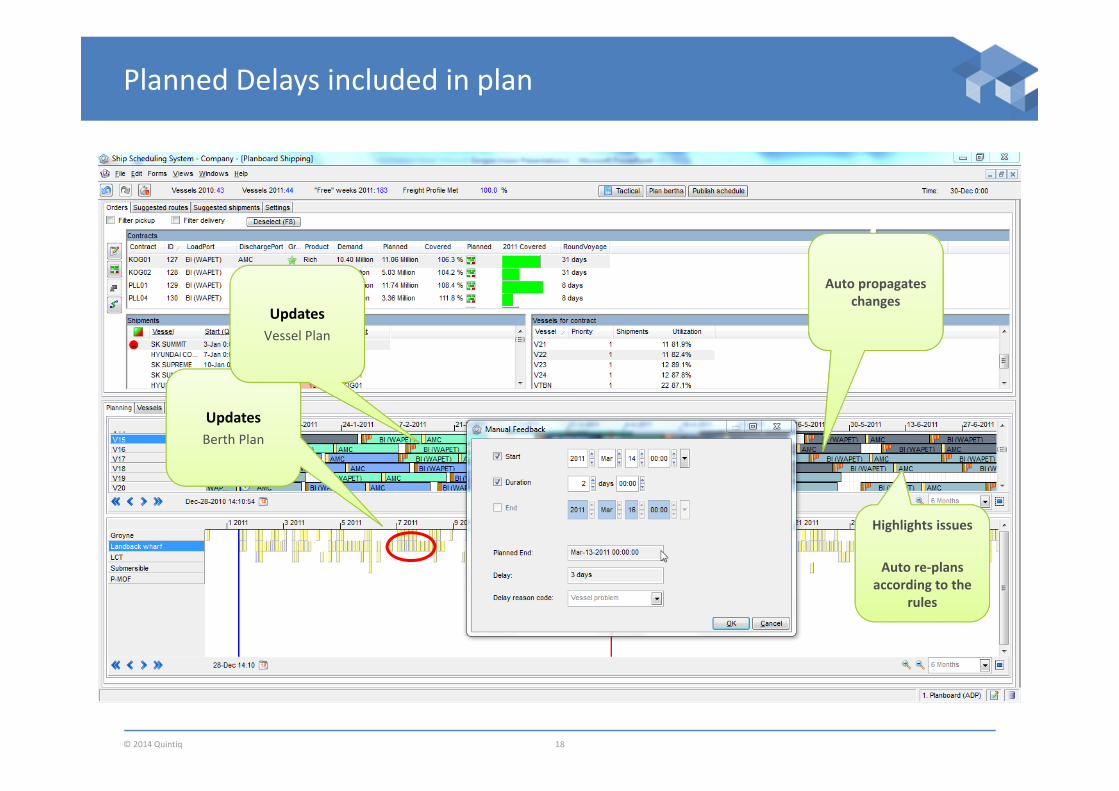
Planned Delays included in plan
UpdatesBerth Plan
UpdatesVessel Plan
Auto propagates changes
Highlights issues
Auto re‐plans according to the
rules

19© 2014 Quintiq
Voyage Planning
Unavoidable delays(tides, daylight and stevedore,
winds) are calculated by the system
Opportunity for cost reductionsCalculate Start/End
times and durations of voyage components

20© 2014 Quintiq
Berth Planning
Wind restrictions at berth
Quarantine Inspection only allowed in Daylight
Waiting times for pilotage calculated by system
Smart filtering to show Berth Vessel
compatibility
Allocation of berth to loading / unloading /
cleaning tasks
21© 2014 Quintiq
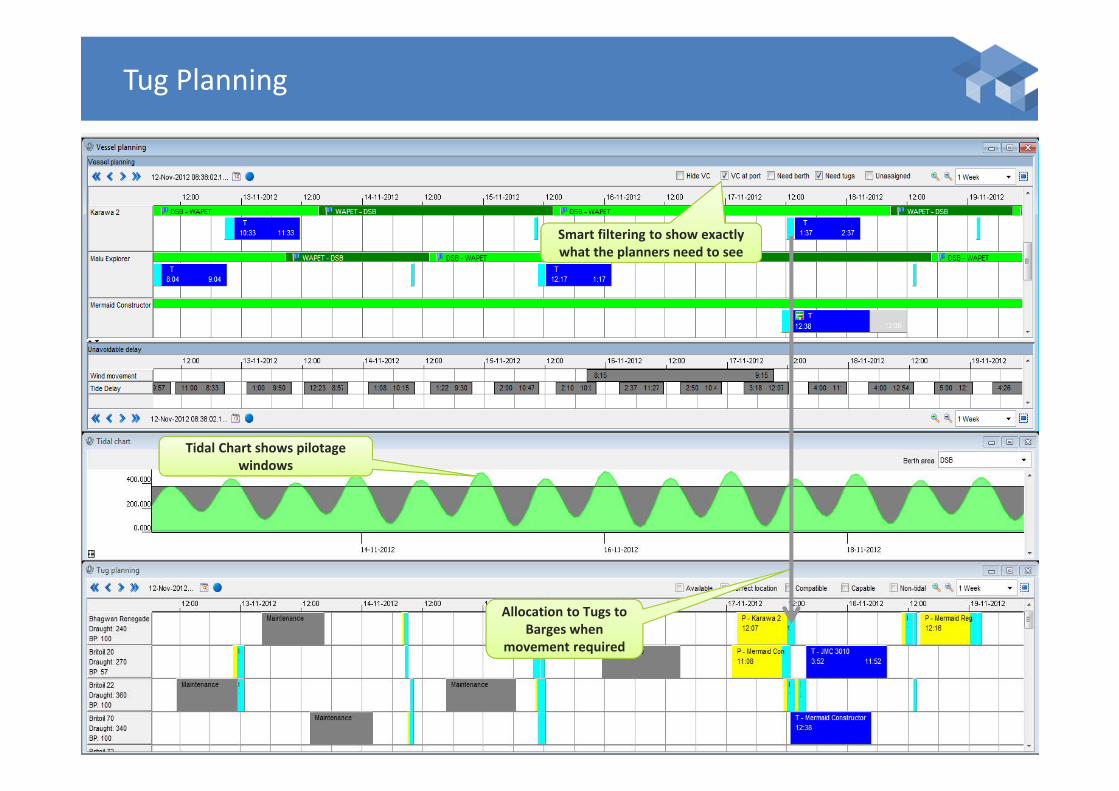
Tug Planning
Tidal Chart shows pilotagewindows
Smart filtering to show exactly what the planners need to see
Allocation to Tugs to Barges when
movement required
22© 2014 Quintiq
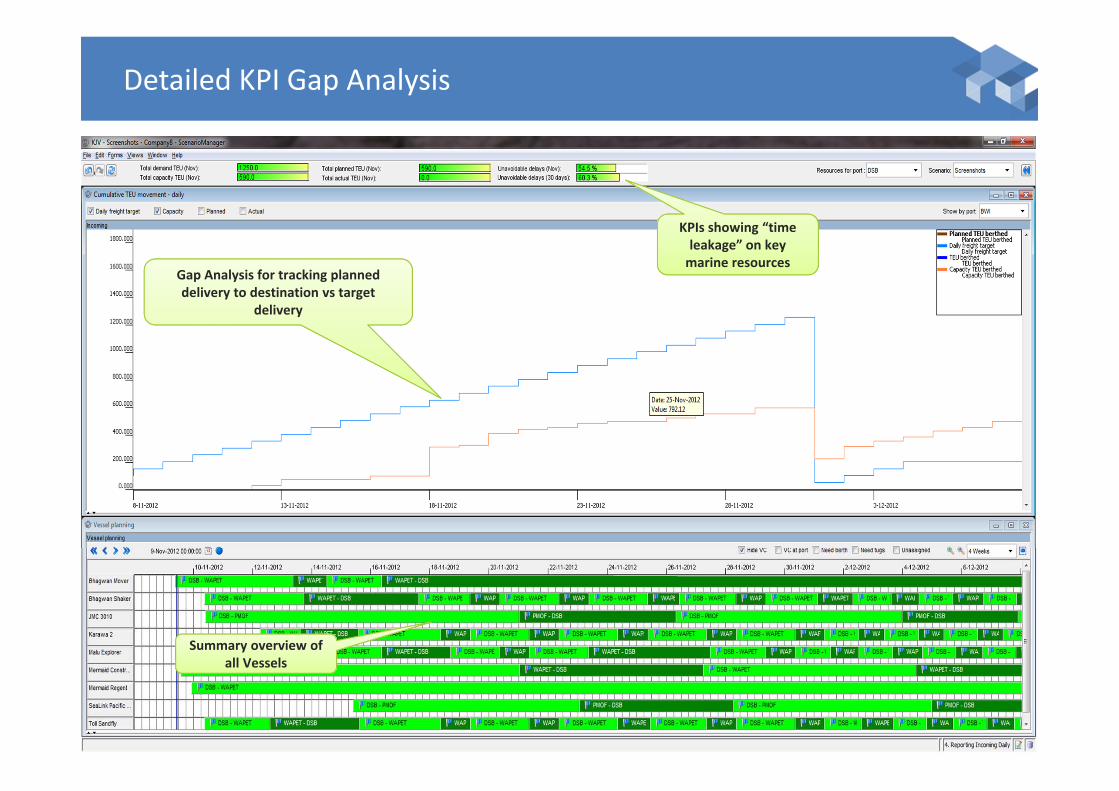
Detailed KPI Gap Analysis
Summary overview of all Vessels
Gap Analysis for tracking planned delivery to destination vs target
delivery
KPIs showing “time leakage” on key marine resources
23© 2014 Quintiq
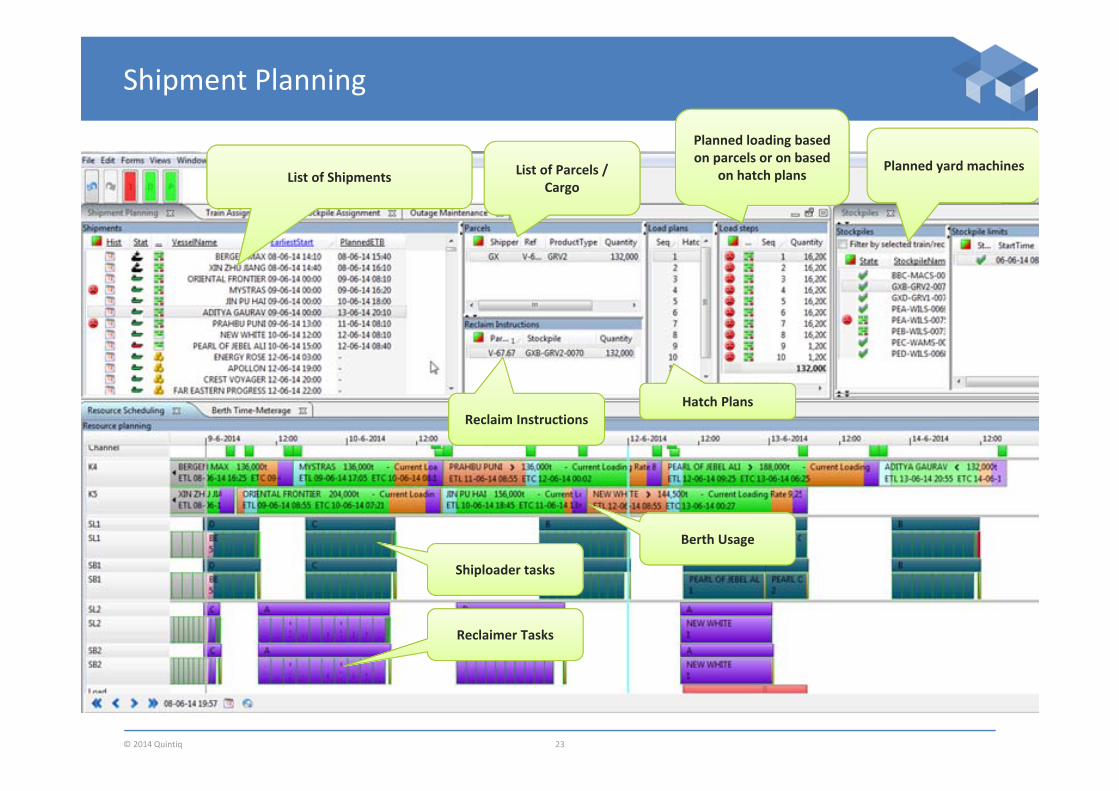
Shipment Planning
List of Shipments List of Parcels / Cargo
Reclaim InstructionsHatch Plans
Planned yard machines
Shiploader tasks
Berth Usage
Reclaimer Tasks
Planned loading based on parcels or on based
on hatch plans

24© 2014 Quintiq
Stockpile Allocation / Creation / ExceptionsFor Dedicated Terminals
Form is automatically filled based on configured rules
Exceptions on Stockpile limits highlighted instantly on data
entry
Warnings / Suggestions such as CAM date
Time – Metreage Stockpile Diagram

25© 2013 Quintiq
Examples in Oil & Gas
Upstream
Wells
Production
Lifting
Processing
Refining
Distribution

26© 2014 Quintiq 26© 2014 Quintiq
Summary
Manual planning Decision support
• Conflicts and consequences• Clear visualization
• KPIs
Automatic planning
Interactive automatic planning

27© 2014 Quintiq
Reference customers
“Organizations implementing Quintiq report good project management capabilities from the company, with projects being completed on time and within budget. Users are generally satisfied with the vendor across a range of criteria, but especially with its approach to proof of concepts and responsiveness to user suggestions for enhancements and improvements.”
Source: Gartner Magic Quadrant: Supply Chain Planning for Process Automation 2010
Analysis
Phase 1
Modeling
Phase 2
Initialization
Phase 0
Iterative development
Phase 3
Implement
Phase 4
Post go‐livesupport
Phase 5
The Quintiq Project Life Cycle (QPLC) methodology ensures repeatable success
Customerretention
90+% 83%
We have a track record of delivering successful outcomes
© 2014 Quintiq. All rights reserved. Quintiq is a registered mark of Quintiq Holding B.V.
Questions

29© 2014 Quintiq 29© 2014 Quintiq
Large‐scale vehicle routing with time windows
10^2,429options
100 trucks 1,000 delivery locations
1 depot

30© 2014 Quintiq 30© 2014 Quintiq
A good solution
42,479miles
100 trucks 1,000 delivery locations
1 depot
31© 2014 Quintiq 31© 2014 Quintiq
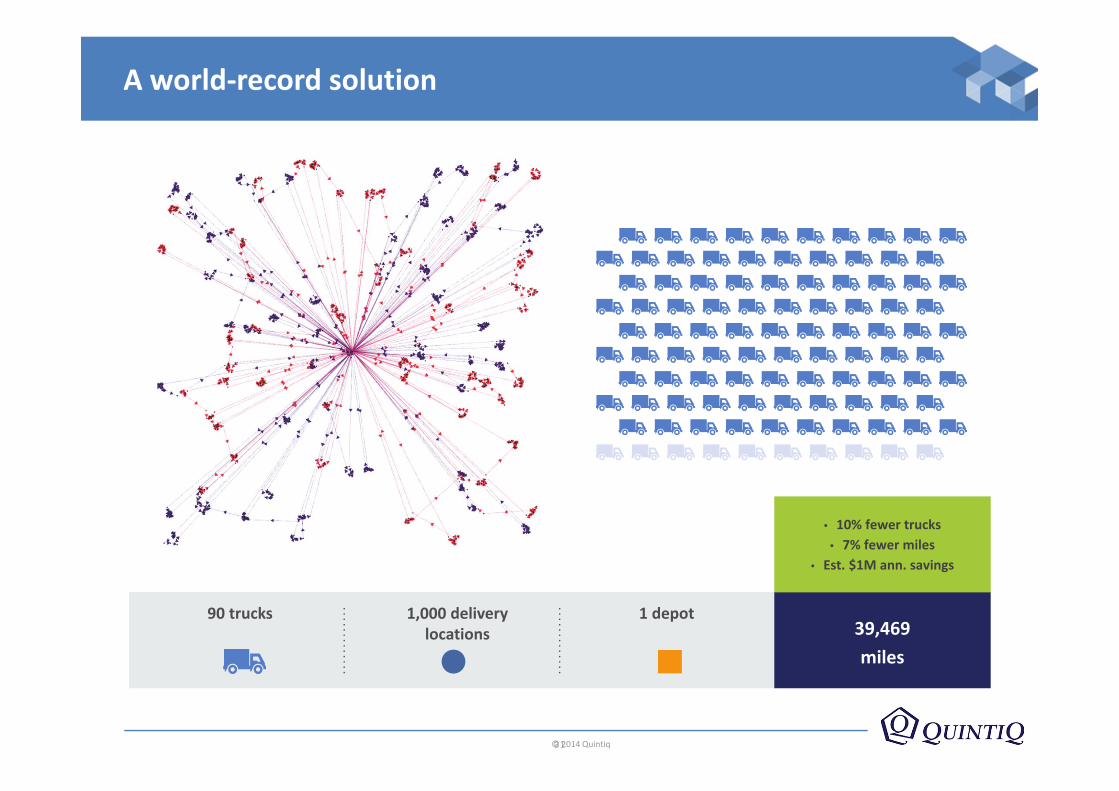
A world‐record solution
90 trucks 1,000 delivery locations
1 depot39,469miles
• 10% fewer trucks• 7% fewer miles
• Est. $1M ann. savings

32© 2014 Quintiq
KPI‐based planning
Quintiq is an enabler for excellent results. It allows you to measure manyKPIs and drive improvements in the critical ones. Quintiq has exceeded our expectations every step of the way.”Novelis
Return on assets
Mining cost
Operating cost
Processing cost
Uptime
Tons per hour
Cost per load Fuel consumed
Effective production time
Delivery time
Order fulfillment %
Measure plan quality, balance conflicting goals, achieve optimal business outcome

© 2014 Quintiq. All rights reserved. Quintiq is a registered mark of Quintiq Holding B.V.
Quintiq in Mining
34© 2013 Quintiq
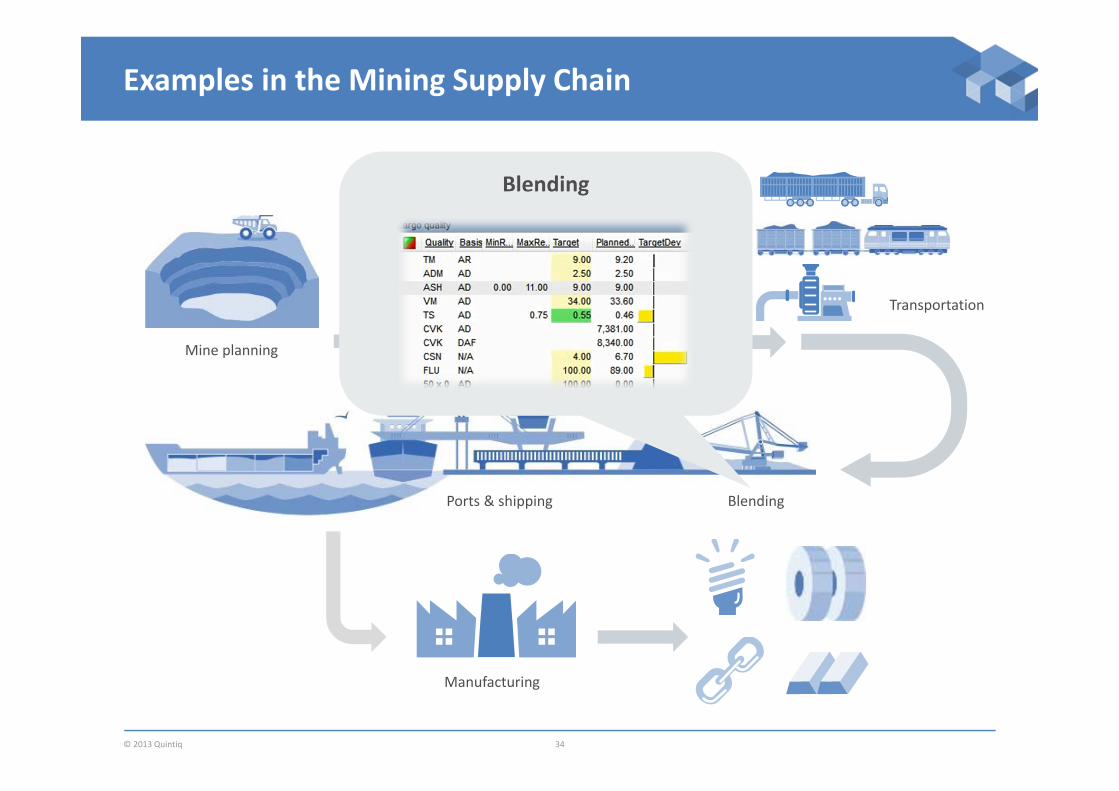
Examples in the Mining Supply Chain
Mine planning
Process / refineTransportation
BlendingPorts & shipping
Manufacturing
Blending
35© 2013 Quintiq
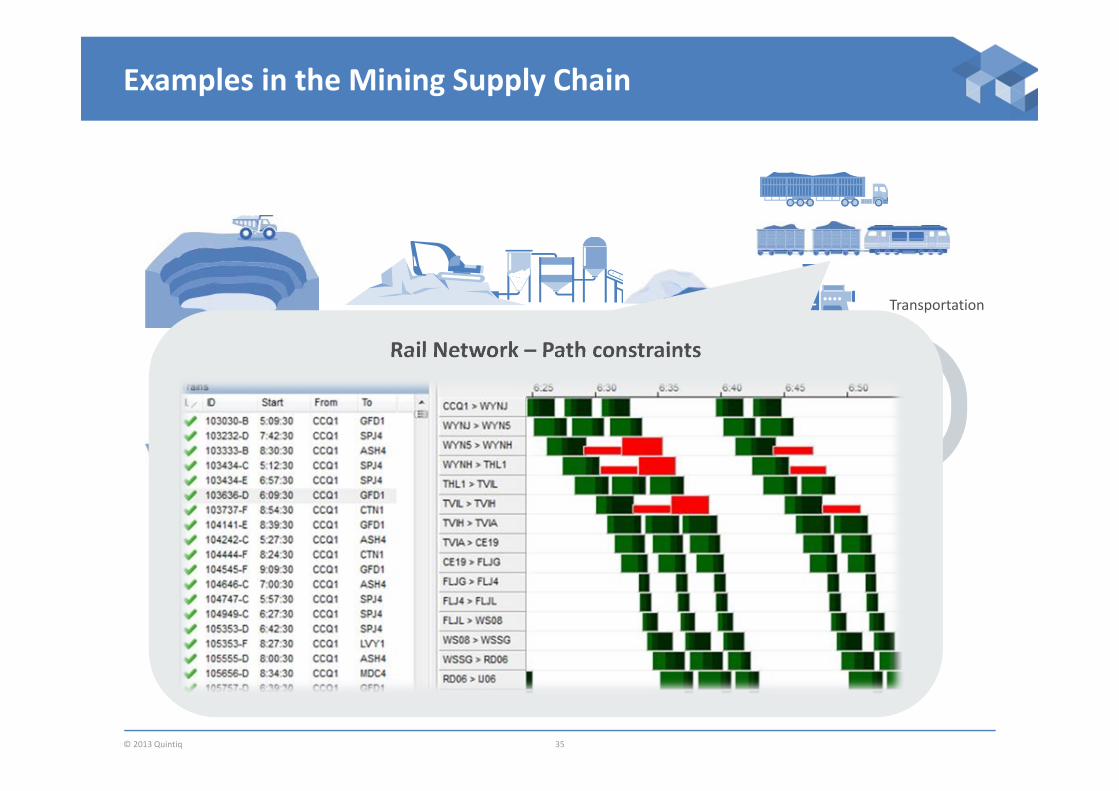
Examples in the Mining Supply Chain
Mine planning
Process / refineTransportation
BlendingPorts & shipping
Manufacturing
Rail Network – Path constraints
36© 2013 Quintiq
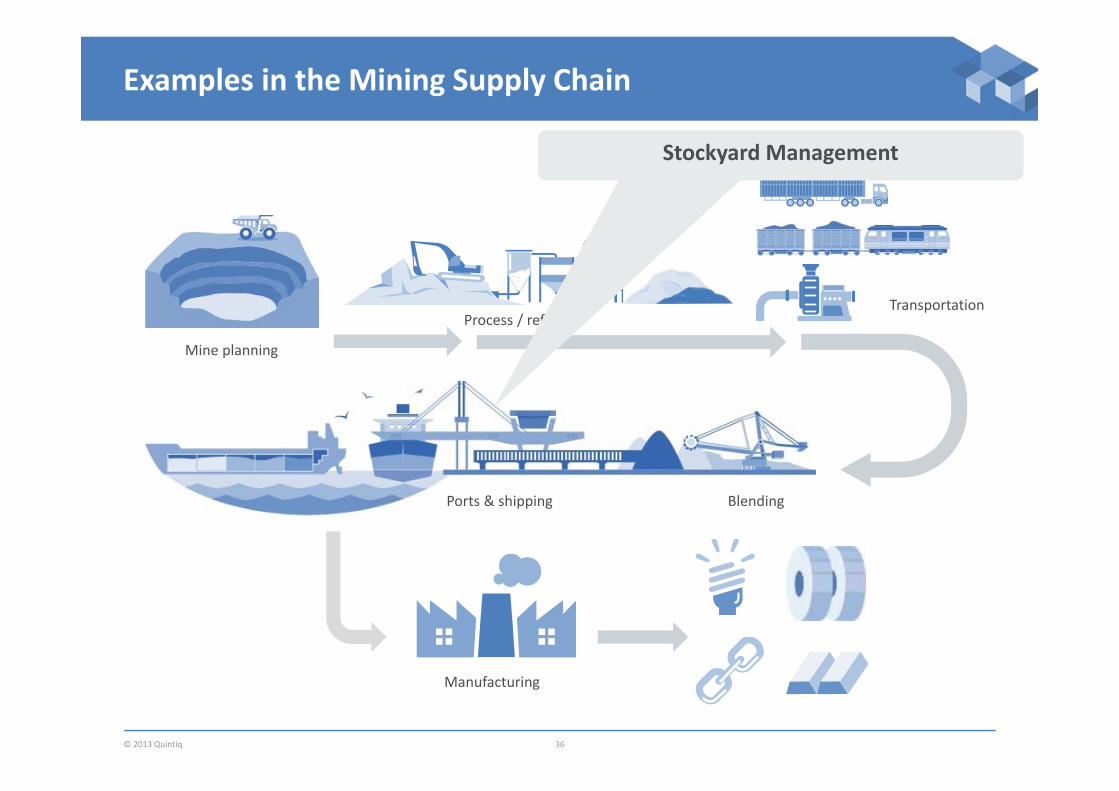
Examples in the Mining Supply Chain
Mine planning
Process / refineTransportation
BlendingPorts & shipping
Manufacturing
Stockyard Management
37© 2013 Quintiq 37© 2013 Quintiq
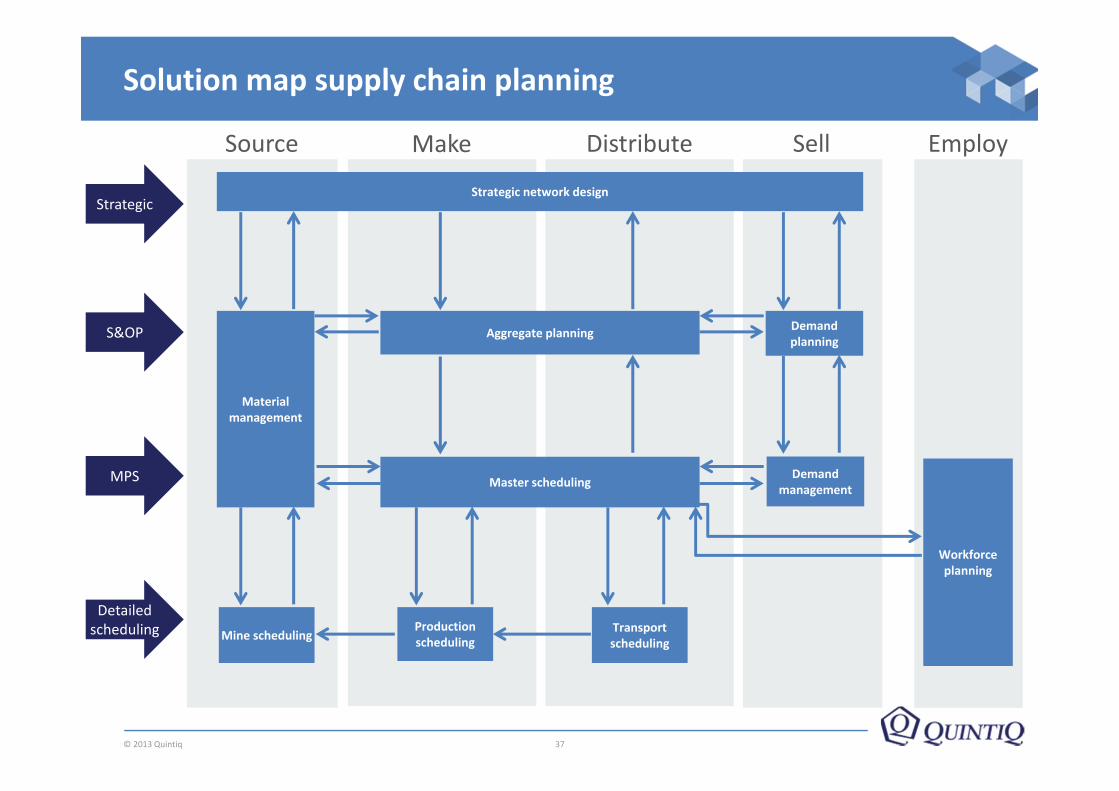
Solution map supply chain planning
DistributeMakeSource
Strategic network design
Aggregate planning
Material management
Master scheduling
Transport scheduling
Production schedulingMine scheduling
Demand planning
Workforce planning
S&OP
MPS
Detailed scheduling
Strategic
Demand management
Sell Employ