Embed Size (px)
Citation preview

ITP GT 2729 The Quantified Self About Town Dimas Rinarso Putro ([email protected]) | Kania Azrina ([email protected])
Quantifying Mental Engagements of New York City Subway riders
BACKGROUND “Feelings of happiness, life satisfaction and the sense that one's activities are worthwhile all decrease with every successive minute of travel to work.” (Office of UK National Statistic, 2014). Commuting is a mundane task of everyone’s life. Yet, it has to be done regularly every day and it cannot be avoided in order to make the living. On the other side, commuting can really affect people’s wellness - it affects citizen’s productivity. One of the way to intercept this cycle is by fulfilling rider’s demand about their routine subway trip : short waits, trains that arrive regularly, a chance for a seat, a clean car, and understandable announcements that tell them what they need to know. Because of those reasons, it become crucial to understand the subway rider’s satisfaction on their trip. While several studies have been conducted to measure subway rider’s satisfaction using traditional methods such as survey, the technology advancement enables us to measure state-of-mind of people’s brain activity. This method, widely known as lifelogging or quantifying self is often used as a part of research to improve personal productivity and well-being [7]. By implementing this technology to several findings that could lead to the improvement of the subway service, hopefully it will increase the life quality of the riders and the citizen as a whole. LITERATURE STUDY We used the past one week to do final literature study and cross-check before we move to the development phase, calibration and finally performing the data observation. The first question we need to ask is mainly about the brain wave sensor that we are going the use. How do other academic and scholars value eeg data or BCI in more general sense? Is there any disagreements or previously discovered limitations and concerns? Is there any ethical method attached to the use of eeg measuring devices? Is the accuracy of the data is scientifically satisfying among the community? and so on and so forth. It is widely discussed that the development of BCI for consumer products in recent years can broadly be categorized to:
● (i) accessibility tools, such as mind-controlled mouse and keyboard, ● (ii) hands-free arcade games, such as Brain Bats, mind-controlled Pong game [2], and ● (iii) “serious games”, i.e., games with purpose other than pure entertainment, such as attention and
memory training [1].

ITP GT 2729 The Quantified Self About Town Dimas Rinarso Putro ([email protected]) | Kania Azrina ([email protected])
Figure 1. Workflow of modern BCI systems [1]
In addition to the accessibility and game use case, it is also worth mentioning how BCI have developed critical contribution in research, most notably, Mynd, an EEG-based BCI peripheral developed by research institute Nielsen company [2]. The sensor specialized on being easy to use research full-kit. In the RailSense project that we plan to somehow combine both functionalities of BCI as an consumer product accessibility tool as well as research kit for the final user-facing web visualization. From this unique branch of the type of use-case, we feel we need to add some adjustments to the sensor preparations: First, we need to understand that one of the key differentiating point is the accuracy and feature set. The main usage in game/accessibility is "multi-axis movement controlling", with a certain threshold of tolerance in accuracy, especially in games. Thus, the device is required to be continuously probe x-y-z plane directions as an output of a brainwave. Meanwhile, our project will require quantifying mental state. We need to know which of the emotional and mental state of a person riding subway that might be significant to our study, as well as maintaining the state in which the sensor can or cannot measure. For instance, as we know that level of focus and tension is something that we need and can observe, we need to define calibration steps as the next step of our experiment. As calibrating mental state is significantly more complicated than defining x-y-z plane[4], we also need evaluate our first pilot study / data collection test and see whether or not the calibration process is satisfying. Second, in the research domain, sensors that are mainly adopted by researchers are mainly dedicated only for research, like mynd which is equipped by higher quality sensors to be able to gain more accuracy with more security[3]. In our project, we use lower-end sensor, neurosky mindwave, which we think is a sweet spot between research-kit peripheral and consumer product. This, while expose the product to be more

ITP GT 2729 The Quantified Self About Town Dimas Rinarso Putro ([email protected]) | Kania Azrina ([email protected])
error-prone in terms of calibration . Moreover, as discussed in [1,2,3], the use of inappropriate sensor with insufficient security level will also contribute to possibility of privacy breach. We need to add the functionality to make sure the data is completely anonymous and does not contain more personal data other than mental state, that will be exposed to public in aggregated manner. Next, we need to define the social aspect of a train rider in NYC, and combine this approach when evaluating the first pilot study. Then we decide whether we need to offload brainwave measurement into more manual input apps/survey. CONCEPT Our project is aimed to provide quantified information of New York commuters according to their mental engagement during the trip in most popular public transportation in town, the underground train. Using mindwave brain sensor and arduino/mobile handheld, we will measure the rider’s mental engagement in major NYC subway lines during several different time ranges, and then compare the finding. Our project is expected to classify the subway line’s pleasant level by correlating several external predictors, such as:
● number of passengers (obtained from MTA API/turnstile), ● Noise level, ● Gas/smells, ● Vibration/bumpiness ● profile of the passenger (estimation/survey), ● characteristic of a train, ● popular destinations throughout the line, ● number of street entertainers, ● etc.
Due to the limitation of time and resource during the prototyping phase, we decided to take into account two sensor equipment, brainwave sensor and accelerometer data. HARDWARE
● Mindwave brain wave sensor ● iPhone or Android Phone
SOFTWARE
● iOS Apps for manual complaints and timer CHALLENGES
● Accuracy and calibrations of the Mindwave sensors. ● Power source to accommodate data collection for full day experiments. ● Limitations to the number of sample and the consistency of the data. ● Low penetration potential for the IOS and sensors to be natively used by subway commuters in a
large scale. ● Unavailability of GPS in underground, requires more user interaction during the lifelogging. ● Multiple other factor that can affect brain activity are subject to parameters beyond the scope of
experiments:

ITP GT 2729 The Quantified Self About Town Dimas Rinarso Putro ([email protected]) | Kania Azrina ([email protected])
● Diversity of human thinking behavior and characteristic. : ○ Variance of traffic pattern that may occur under different observation time. ○ Bias in level of concentration of each individual. ○ Difficulties in determining whether level of attention interprets the human emotion,
whether it is level of stress, excitements, nervous, focus etc. ○ Initial expectation or paradigm. This is related to user’s tolerance with New York’s subway.
For instance, tourists/newcomers might have higher chance of being in a stressful condition while commute.
DATA PREPARATION The preparation process that worth the explanation is the use of GIS technology to interpolate the number of the measured sensor data into the normalized points across the multi-line polygon of subway line between the desired train stations. The shapefile for the NYC subway route was adopted from the Spatiality website [8]. Our methods involved ArgGIS automation to interpolate the vector unit distance between the desired train stations by dividing the multiline in to number of points depending on the level of granularity the user made by the phone apps. This step is crucial to get the spatial information that is impossible to get using any electronic geolocation sensor, since NYC subway does not support either GPS or internet/cellular/Wireless triangulation method.

ITP GT 2729 The Quantified Self About Town Dimas Rinarso Putro ([email protected]) | Kania Azrina ([email protected])
Figure 2. Auto-interpolation method in replace of GPS technology To acquire the brainwave data, there were three volunteers that were riding the subway using the Mindwave sensor and holding an iPhone device that acts as accelerometer sensor. The volunteers and their brief background can be seen in Table 1. The volunteers also given some directions during the experiment, such as they’re not allowed sit because while riding subway line 2 in general there will be no seat available after 42nd street.
Table 1. Rail Sense Volunteers
Women, 23 Years Old, Lives in Roosevelt Avenue
Women, 29 Years Old, Lives in West 4 Street
Women, 23 Years Old, Lives in Financial District
SUBWAY LINES AND MEASUREMENT RULES

ITP GT 2729 The Quantified Self About Town Dimas Rinarso Putro ([email protected]) | Kania Azrina ([email protected])
We tried to conduct this research by extending the prior civic-tect study done by straphangers group [6], and picked some lines that were highlighted in that website. From the website, we know that the “best” and the “worst” line, assessed from their service performance such as the time punctuality, the quality of the car and so on. Below are the selected lines that we wanted to perform our measurement at:
● 2 train from Atlantic Av to 72nd Street ● 7 train from Roosevelt Av to Times Square ● E train from Grand Av to 14th Street ● F Train from West 4 to Roosevelt Av
As the preceding study has shown, 2 was the worst line and 7 was the best line in 2014 [6]. MEASUREMENT RESULT We started the measurement by defining the calibration required to maintain the brain wave sensor data to be accurate across different users. This could be acquired by calculating mean average to shape better classification of the attention level. This method could be achieved by applying 5-10 minutes pre-measurement test to user under the most relax state (by putting classical music to the user in a relatively quiet place). This type of measurement support the calibration process in [2], where calibration of the brain wave was applied to each user before the measurement. We continued to improve the data cleaning steps for the accelerometer by normalizing the accelerometer X value (as it best represents the movement in trains) into 0 as the median and calculate the absolute values to get the spikes of the horizontal forces during the trip. First, we designed a new variable called mentalstate which comprises the absolute delta of attention and meditation level, but we could not find supporting studies and statistical significance from this method, and thus decided to eliminate the necessity of defining new parameter and only focus of the attention level.

ITP GT 2729 The Quantified Self About Town Dimas Rinarso Putro ([email protected]) | Kania Azrina ([email protected])
Figure 3. Time series of brain wave sensor (attention level) VS accelerometer data
By observing the time series and the correlation plot of the newly adjusted accelerometer VS attention level we could observe that the overall correlation trend is positive. However, we thought further statistical research is required since the R-squared is not sufficiently high at 0.231 to say that those two features are highly correlated.
ITP GT 2729 The Quantified Self About Town Dimas Rinarso Putro ([email protected]) | Kania Azrina ([email protected])
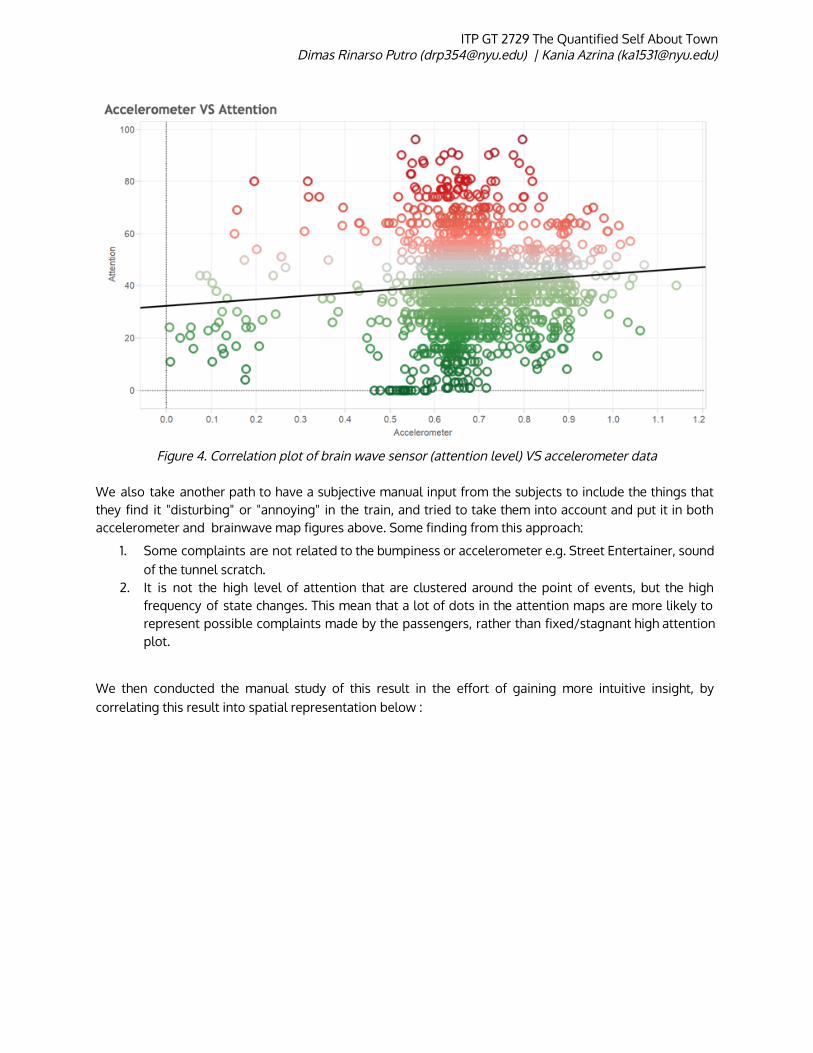
Figure 4. Correlation plot of brain wave sensor (attention level) VS accelerometer data
We also take another path to have a subjective manual input from the subjects to include the things that they find it "disturbing" or "annoying" in the train, and tried to take them into account and put it in both accelerometer and brainwave map figures above. Some finding from this approach:
1. Some complaints are not related to the bumpiness or accelerometer e.g. Street Entertainer, sound of the tunnel scratch.
2. It is not the high level of attention that are clustered around the point of events, but the high frequency of state changes. This mean that a lot of dots in the attention maps are more likely to represent possible complaints made by the passengers, rather than fixed/stagnant high attention plot.
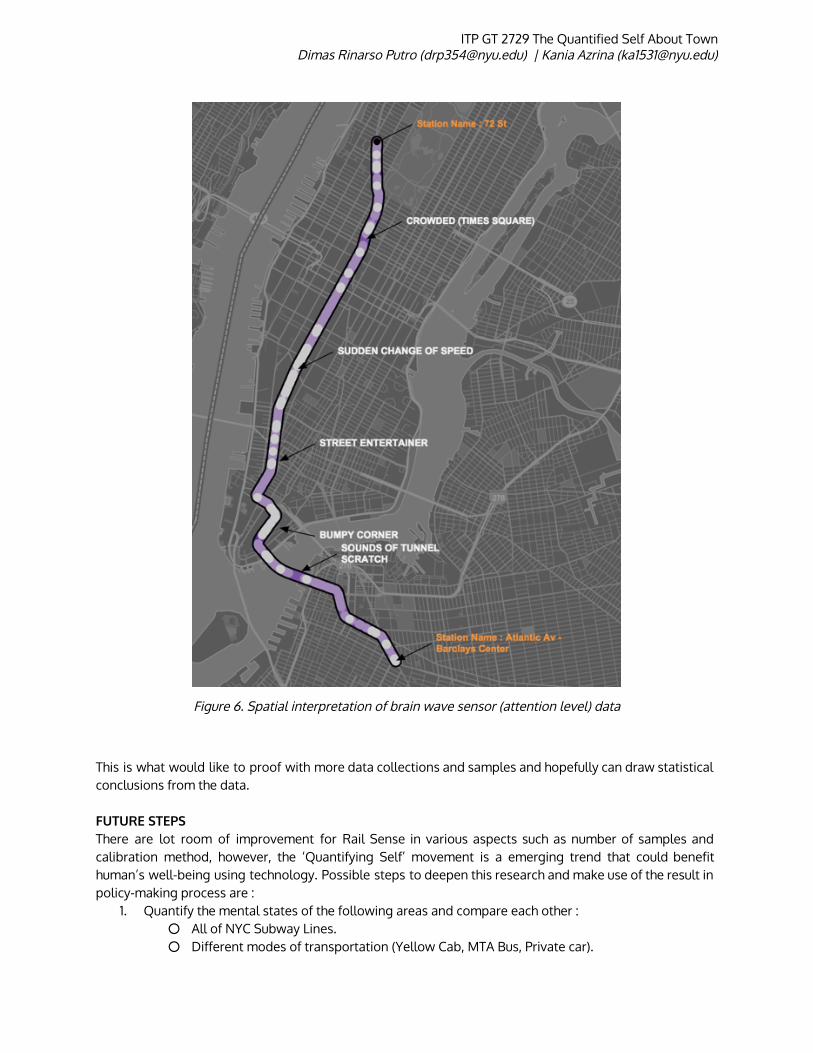
We then conducted the manual study of this result in the effort of gaining more intuitive insight, by correlating this result into spatial representation below :

ITP GT 2729 The Quantified Self About Town Dimas Rinarso Putro ([email protected]) | Kania Azrina ([email protected])
Figure 5. Spatial interpretation of accelerometer data
ITP GT 2729 The Quantified Self About Town Dimas Rinarso Putro ([email protected]) | Kania Azrina ([email protected])
Figure 6. Spatial interpretation of brain wave sensor (attention level) data
This is what would like to proof with more data collections and samples and hopefully can draw statistical conclusions from the data. FUTURE STEPS There are lot room of improvement for Rail Sense in various aspects such as number of samples and calibration method, however, the ‘Quantifying Self’ movement is a emerging trend that could benefit human’s well-being using technology. Possible steps to deepen this research and make use of the result in policy-making process are :
1. Quantify the mental states of the following areas and compare each other : ○ All of NYC Subway Lines. ○ Different modes of transportation (Yellow Cab, MTA Bus, Private car).
ITP GT 2729 The Quantified Self About Town Dimas Rinarso Putro ([email protected]) | Kania Azrina ([email protected])
○ Subway or other public transportation from other cities, United States or outside. 2. Propose the improvised platform to NYC DoT Analytics Team to evaluate the quality of subway
periodically in real-time. 3. Develop API from RailSense to be used by transportation planning app such as Google Maps or
MoveIt. For example, for every mode of transportation options there will be another index or score that is derived from RailSense data and can be used for user to decide which transportation method they’re going to use.
Bibliography
1. Bonaci, Tamara, Ryan Calo, and Howard Jay Chizeck. "App Stores For The Brain: Privacy & Security In Brain-Computer Interfaces." 2014 IEEE International Symposium On Ethics In Science, Technology & Engineering (2014): 1. Publisher Provided Full Text Searching File. Web. 30 Apr. 2015.
2. Martinovic, Ivan, Doug Davies, Mario Frank, Daniele Perito, Tomas Ros, and Dawn Song. "On the Feasibility of Side-Channel Attacks with Brain-Computer Interfaces." Proceedings of the 21st USENIX Security Symposium (2012).
3. Pradeep, A K. "The Neuro Revolution." Nielsen Report. Nielsen, 12 June 2012. Web. 30 Mar. 2015. <http://www.nielsen.com/content/dam/corporate/mx/reports/2012/Secrets for Selling to the Subconscious Mind.pdf>.
4. Grizou, J. ( 1 ), et al. "Calibration-Free BCI Based Control." Proceedings Of The National Conference On Artificial Intelligence 2.(2014): 1213-1220. Scopus®. Web. 7 Apr. 2015.
5. Wong, Chris. "Visualizing the MTA’s Turnstile Data." Chris Whong Blog. 24 Apr. 2013. Web. 30 Apr. 2015. <http://chriswhong.com/open-data/visualizing-the-mtas-turnstile-data/>.
6. "Profiles of 20 Subway Lines." State of the Subways 2014. Straphangers, 1 July 2014. Web. 30 Apr. 2015. <http://www.straphangers.org/statesub14/>.
7. Bradley, Joseph. "When IoE Gets Personal: The Quantified Self Movement!" Cisco Blog RSS. Cisco Systems, 10 Sept. 2013. Web. 30 Apr. 2015. <http://blogs.cisco.com/zzfeatured/when-ioe-gets-personal-the-quantified-self-movement>.
8. Romalewski, Steven. "MTA Subway Data in GIS Format." Spatiality. 8 July 2010. Web. 30 Apr. 2015. <http://spatialityblog.com/2010/07/08/mta-gis-data-update/>.


![[DRAFT, PRE-FINAL OR FINAL] REPORT - OECD](https://img.dokumen.tips/doc/110x75/5ec770f8c7c9f9670a3f7375/-draft-pre-final-or-final-report-.jpg)