Embed Size (px)
Citation preview

VMware ROI TCO Calculator:Overview & Sample Analysis
© 2011 VMware Inc. All rights reserved

Table of ContentsTable of Contents
Calculator OverviewSample analysis:• Expected ROI/TCO analysis (forward looking)
• Realized ROI/TCO analysis (backward looking)
• Hybrid ROI/TCO analysis (mix of backward & forward)
Addi i l RAdditional Resources
2

VMware products covered
CapEx OpEx Business AgilityS i CapEx OpEx Business AgilityServer HW Storage HW Networking
HWInfrastructure
Admin Productivity
Power & Cooling
Rack Space & Office Space
Planned Downtime
Unplanned Downtime
Business Downtime
Cloud Services vCloud $ $ $ $ $ $ $
Savings
ProductsJourney &
Cloud Services Delivery
vCloudDirector $ $ $ $ $ $ $Chargeback $ $ $ $ $
Desktop Vi t li ti
View $ $ $ $
3
Virtualization $ $ $ $Business Continuity & Disaster Recovery
Site Recovery Manager $ $ $
Operations Management, Security & Compliance
CapacityIQ $ $ $ $ $AppSpeed $ $vShield App $ $ $
2
vShield App & Edge $ $ $
Server Virtualization
vSphere & vCenterServer
$ $ $ $ $ $ $ $ $1
“$” represents possible savings• Supported by succinct modules within calculator to help users evaluate
3

Methodology
Total Cost
Before minusTotal Cost
After equals Savings
There are two main outputs for this calculator:• Return on Investment
• Equals Savings / Investment• …where investment represents the sum of incremental investment
in transition from physical to virtual (new servers, shared storage, VMware licenses, services and training, etc.)
• Total Cost of Ownership• Inclusive of IT Administration and downtime costs
4
Inclusive of IT Administration and downtime costs

Design & Scope
D iDesign• We are striking a balance between simplicity and credibility
Too complex, and the analysis becomes difficult
to explain and repeatSimplicity
Too Simple and customers will not find Credibility
• Cash basis: no depreciation, amortization, time value discounting• Standardized time horizon: 5 year analysis
outputs credibleCredibility
• Standardized time horizon: 5 year analysis
Scope• ROI TCO Calculator is not meant to generate a definitive bill of goodsROI TCO Calculator is not meant to generate a definitive bill of goods
• Our goal is to provide a credible understanding of cost and benefits• Users may need to engage additional resources (sales / finance) for transactions that
require more custom models
5
require more custom models

Return on Investment (ROI)
% t i t t i d t t iti t i t li d% return on investment required to transition to virtualized infrastructure
• CapExTotal Savings• OpEx• Downtime…reference slide 3 for more detail
1Total InvestmentTotal Investment• New Servers, Storage,
Network Switches• VMware License & Support• Services & Training
6

Total Cost of Ownership (TCO)
C t i t d ith ti f d t tCosts associated with operation of datacenter
CapExp• Servers• Storage• Network Switches• Network Switches
OpExOpEx• Power & Cooling• IT Administration Labor• Rack Space• Rack Space
Business Agilityus ess g ty• Planned Downtime• Unplanned Downtime• Business Downtime
7
• Business Downtime

Workflow: Server Virtualization
M A l i
Start / Login
My Analysis(create or open prior
analysis)
Server Virtualization
1) Server Configuration
Define configurations of physical servers, count of
workloads, and consolidation Capacity IQConfiguration
2) Server Consolidation
workloads, and consolidation ratio
Modules for 5 basic datacenter elements: Server HW, Power & Cooling, Storage, Networking,
Rack Space
AppSpeed
3) Product Selection
Select edition of vSphere / vCenter Server, and define
level of SnS, discounts, input historical or ELA data
Based on edition of vSphere
vShield App & Edge
4) Beyond Server Consolidation
5) ROI
pselected, calculator provides additional modules to review benefits of advanced features
Summary of vSphere & vCenter Server Investment, Savings, ROI and estimated Payback
Site Recovery Manager
vCloud Director & ChargebackROI and estimated Payback
Period over 3 years and 5 years& Chargeback
End / Analysis Summary
(charts, tables, export)
Choose to include additional management products. Product calculations leverage prior inputs
and provides incremental ROI/TCO
8

Workflow: Desktop Virtualization
M A l i
Start / Login
My Analysis(create or open prior
analysis)
Desktop Virtualization
1) Desktop Configuration
Define configurations of physical servers, count of
workloads, and consolidation
*Please Note:Configuration
2) Desktop Virtualization
workloads, and consolidation ratio
Modules for 5 basic datacenter elements: Server HW, Power & Cooling, Storage, Networking,
Rack Space
• Desktop Virtualization must be selected during New Analysis Creation
U ill t b bl t dd3) Product
Selection
4) Premier Edition
Select edition of vSphere / vCenter Server, and define
level of SnS, discounts, input historical or ELA data
Based on edition of vSphere
• Users will not be able to add Desktop Virtualization to an existing Server Virtualization only analysis later
4) Premier Edition Advanced Features
5) ROI
pselected, calculator provides additional modules to review benefits of advanced features
Summary of vSphere & vCenter Server Investment, Savings, ROI and estimated PaybackROI and estimated Payback
Period over 3 years and 5 years
End / Analysis Summary
(charts, tables, export)
9

Module Elements
Example: Server Virtualization > Power & Cooling Summary table, with key metrics, updates as users make changes and completes each module
Key assumptions for each module are distilled and grouped together in
1
2
1
distilled and grouped together in hidden assumptions tab—click to unhide
Scenario A represents extension of environment without benefit of vSphere
38
23
vSphere
Scenario B represents environment as users transition workloads to virtualized infrastructure
(A – B) is the variance in Costs
4
5
4
(A B) is the variance in Costs calculated in two scenarios, and represents savings for module
Each module has a text box at the bottom to provide some context to module analysis and or assumptions
5
6
6
module analysis and or assumptions
Links along the bottom direct users to additional resources
Go to Analysis Summary for supporting charts and tables, including
57
8
7
Green Savings, and Cost per App comparison to competing platforms. Users will also find document export functions here
10

Table of ContentsTable of Contents
Calculator OverviewSample analysis:• Expected ROI/TCO analysis (forward looking)
• Realized ROI/TCO analysis (backward looking)
• Hybrid ROI/TCO analysis (mix of backward & forward)
Addi i l RAdditional Resources
11

Server Virtualization
Define number of workloads and configuration of host servers assuming no virtualization (Year 0)
Define number of workloads and configuration of host servers assuming
1
2
1) Server Configuration
configuration of host servers assuming 100% virtualized
Max Consolidation Ratio is a key part of this analysis…
…Open assumptions tab and adjust
3
4
41
…Open assumptions tab and adjust VM’s per Core variable to refine. There is also an option here to change analysis to one based on leased servers (avg price per server then represents the annual lease cost)
4
2
3
12

Server Virtualization
Number of workloads defined in previous module is the starting number in this module. Refine number of workloads thru Year 5 in Assumptions tab:
12) Server Consolidation > Server Hardware (part 1)
• Change annual growth rate (linear)
• For non-linear growth, locate switch for “manually adjust count of workloads”, change to “yes”, close tab and input values into module
1
2
tab, and input values into module
By default, analysis assumes 100% refresh based on average useful life and average age assumptions. Define a staggered refresh if necessary in Assumptions tab:
2
2 Assumptions tab:
• Locate switch for “manually adjust count of servers retired”, change to “yes”, close tab, and input values into module
3
By default, analysis assumes 100% of workloads are migrated to virtualized infrastructure in Year 1. Adjust % virtualized to define a different schedule for migration
3
13

Server Virtualization
Manually adjust count of workloads
• By default, calculator assumes a linear workload growth rate—first assumption at the top of assumptions tab
12) Server Consolidation > Server Hardware (part 2)
assumptions tab
• For non-linear growth, locate switch for “manually adjust count of workloads”, change to “yes”, close tab, and input values into module
Manually adjust count of host servers?
• By default, calculator assumes a constant consolidation ratio each year, post-virtualization
2
12
• To define a changing consolidation ratio each year, change to “yes”, close tab, and input values into module
Manually adjust host servers retired?3
3
• By default and for simplicity, calculator uses useful life and average age assumptions to determine 100% refresh of servers
T d fi t d f h (
Caution: enabling all three functions adds great deal of flexibility to customize analysis, but calculator may not be able to guarantee • To define a staggered refresh (eg.
1/3 of starting count of servers, spread out over three years), change to “yes”, close tab, and input values into module
but calculator may not be able to guarantee logic in module is correct under all scenarios.
Users will be required to review to ensure changes lead to desired results.
14
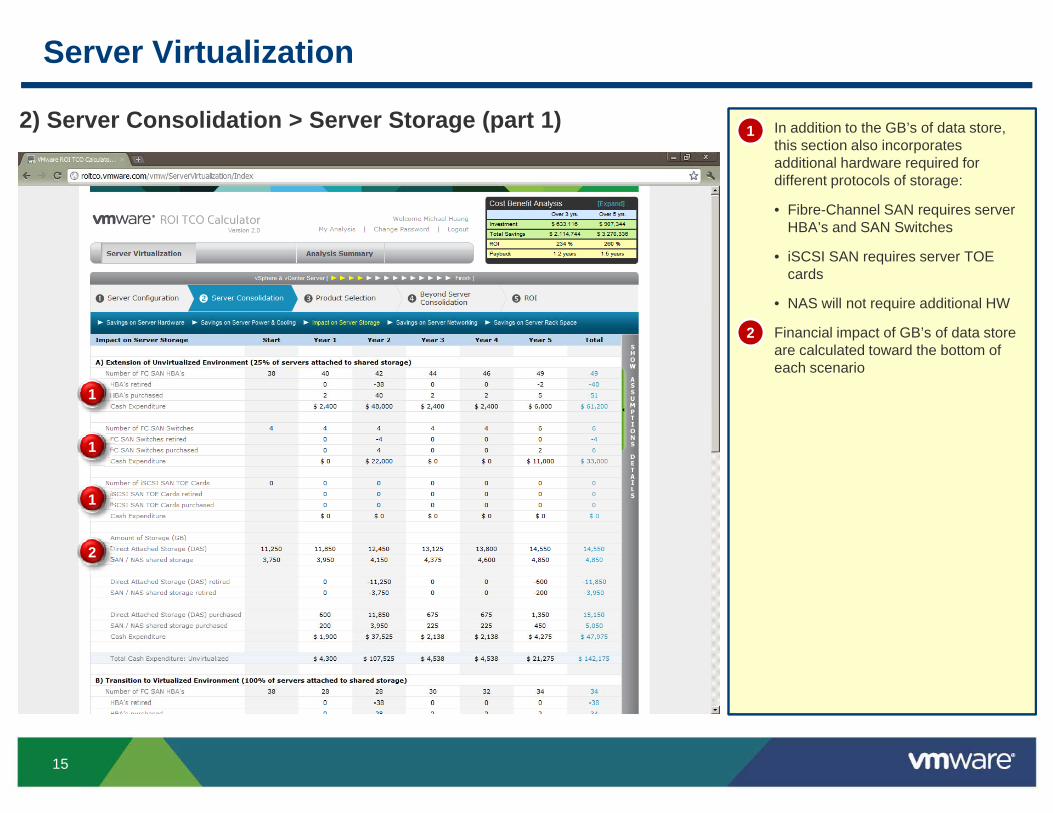
Server Virtualization
In addition to the GB’s of data store, this section also incorporates additional hardware required for different protocols of storage:
• Fibre Channel SAN requires server
12) Server Consolidation > Server Storage (part 1)
• Fibre-Channel SAN requires server HBA’s and SAN Switches
• iSCSI SAN requires server TOE cards
• NAS will not require additional HW
1
NAS will not require additional HW
Financial impact of GB’s of data store are calculated toward the bottom of each scenario
2
1
1
2
15

Server Virtualization
Users can define the transition to and increased shared storage environment. Many of vSphere’sadvanced features such as vMotion and Distributed Resources Scheduler
12) Server Consolidation > Server Storage (part 2)
are enabled by and require shared storage. Depending on whether the environment in this analysis starts with no shared storage or already has shared storage, the transition to a virtualized infrastructure with 100%
1
virtualized infrastructure with 100% shared storage, may require significant investment in additional hardware (FC SAN and iSCSI SAN). Two areas for users to define if there will be shared storage, and the degree of the transitiontransition
Next, users can select applicable shared storage protocols, and define the mix (input box(es) for %’s) to the right
212 2
Important for users to specify the average size of workloads in the lower-left corner of assumptions tab. Here too, users can choose to include storage savings from Thin Provisioning f t ithi S h ( t if t
3
feature within vSphere (zero out if not applicable, or leveraging at the storage array level)
3
16

Server Virtualization
Cycling through each vSphere edition in the list box, users will be able to see which advanced features are included below
13) Product Selection > vSphere edition selection (part 1)
1
17

Server Virtualization
Select the level of Support & Subscription and define number of years
Define any applicable discounts (standard discounts available for
13) Product Selection > vSphere edition selection (part 2)
2(standard discounts available for government agencies and academic institutions) for license and SnS
For Enterprise License Agreements (ELA’s), enable checkboxes above to input contract amounts into input
1
input contract amounts into input boxes below.
• For a $200,000 three year ELA, enable checkboxes above Years 1 to 3, and input $200,000 into Year 1
2
• Based on growth of workloads defined in Server HW section, calculator will then estimate additional licenses and SnS required for Years 4 and 5
1 2
3• To exclude calculator estimates for
Years 4 and 5, enable checkboxes for those years--the default value for input boxes once enabled is zero
3
18

Server Virtualization
Unhide assumptions tab to select/deselect and or adjust cost of services and training through Planning and Design
For annual services such as P2V
13) Product Selection > vSphere edition selection (part 3)
2 For annual services such as P2V Acceleration and Health Checks, users will be able to adjust cost per server to derive total cost for each year with input boxes in main module
If PSO credits are applicable enabling
2
3
1
If PSO credits are applicable, enabling input boxes at the bottom of main module will over-ride itemized costs calculated above
3
22
3
2
3
19

Server Virtualization
Unhide assumptions tab to adjust assumptions regarding labor savings from faster provisioning
Labor savings, calculated as the difference between labor required with
14) Beyond Server Consolidation > Server Provisioning Labor
2difference between labor required with and without vSphere virtualization, is the first value calculated
Faster provisioning translates into a reduction in end-user wait time. This is the value of Business Agility
3
1
is the value of Business Agility. Default assumption is that 40% of reduction in time spent on provisioning is returned to the business
2
3
20

Server Virtualization
Unhide assumptions tab to adjust assumptions regarding downtime savings from planned server maintenance events
Planned Downtime savings calculated
14) Beyond Server Consolidation > vMotion
2 Planned Downtime savings, calculated as the difference between downtime required with and without vSphere virtualization, is the value calculated
2
1
22
21
Server Virtualization
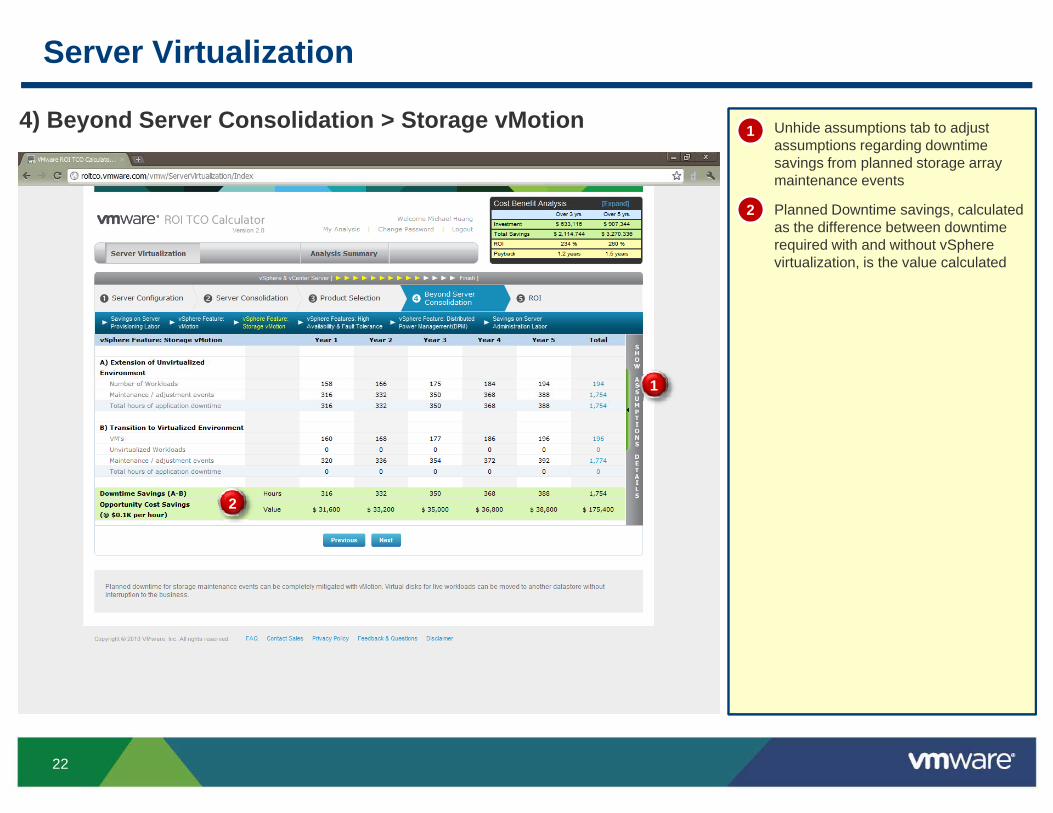
Unhide assumptions tab to adjust assumptions regarding downtime savings from planned storage array maintenance events
Planned Downtime savings calculated
14) Beyond Server Consolidation > Storage vMotion
2 Planned Downtime savings, calculated as the difference between downtime required with and without vSphere virtualization, is the value calculated
2
1
22
22

Server Virtualization
Unhide assumptions tab to adjust assumptions regarding downtime savings from unplanned events
• High Availability does not require any additional capital expenditures
14) Beyond Server Consolidation > High Availability & Fault Tolerance
any additional capital expenditures, and helps to automatically restart servers due to OS or HW failures
• Downtime savings from virtualization and High Availability are not always positive due to consolidation ratios
2
1
positive due to consolidation ratios—when a virtualized host server fails, it will bring down multiple workloads which may not be completely offset by ability to restart VM’s faster
• This downtime can be fully mitigated3 • This downtime can be fully mitigated with Fault Tolerance (FT) for mission critical workloads, but requires additional servers to host live shadow VM’s for failover—additional capital expenditures are
3
calculated when FT is enabled in assumptions tab
Application downtime mitigated translates into a reduction in end-user wait time. This is the value of
4
Business Agility. Default assumption is that 40% of reduction in downtime savings is returned to the business2
3
4
23
4

Server Virtualization
Unhide assumptions tab to adjust assumptions applicability of distributed power management to further consolidate inactive workloads and power down excess servers during
14) Beyond Server Consolidation > Distributed Power Mgmt
nights and weekends
Incremental Power & Cooling savings calculated here
2
1
22
24

Server Virtualization
Unhide assumptions tab to adjust assumptions regarding labor savings from advanced management features in vSphere
Labor savings calculated as the
14) Beyond Server Consolidation > Server Admin Labor (part 1)
2 Labor savings, calculated as the difference between labor required with and without vSphere virtualization, is the first value calculated
Faster administration translates into a reduction in end user wait time This
2
3
1
reduction in end-user wait time. This is the value of Business Agility. Default assumption is that 40% of reduction in time spent on administration is returned to the business
22
3
25

Server Virtualization
The number of Workloads per FTE Administrator, regardless of silo (server, storage, network, application, etc.), is the measure of administration productivity here. Most VMware
14) Beyond Server Consolidation > Server Admin Labor (part 2)
customers have already virtualized a portion of their datacenters, and can readily speak to the difference productivity—input values here.
For users who are new to 2
1
virtualization, we have surveyed customers and VMware’s own IT Administrators, and have provided a way to calculate incremental added productivity from various advanced management features available inmanagement features available in vSphere Enterprise+. Enter the “Existing – unvirtualized” metric in section 1, and adjust values in section 2 to derive metric for “New –virtualized.”2Faster administration translates into a reduction in end-user wait time. This is the value of Business Agility. Default assumption is that 40% of reduction in time spent on
d i i t ti i t d t th
3
administration is returned to the business
3
26

Server Virtualization
The final module in Server Virtualization provides details into the ROI starting with required Investments at the top. For VMware Software License & Support in this example, $
15) ROI (part 1)
$129K of spend is required in Year 1. Then depending on time horizon (3 Years vs. 5 Years), users can see additional spend required for Years 2 and beyond, due to workload growth defined in Server Hardware module.
1
defined in Server Hardware module.
Users will find input boxes for Other Investments not accounted for in the calculator. Also, should there be any sales tax considerations, tax rates can be adjusted here.
23
be adjusted here.
Click on this button to bring up menu of additional server virtualization management products to add to analysis:
3
• CapacityIQ
• AppSpeed
• Site Recovery Manager
• vShield EdgevShield Edge
• vShield Endpoint
• Chargeback
• vCloud Director
2
27

Server Virtualization
Towards the bottom half of this module, users will find detail on Savings calculated
Users will also find input boxes for Other Savings not accounted for in the
15) ROI (part 2)
2Other Savings not accounted for in the calculator
Finally, Investment and Savings enable for the calculation of ROI as well as Payback Period
3
1
2
3
28

Server Virtualization
Analysis Summary provides additional charts and tables to collect and present results of all products reviewed
• Cumulative Investment Savings &
1Analysis Summary
• Cumulative Investment, Savings & ROI provides a view into results, each year, over the 5 year analysis horizon
• Distribution of Savings: 5 Year Total provides a quick snapshot of where
2
1provides a quick snapshot of where users can expect to savings
• Distribution of Investment: 5 Year Total provides a quick snapshot of where users will need to invest
• Total Cost of Ownership: 5 Year Total (1) compares CapEx, OpEx, and Other (downtime, tax, other user-defined costs) expenses between a fully Physical datacenter and one with the benefits ofand one with the benefits of Virtualization
• Total Cost of Ownership: 5 Year Total (2) again compares CapEx, OpEx and Other expenses, but with
d d l itexpanded granularity
Charts Data provides all back-up data behind charts
2
29

Table of ContentsTable of Contents
Calculator OverviewSample analysis:• Expected ROI/TCO analysis (forward looking)
• Realized ROI/TCO analysis (backward looking)
• Hybrid ROI/TCO analysis (mix of backward & forward)
Addi i l RAdditional Resources
30

Server Virtualization
For a Realized ROI analysis a key assumption is the virtualization schedule that defines how many physical workloads are transitioned to virtual machines each year
12) Server Consolidation > Server Hardware (part 1)
Adjust percentages until count of workloads matches known history
1
31

Server Virtualization
Manually adjust count of workloads
• By default, calculator assumes a linear workload growth rate—first assumption at the top of assumptions tab
12) Server Consolidation > Server Hardware (part 2)
assumptions tab
• For non-linear growth, locate switch for “manually adjust count of workloads”, change to “yes”, close tab, and input values into module
Manually adjust count of host servers?
• By default, calculator assumes a constant consolidation ratio each year, post-virtualization
2
12
• To define a changing consolidation ratio each year, change to “yes”, close tab, and input values into module
Manually adjust host servers retired?3
3
• By default and for simplicity, calculator uses useful life and average age assumptions to determine 100% refresh of servers
T d fi t d f h (
Caution: enabling all three functions adds great deal of flexibility to customize analysis, but calculator may not be able to guarantee • To define a staggered refresh (eg.
1/3 of starting count of servers, spread out over three years), change to “yes”, close tab, and input values into module
but calculator may not be able to guarantee logic in module is correct under all scenarios.
Users will be required to review to ensure changes lead to desired results.
32

Server Virtualization
To input historical spend for VMware Software + SnS, toggle check boxes to enable applicable input boxes
• For a three years of history with $50 000 in spend each year enable
13) Product Selection > vSphere edition selection (part 1)
$50,000 in spend each year, enable checkboxes above Years 1 to 3, and input $50,000 into Years 1, 2 and 3
• To exclude calculator estimates for Years 4 and 5, enable checkboxes for those years the default value forfor those years--the default value for input boxes once enabled is zero
• If analysis is expanded to include server management products, include historical costs of those products here and set discounts toproducts here and set discounts to 100% in respective management product modules to zero out additional calculator spend estimates
11
33

Server Virtualization
To input historical spend of Services + Training, toggle check boxes to enable applicable input boxes
• For a three years of history with $10 000 in spend each year enable
13) Product Selection > vSphere edition selection (part 2)
$10,000 in spend each year, enable checkboxes above Years 1 to 3, and input $10,000 into Years 1, 2 and 3
• To exclude calculator estimates for Years 4 and 5, enable checkboxes for those years the default value forfor those years--the default value for input boxes once enabled is zero
11
34

Server Virtualization
In Analysis Summary > Charts Data > Distribution of Investments, users can verify that inputs of historical spend for VMware Software + SnS and Services + Training have been aggregated
1Analysis Summary (part 1)
accurately by the calculator
1
35

Server Virtualization
In Analysis Summary > Charts > Chart 1, Realized results (Investment, Savings, ROI) for Years 1, 2 and 3 are graphed
Cumulative results for three years of
1Analysis Summary (part 2)
22 Cumulative results for three years of
history can also be found in small upper-right table, in the Over 3 yrs. column
2
1
36

Table of ContentsTable of Contents
Calculator OverviewSample analysis:• Expected ROI/TCO analysis (forward looking)
• Realized ROI/TCO analysis (backward looking)
• Hybrid ROI/TCO analysis (mix of backward & forward)
Addi i l RAdditional Resources
37

Server Virtualization
To input historical spend for VMware Software + SnS, toggle check boxes to enable applicable input boxes
• For a three years of history with $50 000 in spend each year enable
13) Product Selection > vSphere edition selection (part 1)
$50,000 in spend each year, enable checkboxes above Years 1 to 3, and input $50,000 into Years 1, 2 and 3
Leaving Years 4 and 5 unchecked will enable the calculator to estimate additional cost of vSphere and vCenter
2
additional cost of vSphere and vCenter Server required for those years based on workload growth and virtualization schedule defined in Server Hardware
Be sure to define any applicable discounts for Years 4 and 5 or
33discounts for Years 4 and 5 or calculator will estimate costs at list price
1 21 2
38
Server Virtualization
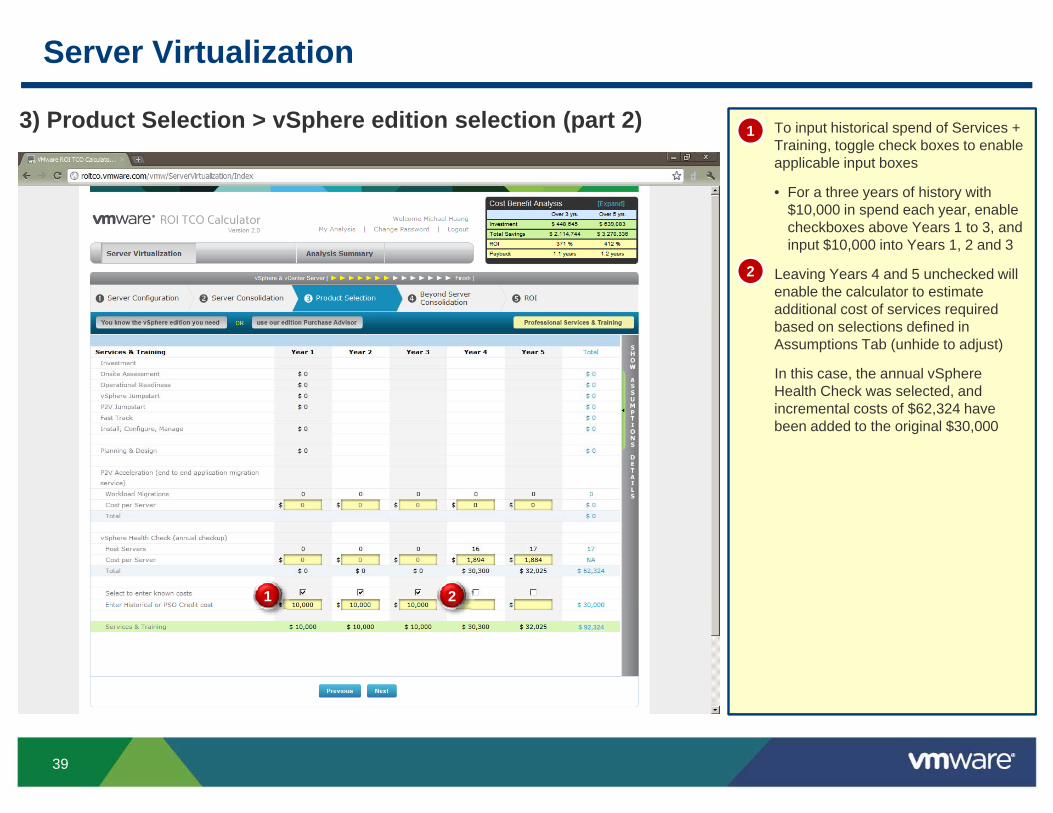
To input historical spend of Services + Training, toggle check boxes to enable applicable input boxes
• For a three years of history with $10 000 in spend each year enable
13) Product Selection > vSphere edition selection (part 2)
$10,000 in spend each year, enable checkboxes above Years 1 to 3, and input $10,000 into Years 1, 2 and 3
Leaving Years 4 and 5 unchecked will enable the calculator to estimate additional cost of services required
2
additional cost of services required based on selections defined in Assumptions Tab (unhide to adjust)
In this case, the annual vSphere Health Check was selected, and incremental costs of $62 324 haveincremental costs of $62,324 have been added to the original $30,000
1 2
$ 92,324
39

Server Virtualization
In Analysis Summary > Charts Data > Distribution of Investments, users can verify that inputs of historical spend and calculator estimates for VMware Software + SnS and Services +
1Analysis Summary (part 1)
Training have been aggregated accurately by the calculator
1
40
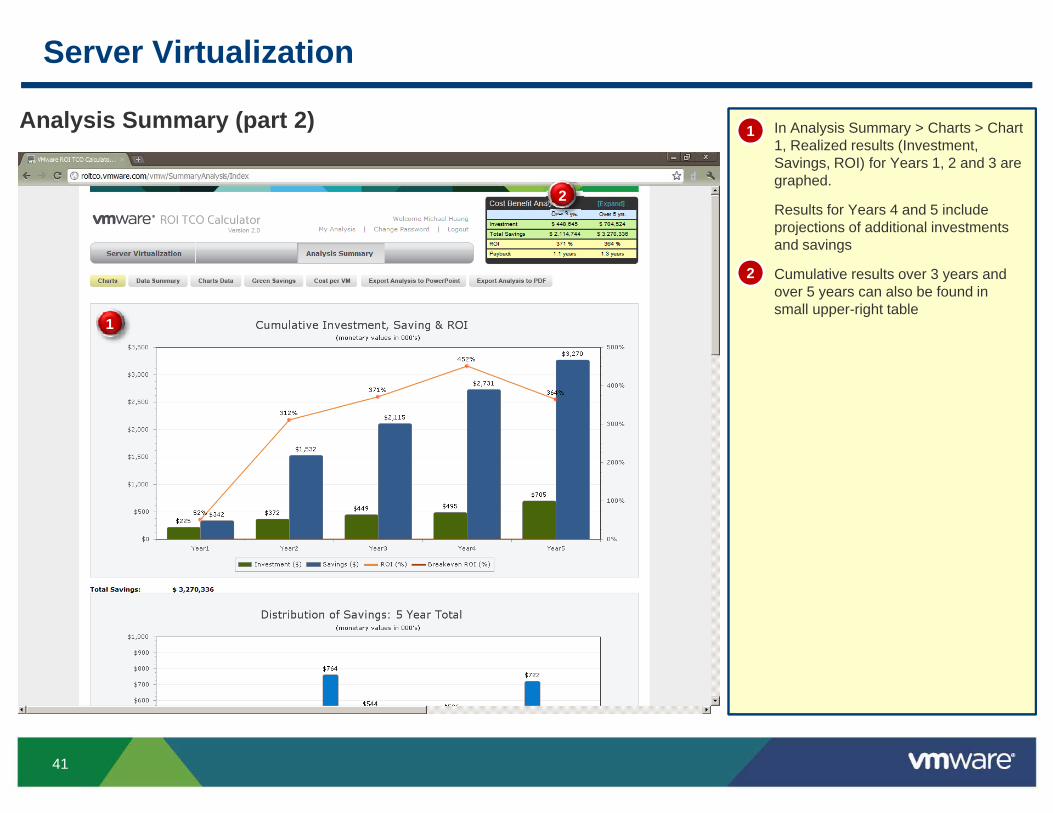
Server Virtualization
In Analysis Summary > Charts > Chart 1, Realized results (Investment, Savings, ROI) for Years 1, 2 and 3 are graphed.
Results for Years 4 and 5 include
1Analysis Summary (part 2)
2Results for Years 4 and 5 include projections of additional investments and savings
Cumulative results over 3 years and over 5 years can also be found in small upper right table
2
1small upper-right table
41
Table of ContentsTable of Contents
Calculator OverviewSample analysis:• Expected ROI/TCO analysis (forward looking)
• Realized ROI/TCO analysis (backward looking)
• Hybrid ROI/TCO analysis (mix of backward & forward)
Addi i l RAdditional Resources
42

Additional Resources
ROI TCO Calculator Website: roitco.vmware.comFrequently Asked Questions: FAQ documentFeedback & Questions: roitco.vmware.com/vmw/account/FeedbackQuestions
43