Embed Size (px)
DESCRIPTION
Improvement of conventional leather making processes to reduce the environmental impact
Citation preview
Improvement of conventional leather making processes to reduce the
environmental impact
Eduard Hernàndez Balada
Doctoral Thesis directed by
Dr. José Costa LópezDr. Jaume Cot Cosp
Programa de Doctorat d’Enginyeria del Medi Ambient i del ProducteBienni 2006-2008
Barcelona, 5 de febrer 2009
FACULTAT DE QUÍMICADEPARTAMENT D’ENGINYERIA QUÍMICA
The research included in this presentation was developed in its totality at the United States Department of Agriculture (USDA), Eastern Regional Research Center (ERRC) (Wyndmoor, PA).
Length of stay: From July 2005 thru October 2008
Research Unit: Fats, Oils and Animal Coproducts (FOAC)
Research Leaders: Dr. William N. Marmer and Dr. Daniel K.Y. Solaiman
CRIS (Current Research Information System) projects assigned:
1. New and efficient processes for making quality leatherProject number: 1935-41440-013-00DLead Scientists: Dr. William N. Marmer and Dr. Cheng-Kung LiuObjectives: Develop new technology for preparing hides for tanning. Establish drying and finishing processes and develop in-line nondestructive tests for improving the quality and durability of leather. Additional funding was obtained to expand the scope of hide preparation research by investigating ways to impart efficiency to short-term hide preservation (brine-curing).
2. Sustainable technologies for processing of hides, leather, wool and associated byproducts Project number: 1935-41440-014-00DLead Scientist: Dr. Eleanor M. BrownObjectives: 1. Functional modification, leather and leather byproducts. Develop a foundation for the use of new chemical and biochemical technologies (a) in the production of high quality chrome-free leathers; (b) in expanding the range of high value biomaterial applications for solubilized proteins from leather byproducts. 2. Functional modification, wool: modify wool to impart functionality for improved performance and expanded uses of domestic wool.
http://cris.csrees.usda.gov
TABLE OF CONTENTS
1. NEW AND EFFICIENT PROCESSES FOR MAKING QUALITY LEATHER
1.1. Introduction
• Hides and skins
• Preservation of raw hides and skins
1.2. Stratrigraphic study
1.3. Mathematical model
1.4. Degreasing study
2. SUSTAINABLE TECHNOLOGIES FOR PROCESSING OF HIDES, LEATHER, WOOL AND ASSOCIATED BYPRODUCTS
2.1. Introduction
• Fillers in the leather industry
2.2. Biopolymer study
2.3 Filler study
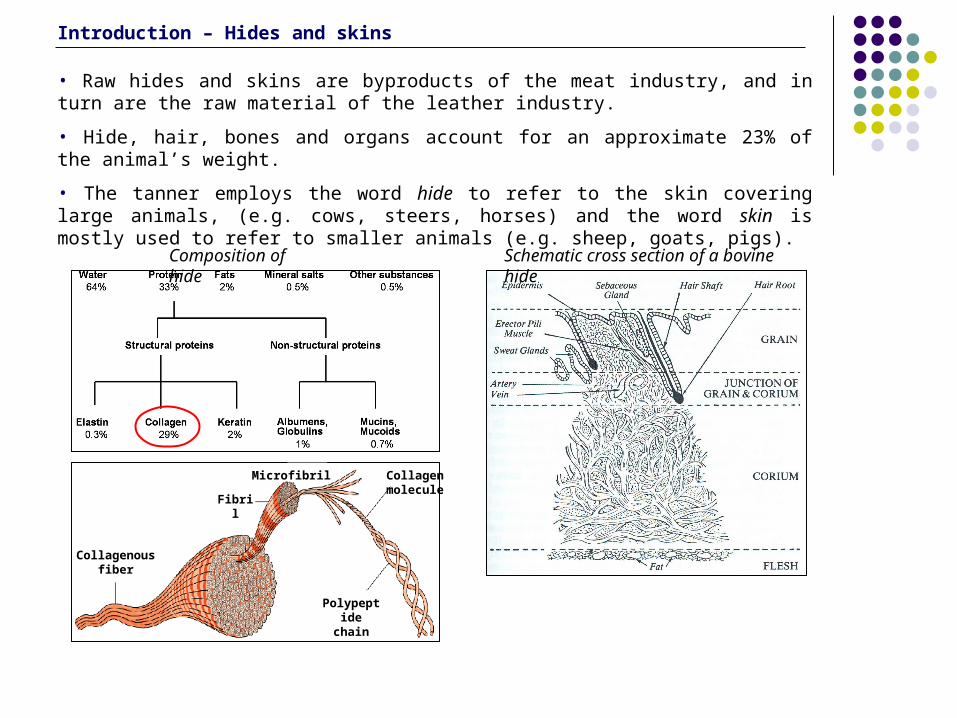
• Raw hides and skins are byproducts of the meat industry, and in turn are the raw material of the leather industry.
• Hide, hair, bones and organs account for an approximate 23% of the animal’s weight.
• The tanner employs the word hide to refer to the skin covering large animals, (e.g. cows, steers, horses) and the word skin is mostly used to refer to smaller animals (e.g. sheep, goats, pigs).
Schematic cross section of a bovine hideComposition of hide
Collagenous fiber
Fibril
Microfibril Collagen molecule
Polypeptide chain
Introduction – Hides and skins
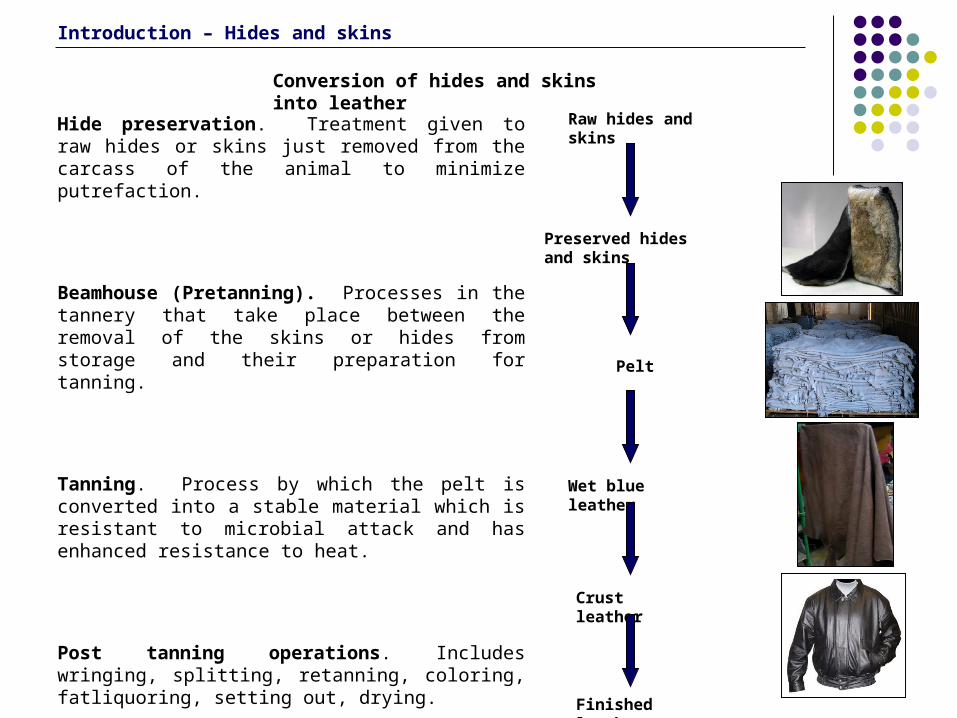
Hide preservation. Treatment given to raw hides or skins just removed from the carcass of the animal to minimize putrefaction.
Beamhouse (Pretanning). Processes in the tannery that take place between the removal of the skins or hides from storage and their preparation for tanning.
Tanning. Process by which the pelt is converted into a stable material which is resistant to microbial attack and has enhanced resistance to heat.
Post tanning operations. Includes wringing, splitting, retanning, coloring, fatliquoring, setting out, drying.
Finishing operations. The act of making completely tanned leather more attractive, serviceable and durable.
Raw hides and skins
Preserved hides and skins
Wet blue leather
Crust leather
Finished leather
Pelt
Introduction – Hides and skins
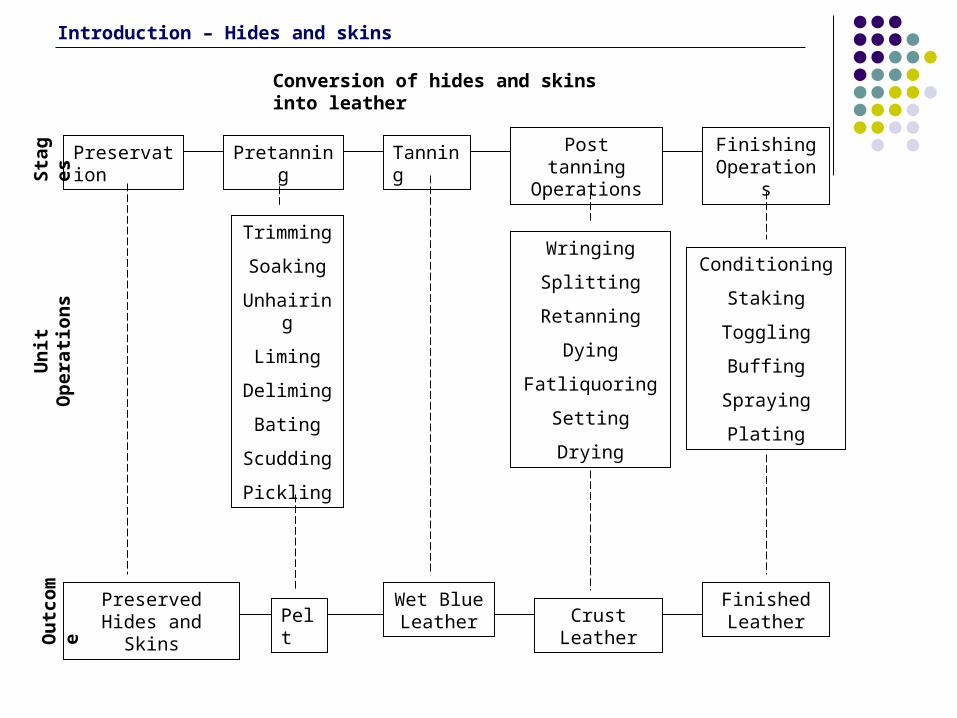
Conversion of hides and skins into leather
Introduction – Hides and skins
Conversion of hides and skins into leather
Preserved Hides and Skins Pelt
Wet Blue Leather Crust Leather
Finished Leather
Finishing Operations
Preservation Pretanning Tanning Post tanning Operations
Trimming
Soaking
Unhairing
Liming
Deliming
Bating
Scudding
Pickling
Wringing
Splitting
Retanning
Dying
Fatliquoring
Setting
Drying
Conditioning
Staking
Toggling
Buffing
Spraying
Plating
Sta
ges
Un
it O
per
atio
ns
Ou
tcom
e
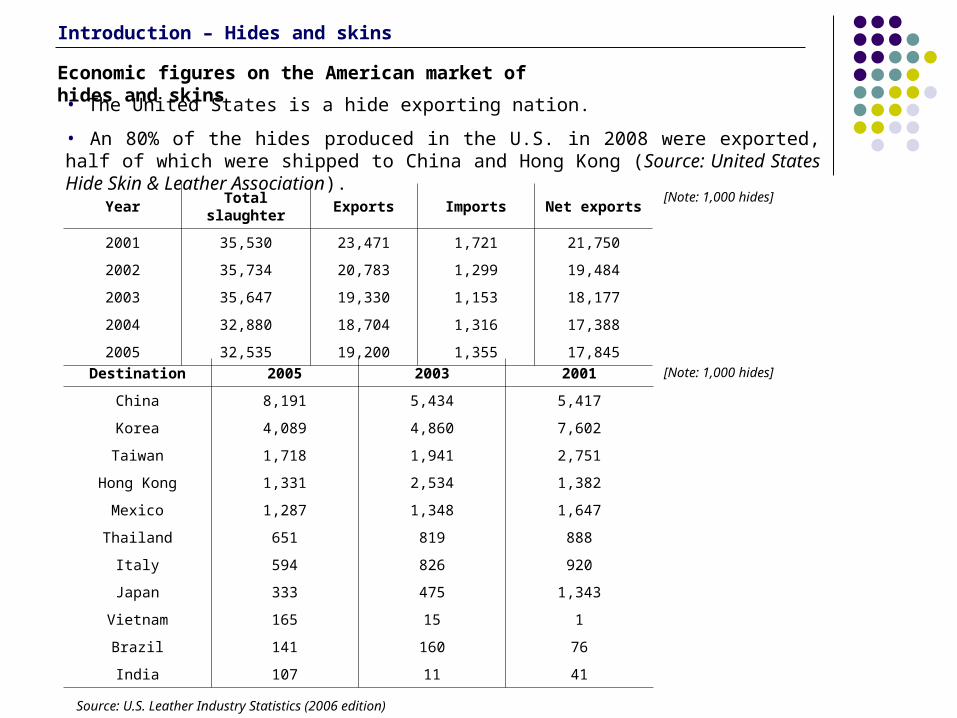
Year Total slaughter Exports Imports Net exports
2001 35,530 23,471 1,721 21,750
2002 35,734 20,783 1,299 19,484
2003 35,647 19,330 1,153 18,177
2004 32,880 18,704 1,316 17,388
2005 32,535 19,200 1,355 17,845
Destination 2005 2003 2001
China 8,191 5,434 5,417
Korea 4,089 4,860 7,602
Taiwan 1,718 1,941 2,751
Hong Kong 1,331 2,534 1,382
Mexico 1,287 1,348 1,647
Thailand 651 819 888
Italy 594 826 920
Japan 333 475 1,343
Vietnam 165 15 1
Brazil 141 160 76
India 107 11 41
Economic figures on the American market of hides and skins
Source: U.S. Leather Industry Statistics (2006 edition)
Introduction – Hides and skins
• The United States is a hide exporting nation.
• An 80% of the hides produced in the U.S. in 2008 were exported, half of which were shipped to China and Hong Kong (Source: United States Hide Skin & Leather Association).
[Note: 1,000 hides]
[Note: 1,000 hides]
Goal → To temporarily prevent deterioration of raw hides and skins from the time they are removed from the animal until they are processed into a product that is no longer susceptible to putrefaction or rotting.
• Physical damage. Occurs before the slaughter of the animal. Includes tears, scratches, cuts, hook marks, contamination with dirt, insect attack, etc.
• Putrefaction. Caused by bacteria and the proteolytic enzymes produced by them. Bacteria are one-celled microorganisms that multiply very rapidly when they feel comfortable in the surrounding environment.
Factors that affect the growth of bacteria:
• Food
• Water
• pH
• Temperature
Introduction – Preservation of raw hides and skins
Introduction – Preservation of raw hides and skins
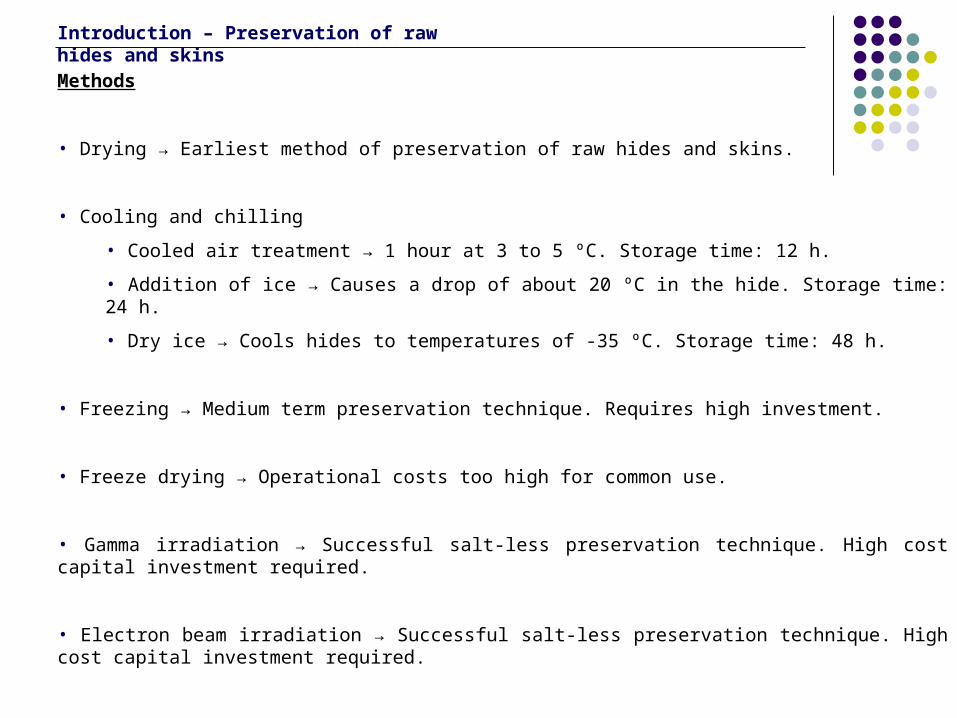
Methods
• Drying → Earliest method of preservation of raw hides and skins.
• Cooling and chilling
• Cooled air treatment → 1 hour at 3 to 5 ºC. Storage time: 12 h.
• Addition of ice → Causes a drop of about 20 ºC in the hide. Storage time: 24 h.
• Dry ice → Cools hides to temperatures of -35 ºC. Storage time: 48 h.
• Freezing → Medium term preservation technique. Requires high investment.
• Freeze drying → Operational costs too high for common use.
• Gamma irradiation → Successful salt-less preservation technique. High cost capital investment required.
• Electron beam irradiation → Successful salt-less preservation technique. High cost capital investment required.
Introduction – Preservation of raw hides and skins
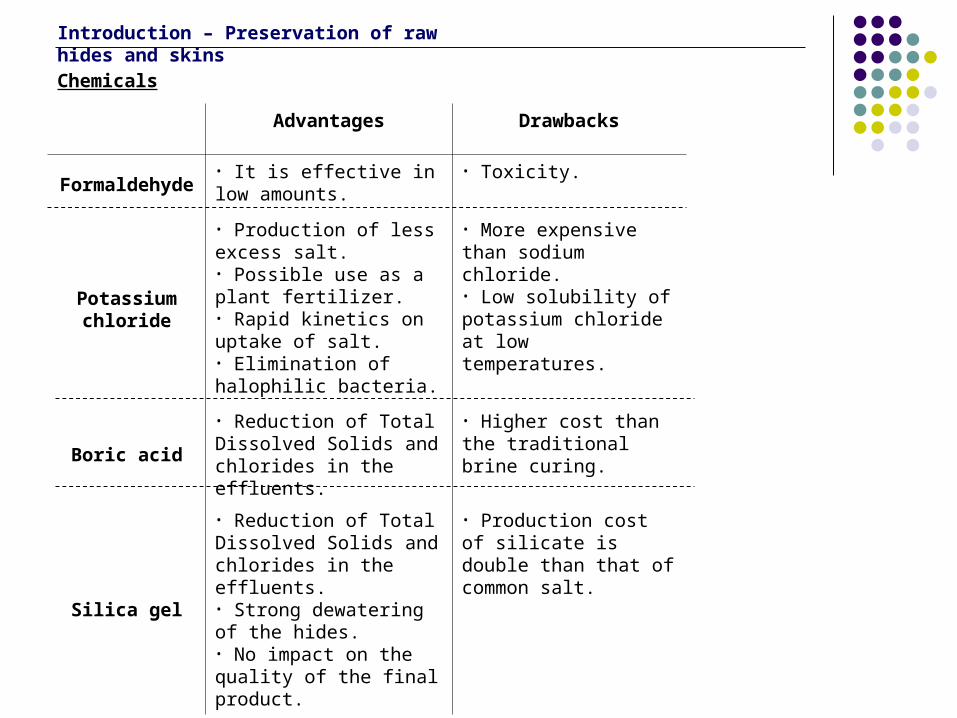
Advantages Drawbacks
Formaldehyde• It is effective in low amounts.
• Toxicity.
Potassium chloride
• Production of less excess salt.• Possible use as a plant fertilizer.• Rapid kinetics on uptake of salt.• Elimination of halophilic bacteria.
• More expensive than sodium chloride.• Low solubility of potassium chloride at low temperatures.
Boric acid
• Reduction of Total Dissolved Solids and chlorides in the effluents.
• Higher cost than the traditional brine curing.
Silica gel
• Reduction of Total Dissolved Solids and chlorides in the effluents.• Strong dewatering of the hides.• No impact on the quality of the final product.
• Production cost of silicate is double than that of common salt.
Chemicals
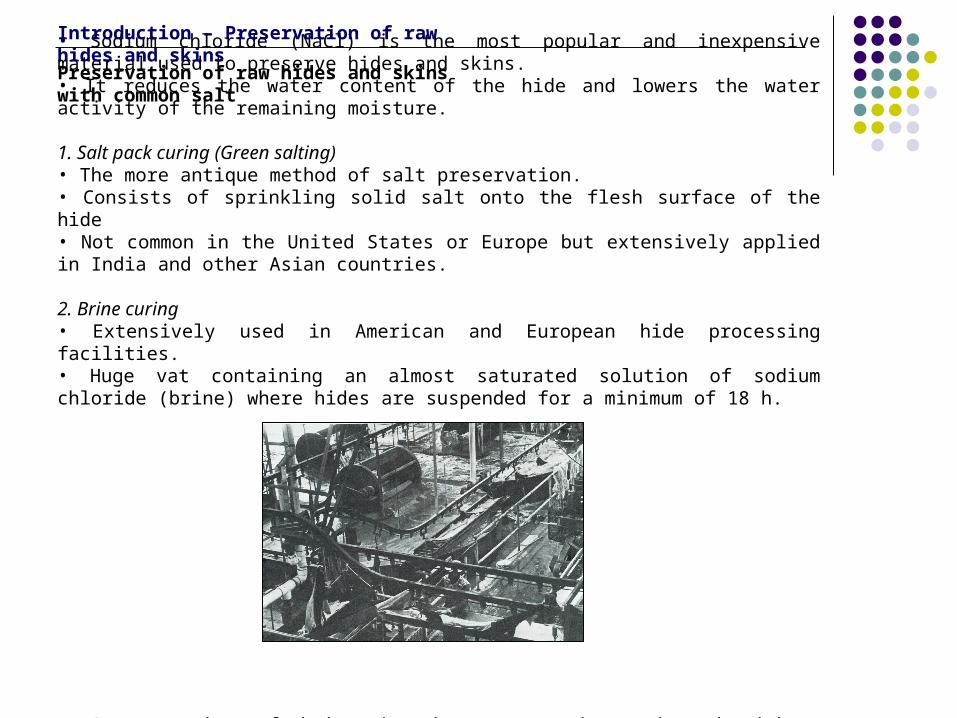
• Sodium chloride (NaCl) is the most popular and inexpensive material used to preserve hides and skins. • It reduces the water content of the hide and lowers the water activity of the remaining moisture.
1. Salt pack curing (Green salting)• The more antique method of salt preservation.• Consists of sprinkling solid salt onto the flesh surface of the hide • Not common in the United States or Europe but extensively applied in India and other Asian countries.
2. Brine curing• Extensively used in American and European hide processing facilities. • Huge vat containing an almost saturated solution of sodium chloride (brine) where hides are suspended for a minimum of 18 h.
• Concentration of brine in the raceway is monitored with a salometer, which scale ranges from 0 ºSAL (pure water) to 100 ºSAL (saturated brine).
Introduction – Preservation of raw hides and skins
Preservation of raw hides and skins with common salt
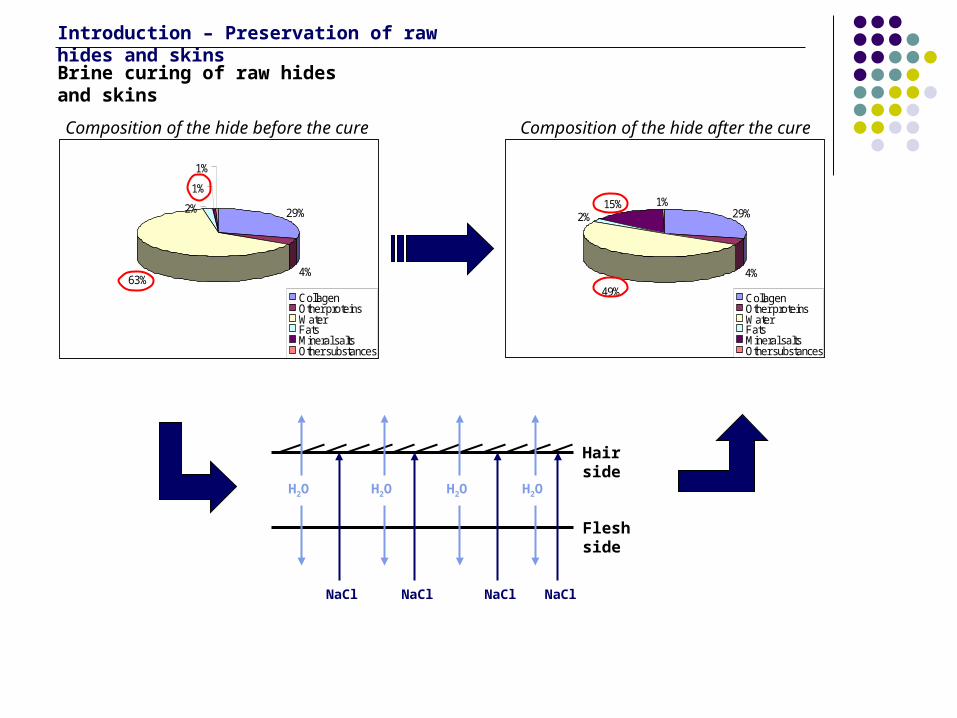
29%
4%63%
2%
1%
1%
CollagenOther proteinsWaterFatsMineral saltsOther substances
Composition of the hide before the cure
29%
4%
49%
2%15% 1%
CollagenOther proteinsWaterFatsMineral saltsOther substances
Composition of the hide after the cure
Introduction – Preservation of raw hides and skins
Brine curing of raw hides and skins
H2O H2O H2O H2O
Hair side
Flesh side
NaClNaCl NaCl NaCl
Introduction – Preservation of raw hides and skins
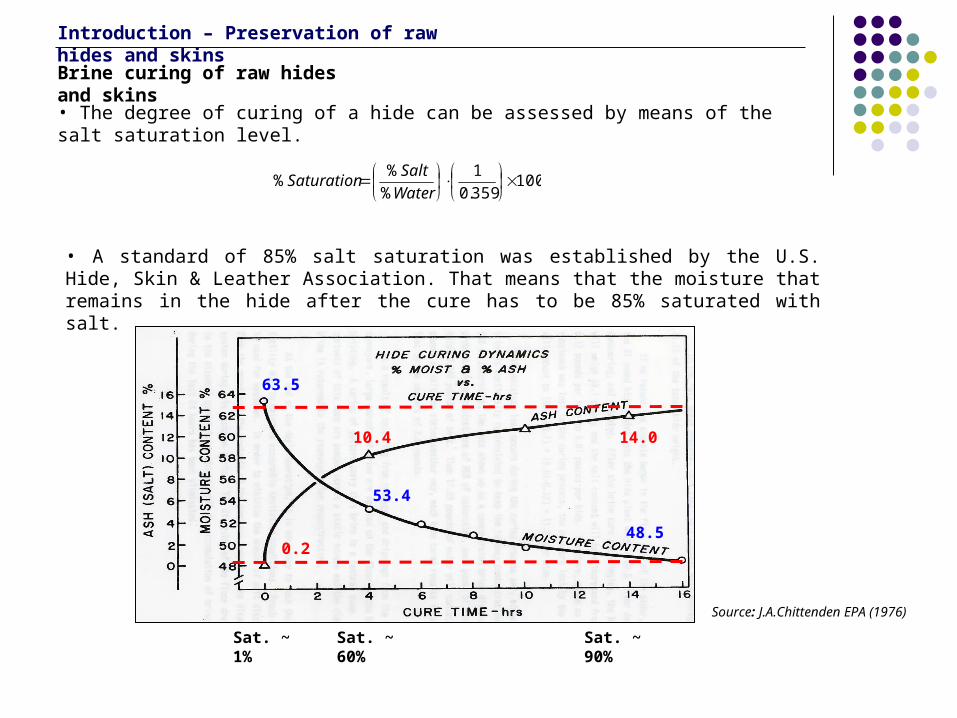
63.5
53.4
10.4
0.248.5
14.0
Source: J.A.Chittenden EPA (1976)
Sat. ~ 90%Sat. ~ 60%Sat. ~ 1%
Brine curing of raw hides and skins
• The degree of curing of a hide can be assessed by means of the salt saturation level.
100359.0
1
%
%%
Water
SaltSaturation
• A standard of 85% salt saturation was established by the U.S. Hide, Skin & Leather Association. That means that the moisture that remains in the hide after the cure has to be 85% saturated with salt.
Advantages
• Relatively inexpensive ($0.11/kg).
• Capacity to process a high volume of hides and skins (various thousands per day).
• No high tech knowledge involved.
• Usage of safe chemicals.
Disadvantages
• Water pollution. Release of about 50% of the total dissolved solids of the whole leather making
process during the soaking.
• The large amount of salt required.
• Increasing commodity prices for sodium chloride (a 10-15% increase over the past few years).
• Batch process. Hides might be removed from the vat in a different order that they were put in.
• Vat overload. Leads to a slower diffusion rate of salt into the hide.
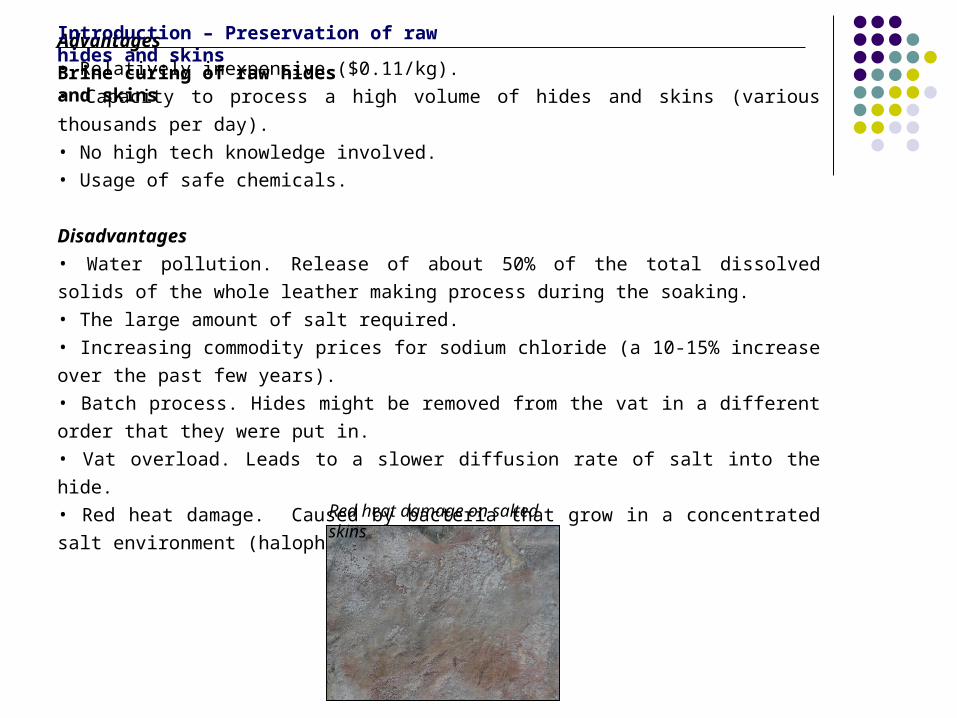
• Red heat damage. Caused by bacteria that grow in a concentrated salt environment (halophiles).
Introduction – Preservation of raw hides and skins
Brine curing of raw hides and skins
Red heat damage on salted skins
Stratrigraphic study – Experimental
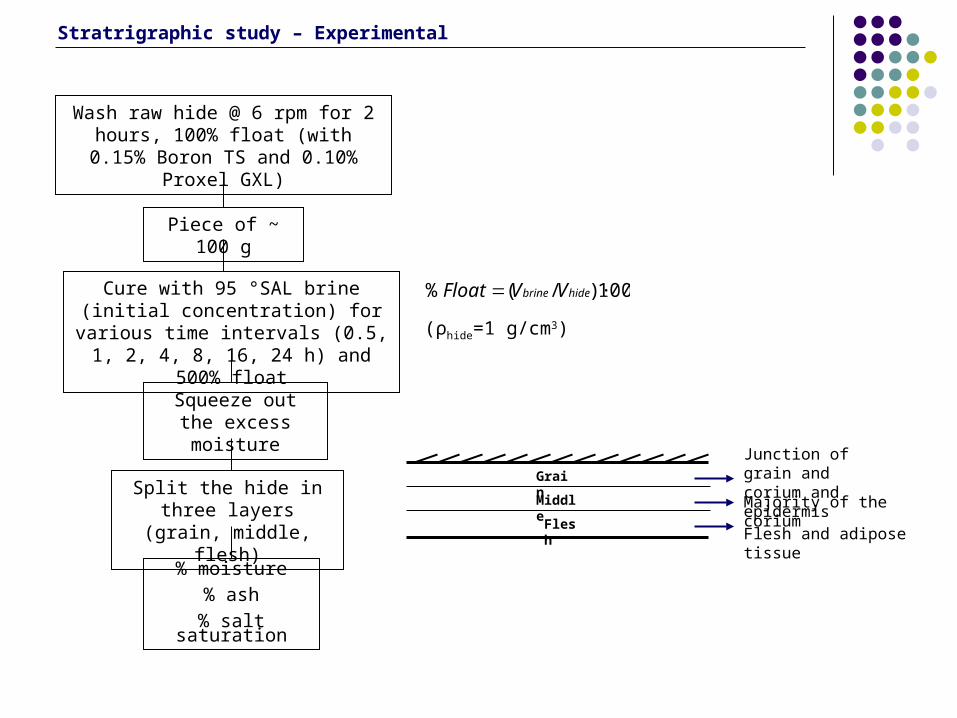
Split the hide in three layers (grain, middle, flesh)
Piece of ~ 100 g
Cure with 95 °SAL brine (initial concentration) for various time intervals (0.5, 1, 2, 4, 8, 16, 24 h) and 500% float
Squeeze out the excess moisture
% moisture
% ash
% salt saturation
Wash raw hide @ 6 rpm for 2 hours, 100% float (with 0.15% Boron TS and
0.10% Proxel GXL)
100)·/(% hidebrine VVFloat
(ρhide=1 g/cm3)
Flesh
Middle
Grain
Flesh and adipose tissue
Junction of grain and corium and epidermis
Majority of the corium
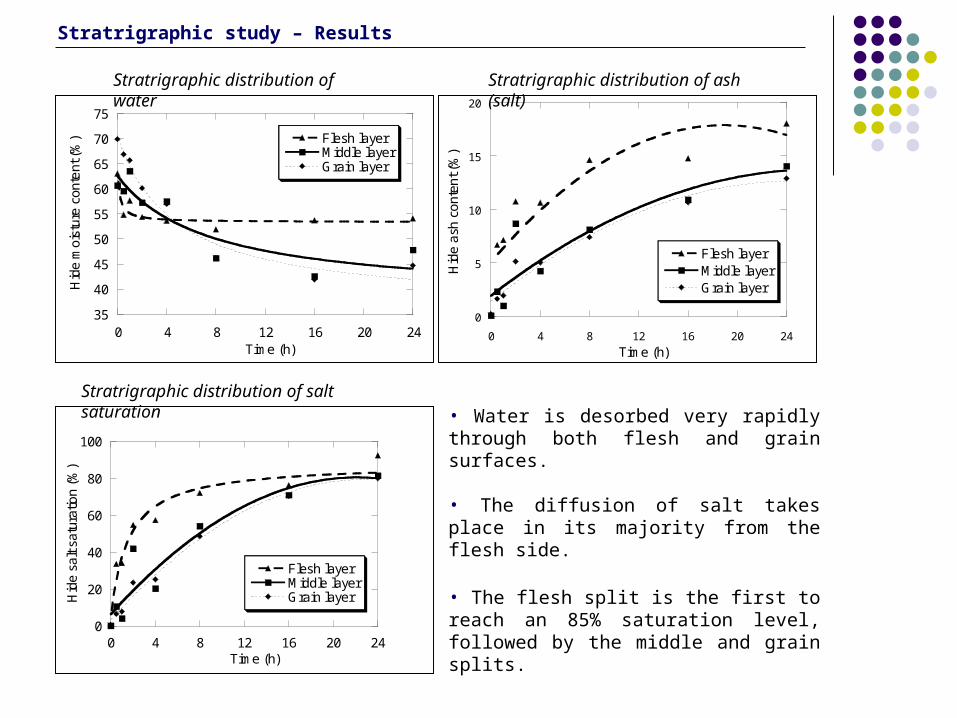
• Water is desorbed very rapidly through both flesh and grain surfaces.
• The diffusion of salt takes place in its majority from the flesh side.
• The flesh split is the first to reach an 85% saturation level, followed by the middle and grain splits.
35
40
45
50
55
60
65
70
75
0 4 8 12 16 20 24
Flesh layerMiddle layerGrain layer
Hid
e m
oist
ure
con
tent
(%
)
Time (h)
Stratrigraphic distribution of water
0
5
10
15
20
0 4 8 12 16 20 24
Flesh layerMiddle layerGrain layer
Hid
e a
sh c
onte
nt (
%)
Time (h)
Stratrigraphic distribution of ash (salt)
0
20
40
60
80
100
0 4 8 12 16 20 24
Flesh layerMiddle layerGrain layerH
ide
salt
satu
ratio
n (%
)
Time (h)
Stratrigraphic distribution of salt saturation
Stratrigraphic study – Results
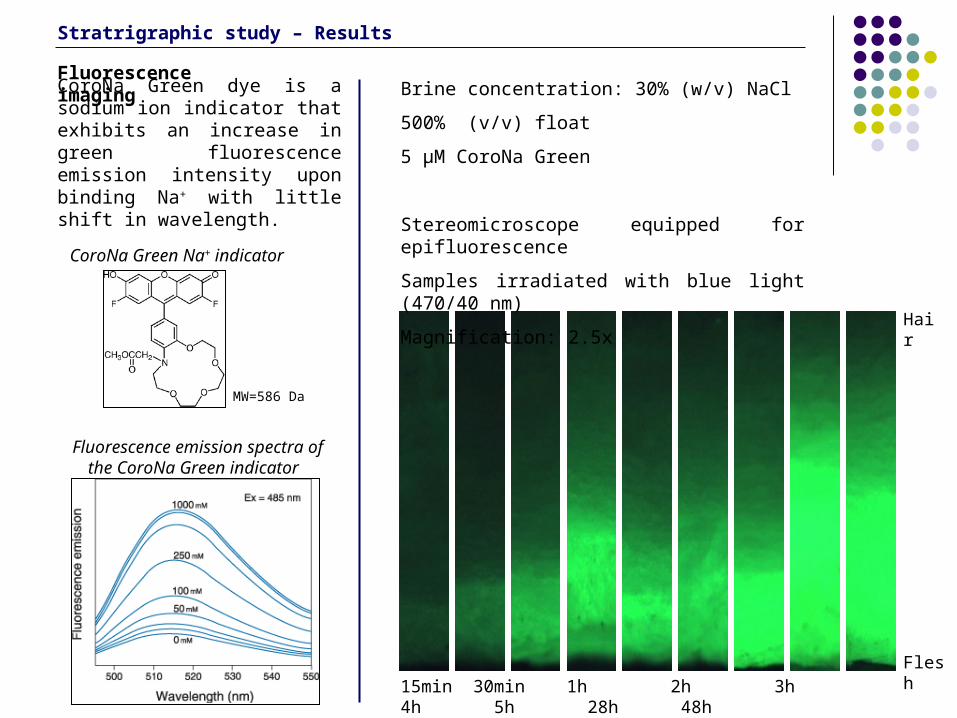
15min 30min 1h 2h 3h 4h 5h 28h 48hFlesh
Hair
CoroNa Green dye is a sodium ion indicator that exhibits an increase in green fluorescence emission intensity upon binding Na+ with little shift in wavelength.
Fluorescence imaging
CoroNa Green Na+ indicator
Fluorescence emission spectra of the CoroNa Green indicator
MW=586 Da
Brine concentration: 30% (w/v) NaCl
500% (v/v) float
5 μM CoroNa Green
Stereomicroscope equipped for epifluorescence
Samples irradiated with blue light (470/40 nm)
Magnification: 2.5x
Stratrigraphic study – Results
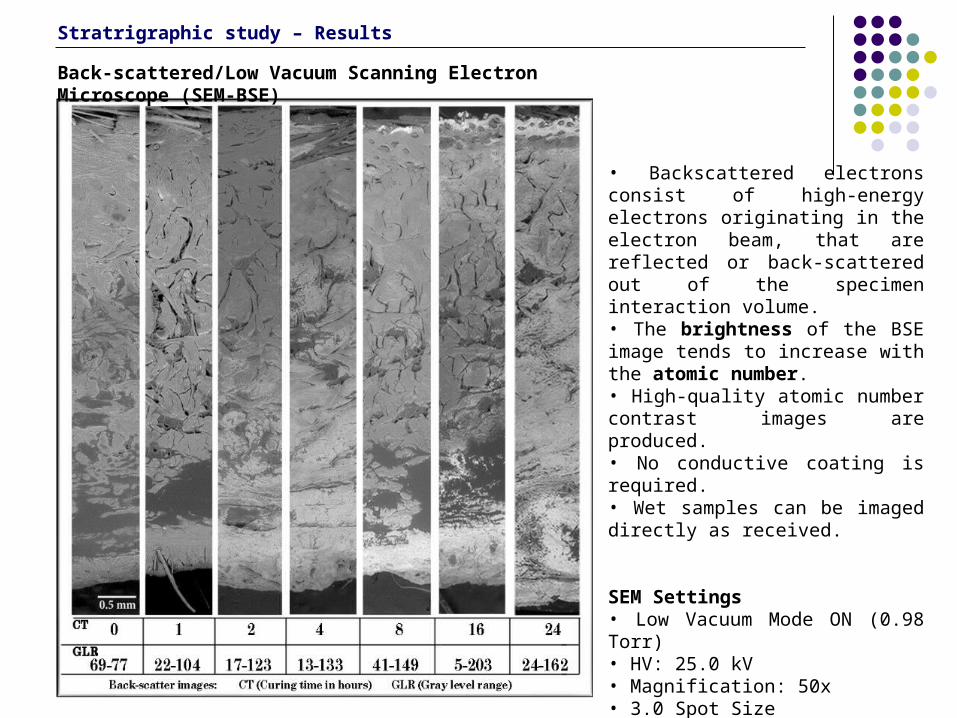
Back-scattered/Low Vacuum Scanning Electron Microscope (SEM-BSE)
• Backscattered electrons consist of high-energy electrons originating in the electron beam, that are reflected or back-scattered out of the specimen interaction volume. • The brightness of the BSE image tends to increase with the atomic number. • High-quality atomic number contrast images are produced.• No conductive coating is required.• Wet samples can be imaged directly as received.
SEM Settings• Low Vacuum Mode ON (0.98 Torr)• HV: 25.0 kV• Magnification: 50x• 3.0 Spot Size• Contrast: 88.0• Brightness: 44.9
Stratrigraphic study – Results
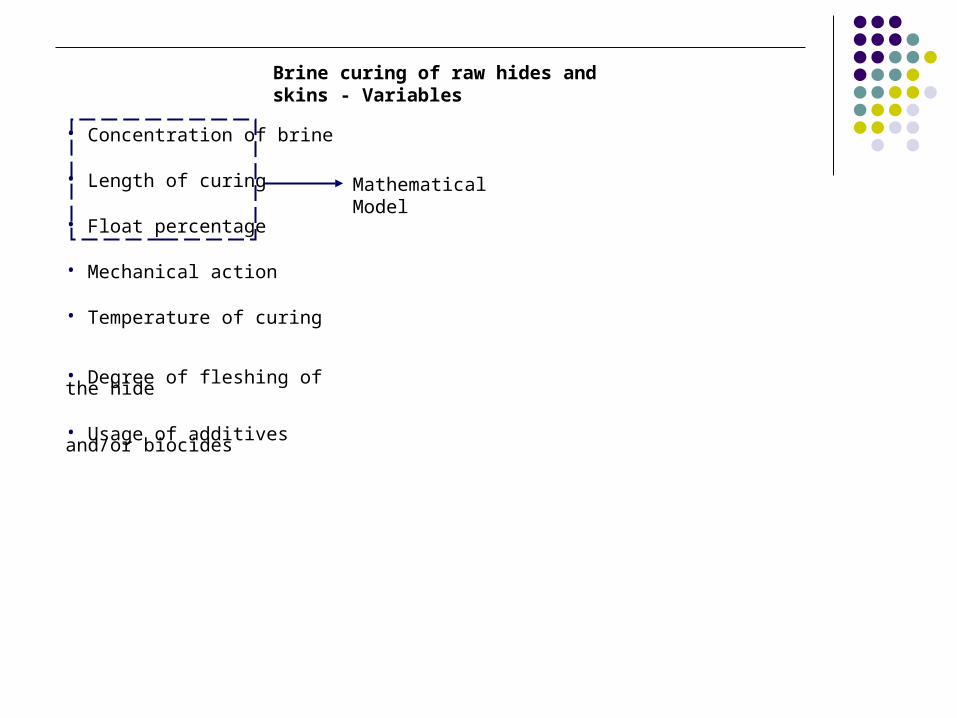
Brine curing of raw hides and skins - Variables
• Concentration of brine
• Length of curing
• Float percentage
• Mechanical action
• Temperature of curing
• Degree of fleshing of the hide
• Usage of additives and/or biocides
Mathematical Model
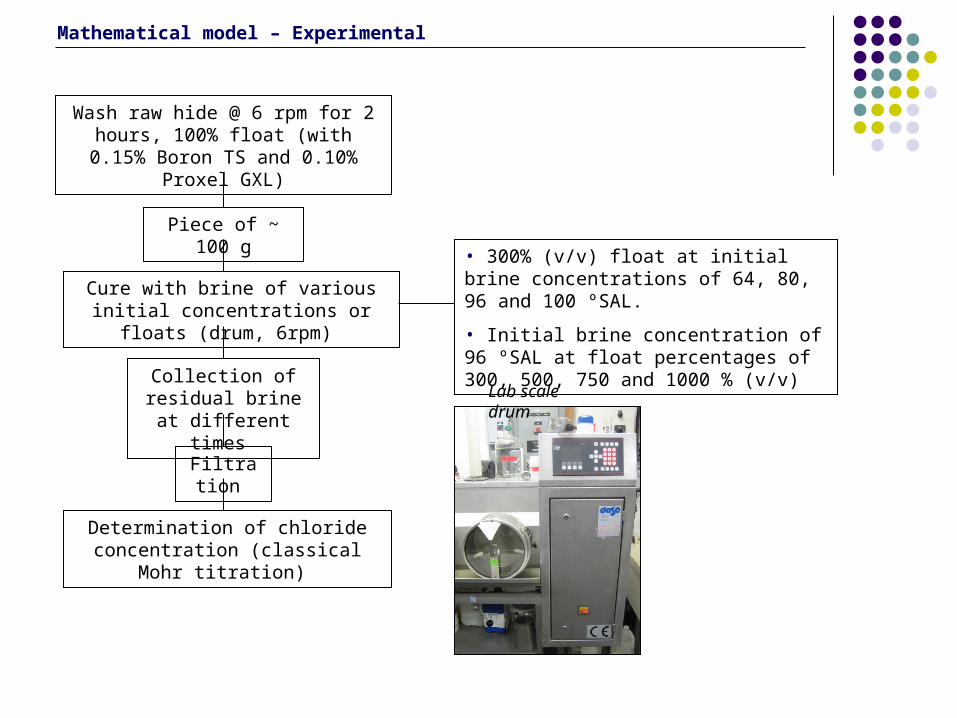
Mathematical model – Experimental
Lab scale drum
Piece of ~ 100 g
Cure with brine of various initial concentrations or floats (drum, 6rpm)
Wash raw hide @ 6 rpm for 2 hours, 100% float (with 0.15% Boron TS and
0.10% Proxel GXL)
• 300% (v/v) float at initial brine concentrations of 64, 80, 96 and 100 ºSAL.
• Initial brine concentration of 96 ºSAL at float percentages of 300, 500, 750 and 1000 % (v/v)
Collection of residual brine at different times
Filtration
Determination of chloride concentration (classical Mohr titration)
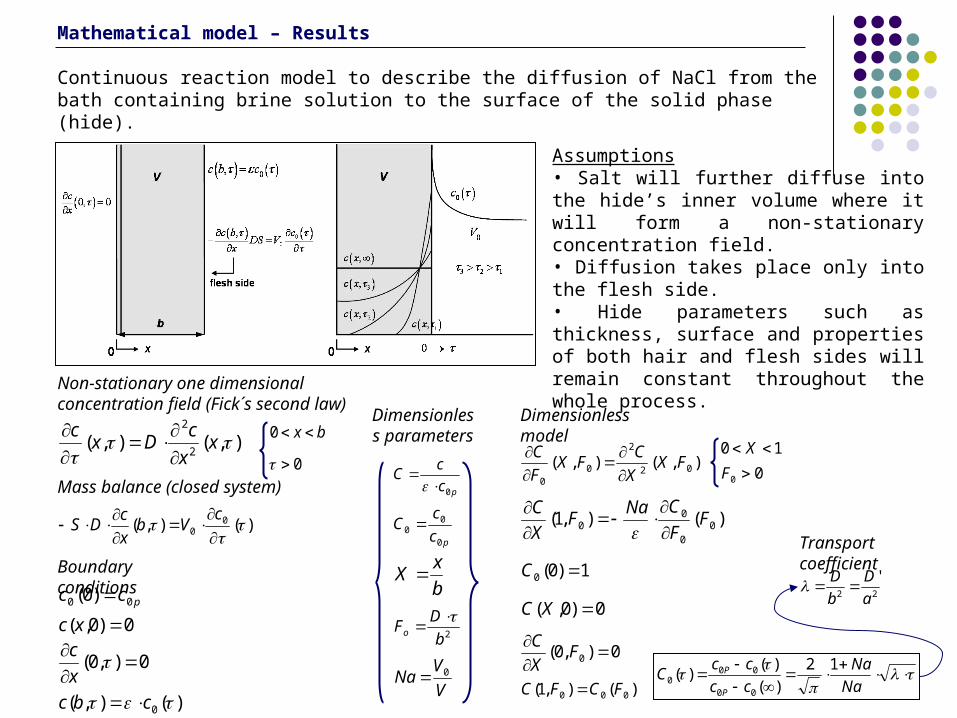
Continuous reaction model to describe the diffusion of NaCl from the bath containing brine solution to the surface of the solid phase (hide).
Assumptions• Salt will further diffuse into the hide’s inner volume where it will form a non-stationary concentration field. • Diffusion takes place only into the flesh side.• Hide parameters such as thickness, surface and properties of both hair and flesh sides will remain constant throughout the whole process.
0),0( x
c0)0,( xc
pcc 00 )0(
)(),( 0 cbc
),(),( 02
2
00
FXX
CFX
F
C
)(),1( 000 FCFC
)(),1( 00
00 F
F
CNaF
X
C
0),0( 0
FX
C
0)0,( XC
1)0(0 C
pc
cC
0
pc
cC
0
00
b
xX
2b
DFo
V
VNa 0
Na
Na
cc
ccC
P
P 12
)(
)()(
00
000
Mathematical model – Results
)(),( 00
c
Vbx
cDS
Non-stationary one dimensional concentration field (Fick´s second law)
Mass balance (closed system)
Boundary conditions
Dimensionless parameters
10 X
00 F
),(),(2
2
xx
cDx
c
bx 0
0
22
'
a
D
b
D
Dimensionless model
Transport coefficient
4,85
13,3
8,8
12,7
0
5
10
15
300 650 1000
% Float (v/v)
Dif
fusi
on
Co
effi
cien
t x
101
0 (
m2/s
)
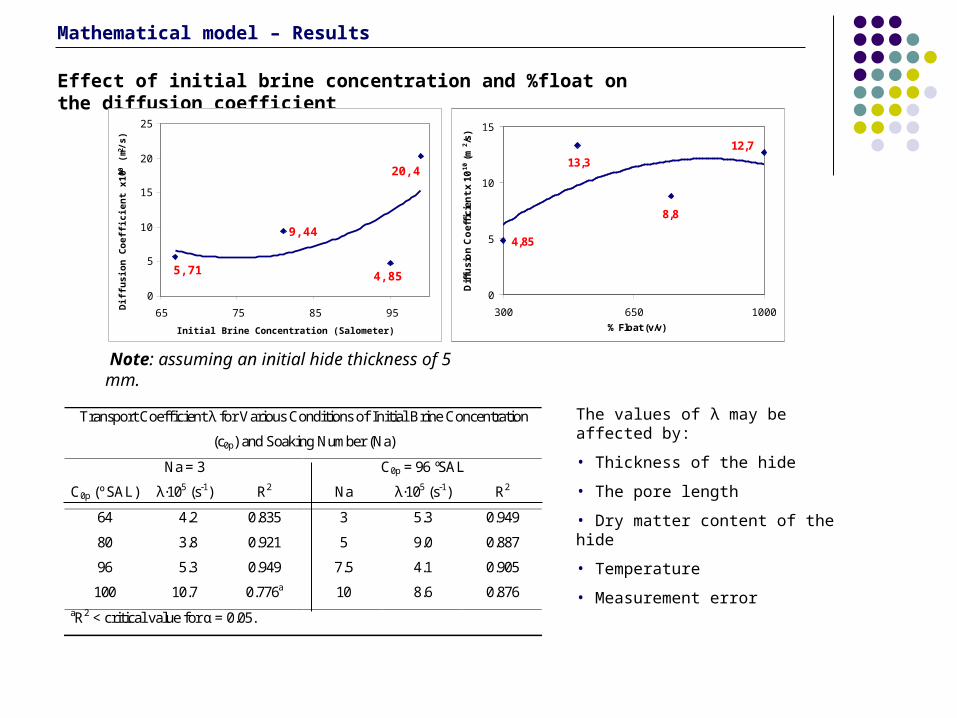
Effect of initial brine concentration and %float on the diffusion coefficient
Note: assuming an initial hide thickness of 5 mm.
Mathematical model – Results
The values of λ may be affected by:
• Thickness of the hide
• The pore length
• Dry matter content of the hide
• Temperature
• Measurement error
Transport Coefficient λ for Various Conditions of Initial Brine Concentration
(c0p) and Soaking Number (Na)
Na = 3 C0p = 96 ºSAL
C0p (º SAL) λ·105 (s-1) R2 Na λ·105 (s-1) R2
64 4.2 0.835 3 5.3 0.949
80 3.8 0.921 5 9.0 0.887
96 5.3 0.949 7.5 4.1 0.905
100 10.7 0.776a 10 8.6 0.876 aR2 < critical value for α = 0.05.
1
9,44
20,4
4,855,71
0
5
10
15
20
25
65 75 85 95
Initial Brine Concentration (Salometer)
Dif
fusi
on
Co
effi
cien
t x1
010
(m
2/s
)
Initial brine conc. (º SAL)
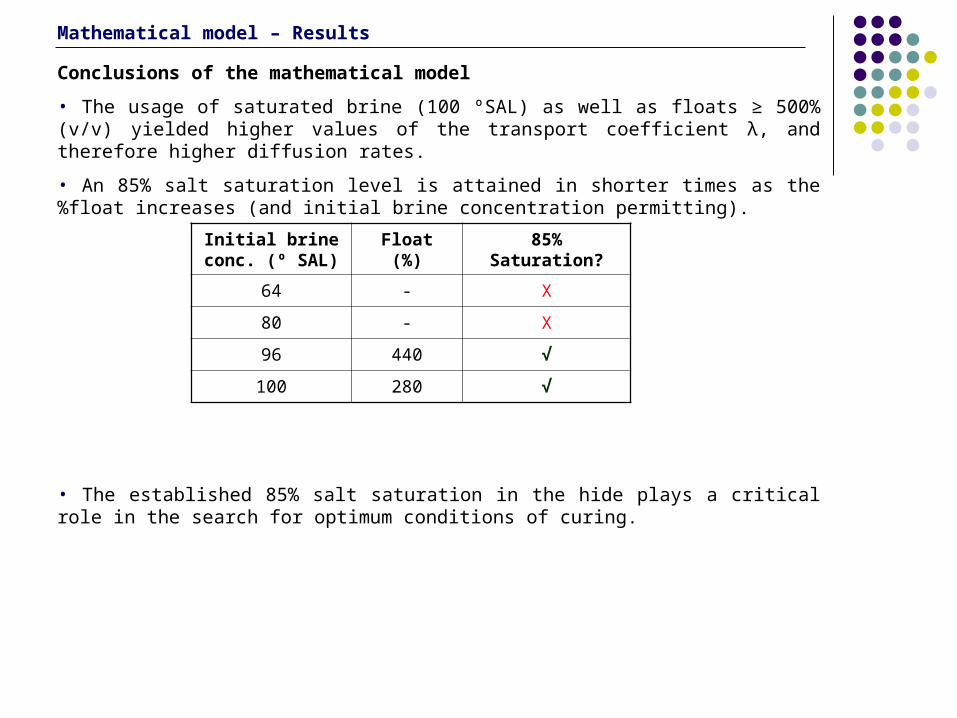
Float (%) 85% Saturation?
64 - X
80 - X
96 440 √
100 280 √
Conclusions of the mathematical model
• The usage of saturated brine (100 ºSAL) as well as floats ≥ 500% (v/v) yielded higher values of the transport coefficient λ, and therefore higher diffusion rates.
• An 85% salt saturation level is attained in shorter times as the %float increases (and initial brine concentration permitting).
• The established 85% salt saturation in the hide plays a critical role in the search for optimum conditions of curing.
Mathematical model – Results
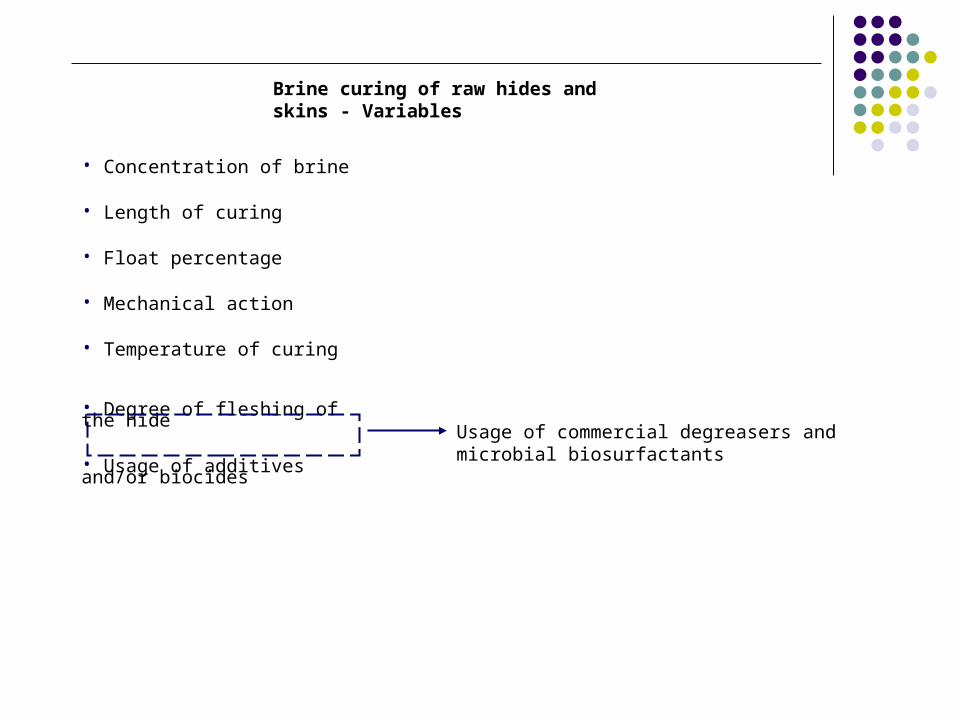
• Concentration of brine
• Length of curing
• Float percentage
• Mechanical action
• Temperature of curing
• Degree of fleshing of the hide
• Usage of additives and/or biocidesUsage of commercial degreasers and microbial biosurfactants
Brine curing of raw hides and skins - Variables
Degreasing study – Introduction
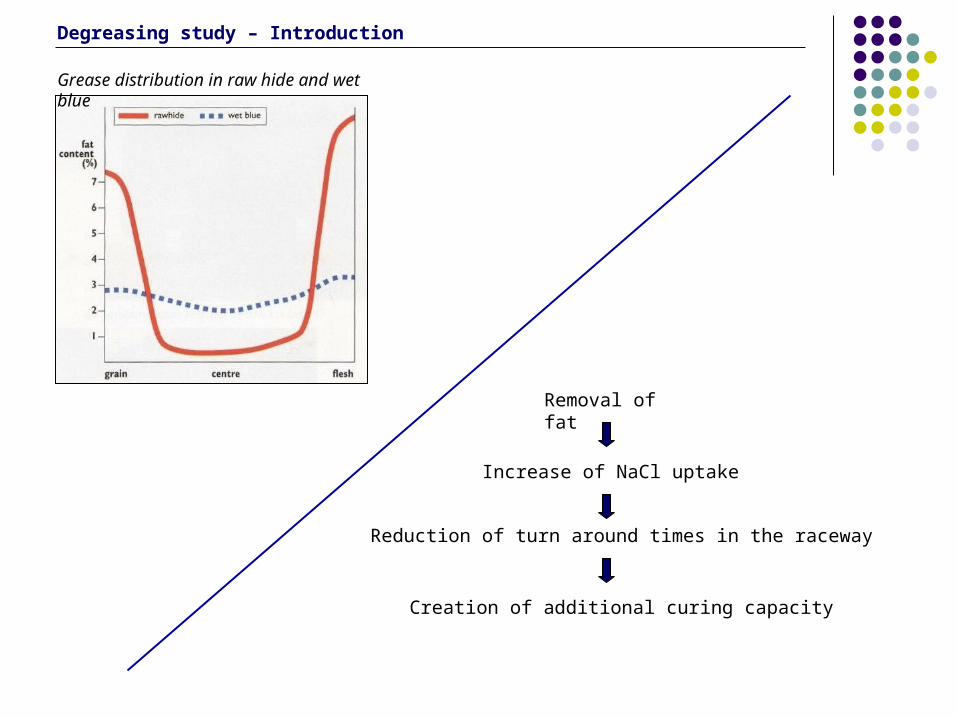
Grease distribution in raw hide and wet blue
Removal of fat
Increase of NaCl uptake
Reduction of turn around times in the raceway
Creation of additional curing capacity
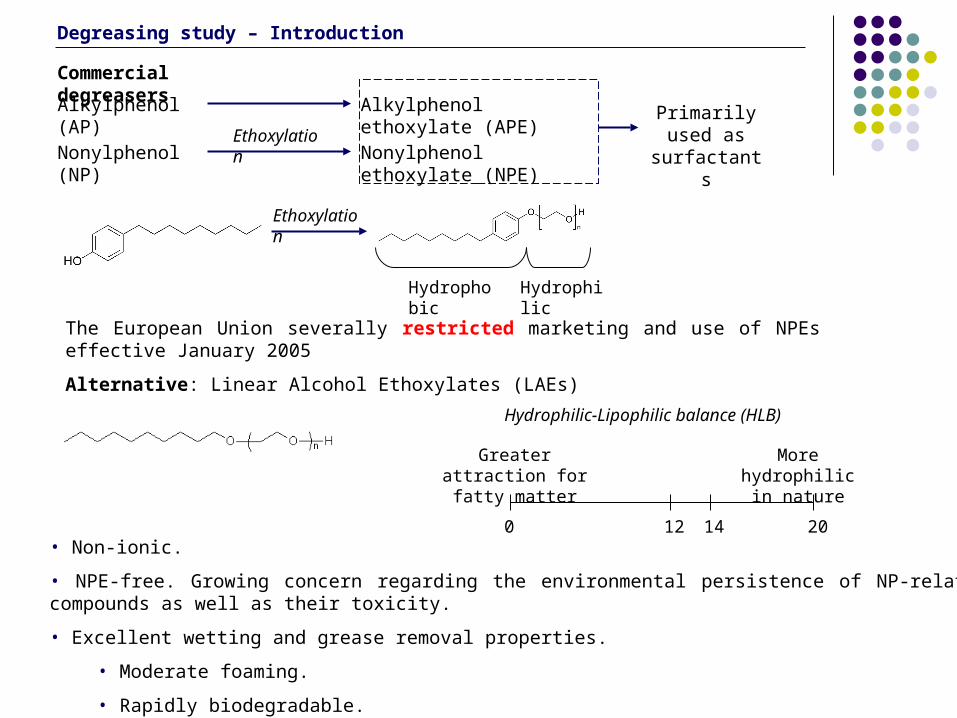
• Non-ionic.
• NPE-free. Growing concern regarding the environmental persistence of NP-related compounds as well as their toxicity.
• Excellent wetting and grease removal properties.
• Moderate foaming.
• Rapidly biodegradable.
Commercial degreasers
Nonylphenol ethoxylate (NPE)
Alkylphenol ethoxylate (APE)Alkylphenol (AP)
Nonylphenol (NP)Ethoxylation
Primarily used as surfactants
Hydrophobic Hydrophilic
The European Union severally restricted marketing and use of NPEs effective January 2005
Alternative: Linear Alcohol Ethoxylates (LAEs)
0 12 2014
Greater attraction for fatty matter
More hydrophilic in nature
Hydrophilic-Lipophilic balance (HLB)
Degreasing study – Introduction
Ethoxylation
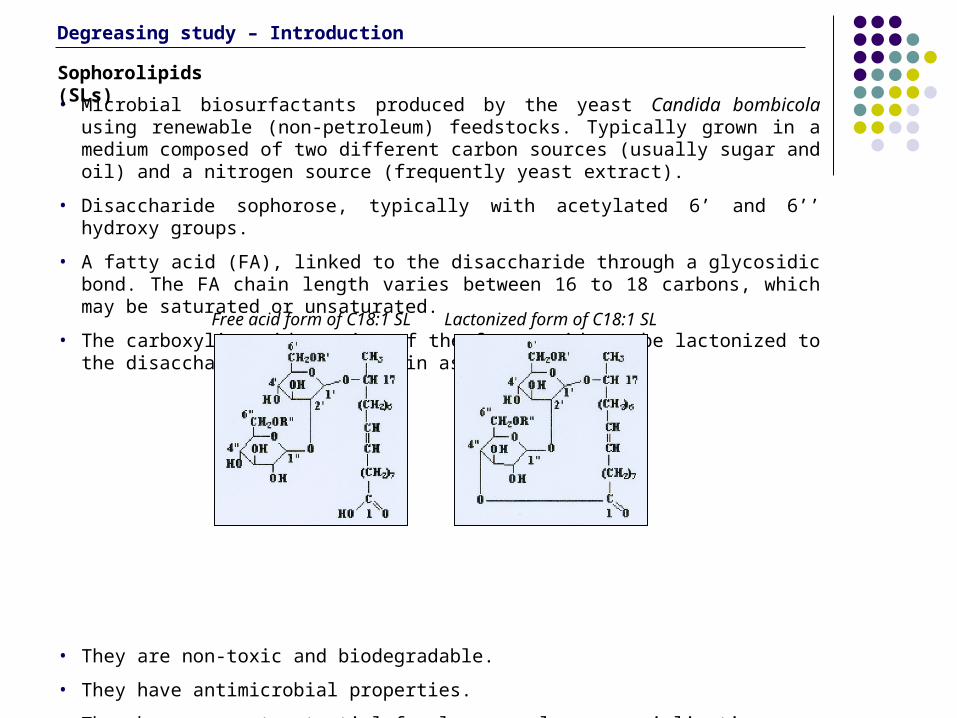
• Microbial biosurfactants produced by the yeast Candida bombicola using renewable (non-petroleum) feedstocks. Typically grown in a medium composed of two different carbon sources (usually sugar and oil) and a nitrogen source (frequently yeast extract).
• Disaccharide sophorose, typically with acetylated 6’ and 6’’ hydroxy groups.
• A fatty acid (FA), linked to the disaccharide through a glycosidic bond. The FA chain length varies between 16 to 18 carbons, which may be saturated or unsaturated.
• The carboxylic acid portion of the fatty acid can be lactonized to the disaccharide ring or remain as a free acid.
• They are non-toxic and biodegradable.
• They have antimicrobial properties.
• They have a great potential for large scale commercialization.
• They are currently used in the cosmetic industry, in the formulation of high value products, and as an active ingredient in detergent composition.
Sophorolipids (SLs)
Lactonized form of C18:1 SLFree acid form of C18:1 SL
Degreasing study – Introduction
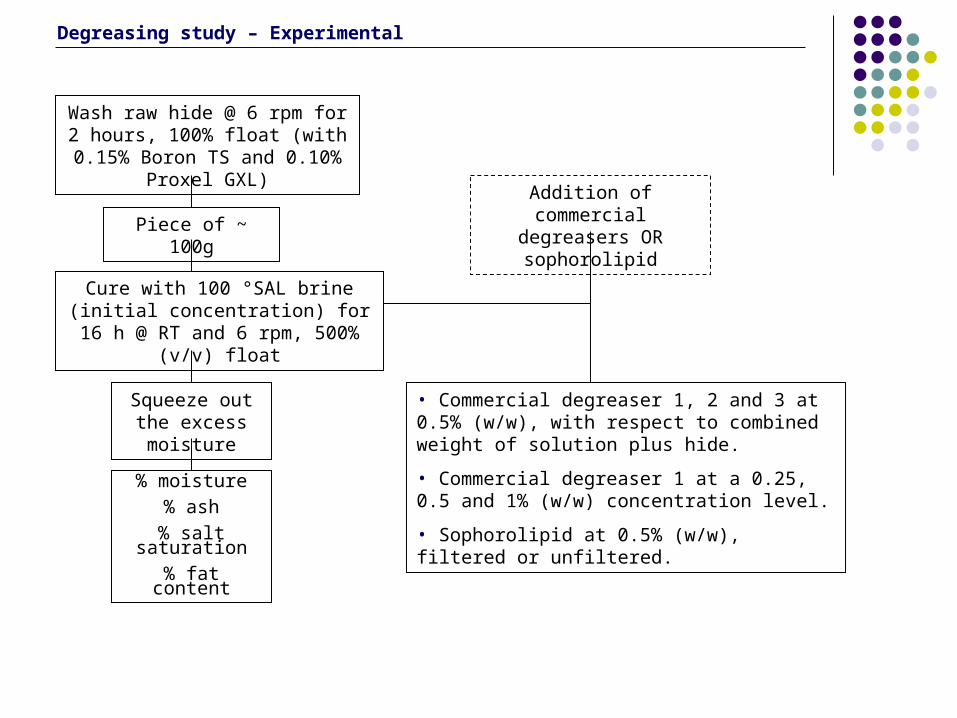
Piece of ~ 100g
Cure with 100 °SAL brine (initial concentration) for 16 h @ RT and 6 rpm,
500% (v/v) float
Squeeze out the excess moisture
% moisture
% ash
% salt saturation
% fat content
Addition of commercial degreasers OR sophorolipid
• Commercial degreaser 1, 2 and 3 at 0.5% (w/w), with respect to combined weight of solution plus hide.
• Commercial degreaser 1 at a 0.25, 0.5 and 1% (w/w) concentration level.
• Sophorolipid at 0.5% (w/w), filtered or unfiltered.
Wash raw hide @ 6 rpm for 2 hours, 100% float (with 0.15% Boron TS
and 0.10% Proxel GXL)
Degreasing study – Experimental
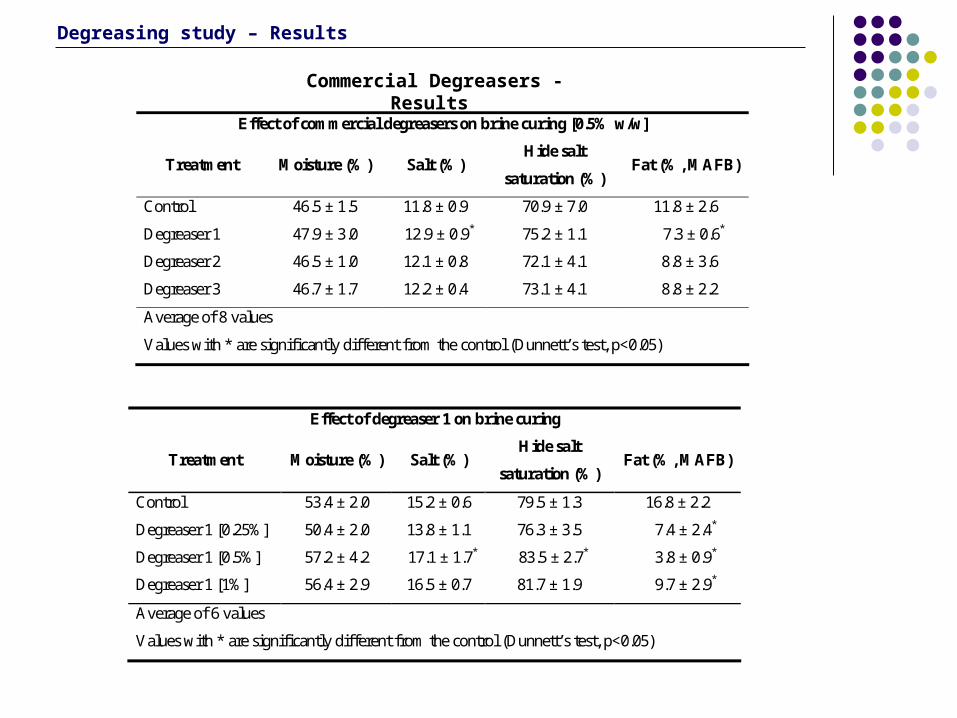
Commercial Degreasers - Results
Effect of degreaser 1 on brine curing
Treatment Moisture (%) Salt (%) Hide salt
saturation (%) Fat (%, MAFB)
Control 53.4 ± 2.0 15.2 ± 0.6 79.5 ± 1.3 16.8 ± 2.2
Degreaser 1 [0.25%] 50.4 ± 2.0 13.8 ± 1.1 76.3 ± 3.5 7.4 ± 2.4*
Degreaser 1 [0.5%] 57.2 ± 4.2 17.1 ± 1.7* 83.5 ± 2.7* 3.8 ± 0.9*
Degreaser 1 [1%] 56.4 ± 2.9 16.5 ± 0.7 81.7 ± 1.9 9.7 ± 2.9*
Average of 6 values
Values with * are significantly different from the control (Dunnett’s test, p<0.05)
Effect of commercial degreasers on brine curing [0.5% w/w]
Treatment Moisture (%) Salt (%) Hide salt
saturation (%) Fat (%, MAFB)
Control 46.5 ± 1.5 11.8 ± 0.9 70.9 ± 7.0 11.8 ± 2.6
Degreaser 1 47.9 ± 3.0 12.9 ± 0.9* 75.2 ± 1.1 7.3 ± 0.6*
Degreaser 2 46.5 ± 1.0 12.1 ± 0.8 72.1 ± 4.1 8.8 ± 3.6
Degreaser 3 46.7 ± 1.7 12.2 ± 0.4 73.1 ± 4.1 8.8 ± 2.2
Average of 8 values
Values with * are significantly different from the control (Dunnett’s test, p<0.05)
Degreasing study – Results
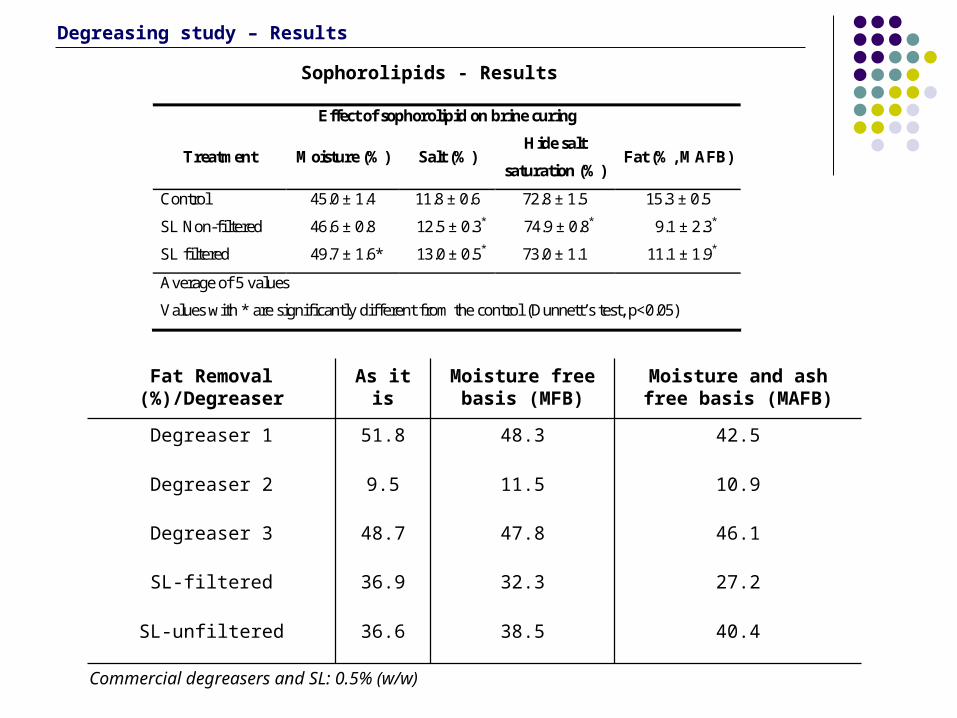
Fat Removal (%)/Degreaser As it is Moisture free basis (MFB)
Moisture and ash free basis (MAFB)
Degreaser 1 51.8 48.3 42.5
Degreaser 2 9.5 11.5 10.9
Degreaser 3 48.7 47.8 46.1
SL-filtered 36.9 32.3 27.2
SL-unfiltered 36.6 38.5 40.4
Commercial degreasers and SL: 0.5% (w/w)
Effect of sophorolipid on brine curing
Treatment Moisture (%) Salt (%) Hide salt
saturation (%) Fat (%, MAFB)
Control 45.0 ± 1.4 11.8 ± 0.6 72.8 ± 1.5 15.3 ± 0.5
SL Non-filtered 46.6 ± 0.8 12.5 ± 0.3* 74.9 ± 0.8* 9.1 ± 2.3*
SL filtered 49.7 ± 1.6* 13.0 ± 0.5* 73.0 ± 1.1 11.1 ± 1.9*
Average of 5 values
Values with * are significantly different from the control (Dunnett’s test, p<0.05)
Degreasing study – Results
Sophorolipids - Results
Conclusions of the degreasing study
Degreasing study – Results
• The addition of a 0.5% (w/w) of a commercial degreaser made of a blend of nonionic surfactants to the brine, significantly decreased the fat content of the hide and significantly enhanced the uptake of salt as well.
• The composition of the degreaser was a critical parameter for the purpose of defatting the hide. It is likely that different values of HLB amongst the various commercial degreasers affected their activity onto the hides.
• The sophorolipid tested showed remarkable degreasing properties and enhanced the uptake of salt by the hide if it was used above the solubility limit. These facts along with its low-foam properties and low cost (from $1 to 3/kg) make it an attractive choice of surfactant.
Future work – Preservation of raw hides and skins
• It would be interesting to remake the mathematical model in which the thickness of the hide would be a variable of the process instead of a parameter.
• More research needs to be done in order to establish a minimum salt saturation level that ensures a proper preservation of the hides, currently set at 85%.
• More research needs to be done to increase the solubility of sophorolipids. By accomplishing this, their field of applications would be greatly widened and hide dealers would be more receptive towards its usage in an industrial scale.
• It is essential to find a way to remove the fat that builds up in the curing vats or raceways, which are operated continuously.
• A non-destructive rapid test method for cure validation is needed.
Introduction – Fillers in the leather industry
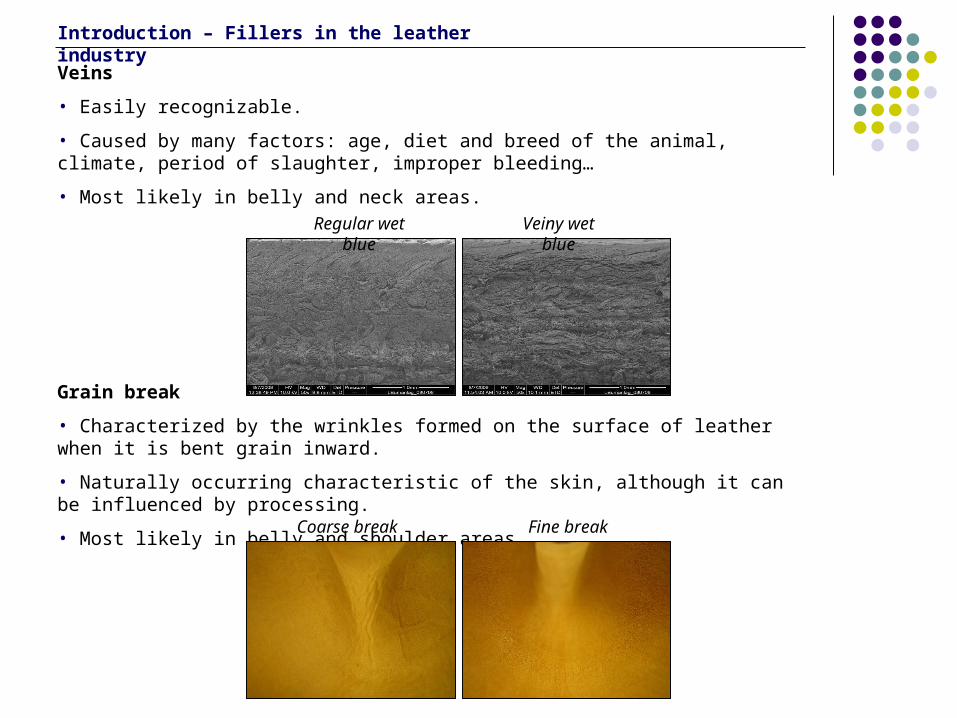
Veins
• Easily recognizable.
• Caused by many factors: age, diet and breed of the animal, climate, period of slaughter, improper bleeding…
• Most likely in belly and neck areas.
Grain break
• Characterized by the wrinkles formed on the surface of leather when it is bent grain inward.
• Naturally occurring characteristic of the skin, although it can be influenced by processing.
• Most likely in belly and shoulder areas.
Coarse break Fine break
Veiny wet blueRegular wet blue
Introduction – Fillers in the leather industry
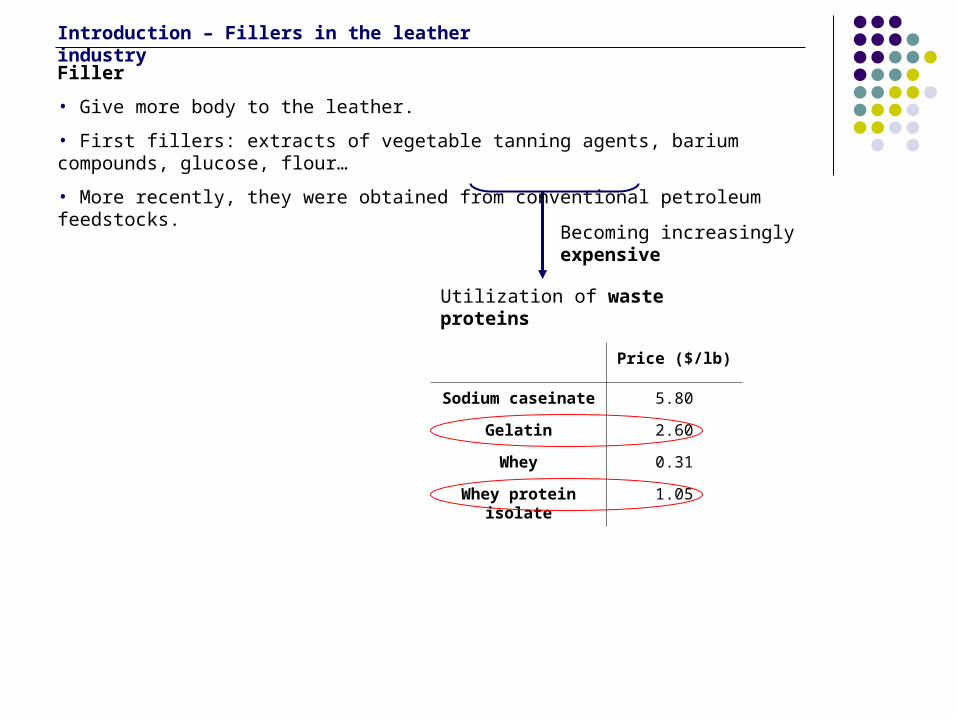
Filler
• Give more body to the leather.
• First fillers: extracts of vegetable tanning agents, barium compounds, glucose, flour…
• More recently, they were obtained from conventional petroleum feedstocks.
Utilization of waste proteins
Price ($/lb)
Sodium caseinate 5.80
Gelatin 2.60
Whey 0.31
Whey protein isolate 1.05
Becoming increasingly expensive
Introduction – Fillers in the leather industry
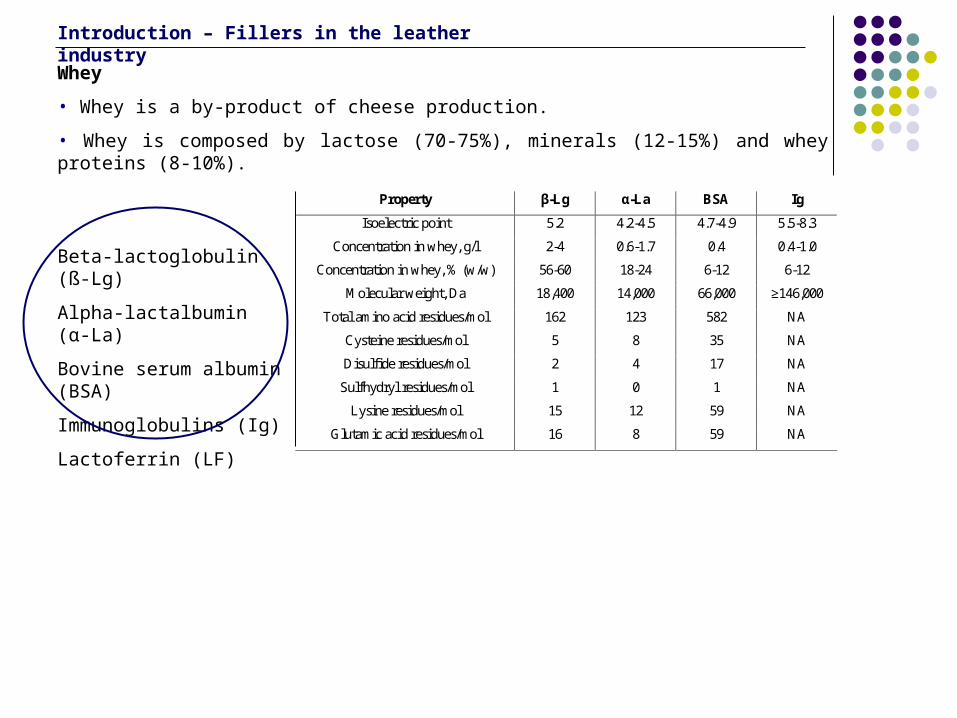
Property β-Lg α-La BSA Ig
Isoelectric point 5.2 4.2-4.5 4.7-4.9 5.5-8.3
Concentration in whey, g/l 2-4 0.6-1.7 0.4 0.4-1.0
Concentration in whey, % (w/w) 56-60 18-24 6-12 6-12
Molecular weight, Da 18,400 14,000 66,000 ≥146,000
Total amino acid residues/mol 162 123 582 NA
Cysteine residues/mol 5 8 35 NA
Disulfide residues/mol 2 4 17 NA
Sulfhydryl residues/mol 1 0 1 NA
Lysine residues/mol 15 12 59 NA
Glutamic acid residues/mol 16 8 59 NA
Whey
• Whey is a by-product of cheese production.
• Whey is composed by lactose (70-75%), minerals (12-15%) and whey proteins (8-10%).
Beta-lactoglobulin (ß-Lg)
Alpha-lactalbumin (α-La)
Bovine serum albumin (BSA)
Immunoglobulins (Ig)
Lactoferrin (LF)
Introduction – Fillers in the leather industry
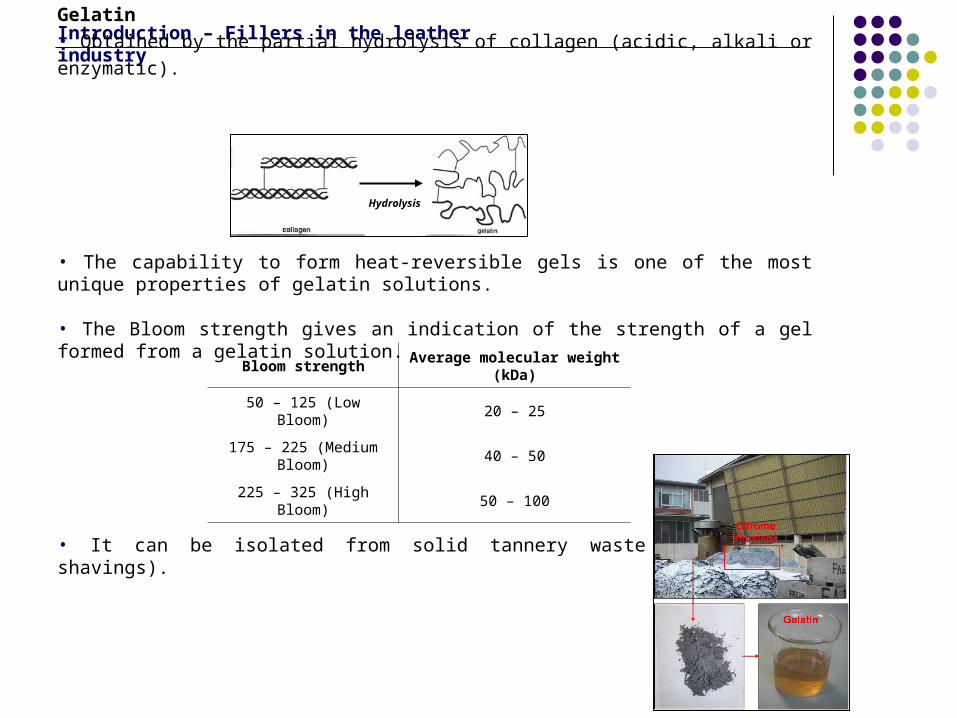
Gelatin• Obtained by the partial hydrolysis of collagen (acidic, alkali or enzymatic).
• The capability to form heat-reversible gels is one of the most unique properties of gelatin solutions.
• The Bloom strength gives an indication of the strength of a gel formed from a gelatin solution.
• It can be isolated from solid tannery waste (e.g. chrome shavings).
Hydrolysis
Bloom strength Average molecular weight (kDa)
50 – 125 (Low Bloom) 20 – 25
175 – 225 (Medium Bloom) 40 – 50
225 – 325 (High Bloom) 50 – 100
Introduction – Fillers in the leather industry
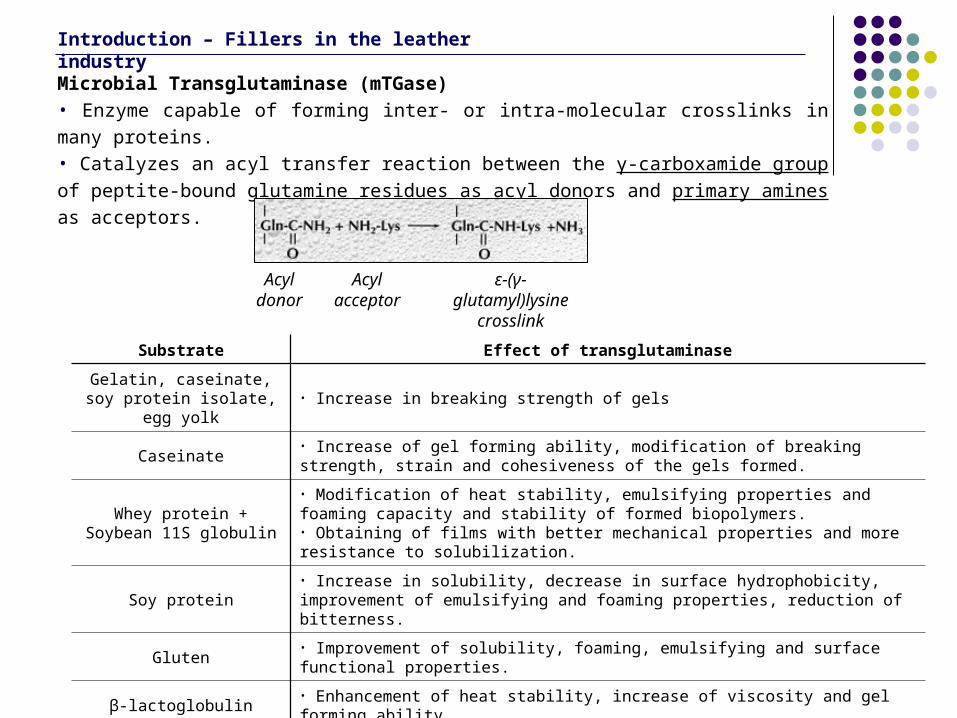
Substrate Effect of transglutaminase
Gelatin, caseinate, soy protein isolate, egg yolk
• Increase in breaking strength of gels
Caseinate• Increase of gel forming ability, modification of breaking strength, strain and cohesiveness of the gels formed.
Whey protein + Soybean 11S globulin
• Modification of heat stability, emulsifying properties and foaming capacity and stability of formed biopolymers.• Obtaining of films with better mechanical properties and more resistance to solubilization.
Soy protein• Increase in solubility, decrease in surface hydrophobicity, improvement of emulsifying and foaming properties, reduction of bitterness.
Gluten • Improvement of solubility, foaming, emulsifying and surface functional properties.
β-lactoglobulin • Enhancement of heat stability, increase of viscosity and gel forming ability.
Microbial Transglutaminase (mTGase)• Enzyme capable of forming inter- or intra-molecular crosslinks in many proteins.• Catalyzes an acyl transfer reaction between the γ-carboxamide group of peptite-bound glutamine
residues as acyl donors and primary amines as acceptors.
Acyl donor
Acyl acceptor
ε-(γ-glutamyl)lysine crosslink
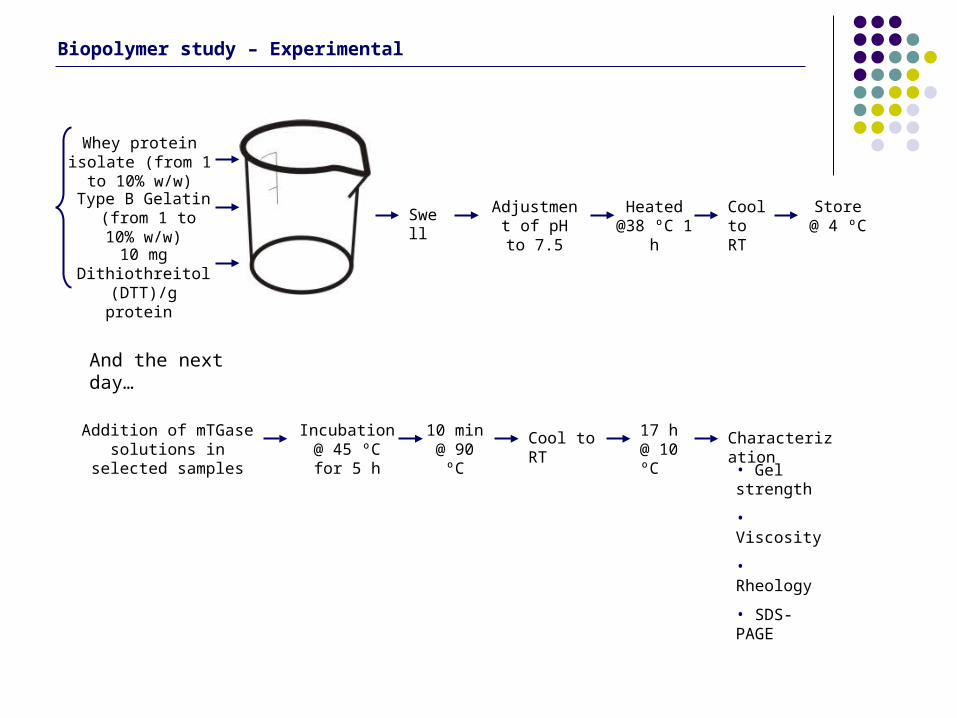
Biopolymer study – Experimental
And the next day…
CharacterizationIncubation @ 45 ºC for 5 h
Addition of mTGase solutions in selected samples
10 min @ 90 ºC
Cool to RT 17 h @ 10 ºC
• Gel strength
• Viscosity
• Rheology
• SDS-PAGE
Whey protein isolate (from 1 to 10% w/w)
Type B Gelatin (from 1 to 10% w/w)
10 mg Dithiothreitol (DTT)/g protein
Swell Heated @38 ºC 1 h
Cool to RT
Adjustment of pH to 7.5
Store @ 4 ºC
Biopolymer study – Results
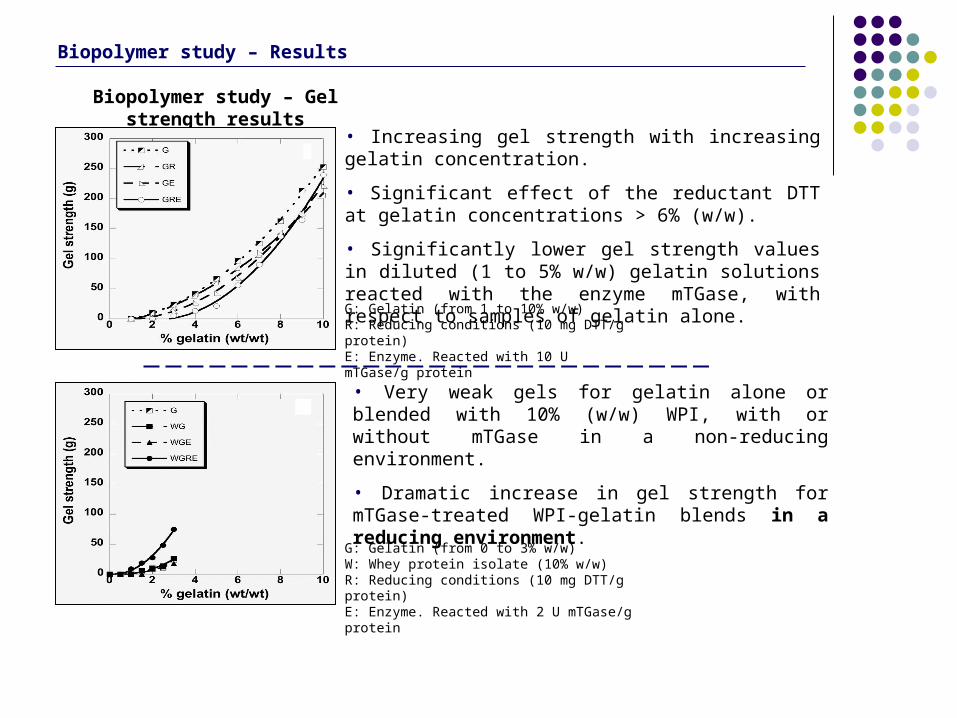
Biopolymer study – Gel strength results
G: Gelatin (from 0 to 3% w/w)W: Whey protein isolate (10% w/w)R: Reducing conditions (10 mg DTT/g protein)E: Enzyme. Reacted with 2 U mTGase/g protein
• Increasing gel strength with increasing gelatin concentration.
• Significant effect of the reductant DTT at gelatin concentrations > 6% (w/w).
• Significantly lower gel strength values in diluted (1 to 5% w/w) gelatin solutions reacted with the enzyme mTGase, with respect to samples of gelatin alone.
G: Gelatin (from 1 to 10% w/w)R: Reducing conditions (10 mg DTT/g protein)E: Enzyme. Reacted with 10 U mTGase/g protein
• Very weak gels for gelatin alone or blended with 10% (w/w) WPI, with or without mTGase in a non-reducing environment.
• Dramatic increase in gel strength for mTGase-treated WPI-gelatin blends in a reducing environment.
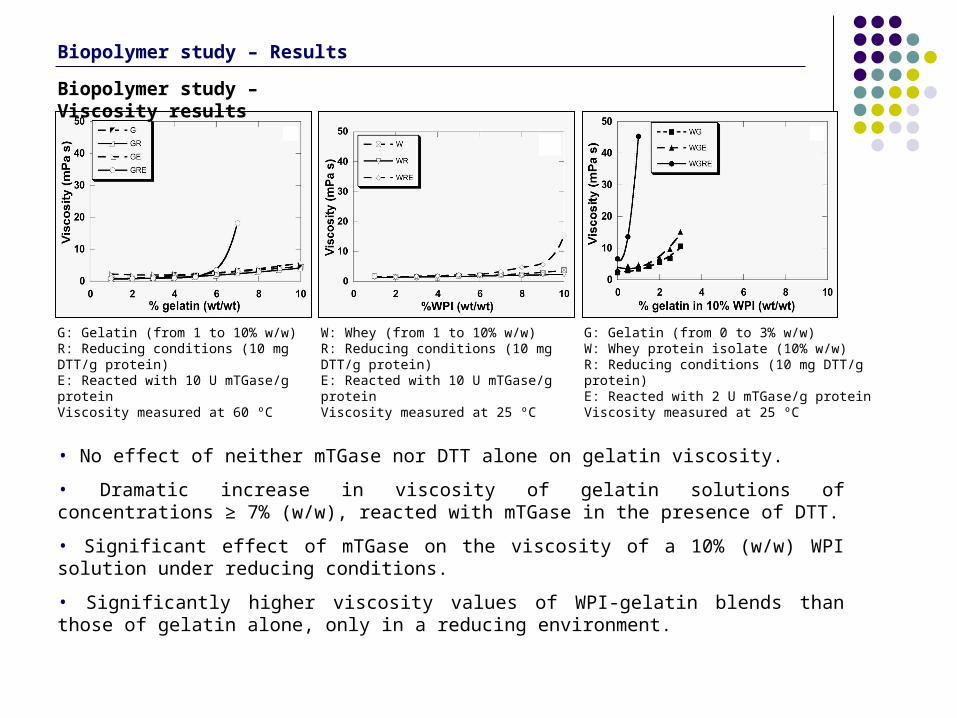
Biopolymer study – Results
Biopolymer study – Viscosity results
G: Gelatin (from 1 to 10% w/w)R: Reducing conditions (10 mg DTT/g protein)E: Reacted with 10 U mTGase/g proteinViscosity measured at 60 ºC
W: Whey (from 1 to 10% w/w)R: Reducing conditions (10 mg DTT/g protein)E: Reacted with 10 U mTGase/g proteinViscosity measured at 25 ºC
G: Gelatin (from 0 to 3% w/w)W: Whey protein isolate (10% w/w)R: Reducing conditions (10 mg DTT/g protein)E: Reacted with 2 U mTGase/g proteinViscosity measured at 25 ºC
• No effect of neither mTGase nor DTT alone on gelatin viscosity.
• Dramatic increase in viscosity of gelatin solutions of concentrations ≥ 7% (w/w), reacted with mTGase in the presence of DTT.
• Significant effect of mTGase on the viscosity of a 10% (w/w) WPI solution under reducing conditions.
• Significantly higher viscosity values of WPI-gelatin blends than those of gelatin alone, only in a reducing environment.
Biopolymer study – Results
Biopolymer study – Rheology results
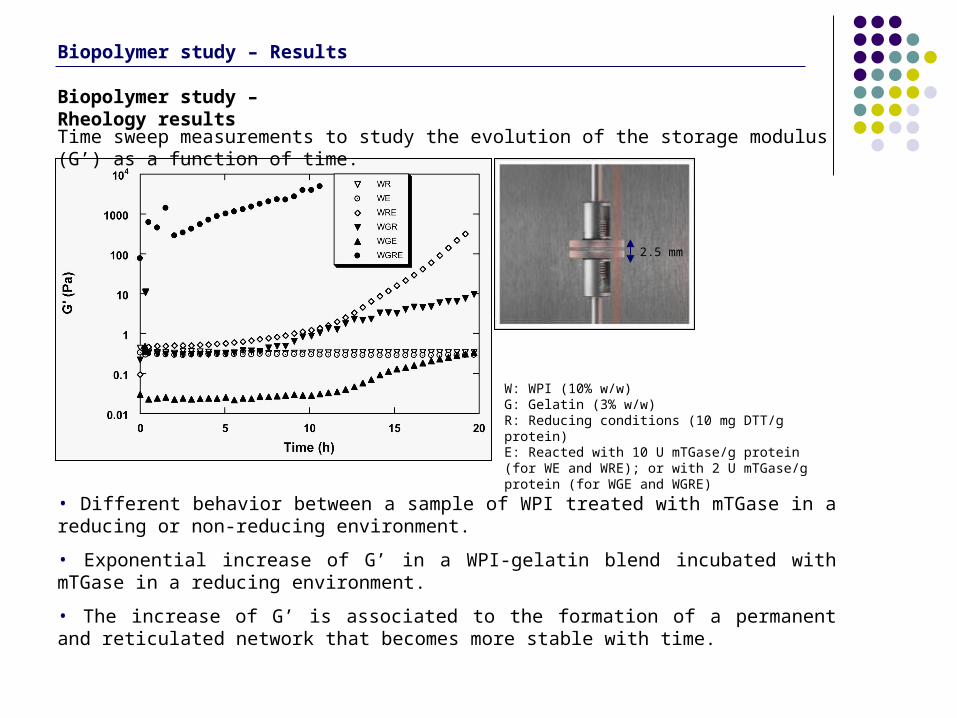
W: WPI (10% w/w)G: Gelatin (3% w/w)R: Reducing conditions (10 mg DTT/g protein)E: Reacted with 10 U mTGase/g protein (for WE and WRE); or with 2 U mTGase/g protein (for WGE and WGRE)
2.5 mm
Time sweep measurements to study the evolution of the storage modulus (G’) as a function of time.
• Different behavior between a sample of WPI treated with mTGase in a reducing or non-reducing environment.
• Exponential increase of G’ in a WPI-gelatin blend incubated with mTGase in a reducing environment.
• The increase of G’ is associated to the formation of a permanent and reticulated network that becomes more stable with time.
Biopolymer study – Results
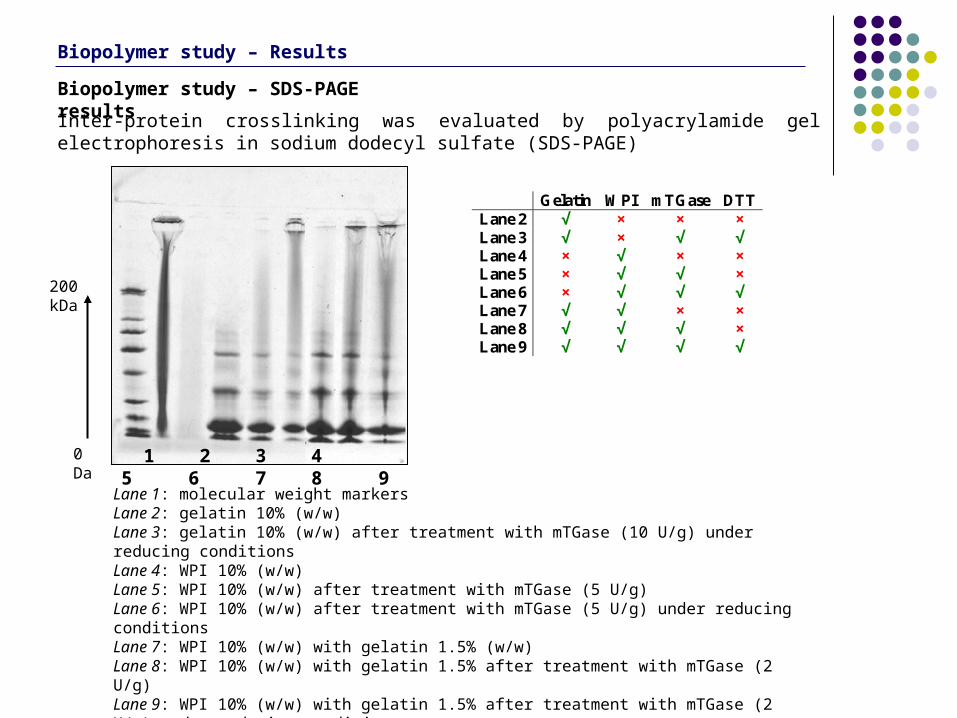
Biopolymer study – SDS-PAGE results
1 2 3 4 5 6 7 8 90 Da
200 kDa
Gelatin WPI mTGase DTT Lane 2 √ × × × Lane 3 √ × √ √ Lane 4 × √ × × Lane 5 × √ √ × Lane 6 × √ √ √ Lane 7 √ √ × × Lane 8 √ √ √ × Lane 9 √ √ √ √
Inter-protein crosslinking was evaluated by polyacrylamide gel electrophoresis in sodium dodecyl sulfate (SDS-PAGE)
Lane 1: molecular weight markersLane 2: gelatin 10% (w/w)Lane 3: gelatin 10% (w/w) after treatment with mTGase (10 U/g) under reducing conditionsLane 4: WPI 10% (w/w)Lane 5: WPI 10% (w/w) after treatment with mTGase (5 U/g)Lane 6: WPI 10% (w/w) after treatment with mTGase (5 U/g) under reducing conditionsLane 7: WPI 10% (w/w) with gelatin 1.5% (w/w)Lane 8: WPI 10% (w/w) with gelatin 1.5% after treatment with mTGase (2 U/g)Lane 9: WPI 10% (w/w) with gelatin 1.5% after treatment with mTGase (2 U/g) under reducing conditions
Biopolymer study – Results
• The addition of minor amounts of relatively low quality gelatin to whey protein improves the strength and stability of gels formed by the action of mTGase in a reducing environment.
• When a small amount of gelatin was added to WPI, before mTGase treatment under reducing conditions, a dramatic rise in viscosity, higher gel strengths, and the appearance of high molecular bands due to inter-protein crosslinking in SDS-PAGE gel patterns than for either gelatin or WPI treated separately were observed.
• The reducing environment partially unfolds the whey proteins, increasing access to glutamine andlysine side chains, favoring the gelatin chains to crosslink the whey proteins to form a network.
• The improvement in physical properties over either protein component, given the same treatment, suggests the possibility of greater utilization and new products from these byproducts.
Biopolymer study – Conclusions
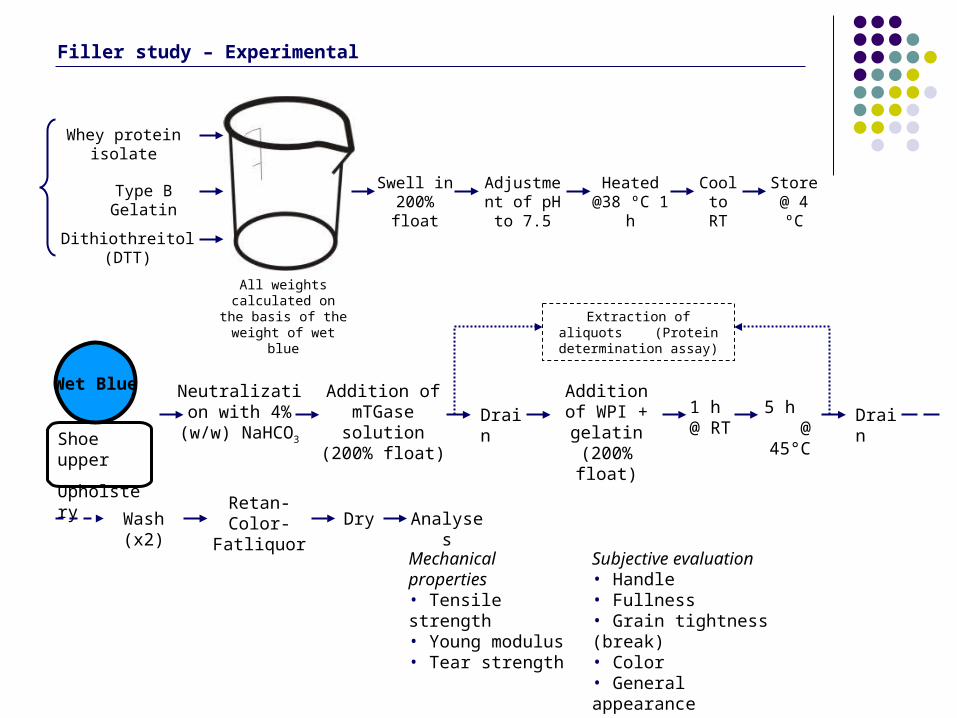
Filler study – Experimental
Mechanical properties• Tensile strength• Young modulus• Tear strength
Subjective evaluation• Handle• Fullness• Grain tightness (break)• Color• General appearance
Extraction of aliquots (Protein determination assay)
All weights calculated on the basis of the weight of wet blue
Whey protein isolate
Type B Gelatin
Dithiothreitol (DTT)
Swell in 200% float
Heated @38 ºC 1 h
Cool to RT
Adjustment of pH to 7.5
Store @ 4 ºC
Addition of WPI + gelatin (200% float)
Retan-Color-Fatliquor
Drain 1 h @ RT
5 h @ 45°C
Neutralization with 4% (w/w)
NaHCO3
Addition of mTGase solution
(200% float)
Wet Blue
Drain
Wash (x2) Dry Analyses
Shoe upper
Upholstery
Filler study – Results
0
10
20
30
40
50
60
0 10 20 30 40 50 60
5% mTGase2.5% mTGase
Time (min)
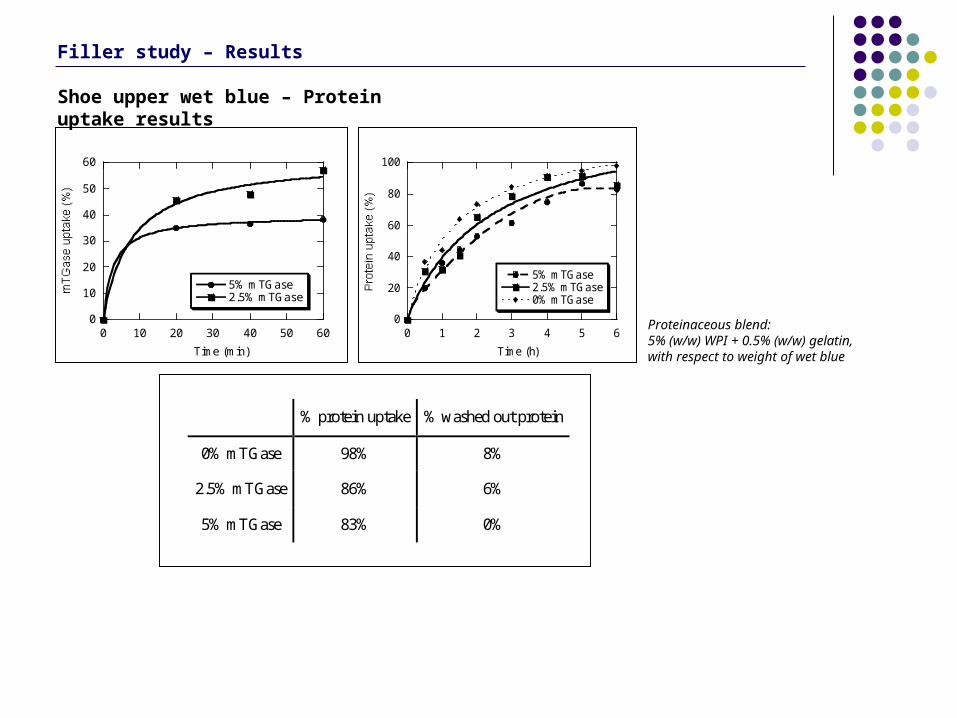
Shoe upper wet blue – Protein uptake results
0
20
40
60
80
100
0 1 2 3 4 5 6
5% mTGase2.5% mTGase0% mTGase
Time (h)
Proteinaceous blend: 5% (w/w) WPI + 0.5% (w/w) gelatin, with respect to weight of wet blue
% protein uptake % washed out protein
0% mTGase 98% 8%
2.5% mTGase 86% 6%
5% mTGase 83% 0%
Filler study – Results
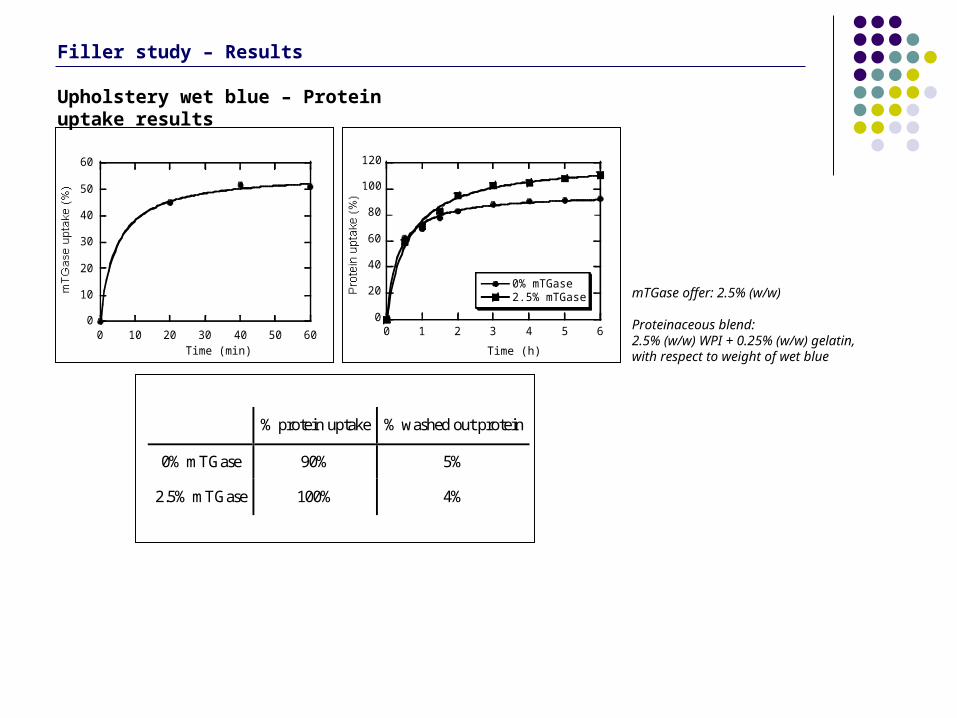
Upholstery wet blue – Protein uptake results
0
10
20
30
40
50
60
0 10 20 30 40 50 60Time (min)
0
20
40
60
80
100
120
0 1 2 3 4 5 6
0% mTGase2.5% mTGase
Time (h)
mTGase offer: 2.5% (w/w)
Proteinaceous blend:2.5% (w/w) WPI + 0.25% (w/w) gelatin, with respect to weight of wet blue
% protein uptake % washed out protein
0% mTGase 90% 5%
2.5% mTGase 100% 4%
Filler study – Results
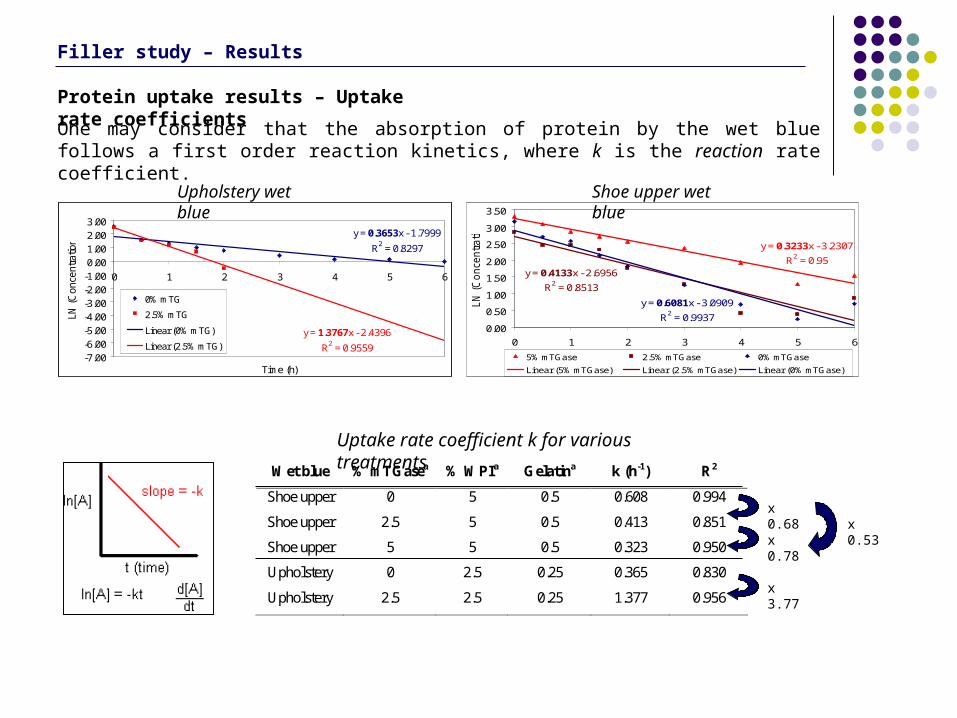
Protein uptake results – Uptake rate coefficients
One may consider that the absorption of protein by the wet blue follows a first order reaction kinetics, where k is the reaction rate coefficient.
Wet blue % mTGasea % WPIa Gelatina k (h-1) R2
Shoe upper 0 5 0.5 0.608 0.994
Shoe upper 2.5 5 0.5 0.413 0.851
Shoe upper 5 5 0.5 0.323 0.950
Upholstery 0 2.5 0.25 0.365 0.830
Upholstery 2.5 2.5 0.25 1.377 0.956
Uptake rate coefficient k for various treatments
x 0.68
x 0.78x 0.53
x 3.77
y = 0.3653x - 1.7999
R2 = 0.8297
y = 1.3767x - 2.4396
R2 = 0.9559-7.00-6.00-5.00-4.00-3.00-2.00-1.000.001.002.003.00
0 1 2 3 4 5 6
Time (h)
LN
(C
once
ntratio
n)
0% mTG
2.5% mTG
Linear (0% mTG)
Linear (2.5% mTG)
Upholstery wet blue
y = 0.3233x - 3.2307
R2 = 0.95y = 0.4133x - 2.6956
R2 = 0.8513
y = 0.6081x - 3.0909
R2 = 0.99370.00
0.50
1.00
1.50
2.00
2.50
3.00
3.50
0 1 2 3 4 5 6
Time (h)
LN
(C
once
ntratio
n)
5% mTGase 2.5% mTGase 0% mTGase
Linear (5% mTGase) Linear (2.5% mTGase) Linear (0% mTGase)
Shoe upper wet blue
Filler study – Results
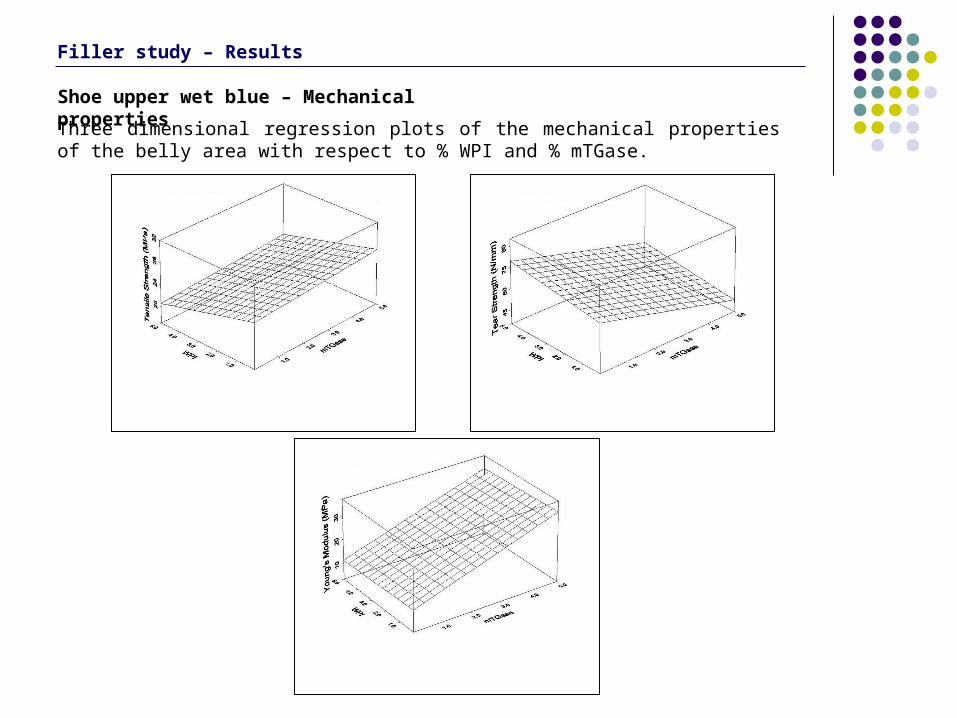
Shoe upper wet blue – Mechanical properties
Three dimensional regression plots of the mechanical properties of the belly area with respect to % WPI and % mTGase.
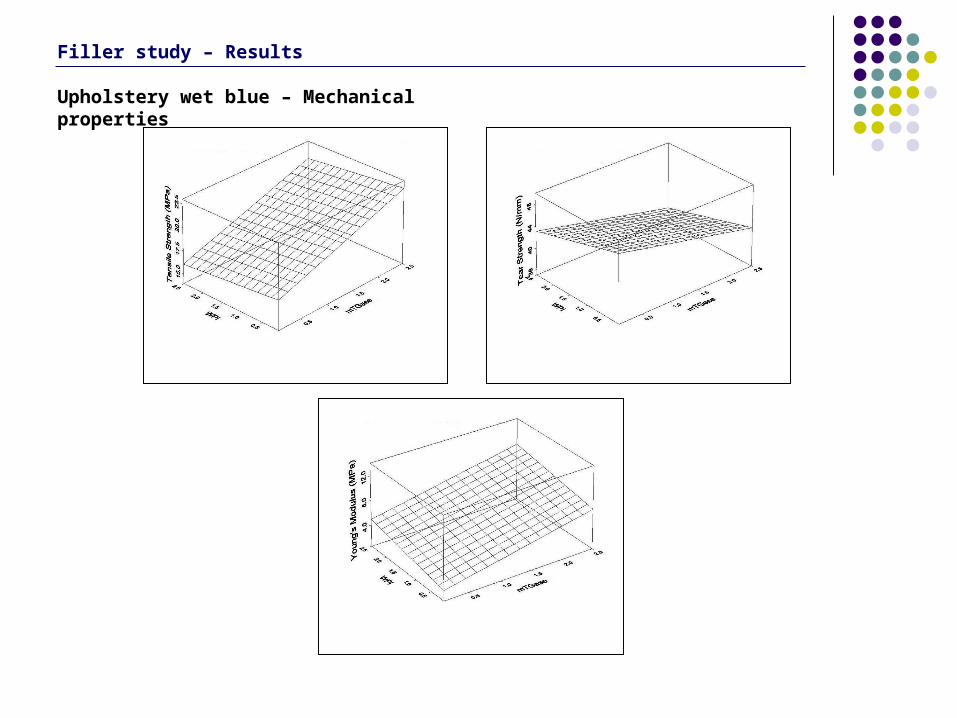
Upholstery wet blue – Mechanical properties
Filler study – Results
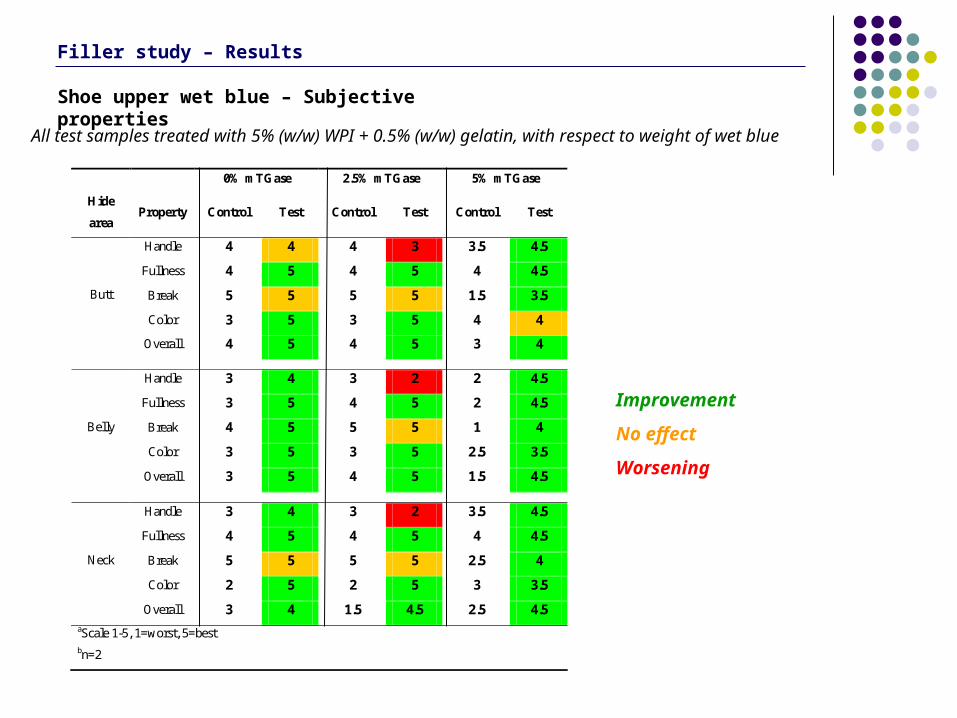
Shoe upper wet blue – Subjective properties
0% mTGase 2.5% mTGase 5% mTGase
Hide
area Property Control Test Control Test Control Test
Handle 4 4 4 3 3.5 4.5
Fullness 4 5 4 5 4 4.5
Break 5 5 5 5 1.5 3.5
Color 3 5 3 5 4 4
Butt
Overall 4 5 4 5 3 4
Handle 3 4 3 2 2 4.5
Fullness 3 5 4 5 2 4.5
Break 4 5 5 5 1 4
Color 3 5 3 5 2.5 3.5
Belly
Overall 3 5 4 5 1.5 4.5
Handle 3 4 3 2 3.5 4.5
Fullness 4 5 4 5 4 4.5
Break 5 5 5 5 2.5 4
Color 2 5 2 5 3 3.5
Neck
Overall 3 4 1.5 4.5 2.5 4.5 aScale 1-5, 1=worst, 5=best bn=2
All test samples treated with 5% (w/w) WPI + 0.5% (w/w) gelatin, with respect to weight of wet blue
Filler study – Results
Improvement
No effect
Worsening
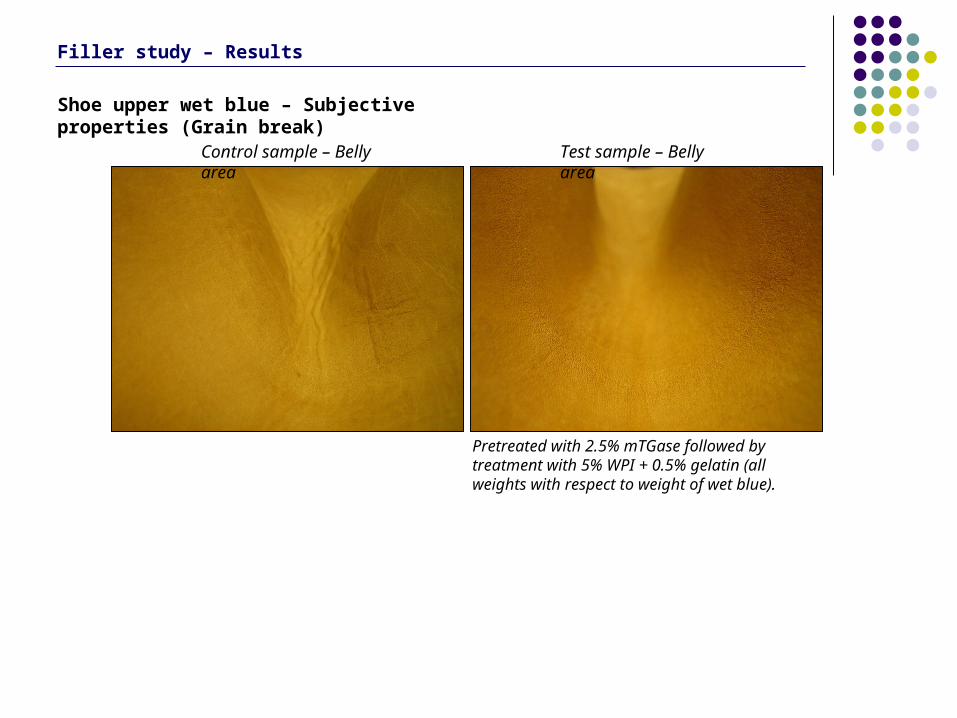
Shoe upper wet blue – Subjective properties (Grain break)
Control sample – Belly area
Pretreated with 2.5% mTGase followed by treatment with 5% WPI + 0.5% gelatin (all weights with respect to weight of wet blue).
Test sample – Belly area
Filler study – Results
Filler study – Results
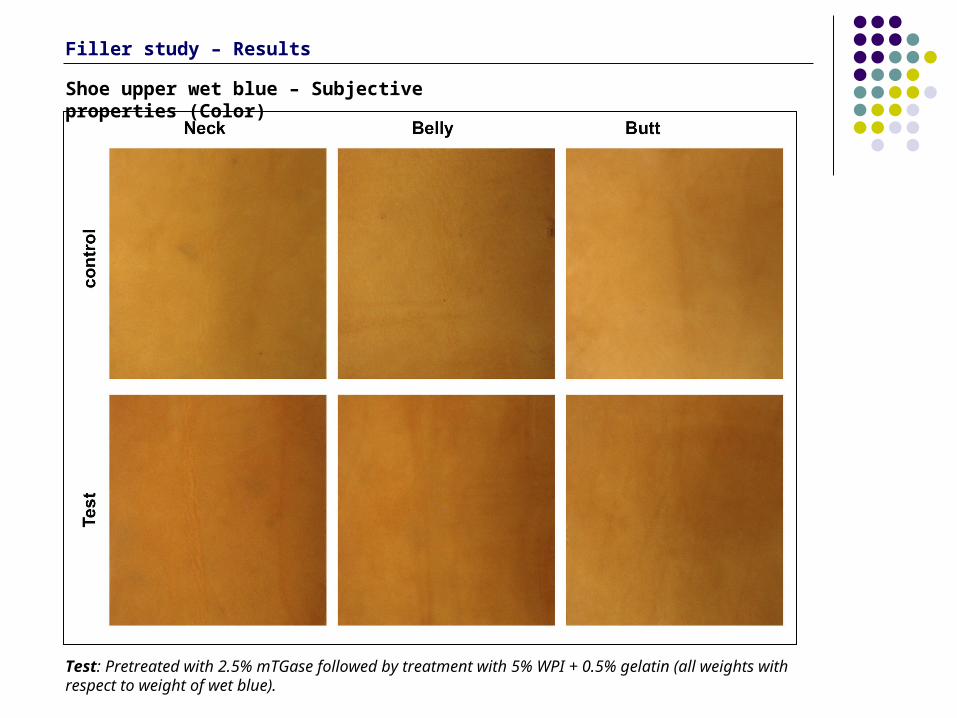
Shoe upper wet blue – Subjective properties (Color)
Test: Pretreated with 2.5% mTGase followed by treatment with 5% WPI + 0.5% gelatin (all weights with respect to weight of wet blue).
Filler study – Results
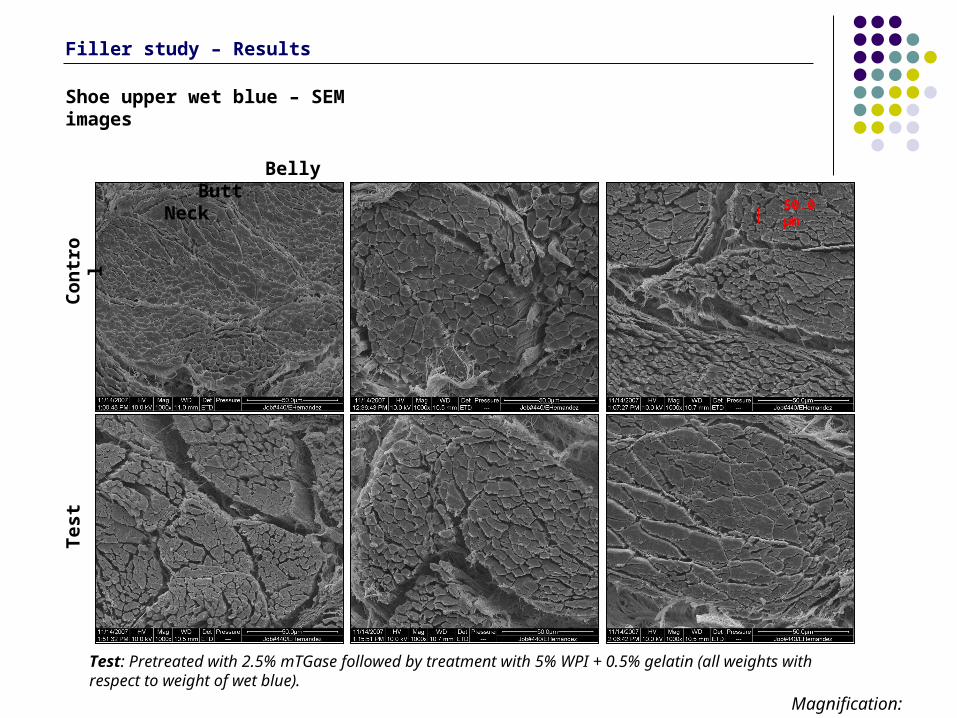
Belly Butt Neck
Con
trol
Tes
tShoe upper wet blue – SEM images
Magnification: x1000
Test: Pretreated with 2.5% mTGase followed by treatment with 5% WPI + 0.5% gelatin (all weights with respect to weight of wet blue).
50.0 μm
Filler study – Results
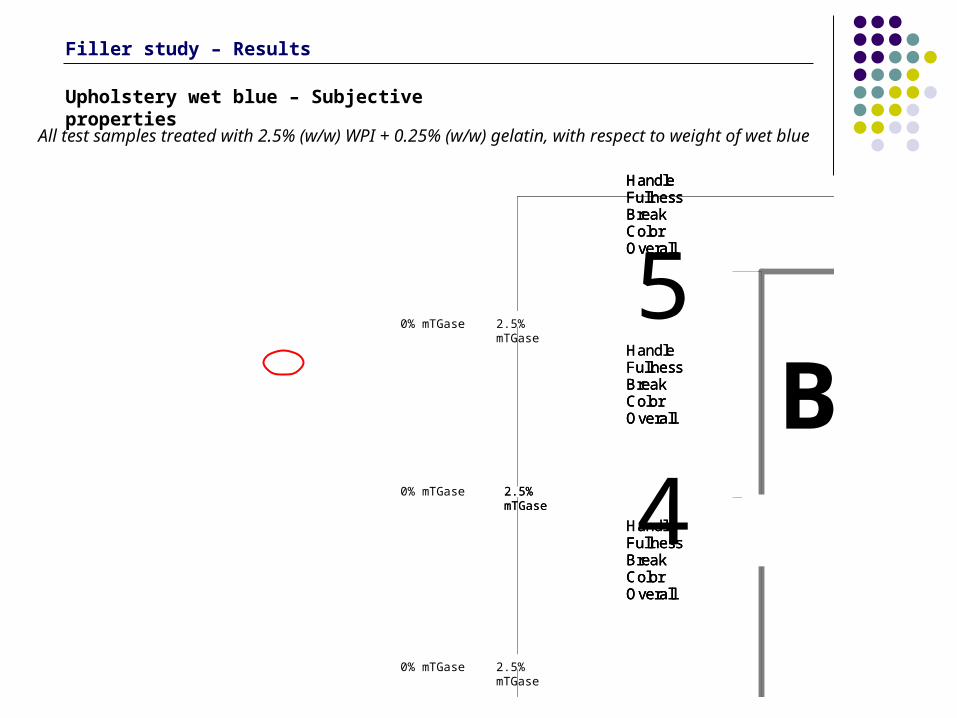
Upholstery wet blue – Subjective properties
2.5% mTGase
Butt
0
1
2
3
4
5
Control Treatment D Treatment E
Handle
BreakFullness
ColorOverall
Handle
BreakFullness
ColorOverall
Handle
BreakFullness
ColorOverall
Butt
0
1
2
3
4
5
Control Treatment D Treatment E
Handle
BreakFullness
ColorOverall
Handle
BreakFullness
ColorOverall
BreakFullness
ColorOverall
Handle
BreakFullness
ColorOverall
Handle
BreakFullness
ColorOverall
BreakFullness
ColorOverall
Handle
BreakFullness
ColorOverall
Handle
BreakFullness
ColorOverall
BreakFullness
ColorOverall
2.5% mTGase
0% mTGase
0% mTGase
0% mTGase
2.5% mTGase
2.5% mTGase
2.5% mTGase
All test samples treated with 2.5% (w/w) WPI + 0.25% (w/w) gelatin, with respect to weight of wet blue
Filler study – Conclusions
• A blend composed by whey protein isolate along with small amounts of gelatin was successfully applied as a filling agent for upholstery and shoe upper leather.
• Subjective properties such as fullness, handle and color of the resulting crust leather was significantly improved over the samples that did not undergo the treatment with the WPI-gelatin blend.
• The grain break for shoe upper and upholstery leather fared markedly better when samples were pretreated with mTGase.
• The pretreatment of the samples with a solution of mTGase affected the protein uptake ratio k and the trend observed was reverse for the cases of shoe upper and upholstery leather.
• Filled samples were a little stiffer and presented slight lower tear strength than the control. However, the various treatments did not negatively affect the mechanical properties of crust leather.
• It opens up the possibility of exploring even cheaper sources of protein as a raw material for bio-based leather products.
Future work – Renewable biopolymers as filling agents for leather
• It would be interesting to look into the possibility of using keratin, the main protein in the cattle hair and wool, as a cheap and readily available source of protein.
• The reaction between the proteinaceous substrate and a carbodiimide (e.g. 1-ethyl-3-(3-dimethylaminopropyl) carbodiimide hydrochloride, EDC) prior to the enzymatic treatment with mTGase would be an interesting approach to increase the reactivity of the proteins towards the enzyme.
• Scaling up of the filling process. By doing so, a lesser concentrations of reactants and volume of float would be needed due to a stronger mechanical action.
• It would be interesting to make the filler from the tannery's solid waste (e.g. chrome shavings). By doing this, they would not only adding value to a byproduct that it is usually landfilled, but they would also be increasing the value of low quality hides that will be treated with the product.

Acknowledgements
Universitat de Barcelona – Facultat de Química
• Dr. José Costa
• Dra. Carme González
• Blaia Martínez
• Manoli Mora
Consell Superior d’Investigacions Científiques
• Prof. Jaume Cot
• Dr. Agustí Marsal
• Dr. Albert Mª Manich
• Sr. Josep Carilla
• Dra. Merche Catalina
• Dr. Fernando Fernández
• Elena Bautista
Eastern Regional Research Center
• Ellie Brown, PhD
• Ms. Maryann Taylor
• Ms. Laurelie Bumanlag
• William Marmer, PhD
• Cheng-Kung Liu, PhD
• Daniel K.Y. Solaiman, PhD
• Peter Cooke, PhD
• John Phillips, PhD
• Mr. Nick Latona
• Ms. Renée Latona
• Mr. Joe Lee
• All the visiting scientits I met during my stay at the ERRC.
Tomas Bata University (Czech Republic)
• Prof. Karel Kolomazník
• Michaela Uhlirova, PhD
My Family
THANK YOU