Embed Size (px)
Citation preview

Splunk Reference Architecture
v1.0 – June 2013

2
Splunk on Nutanix | 2
Copyright 2013 Nutanix, Inc.
All rights reserved. This product is protected by U.S. and international copyright and intellectual property laws.
Nutanix is a trademark of Nutanix, Inc. in the United States and/or other jurisdictions. All other marks and names mentioned herein may be trademarks of their respective companies.

3
Splunk on Nutanix | 3
Table of Contents
1. Executive Summary ..................................................................................... 5
2. Introduction .................................................................................................. 6
3. Solution Overview ........................................................................................ 7
3.1. What is the Nutanix Architecture? .......................................................................... 7
3.2. What is Splunk? ..................................................................................................... 8
3.3. Splunk the Nutanix Way ....................................................................................... 12
4. Solution Design .......................................................................................... 16
4.1. Single Instance Splunk Deployment .................................................................... 16
4.2. Distributed Splunk Deployment ............................................................................ 18
4.3. General Sizing ...................................................................................................... 20
4.4. Splunk Storage Sizing .......................................................................................... 22
4.5. Splunk Component Sizing .................................................................................... 24
4.6. Nutanix ................................................................................................................. 25
4.7. Network ................................................................................................................ 26
5. Validation & Benchmarking ........................................................................ 27
5.1. Environment Overview ......................................................................................... 27
5.2. Test Scripts & Configurations .............................................................................. 29
5.3. Benchmarks ......................................................................................................... 34
5.4. How to Interpret the Results ................................................................................ 35
6. Results ....................................................................................................... 38
6.1. SplunkIT ............................................................................................................... 38
6.2. Bonnie++ .............................................................................................................. 43
7. Further Research ....................................................................................... 45
8. Conclusion ................................................................................................. 46
9. Appendix: Configuration ............................................................................. 47

4
Splunk on Nutanix | 4
10. References ................................................................................................ 49
10.1. Table of Figures ................................................................................................... 49
10.2. Table of Tables .................................................................................................... 49
11. About the Author ........................................................................................ 51

5
Splunk on Nutanix | 5
1. Executive Summary
This document makes recommendations for the design, optimization and scaling of Splunk deployments on Nutanix. It shows the scalability of the Nutanix Virtual Computing Platform and provides detailed performance and configuration information on the scale-out capabilities of the cluster when leveraged for Splunk deployments.
Extensive testing has been performed to simulate real-world workloads and conditions of a Splunk environment on Nutanix. The sizing data and recommendations made in this document are based upon multiple testing iterations and thorough technical validation. The solution and testing data was completed with Splunk deployed on VMware vSphere, both running on the Nutanix virtual computing platform. Testing validation was done using SplunkIT and Bonnie++.
The Nutanix platform offers the ability to run both Splunk and VM workloads simultaneously on the same platform. Density for Splunk deployments will be primarily driven by the co-hosted VM’s resource requirements and not due to any Splunk bottleneck. The platform was easily able to handle the IOPS and throughput requirements for Splunk instances. Sizing for the pods was determined after careful consideration of performance as well as accounting for additional resource for N+1 failover capabilities.
The SplunkIT tests showed very light IO footprints given the fact the data generation is single threaded. A single Splunk VM running with 8 vCPUs and 8GB memory was able to index an average of ~80,000-89,000 events per second (EPS) and multiple of these were able to index an average of ~340,000-500,000 events per second (EPS). Average time to first event (TFE) was ~1.9 seconds and average time to search (TTS) was ~16 seconds. The Splunk VM CPU utilization peaked at ~78% during the test runs. During peak load read latency averaged <1ms.

6
Splunk on Nutanix | 6
2. Introduction
Audience
This reference architecture document is part of the Nutanix Solutions Library and is intended for architecting, designing, managing, and/or supporting Nutanix infrastructures. Consumers of this document should be already familiar with VMware vSphere, Splunk, and Nutanix.
This document has been broken down to address key items for each role focusing on the enablement of a successful design, implementation, and transition to operation.
Purpose
This document will cover the following subject areas:
o Overview of the Nutanix solution
o Overview of Splunk and its use cases
o The benefits of Splunk on Nutanix
o Architecting a complete Splunk solution on the Nutanix platform
o Design and configuration considerations when architecting a Splunk solution on Nutanix
o Benchmarking Splunk performance on Nutanix

7
Splunk on Nutanix | 7
3. Solution Overview
3.1. What is the Nutanix Architecture?
The Nutanix Virtual Computing Platform is a scale-out cluster of high-performance nodes, or servers, each running a standard hypervisor and containing processors, memory and local storage (consisting of PCIe SSD Flash and high capacity SATA disk drives). Each node runs virtual machines just like a standard virtual machine host. In addition, local storage from all nodes is virtualized into a unified pool by the Nutanix Distributed File System (NDFS) (Figure 1). In effect, NDFS acts like an advanced NAS that uses local SSDs and disks from all nodes to store virtual machine data. Virtual machines running on the cluster write data to NDFS as if they were writing to shared storage. NDFS is VM aware and provides advanced data management features. It brings data closer to virtual machines by storing the data locally on the system, resulting in higher performance at a lower cost. Nutanix Complete Cluster can horizontally scale from as few as three nodes to a large number of nodes, enabling organizations to scale their infrastructure as their needs grow.
Figure 1 Nutanix Architecture
Inspired by the Google File System, NDFS delivers a unified pool of storage from all nodes across the cluster, leveraging techniques including striping, replication, auto-tiering, error detection, failover and automatic recovery. This pool can then be presented as shared storage resources to VMs for seamless support of features like vMotion, HA, and DRS, along with industry-leading data management features. Additional nodes can be added in a plug-and-play manner in this high-performance scale-out architecture to build a cluster that will easily grow as your needs do.
8
Splunk on Nutanix | 8
3.2. What is Splunk?1
Indexes Any Data from Any Source
Splunk Enterprise collects and indexes any machine-generated data from virtually any source, format or location in real time. This includes data streaming from packaged and custom applications, app servers, web servers, databases, networks, virtual machines, telecom equipment, operating systems, sensors and much more. There's no requirement to "understand" the data upfront. Just point Splunk Enterprise at your data, and it immediately starts collecting and indexing—so you can start searching and analyzing.
Figure 2 Splunk Overview
Forwards Data from Remote Systems
Splunk forwarders can be deployed in situations where the data you need isn't visible over the network. Splunk forwarders deliver reliable, secure, real-time data collection for up to tens of thousands of sources. They can monitor local application logfiles, capture the output of status commands on a schedule, grab performance metrics from virtual or non-virtual sources or watch the file system for configuration, permissions and attribute changes. They are lightweight, can be deployed quickly and at no additional cost.
Correlates Complex Events
With Splunk Enterprise you can correlate complex events spanning many diverse data sources across your environment. Types of correlation include:
o Time-based correlations, to identify relationships based on time, proximity or distance
o Transaction-based correlations, to track a series of related events as a single transaction to measure duration, status or other analysis
1 http://www.splunk.com/view/splunk/SP-CAAAG57
9
Splunk on Nutanix | 9
o Sub-searches, taking the results of one search and using them in another
o Lookups, correlating with external data sources outside of Splunk
o Joins, to support SQL-like inner and outer joins
Delivers Enterprise-class Scale, Resilience and Interoperability
Splunk Enterprise scales to collect and index tens of terabytes of data per day. And because the insights from your data are mission-critical, Splunk software's index replication technology provides the availability you need, even as you scale out your low-cost, distributed computing environment. Automatic load balancing optimizes workloads and response times and provides built-in failover support. Out-of-the-box reporting and analytics capabilities deliver rapid insights from your data.
Splunk DB Connect delivers reliable, scalable, real-time integration between Splunk and traditional relational databases. Splunk Hadoop Connect provides bi-directional integration to easily and reliably move data between Splunk Enterprise and Hadoop.
A Platform for Enterprise Apps
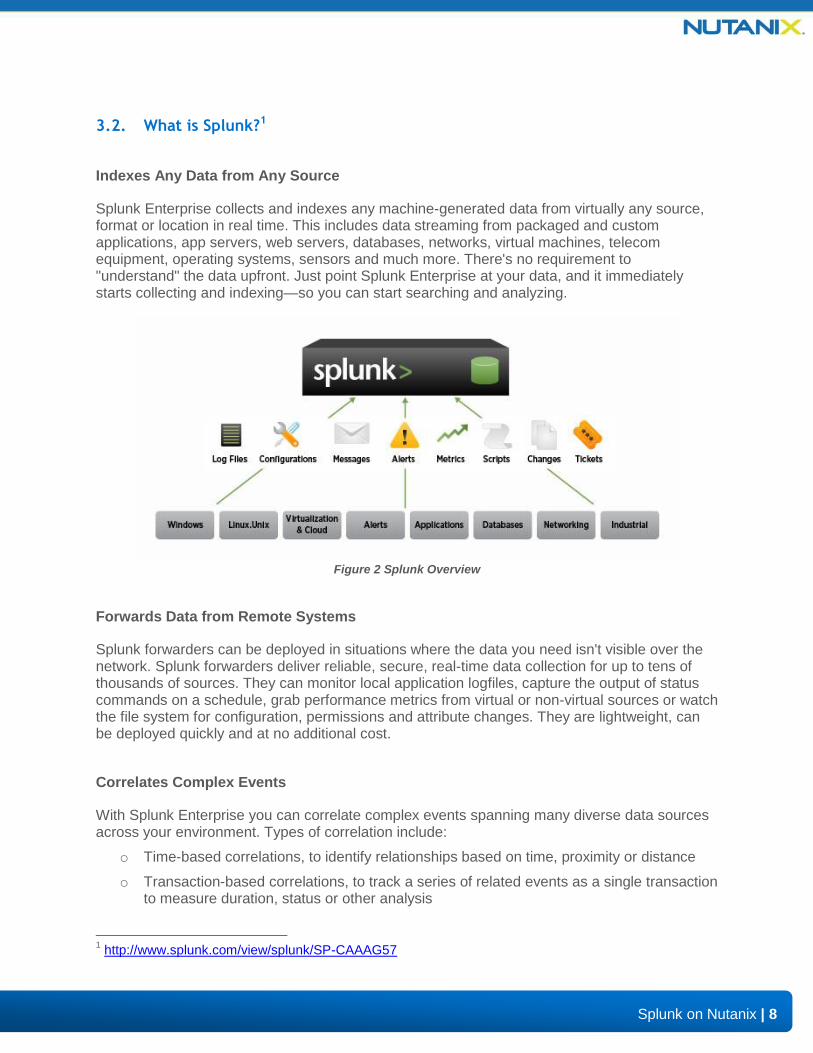
Developer teams will find a whole host of ways to leverage Splunk Enterprise. Debug and troubleshoot applications during development and test cycles or integrate data from Splunk Enterprise into custom applications. Output data from any API endpoint in JSON and ensure custom Splunk development over time, with API versioning. Splunk Enterprise ships with the JavaScript SDK with additional downloadable SDKs for Java, Python and PHP making it easy to customize and extend the power of Splunk Enterprise.
Figure 3 Splunk App Platform
10
Splunk on Nutanix | 10
Deployment Scenario – Single Instance2
In single-machine deployments, one instance of Splunk handles the entire end-to-end process, from data input through indexing to search. A single-machine deployment can be useful for testing and evaluation purposes and might serve the needs of department-sized environments. For larger environments, however, where data originates on many machines and where many users need to search the data, you'll want to distribute functionality across multiple Splunk instances.
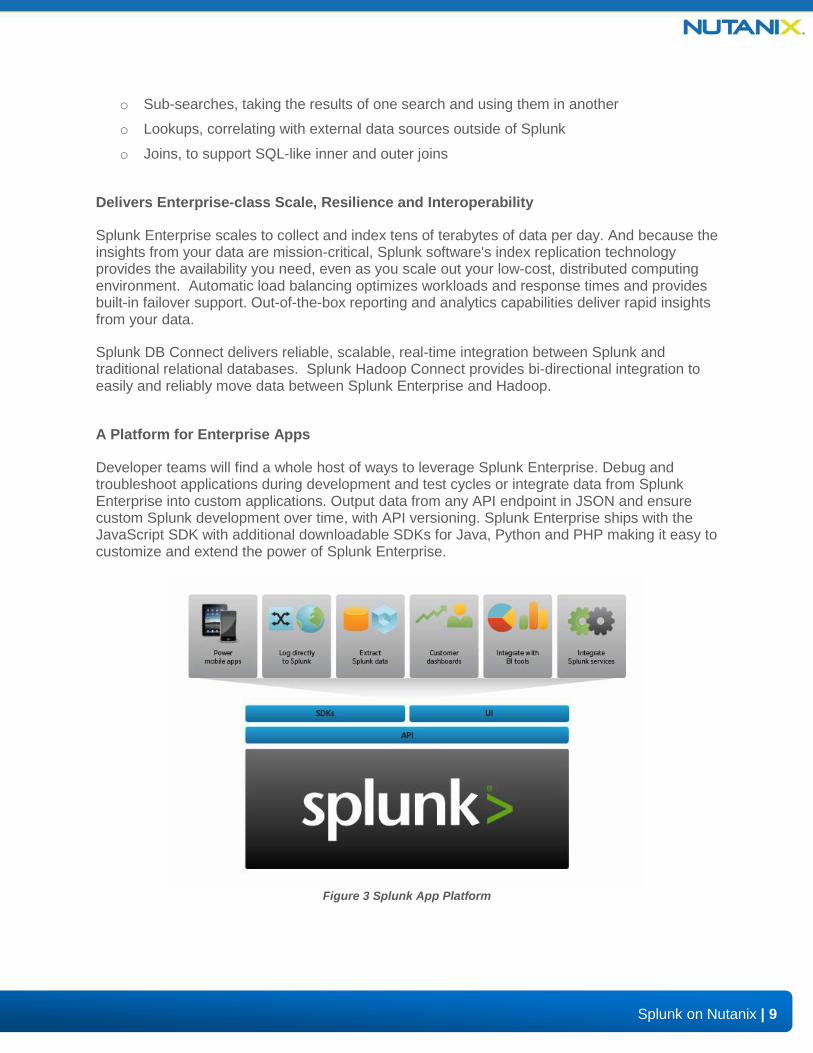
A typical mid-size deployment, for example, you can deploy lightweight versions of Splunk, called forwarders, on the machines where the data originates. The forwarders consume data locally and then forward the data across the network to another Splunk component, called the indexer. The indexer does the heavy lifting; it indexes the data and runs searches. It should reside on a machine by itself. The forwarders, on the other hand, can easily co-exist on the machines generating the data, because the data-consuming function has minimal impact on machine performance. This diagram shows several forwarders sending data to a single indexer:
Figure 4 Splunk Single Indexer
As you scale up, you can add more forwarders and indexers. For a larger deployment, you might have hundreds of forwarders sending data to a number of indexers. You can use load balancing on the forwarders, so that they distribute their data across some or all of the indexers. Not only does load balancing help with scaling, but it also provides a fail-over capability if one of the indexers goes down. The forwarders automatically switch to sending their data to any indexers that remain alive. In this diagram, each forwarder load-balances its data across two indexers:
Figure 5 Splunk Multiple Indexer
2 http://docs.splunk.com/Documentation/Splunk/5.0.2/Deploy/Distributedoverview

11
Splunk on Nutanix | 11
Deployment Scenario – Distributed Cluster
To coordinate and consolidate search activities across multiple indexers, you can also separate out the functions of indexing and searching. In this type of deployment, called distributed search, each indexer just indexes data and performs searches across its own indexes. A Splunk instance dedicated to search management, called the search head, coordinates searches across the set of indexers, consolidating the results and presenting them to the user:
Figure 6 Splunk Distributed Cluster

12
Splunk on Nutanix | 12
3.3. Splunk the Nutanix Way
The Nutanix platform operates and scales Splunk in conjunction with the other hosted services providing a single scalable platform for all deployments. For existing sources and platforms, machine data can be sent to the Splunk platform on Nutanix over the network. The figure below shows a high-level view of the Splunk on Nutanix solution:
SCA
LE
SCA
LE
Indexer(s) Search Head(s)
Operational Intelligence
Machine Data
Service Interaction
UsersUsers
DesktopsDesktops Applications/DataApplications/Data ServersServers
External SourcesExternal Sources
Figure 7 Splunk on Nutanix Conceptual Arch
The Nutanix approach of modular scale-out enables customers to select any initial deployment size and grow in more granular data and desktop increments. This removes the hurdle of a large up-front infrastructure purchase that a customer will need many months or years to grow into, ensuring a faster time-to-value for the Splunk implementation.

13
Splunk on Nutanix | 13
Data Tiering and Management
Splunk has a built-in mechanism to automatically age index data as it grows stale. An index consists of multiple directories known as buckets. These buckets are leveraged as data storage mechanism and will progress (aka “roll”) through various stages as the data ages.
All newly indexed data is written to a hot bucket which is searchable and after reaching a particular size is rolled to a warm bucket. Warm buckets are not actively written to, however still remain searchable. As newly rolled buckets are rolled into the warm stage the oldest buckets in the warm stage are moved to the cold stage. After a set period of time the cold buckets roll to frozen where they are either archived or deleted.
Similar to Splunk, NDFS has a built-in Information Lifecycle Management (ILM) process which will automatically handle data placement. Applying this to the data lifecycle in Splunk, all hot data is automatically written to the high performance SSD tier. Both hot and warm data sit in this tier to be readily accessed and provide the highest performance. An in-memory read cache is leveraged to cache frequently accessed data from all tiers. However, given the sequential nature of Splunk IO, Nutanix ILM can be configured to automatically bypass the SSD tier for sequential workloads.
Nutanix DFSNutanix DFSSplunkSplunk
HotHot
WarmWarm
ColdCold
FrozenFrozen
Read CacheRead Cache
SSDSSD
HDDHDD CompressedCompressed
Index Index n...
Ro
llin
g P
roce
ss
Search
/Re
ad IO
Wri
te IO
ND
FS ILM
TierPlacement
*NOTE: Sequential IO can be configured to bypass SSD and be directly written to the HDD tier.
Figure 8 Splunk ILM Mapping
As Splunk rolls data from warm to the cold and frozen tiers Nutanix ILM will automatically see the data is cooling down and migrate the data from SSD to the higher-capacity HDD tier in order to free SSD space for new hot data. As mentioned above, this data can also be configured to automatically bypass the SSD tier and be written directly to HDD. This data can then be automatically compressed after a specified period of time to allow for increased storage capacity. In the event this data becomes accessed again it will automatically become un-compressed and placed on the appropriate tier.
14
Splunk on Nutanix | 14
Data IO Detail
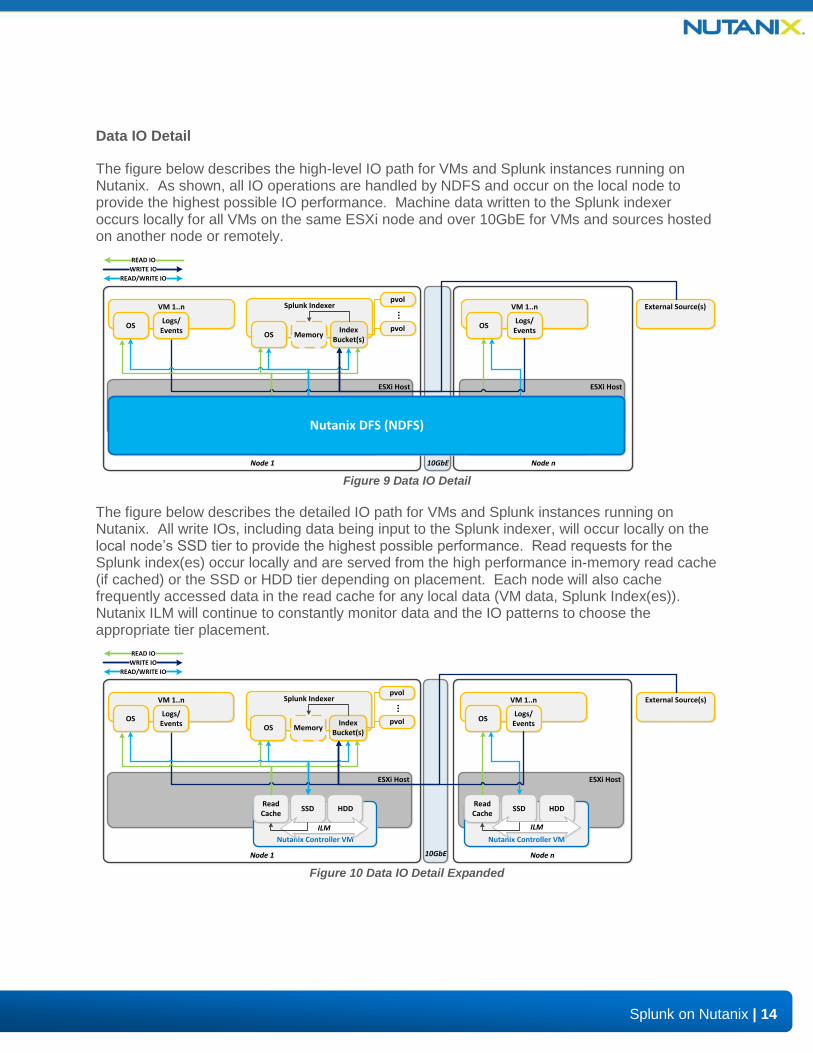
The figure below describes the high-level IO path for VMs and Splunk instances running on Nutanix. As shown, all IO operations are handled by NDFS and occur on the local node to provide the highest possible IO performance. Machine data written to the Splunk indexer occurs locally for all VMs on the same ESXi node and over 10GbE for VMs and sources hosted on another node or remotely.
ESXi Host
Nutanix CVM
ReadCache
HDDSSD
pvol
pvol
Splunk Indexer
OS MemoryIndex
Bucket(s)
VM 1..n
OS
Node 1Node 1
...
READ IO
READ/WRITE IO
WRITE IO
ESXi Host
Nutanix CVM
ReadCache
HDDSSD
VM 1..n
OS
Node nNode n
ILM
ILM
Logs/Events
Logs/Events
Nutanix DFS (NDFS)
External Source(s)
10GbE
Figure 9 Data IO Detail
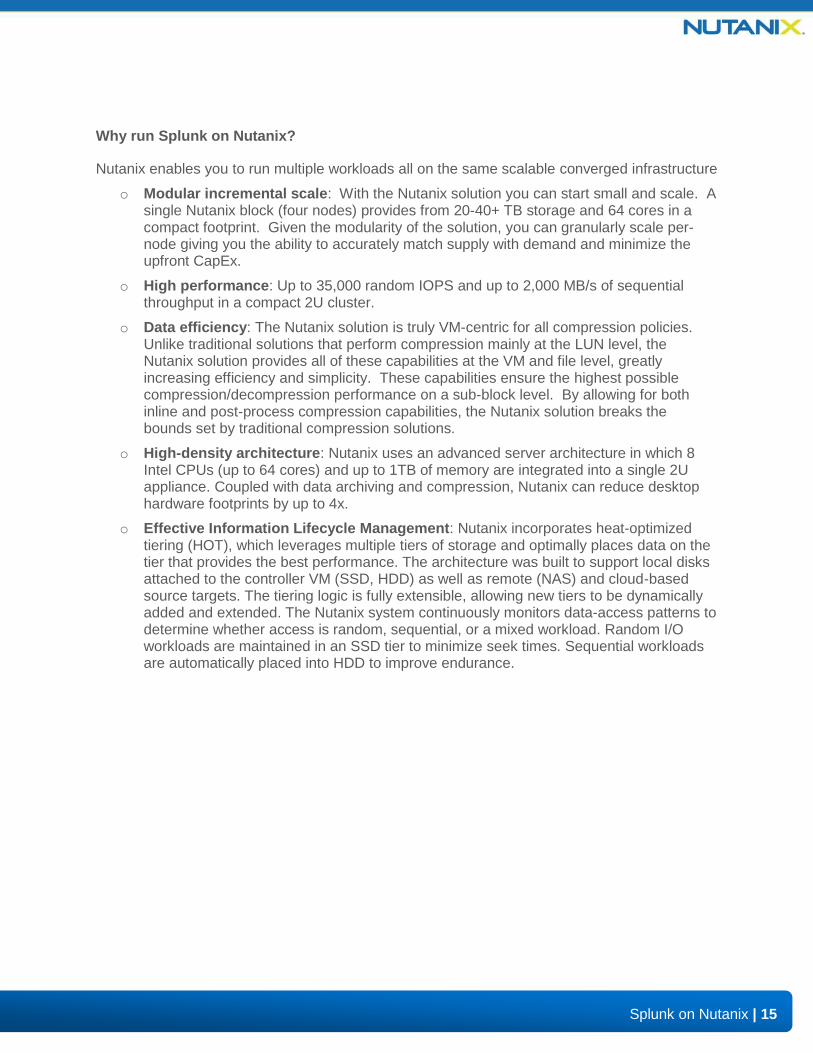
The figure below describes the detailed IO path for VMs and Splunk instances running on Nutanix. All write IOs, including data being input to the Splunk indexer, will occur locally on the local node’s SSD tier to provide the highest possible performance. Read requests for the Splunk index(es) occur locally and are served from the high performance in-memory read cache (if cached) or the SSD or HDD tier depending on placement. Each node will also cache frequently accessed data in the read cache for any local data (VM data, Splunk Index(es)). Nutanix ILM will continue to constantly monitor data and the IO patterns to choose the appropriate tier placement.
ESXi Host
Nutanix Controller VM
ReadCache
HDDSSD
pvol
pvol
Splunk Indexer
OS MemoryIndex
Bucket(s)
VM 1..n
OS
Node 1Node 1
...
READ IO
READ/WRITE IO
WRITE IO
ESXi Host
Nutanix Controller VM
ReadCache
HDDSSD
VM 1..n
OS
Node nNode n
ILM
Logs/Events
Logs/Events
External Source(s)
10GbE
ILM
Figure 10 Data IO Detail Expanded
15
Splunk on Nutanix | 15
Why run Splunk on Nutanix?
Nutanix enables you to run multiple workloads all on the same scalable converged infrastructure
o Modular incremental scale: With the Nutanix solution you can start small and scale. A single Nutanix block (four nodes) provides from 20-40+ TB storage and 64 cores in a compact footprint. Given the modularity of the solution, you can granularly scale per-node giving you the ability to accurately match supply with demand and minimize the upfront CapEx.
o High performance: Up to 35,000 random IOPS and up to 2,000 MB/s of sequential throughput in a compact 2U cluster.
o Data efficiency: The Nutanix solution is truly VM-centric for all compression policies. Unlike traditional solutions that perform compression mainly at the LUN level, the Nutanix solution provides all of these capabilities at the VM and file level, greatly increasing efficiency and simplicity. These capabilities ensure the highest possible compression/decompression performance on a sub-block level. By allowing for both inline and post-process compression capabilities, the Nutanix solution breaks the bounds set by traditional compression solutions.
o High-density architecture: Nutanix uses an advanced server architecture in which 8 Intel CPUs (up to 64 cores) and up to 1TB of memory are integrated into a single 2U appliance. Coupled with data archiving and compression, Nutanix can reduce desktop hardware footprints by up to 4x.
o Effective Information Lifecycle Management: Nutanix incorporates heat-optimized tiering (HOT), which leverages multiple tiers of storage and optimally places data on the tier that provides the best performance. The architecture was built to support local disks attached to the controller VM (SSD, HDD) as well as remote (NAS) and cloud-based source targets. The tiering logic is fully extensible, allowing new tiers to be dynamically added and extended. The Nutanix system continuously monitors data-access patterns to determine whether access is random, sequential, or a mixed workload. Random I/O workloads are maintained in an SSD tier to minimize seek times. Sequential workloads are automatically placed into HDD to improve endurance.

16
Splunk on Nutanix | 16
4. Solution Design
With the Splunk on Nutanix solution you have the flexibility to start small with a single block and scale up incrementally a node, a block, or multiple blocks at a time. This provides the best of both worlds–the ability to start small and grow to massive scale without any impact to performance.
4.1. Single Instance Splunk Deployment
In a single instance deployment the Splunk nodes are all independent and not clustered for smaller scale or isolated deployments. Given the independent nature of this deployment vSphere HA and Nutanix RF2 is leveraged to ensure data availability.
Table 1: Distributed Splunk Parameters
Item Detail Rationale
Splunk
Search Factor (SF) N/A Distributed deployment only
Replication Factor (RF) N/A Distributed deployment only
# of Indexers See ‘Splunk Component Sizing’
Dependent on workload
# of Search Heads See ‘Splunk Component Sizing’
Dependent on workload
The figure below shows a high-level mapping of a single instance Splunk deployment on Nutanix. As mentioned, the Splunk components will co-exist with other VMs running on the Nutanix platform. The indexer(s) and search head(s) are run on the HA cluster with Nutanix RF2 and can run on any available nodes in the cluster to ensure availability.
ClusterCluster
...
Block 1 Block N
VM(s)
Node 1
Splunk Indexer(s)
Splunk Indexer(s)VM(s)
Node 2
Splunk Indexer(s)VM(s)
Node 3
Splunk Indexer(s)VM(s)
Node 4
Splunk Indexer(s)VM(s)
Node N
Splunk Search Head(s)Splunk Search Head(s)
Figure 11 Splunk Single Instance - Shared

17
Splunk on Nutanix | 17
The figure bellow shows a dedicated Splunk deployment where only the Splunk components will exist on the Nutanix platform.
ClusterCluster
...
Block 1 Block N
Splunk Search Head(s)Splunk Search Head(s)
Node 1
Splunk Indexer
Splunk Indexer
Node 2
Splunk Indexer
Splunk Indexer
Node 3
Splunk Indexer
Splunk Indexer
Node 4
Splunk Indexer
Splunk Indexer
Node N
Splunk Indexer
Splunk Indexer
Figure 12 Splunk Single Instance - Dedicated
The figure below shows the mapping for the Splunk instance storage. In this case LVM was used to allow for efficient storage scaling for Splunk indexes, however LVM is not required. The quantity of VMDKs will be driven by the estimated index sizes and retention policy which can be found in the ‘Splunk Index Sizing’ section.
Splunk VM
Nutanix DFS (NDFS)
RF2 CTR VM RF1 CTR DATA
NFS Datastore
50
0G
B V
MD
K
50
0G
B V
MD
K
50
0G
B V
MD
K
50
0G
B V
MD
K
50
0G
B V
MD
K
50
0G
B V
MD
K
50
0G
B V
MD
K
splunk_vol1
pvo
l
pvo
l
pvo
l
pvo
l
pvo
l
pvo
l
pvo
l
PV-SCSI Controller
NFS Datastore
SP1 (SSD, HDD)
...
...
30
GB
VM
DK
OS
+ A
PP
Figure 13 Splunk Single Instance Disk Map
18
Splunk on Nutanix | 18
4.2. Distributed Splunk Deployment
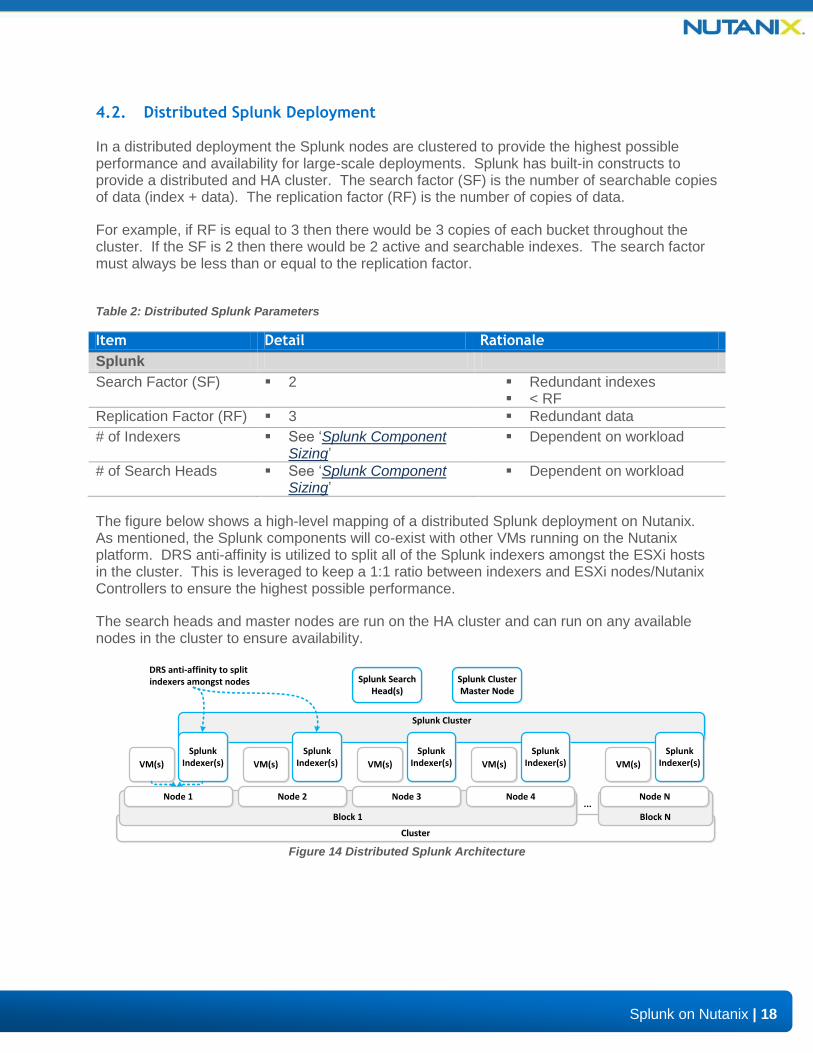
In a distributed deployment the Splunk nodes are clustered to provide the highest possible performance and availability for large-scale deployments. Splunk has built-in constructs to provide a distributed and HA cluster. The search factor (SF) is the number of searchable copies of data (index + data). The replication factor (RF) is the number of copies of data.
For example, if RF is equal to 3 then there would be 3 copies of each bucket throughout the cluster. If the SF is 2 then there would be 2 active and searchable indexes. The search factor must always be less than or equal to the replication factor.
Table 2: Distributed Splunk Parameters
Item Detail Rationale
Splunk
Search Factor (SF) 2 Redundant indexes < RF
Replication Factor (RF) 3 Redundant data
# of Indexers See ‘Splunk Component Sizing’
Dependent on workload
# of Search Heads See ‘Splunk Component Sizing’
Dependent on workload
The figure below shows a high-level mapping of a distributed Splunk deployment on Nutanix. As mentioned, the Splunk components will co-exist with other VMs running on the Nutanix platform. DRS anti-affinity is utilized to split all of the Splunk indexers amongst the ESXi hosts in the cluster. This is leveraged to keep a 1:1 ratio between indexers and ESXi nodes/Nutanix Controllers to ensure the highest possible performance.
The search heads and master nodes are run on the HA cluster and can run on any available nodes in the cluster to ensure availability.
ClusterCluster
...
Block 1 Block N
Splunk Search Head(s)
Splunk Search Head(s)
Splunk Cluster Master Node
Splunk Cluster Master Node
Splunk Cluster
VM(s)
Node 1
Splunk Indexer(s)
Splunk Indexer(s)VM(s)
Node 2
Splunk Indexer(s)VM(s)
Node 3
Splunk Indexer(s)VM(s)
Node 4
Splunk Indexer(s)VM(s)
Node N
DRS anti-affinity to split indexers amongst nodes
Figure 14 Distributed Splunk Architecture
19
Splunk on Nutanix | 19
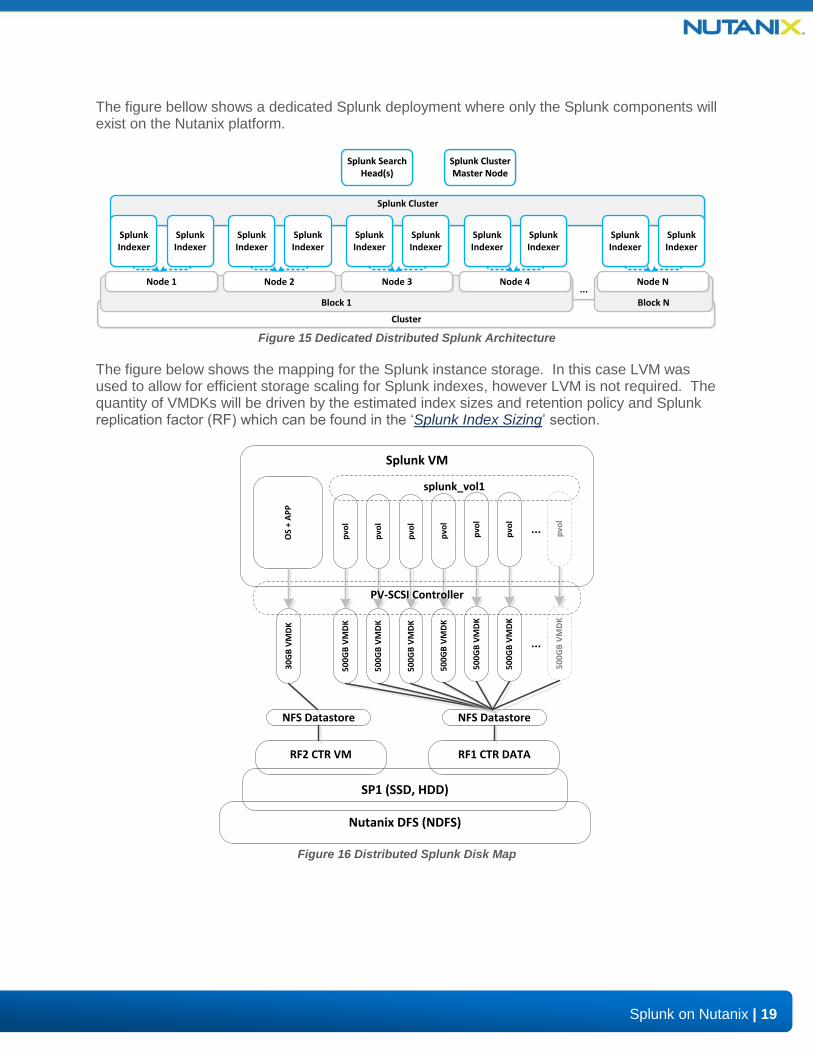
The figure bellow shows a dedicated Splunk deployment where only the Splunk components will exist on the Nutanix platform.
ClusterCluster
...
Block 1 Block N
Splunk Search Head(s)
Splunk Search Head(s)
Splunk Cluster Master Node
Splunk Cluster Master Node
Splunk Cluster
Node 1
Splunk Indexer
Splunk Indexer
Node 2
Splunk Indexer
Splunk Indexer
Node 3
Splunk Indexer
Splunk Indexer
Node 4
Splunk Indexer
Splunk Indexer
Node N
Splunk Indexer
Splunk Indexer
Figure 15 Dedicated Distributed Splunk Architecture
The figure below shows the mapping for the Splunk instance storage. In this case LVM was used to allow for efficient storage scaling for Splunk indexes, however LVM is not required. The quantity of VMDKs will be driven by the estimated index sizes and retention policy and Splunk replication factor (RF) which can be found in the ‘Splunk Index Sizing’ section.
Splunk VM
Nutanix DFS (NDFS)
RF2 CTR VM RF1 CTR DATA
NFS Datastore
50
0G
B V
MD
K
50
0G
B V
MD
K
50
0G
B V
MD
K
50
0G
B V
MD
K
50
0G
B V
MD
K
50
0G
B V
MD
K
50
0G
B V
MD
K
splunk_vol1
pvo
l
pvo
l
pvo
l
pvo
l
pvo
l
pvo
l
pvo
l
PV-SCSI Controller
NFS Datastore
SP1 (SSD, HDD)
...
...
30
GB
VM
DK
OS
+ A
PP
Figure 16 Distributed Splunk Disk Map

20
Splunk on Nutanix | 20
4.3. General Sizing
The following section covers the design decisions and rationale for Splunk deployments on the Nutanix Complete Cluster.
Table 3: General Design Decisions
Item Detail Rationale
General - Nutanix
Minimum Size 3 x Nutanix nodes (3 ESXi hosts) Minimum size requirement
Scale Approach Incremental modular scale
Allow for growth from PoC to massive scale
Scale Unit Node(s) Granular scale to precisely meet the capacity demands
Scale in n x node increments
VMware vSphere
Cluster Size Up to 16 ESXi hosts (Minimum of 4 hosts)
Isolated fault domains
Clusters per vCenter Up to 4 x 16 host clusters Task parallelization Isolated fault domains
Datastore(s) 2 x Nutanix NFS datastores per pod (1 for RF2 VMs/data and 1 for RF2 data)
Nutanix handles I/O distribution/localization
n-Controller model
Infrastructure Services
Small deployments: Shared cluster
Large deployments: Dedicated cluster
Dedicated infrastructure cluster for larger deployments (best practice)
Nutanix
Cluster Size Up to 48 nodes Isolated fault domains
Storage Pool(s) 1 x Storage Pool (SSD, HDD)
Standard practice ILM handles tiering
Container(s) 1 x Container for VMs & RF2 Data
1 x Container for RF1 Data (used in distributed Splunk deployment)
Standard practice

21
Splunk on Nutanix | 21
A high-level snapshot of the Nutanix Services Pod highlights can be seen below
Table 4: Pod Highlights
Item Qty
Control Pod
# of vCenter Server(s) 1
# of Splunk Indexer(s) Dependent on sizing
# of Splunk Search Head(s) Dependent on sizing
Services Pod
# of Nutanix Nodes Up to 32
# of ESXi Hosts Up to 32
# of vSphere Cluster(s) Up to 2
# of Nutanix Cluster(s) 1
…
Services Pod
Hosted VMs (Splunk + Others)
vSphere Cluster
Nutanix Block
ESX
i
ESX
i
ESX
i
ESX
i
Nutanix Block
ESX
i
ESX
i
ESX
i
ESX
i
Nutanix Block
ESX
i
ESX
i
ESX
i
ESX
i
Nutanix Block
ESX
i
ESX
i
ESX
i
ESX
i
vSphere Cluster
Nutanix Block
ESX
i
ESX
i
ESX
i
ESX
i
Nutanix Block
ESX
i
ESX
i
ESX
i
ESX
i
Nutanix Block
ESX
i
ESX
i
ESX
i
ESX
i
Nutanix Block
ESX
i
ESX
i
ESX
i
ESX
i
VMware vCenter
Nutanix DFS (NDFS)
NFS Datastore(s)
Scale Out
StartingScale
Figure 17 Splunk Pod Overview

22
Splunk on Nutanix | 22
4.4. Splunk Storage Sizing
The following section covers the Splunk sizing and considerations for running Splunk on Nutanix. NOTE: It is always a good practice to add a buffer for contingency and growth.
Step 1 - Calculate the estimated required storage:
Required Storage = (Daily average indexing rate in GB x Retention Policy in days) / 2*
*Splunk assumes a 50% compression ratio
For example, if there is 500 GB of indexed data daily and data needs to be kept for a minimum of 2 months:
Required Storage = (500 GB/day * 60 days) / 2 = 15,000 GB = 15 TB
Step 2 - Calculate the total required number of Nutanix nodes by storage capacity:
Total Number of Nutanix Nodes by Storage Capacity = (Required Storage x Nutanix Replication Factor) / Storage per Node
For example, if there is 20 TB of required storage, the replication factor is 2 (default) and there is 4 TB of storage per node (varies per model):
Number of Nutanix Nodes by Storage Capacity = (20 TB * 2) / 40 TB = 10 Nodes
Step 3a - Calculate the initial storage capacity of Nutanix nodes:
With Nutanix you have the ability to start with a certain capacity and incrementally scale capacity as needed. If all nodes are deployed initially this step can be skipped.
Initial Storage Capacity = (Total Required Number of Nutanix Nodes * % Deployed Initially) * Storage per Node
For example, if there are 10 Nutanix nodes required and 50% of nodes initially deployed and 4 TB of storage per node (varies per model):
Initial Storage Capacity = (10 Nodes * 50%) * 4 TB = 20 TB

23
Splunk on Nutanix | 23
Step 3b - Calculating the necessary duration to scale Nutanix nodes:
If all nodes are deployed initially this step can be skipped.
Initial Storage Data Duration = Initial Storage Capacity / Daily average indexing rate in GB
For example, if there are 5 nodes initially deployed and 4 TB of storage per node (varies per model) providing 20 TB of initial capacity and 500 GB of indexed data daily:
Initial Storage Data Duration = 20 TB / 500 GB/day = 40 days
Meaning that after 40 days the required storage capacity would breach the initial storage capacity and Nutanix nodes must be scaled to facilitate the demand up to the full 100% of the required nodes based upon storage capacity.
Base Scenarios
The following base scenarios have been created based upon data gathering. You can find more information here: http://wiki.splunk.com/Community:HardwareTuningFactors
Table 5: Splunk Workload Scenarios
Scenario Daily Index Data Concurrent Search Users
Light < 25GB < 2
Normal < 100GB < 5
Medium < 300GB < 7
Heavy < 1TB < 9

24
Splunk on Nutanix | 24
4.5. Splunk Component Sizing
Based upon the characterizations and sizing above the following component sizing should be used as a baseline.
Table 6: Splunk Component Sizing
Item Detail Rationale
Light Workload
Index Data Up to 20GB/day Based upon assumption
# of Indexers 1 Quantity for demand/scale
# of Search Heads N/A N/A at this scale
Indexer Spec 4 vCPUs +1 per active user above 2
4GB MEM
Based upon performance profiling
IOPS N/A N/A at this scale
Normal Workload
Index Data Up to 100GB/day Based upon assumption
# of Indexers 1 Quantity for demand/scale
# of Search Heads N/A N/A at this scale
Indexer Spec 8 vCPUs +1 per active user above 4
8GB MEM
Based upon performance profiling
IOPS > 800 Performance requirement
Medium Workload
Index Data Up to 300GB/day Based upon assumption
# of Indexers 2+ Quantity for demand/scale
# of Search Heads N/A N/A at this scale
Indexer Spec 12 vCPUs +1 per active user above 6
12GB MEM
Based upon performance profiling
IOPS > 800 Performance requirement
Heavy Workload
Index Data Up to 1TB/day Based upon assumption
# of Indexers 4+ Quantity for demand/scale
# of Search Heads 1 +1 if active user above 16 Required at this scale
Indexer Spec 32 vCPUs +1 per active user above 8
32GB MEM
Based upon performance profiling
Search Head Spec 4 vCPUs +1 per active user above 8
8GB MEM
Based upon performance profiling
IOPS > 1200 Performance requirement

25
Splunk on Nutanix | 25
4.6. Nutanix
The Nutanix Virtual Computing Platform provides an ideal combination of both high-performance compute with localized storage to meet any demand. True to this capability, this reference architecture contains zero reconfiguration of, or customization, to the Nutanix product to optimize for this use case.
The figure below shows a high-level example of the relationship between a Nutanix block, node, storage pool and container
Nutanix Block
...
...
Nutanix Node
SSD
HD
D
Nutanix Node
SSD
HD
D
Nutanix Node
SSD
HD
D
Nutanix Node
SSD
HD
D
Nutanix Block
Nutanix Node
SSD
HD
D
Nutanix Node
SSD
HD
D
Nutanix Node
SSD
HD
D
Nutanix Node
SSD
HD
D
Storage Pool – SP01
Container 1 -CTR-RF2-VM-01
Container N
Figure 18 Nutanix Component Architecture
The table below shows the Nutanix storage pool and container configuration.
Table 7: Nutanix Storage Configuration
Name Role Details
SP01 Main storage pool for all data SSD, HDD
CTR-RF2-VM-01 Container for all VMs and data ESXi – Datastore
CTR-RF1-DATA-01 Container for clustered Splunk Indexes ESXi – Datastore
26
Splunk on Nutanix | 26
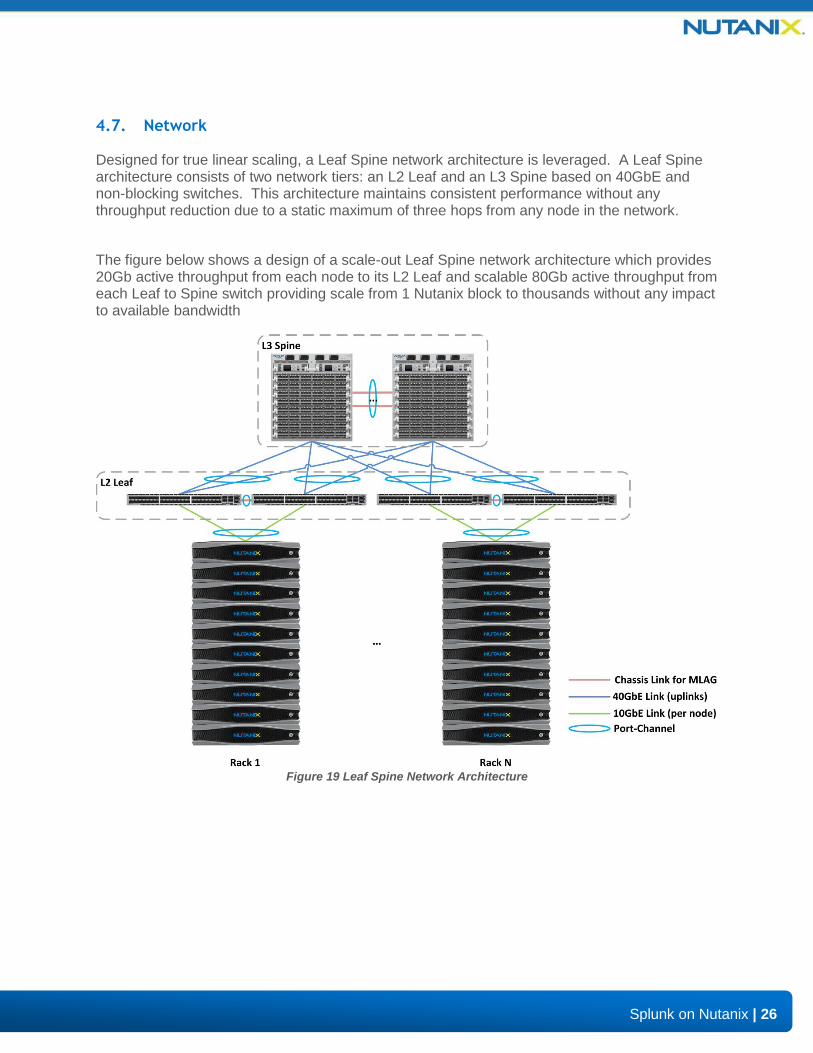
4.7. Network
Designed for true linear scaling, a Leaf Spine network architecture is leveraged. A Leaf Spine architecture consists of two network tiers: an L2 Leaf and an L3 Spine based on 40GbE and non-blocking switches. This architecture maintains consistent performance without any throughput reduction due to a static maximum of three hops from any node in the network.
The figure below shows a design of a scale-out Leaf Spine network architecture which provides 20Gb active throughput from each node to its L2 Leaf and scalable 80Gb active throughput from each Leaf to Spine switch providing scale from 1 Nutanix block to thousands without any impact to available bandwidth
Figure 19 Leaf Spine Network Architecture

27
Splunk on Nutanix | 27
5. Validation & Benchmarking
The solution and testing provided in this document was completed with Splunk 5.0.2 deployed on VMware vSphere 5.1 on Nutanix Virtual Computing Platform.
The SplunkIT benchmark was leveraged to detail indexing performance – the Bonnie++ and IOzone benchmarks were leveraged to detail the storage performance on the Nutanix appliance.
5.1. Environment Overview
A Nutanix NX-3400 was utilized as the target environment and provided all Splunk hosting. The Nutanix block was connected to an Arista 7050S top-of-rack switch via 10GbE.
Test Client(s)Test Client(s) Test Target(s)Test Target(s)
Splunk Test VMsSplunkIT Test Client(s)
Storage Benchmark VMs (Bonnie++/
IOzone)
Sessions
Figure 20 Test Environment Overview

28
Splunk on Nutanix | 28
Test Environment Configuration
Assumptions:
o 3GB streaming input data per hour (SplunkIT)
o Index volumes: 5, 50, 100, 200 GB
o Bonnie++ IO size: 2x memory
o Disk configurations: Non-LVM: 1, LVM: 1,2,4,6
Hardware:
o Storage/Compute: 1 Nutanix NX-3400
o Network: Arista 7050Q(L3 Spine)/7050S(L2 Leaf) Series Switches
Nutanix
o Version: 3.0.3
Splunk Server Configuration:
o OS: Ubuntu 12.04 x64
o CPU and Memory: 8 vCPU/8 GB
o Disk:
▫ 1 x 40GB (OS)
▫ 8 x 500GB (Data)
o Application Version: 5.0.2
SplunkIT:
o Version: 2.0
Bonnie++:
o Version: 1.03e
IOZone:
o Version: 3

29
Splunk on Nutanix | 29
5.2. Test Scripts & Configurations
o Add VMDKs to Splunk VMs
#########################################################
##
## Script: AddDisks
## Author: Steven Poitras
## Description: Add n VMDKs to VM
## Language: PowerCLI
##
##########################################################
# Inputs
$vmPrefix = "SPLUNK_"
$vms = Get-VM | where {$_.name -Match $vmPrefix}
$numDisks = 8
$diskCapacity = 100
# For each vm in vms add the disks
$vms | %{
$vm = $_
# Add disks
1..$numDisks | %{
$vm | New-HardDisk -CapacityGB $diskCapacity -Persistence persistent
}
}
30
Splunk on Nutanix | 30
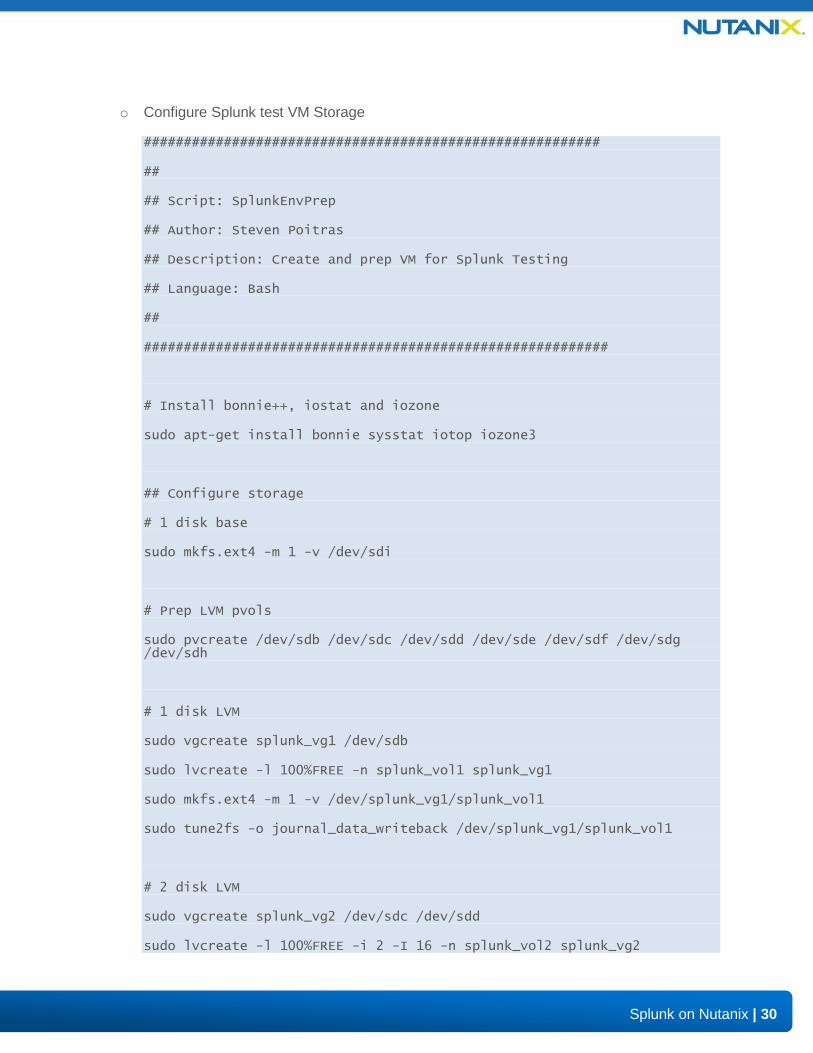
o Configure Splunk test VM Storage
#########################################################
##
## Script: SplunkEnvPrep
## Author: Steven Poitras
## Description: Create and prep VM for Splunk Testing
## Language: Bash
##
##########################################################
# Install bonnie++, iostat and iozone
sudo apt-get install bonnie sysstat iotop iozone3
## Configure storage
# 1 disk base
sudo mkfs.ext4 -m 1 -v /dev/sdi
# Prep LVM pvols
sudo pvcreate /dev/sdb /dev/sdc /dev/sdd /dev/sde /dev/sdf /dev/sdg /dev/sdh
# 1 disk LVM
sudo vgcreate splunk_vg1 /dev/sdb
sudo lvcreate -l 100%FREE -n splunk_vol1 splunk_vg1
sudo mkfs.ext4 -m 1 -v /dev/splunk_vg1/splunk_vol1
sudo tune2fs -o journal_data_writeback /dev/splunk_vg1/splunk_vol1
# 2 disk LVM
sudo vgcreate splunk_vg2 /dev/sdc /dev/sdd
sudo lvcreate -l 100%FREE -i 2 -I 16 -n splunk_vol2 splunk_vg2
31
Splunk on Nutanix | 31
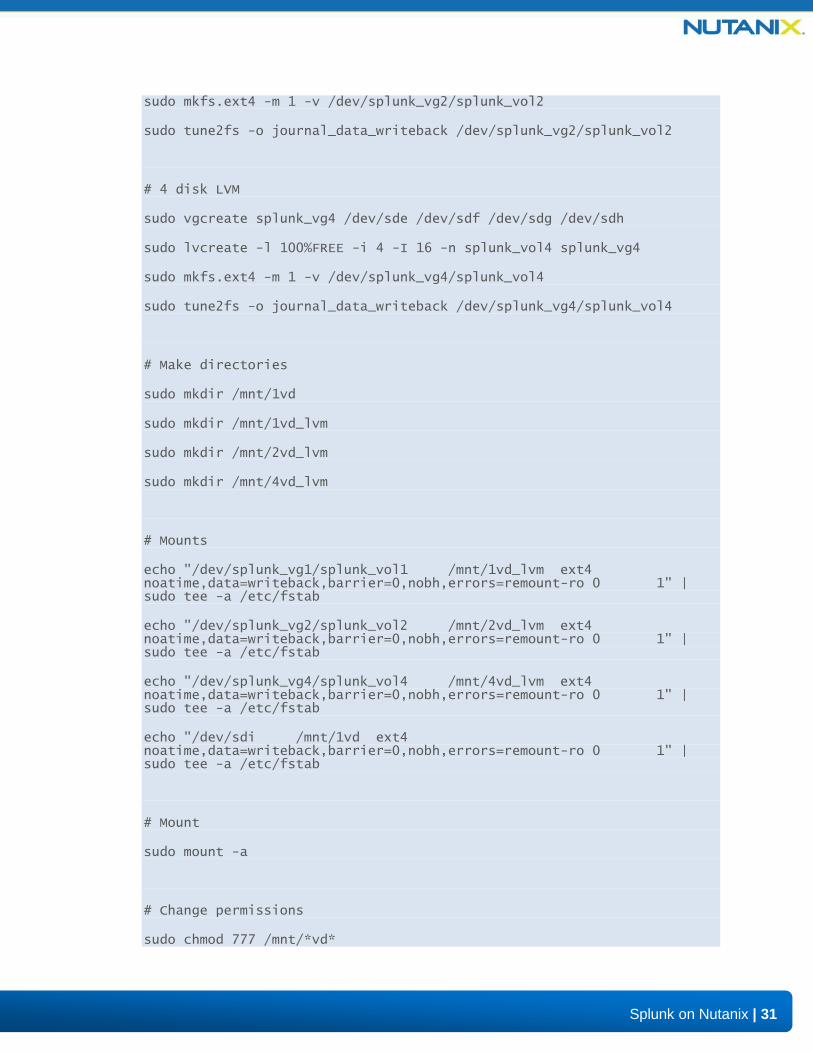
sudo mkfs.ext4 -m 1 -v /dev/splunk_vg2/splunk_vol2
sudo tune2fs -o journal_data_writeback /dev/splunk_vg2/splunk_vol2
# 4 disk LVM
sudo vgcreate splunk_vg4 /dev/sde /dev/sdf /dev/sdg /dev/sdh
sudo lvcreate -l 100%FREE -i 4 -I 16 -n splunk_vol4 splunk_vg4
sudo mkfs.ext4 -m 1 -v /dev/splunk_vg4/splunk_vol4
sudo tune2fs -o journal_data_writeback /dev/splunk_vg4/splunk_vol4
# Make directories
sudo mkdir /mnt/1vd
sudo mkdir /mnt/1vd_lvm
sudo mkdir /mnt/2vd_lvm
sudo mkdir /mnt/4vd_lvm
# Mounts
echo "/dev/splunk_vg1/splunk_vol1 /mnt/1vd_lvm ext4 noatime,data=writeback,barrier=0,nobh,errors=remount-ro 0 1" | sudo tee -a /etc/fstab
echo "/dev/splunk_vg2/splunk_vol2 /mnt/2vd_lvm ext4 noatime,data=writeback,barrier=0,nobh,errors=remount-ro 0 1" | sudo tee -a /etc/fstab
echo "/dev/splunk_vg4/splunk_vol4 /mnt/4vd_lvm ext4 noatime,data=writeback,barrier=0,nobh,errors=remount-ro 0 1" | sudo tee -a /etc/fstab
echo "/dev/sdi /mnt/1vd ext4 noatime,data=writeback,barrier=0,nobh,errors=remount-ro 0 1" | sudo tee -a /etc/fstab
# Mount
sudo mount -a
# Change permissions
sudo chmod 777 /mnt/*vd*
32
Splunk on Nutanix | 32
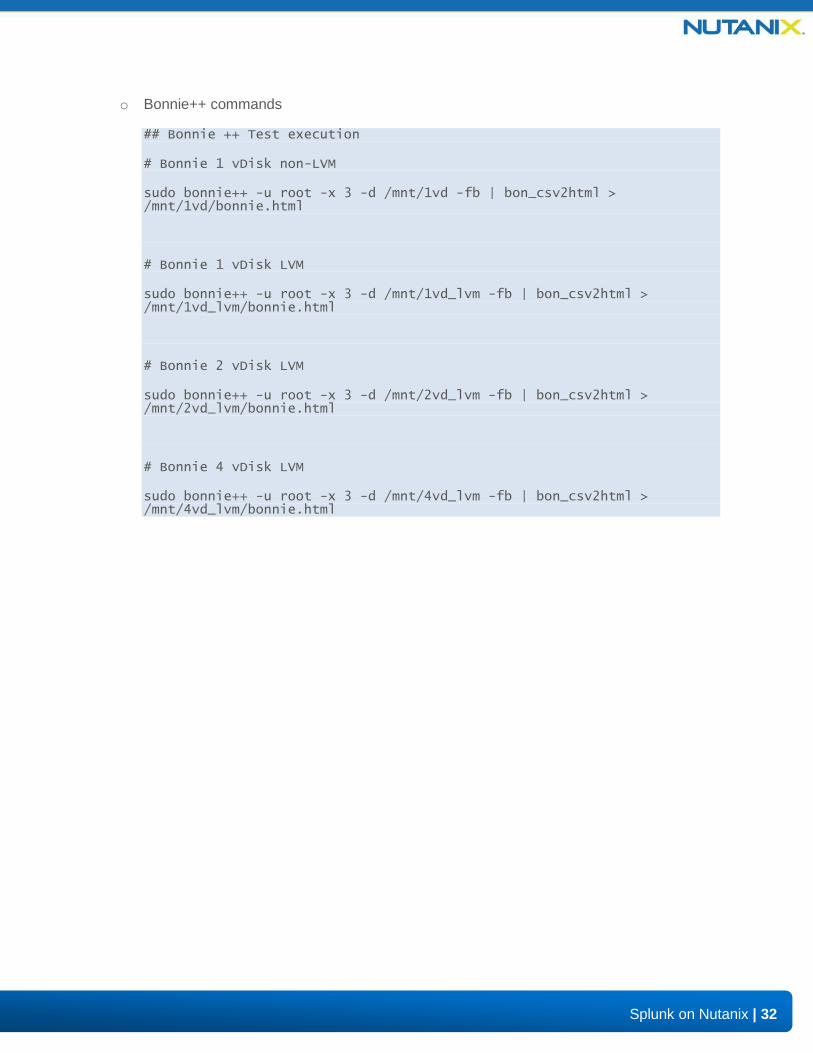
o Bonnie++ commands
## Bonnie ++ Test execution
# Bonnie 1 vDisk non-LVM
sudo bonnie++ -u root -x 3 -d /mnt/1vd -fb | bon_csv2html > /mnt/1vd/bonnie.html
# Bonnie 1 vDisk LVM
sudo bonnie++ -u root -x 3 -d /mnt/1vd_lvm -fb | bon_csv2html > /mnt/1vd_lvm/bonnie.html
# Bonnie 2 vDisk LVM
sudo bonnie++ -u root -x 3 -d /mnt/2vd_lvm -fb | bon_csv2html > /mnt/2vd_lvm/bonnie.html
# Bonnie 4 vDisk LVM
sudo bonnie++ -u root -x 3 -d /mnt/4vd_lvm -fb | bon_csv2html > /mnt/4vd_lvm/bonnie.html

33
Splunk on Nutanix | 33
o IOzone commands
# IOzone test execution
# IOzone 1 vDisk non-LVM
sudo iozone -R -l 5 -u 5 -r 4k -s 4g -F /mnt/1vd/f1 /mnt/1vd/f2 /mnt/1vd/f3 /mnt/1vd/f4 /mnt/1vd/f5 -b /mnt/1vd/iozone.xls > /mnt/1vd/run_4k_4g.out 2>&1 &
# IOzone 1 vDisk LVM
sudo iozone -R -l 5 -u 5 -r 4k -s 4g -F /mnt/1vd_lvm/f1 /mnt/1vd_lvm/f2 /mnt/1vd_lvm/f3 /mnt/1vd_lvm/f4 /mnt/1vd_lvm/f5 -b /mnt/1vd_lvm/iozone.xls > /mnt/1vd_lvm/run_4k_4g.out 2>&1 &
# IOzone 2 vDisk LVM
sudo iozone -R -l 5 -u 5 -r 4k -s 4g -F /mnt/2vd_lvm/f1 /mnt/2vd_lvm/f2 /mnt/2vd_lvm/f3 /mnt/2vd_lvm/f4 /mnt/2vd_lvm/f5 -b /mnt/2vd_lvm/iozone.xls > /mnt/2vd_lvm/run_4k_4g.out 2>&1 &
# IOzone 4 vDisk LVM
sudo iozone -R -l 5 -u 5 -r 4k -s 4g -F /mnt/4vd_lvm/f1 /mnt/4vd_lvm/f2 /mnt/4vd_lvm/f3 /mnt/4vd_lvm/f4 /mnt/4vd_lvm/f5 -b /mnt/4vd_lvm/iozone.xls > /mnt/4vd_lvm/run_4k_4g.out 2>&1 &

34
Splunk on Nutanix | 34
5.3. Benchmarks
SplunkIT Benchmark
SplunkIT is a performance benchmarking tool for benchmarking and comparing Splunk indexing and search performance.
The test benchmark consists of a few main phases:
1. Generate Data: Generate n GB of syslog data (default= 50 GB)
2. Index Test: How long does it take to index n GB of syslog data
3. Search Test: How long does it take to search using Splunk Web
For more information about SplunkIT visit the Splunk Performance Blog: http://blogs.splunk.com/tag/performance/
Bonnie++
Bonnie is a performance tool utilized for benchmarking file system and storage sub-system performance and is a key benchmark when analyzing suitability for running Splunk and its IO patterns. This tool is also leveraged to identify the optimal RAID or LVM configuration and disk quantity for arrays.
The test benchmark consists of a few main phases:
1. Sequential Output: Writing a sequential stream of data
2. Sequential Input: Rewriting a sequential stream of data
3. Random Seeks: Reading a sequential stream of data
For more information or to download Bonnie++ it can be found here: http://www.coker.com.au/bonnie++/
IOzone
IOzone is a performance tool, similar to Bonnie++, utilized for benchmarking file system and storage sub-system performance.
The test benchmark consists of a few main tests:
1. Write Test: Write, rewrite and random write nGB of data
2. Read Test: Read, reread, reverse read, stride read and random read nGB of data
For more information about IOzone it can be found here: http://www.iozone.org/

35
Splunk on Nutanix | 35
5.4. How to Interpret the Results
SplunkIT
Evaluation is quantified using the following metrics:
o Throughput (KBps): The amount of data input data read per second
o Events per second (EPS): The amount of events indexed per second
o Time to first event (TFE): The time to return first event from search
o Time to search (TTS): The taken to completely return all events from search
Based user experience and industry standards, recommend ideal ranges for these values are kept below the following values:
Table 8: SplunkIT Metric Values
Metric Value Rationale
Throughput (KBps) > 10,000 Acceptable input performance
Events per second (EPS) > 20,000 Acceptable indexing performance
Time to first event (TFE) < 5 Acceptable peak response time
Time to search (TTS) < 30 Acceptable ideal response time
Bonnie++
Evaluation is quantified using the following metrics:
o Sequential Output – Block (KB/sec): The number of KB written per second
o Sequential Output – Rewrite (KB/sec): The number of KB rewritten per second
o Sequential Input – Block (KB/sec): The number of KB read per second
o Random Seeks (Num/sec): The number of random seeks per second
Based user experience and industry standards, recommend ideal ranges for these values are kept below the following values:
Table 9: Bonnie++ Metric Values
Metric Value Rationale
Sequential Output – Block (KB/sec) > 100,000 Affects data input rate
Sequential Output – Rewrite (KB/sec) 30,000 – 50,000 Affects index performance
Sequential Input – Block (KB/sec) > 100,000 Affects index performance
Random Seeks (Num/sec) > 1,000 Affects search performance

36
Splunk on Nutanix | 36
IOzone
Evaluation is quantified using the following metrics:
o Initial Write (KB/sec): The number of KB written per second
o Rewrite (KB/sec): The number of KB rewritten per second
Based user experience and industry standards, recommend ideal ranges for these values are kept below the following values:
Table 10: IOzone metric values
Metric Value Rationale
Initial Write (KB/sec) > 100,000 Affects data input rate
Rewrite (KB/sec) > 100,000 Affects index performance
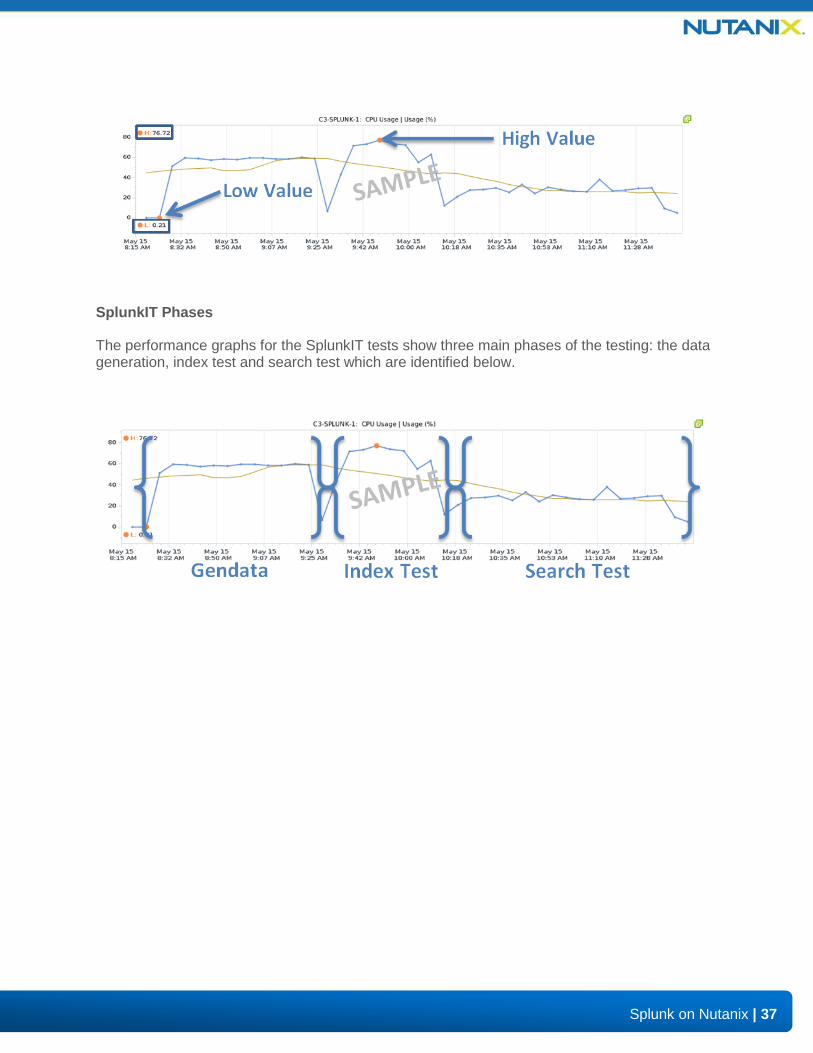
Performance Graphs
The performance graphs show a plot of the data as well as a trend line. Below various aspects of the graphs are highlighted:
37
Splunk on Nutanix | 37
SplunkIT Phases
The performance graphs for the SplunkIT tests show three main phases of the testing: the data generation, index test and search test which are identified below.

38
Splunk on Nutanix | 38
6. Results
6.1. SplunkIT
Single VM
The single VM SplunkIT results highlighted the performance for a single VM with 8 vCPU and 8 GB memory running on the Nutanix platform. Index and search performance was very ample and primarily driven by CPU and not IO. Read latency averaged .84ms during the test execution.
Table 11: SplunkIT Results – Single VM
vCPU MEM # Disk Index Sixe (GB)
Avg(KBps) Avg(EPS) Avg(TFE) Avg(TTS)
8 8 1 50 23556.23 82832.27 1.98 16.3
8 8 2 50 25152.75 88446.95 1.97 16.48
16 16 1 50 25525.55 89757.85 1.97 16.6
24 32 1 50 25008.29 87939.02 1.93 16.62
The single Splunk VM CPU usage peaked at ~76.72% during the indexing run and was similar during the data generation phase. During the search phase this dropped to ~28%.
Memory usage peaked at ~75% primarily during the data generation and indexing phases. During the search test this dropped down to ~23%.

39
Splunk on Nutanix | 39
Multiple VM – 4 VMs
The multiple VM SplunkIT results highlighted the performance for 4 simultaneous Splunk VMs with 8 vCPU and 8 GB memory running on the Nutanix platform. In this case testing was done with 1 Splunk VM running on each ESXi node. Index and search performance was very ample and primarily driven by CPU and not IO. Read latency averaged .55ms during the test execution.
Table 12: SplunkIT Results - 4 VM
VM vCPU MEM # Disk
Index Sixe (GB)
Avg(KBps) Avg(EPS) Avg(TFE) Avg(TTS)
1 8 8 4 50 24064.22 84618.92 1.942 16.59
2 8 8 4 50 24065.34 84622.85 2.17 16.59
3 8 8 4 50 24961.36 87773.59 1.92 16.58
4 8 8 4 50 24066.38 84626.49 2.05 16.56
Aggregate Results
Sum 97157.32 341641.8 N/A N/A
Average 24289.33 85410.46 2.02 16.58
Cluster CPU usage peaked at ~60.23% during the indexing run and was ~30% during the data generation phase. During the search phase this dropped to ~18%.
An example Splunk VM CPU usage peaked at ~76.94% during the indexing run and was ~17% during the data generation phase. During the search phase this dropped to ~37%.
40
Splunk on Nutanix | 40
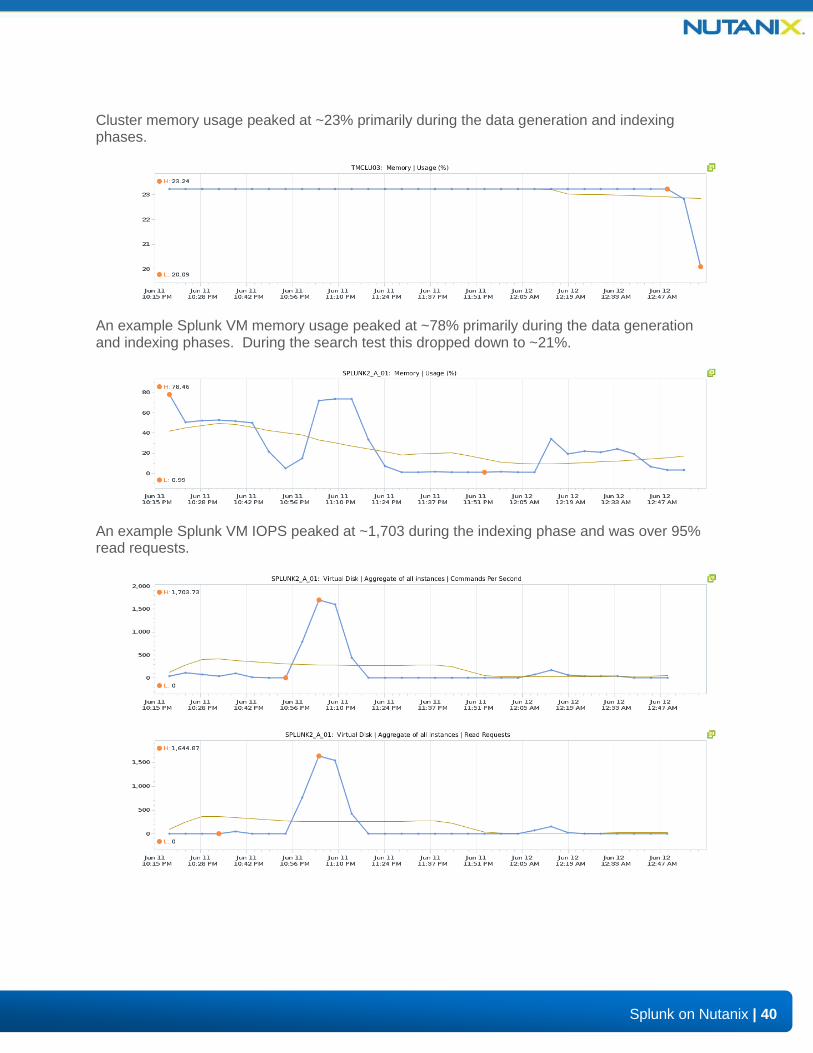
Cluster memory usage peaked at ~23% primarily during the data generation and indexing phases.
An example Splunk VM memory usage peaked at ~78% primarily during the data generation and indexing phases. During the search test this dropped down to ~21%.
An example Splunk VM IOPS peaked at ~1,703 during the indexing phase and was over 95% read requests.
41
Splunk on Nutanix | 41
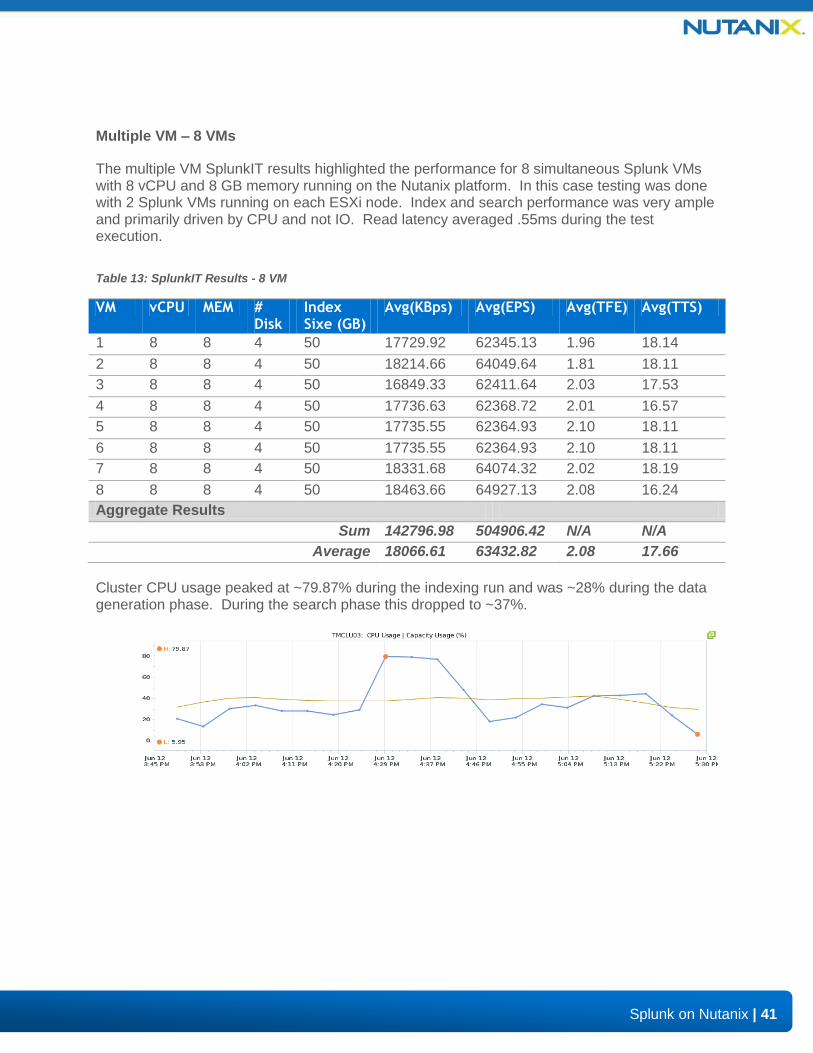
Multiple VM – 8 VMs
The multiple VM SplunkIT results highlighted the performance for 8 simultaneous Splunk VMs with 8 vCPU and 8 GB memory running on the Nutanix platform. In this case testing was done with 2 Splunk VMs running on each ESXi node. Index and search performance was very ample and primarily driven by CPU and not IO. Read latency averaged .55ms during the test execution.
Table 13: SplunkIT Results - 8 VM
VM vCPU MEM # Disk
Index Sixe (GB)
Avg(KBps) Avg(EPS) Avg(TFE) Avg(TTS)
1 8 8 4 50 17729.92 62345.13 1.96 18.14
2 8 8 4 50 18214.66 64049.64 1.81 18.11
3 8 8 4 50 16849.33 62411.64 2.03 17.53
4 8 8 4 50 17736.63 62368.72 2.01 16.57
5 8 8 4 50 17735.55 62364.93 2.10 18.11
6 8 8 4 50 17735.55 62364.93 2.10 18.11
7 8 8 4 50 18331.68 64074.32 2.02 18.19
8 8 8 4 50 18463.66 64927.13 2.08 16.24
Aggregate Results
Sum 142796.98 504906.42 N/A N/A
Average 18066.61 63432.82 2.08 17.66
Cluster CPU usage peaked at ~79.87% during the indexing run and was ~28% during the data generation phase. During the search phase this dropped to ~37%.

42
Splunk on Nutanix | 42
An example Splunk VM CPU usage peaked at ~59.3% during the indexing run and was ~12% during the data generation phase. During the search phase this dropped to ~25%.
Cluster memory usage peaked at ~26% primarily during the data generation and indexing phases.
An example Splunk VM memory usage peaked at ~73% primarily during the data generation and indexing phases. During the search test this dropped down to ~22%.

43
Splunk on Nutanix | 43
6.2. Bonnie++
The Bonnie++ results showed ample bandwidth ranging from ~220-290MBs for write and ~225-338MBps for read for a single VM with 8 vCPU and 8 GB memory. The random seeks per second ranged from ~2,560-3,050. The disk quantity block size and whether or not LVM is use should be determined by each scenario and to meet the particular throughput and IOPS requirements.
Table 14: Bonnie++ Results
# Disks
LVM Used?
Stripe Size
Sequential Output - Block (KBps)
Sequential Output -Rewrite (KBps)
Sequential Input – Block (KBps)
Random Seeks (Num/sec)
1 n N/A 257820.67 100120 338877.3 2642.67
1 y N/A 220494 93003.83 319728.3 3064
2 y 8K 248013.3 107959 275064 2559.67
2 y 16K 281018.3 120379.67 317936.3 2690.3
4 y 8K 277024 100861.67 203566 2617
4 y 16K 298331.3 103361 225025.67 2760
Single disk IOPS peaked at ~1,593 with an average of ~1,251 IOPS. Sequential write bandwidth averaged 220MBps with LVM and 257MBps without. Sequential reads averaged 319MBps with LVM and 338MBps without. Random seeks averaged from ~2642-3064 per second.
44
Splunk on Nutanix | 44
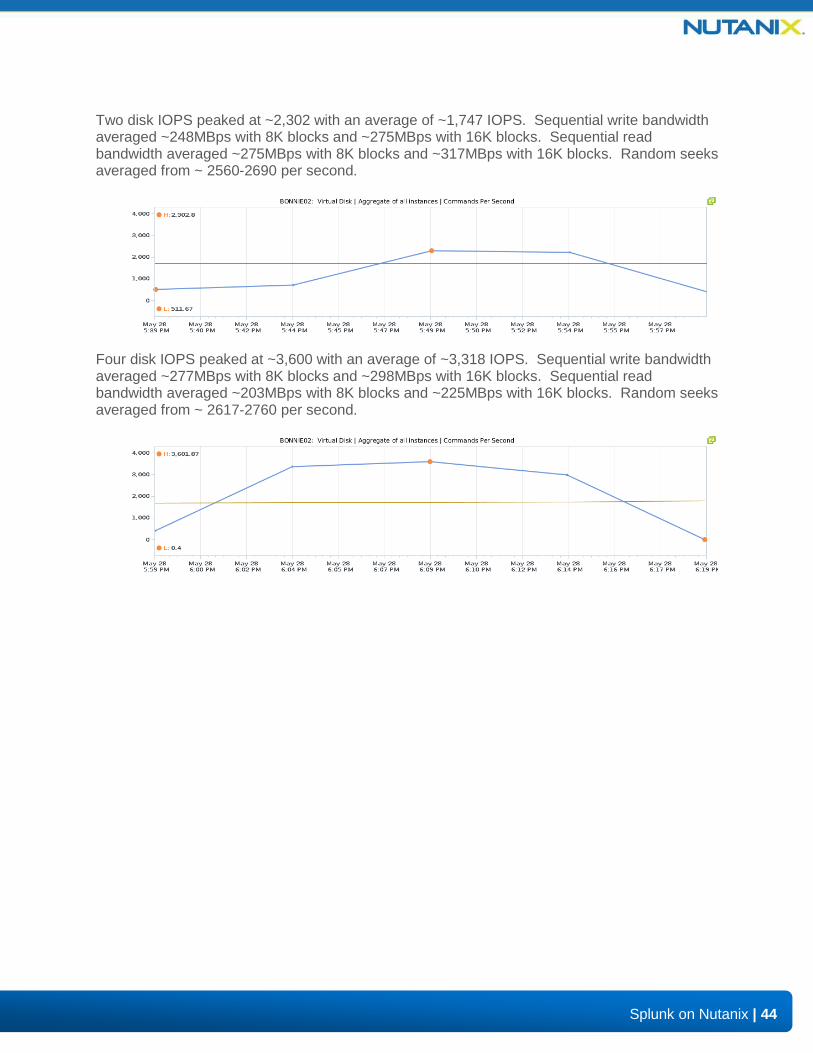
Two disk IOPS peaked at ~2,302 with an average of ~1,747 IOPS. Sequential write bandwidth averaged ~248MBps with 8K blocks and ~275MBps with 16K blocks. Sequential read bandwidth averaged ~275MBps with 8K blocks and ~317MBps with 16K blocks. Random seeks averaged from ~ 2560-2690 per second.
Four disk IOPS peaked at ~3,600 with an average of ~3,318 IOPS. Sequential write bandwidth averaged ~277MBps with 8K blocks and ~298MBps with 16K blocks. Sequential read bandwidth averaged ~203MBps with 8K blocks and ~225MBps with 16K blocks. Random seeks averaged from ~ 2617-2760 per second.
45
Splunk on Nutanix | 45
7. Further Research
As part of its continuous determination to deliver the best possible solutions, Nutanix will continue to research into the following areas:
o Performance optimizations.
o Scale testing.
o Detailed use-case application.
o Joint solutions with partners.

46
Splunk on Nutanix | 46
8. Conclusion
The Nutanix platform offers the ability to run both Splunk and VM workloads simultaneously on the same platform. Density for Splunk deployments will be primarily driven by the co-hosted VM’s resource requirements and not due to any Splunk bottleneck. The platform was easily able to handle the IOPS and throughput requirements for Splunk instances. Sizing for the pods was determined after careful consideration of performance as well as accounting for additional resource for N+1 failover capabilities.
The SplunkIT tests showed very light IO footprints given the fact the data generation is single threaded. A single Splunk VM running with 8 vCPUs and 8GB memory was able to index an average of ~80,000-89,000 events per second (EPS) and multiple of these were able to index an average of ~340,000-500,000 events per second (EPS). Average time to first event (TFE) was ~1.9 seconds and average time to search (TTS) was ~16 seconds. The Splunk VM CPU utilization peaked at ~78% during the test runs. During peak load read latency averaged <1ms.
The Bonnie++ results showed heavy throughput footprints with a peak of ~220-338MBps read throughput and ~220-290MBps write throughput. The random seeks ranged from ~2,560-3,050 per second. IOzone showed much higher IOPS and peaked at ~6,526 IOPS for a single VM with 2 vDisks.
The Splunk on Nutanix solution provides a single high-density platform for Splunk, VM hosting and application delivery. This modular pod based approach enables these deployments to easily be scaled.

47
Splunk on Nutanix | 47
9. Appendix: Configuration
Hardware
o Storage / Compute
▫ Nutanix NX-3400
o Per node specs (4 nodes per 2U block):
CPU: 2x Intel Xeon E5-2660
Memory: 256 GB Memory
SSD: 400 GB Intel 810 PCIe Flash
HDD: 5 x 1 TB SATA Drives
o Network
▫ Arista 7050Q - L3 Spine
▫ Arista 7050S - L2 Leaf
Software o Nutanix
▫ Version: NOS 3.0.3
o Splunk
▫ 5.0.2
o SplunkIT:
▫ Version: 2.0
o Bonnie++:
▫ Version: 1.03e
o IOZone:
▫ Version: 3
o Infrastructure
▫ ESXi 5.1.0 patch 2
▫ vCenter 5.1.0 patch 2
VM o Nutanix Controller
▫ CPU: 8 vCPU
▫ Memory: 24GB
48
Splunk on Nutanix | 48
o Splunk Server Configuration:
▫ OS: Ubuntu 12.04 x64
o SplunkIT Client Machine:
▫ OS: Ubuntu 12.04 x64

49
Splunk on Nutanix | 49
10. References
10.1. Table of Figures
Figure 1 Nutanix Architecture ..................................................................................................... 7
Figure 2 Splunk Overview .......................................................................................................... 8
Figure 3 Splunk App Platform .................................................................................................... 9
Figure 4 Splunk Single Indexer .................................................................................................10
Figure 5 Splunk Multiple Indexer ...............................................................................................10
Figure 6 Splunk Distributed Cluster ...........................................................................................11
Figure 7 Splunk on Nutanix Conceptual Arch ............................................................................12
Figure 8 Splunk ILM Mapping ...................................................................................................13
Figure 9 Data IO Detail .............................................................................................................14
Figure 10 Data IO Detail Expanded ...........................................................................................14
Figure 11 Splunk Single Instance - Shared ...............................................................................16
Figure 12 Splunk Single Instance - Dedicated ...........................................................................17
Figure 13 Splunk Single Instance Disk Map ..............................................................................17
Figure 14 Distributed Splunk Architecture .................................................................................18
Figure 15 Dedicated Distributed Splunk Architecture ................................................................19
Figure 16 Distributed Splunk Disk Map .....................................................................................19
Figure 17 Splunk Pod Overview ................................................................................................21
Figure 18 Nutanix Component Architecture ...............................................................................25
Figure 19 Leaf Spine Network Architecture ...............................................................................26
Figure 20 Test Environment Overview ......................................................................................27
10.2. Table of Tables
Table 1: Distributed Splunk Parameters ....................................................................................16
Table 2: Distributed Splunk Parameters ....................................................................................18
50
Splunk on Nutanix | 50
Table 3: General Design Decisions ...........................................................................................20
Table 4: Pod Highlights .............................................................................................................21
Table 5: Splunk Workload Scenarios ........................................................................................23
Table 6: Splunk Component Sizing ...........................................................................................24
Table 7: Nutanix Storage Configuration ....................................................................................25
Table 8: SplunkIT Metric Values ...............................................................................................35
Table 9: Bonnie++ Metric Values ..............................................................................................35
Table 10: IOzone metric values .................................................................................................36
Table 11: SplunkIT Results – Single VM ...................................................................................38
Table 12: SplunkIT Results - 4 VM ............................................................................................39
Table 13: SplunkIT Results - 8 VM ............................................................................................41
Table 14: Bonnie++ Results ......................................................................................................43
51
Splunk on Nutanix | 51
11. About the Author
Steven Poitras is a Solutions Architect and Technology Evangelist on the Technical Marketing team at Nutanix, Inc. In this role, Steven helps design architectures combining applications with the Nutanix platform creating solutions helping solve critical business needs and requirements and disrupting the infrastructure space. Prior to joining Nutanix he was one of the key solution architects at the Accenture Technology Labs where he was focused on the Next Generation Infrastructure (NGI) and Next Generation Datacenter (NGDC) domains. In these spaces he has developed methodologies, reference architectures, and frameworks focusing on the design and transformation to agile, scalable, and cost-effective infrastructures which can be consumed in a service-oriented or cloud-like manner.
Follow Steven on Twitter at @StevenPoitras
About Nutanix
Nutanix is the recognized leader in the emerging Virtual Computing Platform market. The Nutanix solution converges compute and storage resources into a single appliance, delivering a powerful, modular building block for virtual datacenters. It incorporates the same advanced, distributed software architecture that powers leading IT innovators such as Google, Facebook and Amazon – but is tailored for mainstream enterprises and government agencies. The Nutanix solution enables easy deployment of any virtual workload, including large-scale virtual desktop initiatives (VDI), development/test apps, big data (Hadoop) projects and more. Nutanix customers can radically simplify and scale out their datacenter infrastructures with cost-effective appliances that can be deployed in under 30 minutes for rapid time to value.
Follow the Nutanix blogs at http://www.nutanix.com/blog/
Follow Nutanix on Twitter at @Nutanix
52
Splunk on Nutanix | 52