Embed Size (px)
Citation preview

Splunk and SentinelOne Integration
SentinelOne Technology Add-On and Splunk App 3.6.x
29 July 2019

Copyright © 2019 SentinelOne
This document contains SentinelOne proprietary information owned by Sentinel Labs, Inc. ("SentinelOne"), and is provided for use only in connection with SentinelOne's Endpoint Protection Platform. This document may also contain confidential information, and may not be reproduced or otherwise used without the express permission of SentinelOne. SentinelOne reserves the right to amend this document in its sole discretion. SentinelOne® and the SentinelOne logos are the registered and unregistered trademarks of Sentinel Labs, Inc. Please contact SentinelOne with any questions.
Table of ContentsSplunk and SentinelOne Integration ........................................................................................ 1
Threats Dashboard ........................................................................................................ 1Take Action on Threats .......................................................................................... 2
Network Dashboard ....................................................................................................... 3Take Action on Endpoints ....................................................................................... 3
Splunk Search ............................................................................................................... 3Adaptive Response Actions for Alerts .............................................................................. 4Splunk Common Information Model (CIM) ....................................................................... 5Splunk Enterprise Security ............................................................................................. 6
Getting Started ...................................................................................................................... 8Requirements & Key Deployment Considerations .................................................................... 9
Splunk Server Requirements .......................................................................................... 9SentinelOne Version Requirements ................................................................................. 9Using Splunk Deployment Server to Install SentinelOne TA ............................................ 10Using SentinelOne TA on Splunk Search Head Clusters ................................................. 10
Installing and Upgrading the SentinelOne TA and App for Splunk ............................................ 11Installing the SentinelOne TA ........................................................................................ 11Installing the SentinelOne App ...................................................................................... 11
Setup and Configuration ....................................................................................................... 13Creating a SentinelOne User & API Key for Splunk Integration ....................................... 13Creating Dedicated Indexes for SentinelOne Collected Data ........................................... 14Configuring SentinelOne API for Splunk Data Input ........................................................ 18Configuring the SentinelOne App for Splunk Triggered Actions ....................................... 21Proxy Configuration ..................................................................................................... 22Setting TA Data Sharing ............................................................................................... 24
Exploring Common Use-Cases ............................................................................................. 26SentinelOne App and Splunk Adaptive Response Actions .............................................. 26
Adaptive Response Example 1 ............................................................................. 26Adaptive Response Example 2 ............................................................................. 26
Adaptive Responses in ES ........................................................................................... 27SentinelOne TA and Splunk Common Information Model (CIM) ...................................... 28
CIM Query Example 1 .......................................................................................... 28CIM Query Example 2 .......................................................................................... 29
Splunk Enterprise Security Interoperability ..................................................................... 30How to Integrate SentinelOne Data with Splunk Enterprise Security ........................ 31
Troubleshooting ................................................................................................................... 33Q1 Getting TA and App Event Logs ............................................................................... 33Q2 Estimating Event Data Volume ................................................................................ 33Q3 Balancing the Index Data Storage ........................................................................... 34Q4 Getting Missing Logs .............................................................................................. 35Q5 Defining a Start Time for Log Collection ................................................................... 35Q6 Missing Info in Splunk Enterprise Security (SE) ........................................................ 38Q7 Fixing Event Time Indexing from 3.6.1 and Earlier .................................................... 38
Contacting SentinelOne Support ........................................................................................... 41Credits ................................................................................................................................ 42Release Notes ..................................................................................................................... 43Known Limitations ................................................................................................................ 45
SentinelOne Splunk and SentinelOne Integration

Splunk and SentinelOne Integration
The integration of Splunk and SentinelOne empowers organizations to combine the strengths of their Splunk deployments to collect, monitor, analyze and visualize massive streams of machine data, with the visibility, detection, response, remediation and forensics capabilities of SentinelOne.
The integration uses two SentinelOne Apps for Splunk:
1. SentinelOne TA (Technology Add-on) for Splunk:
• Collects the data from the SentinelOne Management Server
• Maps SentinelOne objects to relevant Splunk CIM (Common Information Models)
• Enables saved searches and macros from one or more SentinelOne Management Consoles.
2. SentinelOne App for Splunk:
• An optional application that runs on the Splunk platform
• It has dashboards, saved searches, custom actions, and adaptive response actions, all ready to use as-is on the data collected by the SentinelOne TA, or as examples for further customization.
For What's New in each release, see the Release Notes [43].
Threats DashboardUse the Splunk Threats Dashboard to see an overview of threats and suspicious detections in your environment. Filter to choose a Management, scope, and time frame.
SentinelOne Splunk and SentinelOne Integration 1

• The Management(s) filter shows Management Consoles, taken from the SentinelOne TA indexed data, as reflected by the SentinelOne App s1_index search macro.
• The Site Name filter shows the subset of Site names relevant to the selected SentinelOne Managements.
For Banff and earlier Management Consoles that do not have different Sites, ALL shows.
Take Action on Threats
Take action on threats from the Threats Dashboard.
SentinelOne Splunk and SentinelOne Integration 2

Network DashboardUse the Splunk Network Dashboard to see information about the endpoints in your environment. Filter to choose a Management, scope, and time frame.
Take Action on Endpoints
Take action on endpoints from the Network Dashboard.
Splunk Search• Use queries to audit threats, network activities, and administrative actions.
• Use Splunks's Visualization tools to better understand query results.
SentinelOne Splunk and SentinelOne Integration 3

Adaptive Response Actions for Alerts• Create saved searches to generate Splunk alerts.
• utomatically handle detections with SentinelOne responses.
SentinelOne Splunk and SentinelOne Integration 4

Splunk Common Information Model (CIM)• Use the Splunk Common Information Model App with the SentinelOne TA.
SentinelOne Splunk and SentinelOne Integration 5

Splunk Enterprise Security• See SentinelOne provided data in the Enterprise Security Dashboards for Malware and Endpoints.
SentinelOne Splunk and SentinelOne Integration 6

SentinelOne Splunk and SentinelOne Integration 7

Getting Started
Download and install the SentinelOne TA and SentinelOne App from Splunkbase. The TA and App rely on an API key created from the SentinelOne Management Console.
The latest versions of the Apps show in Splunkbase by default when you search for SentinelOne Apps.
Use this guide to see the requirements for the TA and App, and to configure Splunk and SentinelOne integration. It also contains the Release Notes [43] for each SentinelOne TA and SentinelOne App version.
The latest version of this document is at: https://cdocs.sentinelone.net/Splunk/Splunk_and_SentinelOne_Integration_v3.6-en.pdf
This information is also in the SentinelOne Knowledge Base.
SentinelOne Splunk and SentinelOne Integration 8

Requirements & Key Deployment Considerations
The SentinelOne TA and the SentinelOne App are:
• Certified and SentinelOne-tested with a Splunk Enterprise single server instance.
• Certified by Splunk in a Splunk Cloud deployment.
• Field-Proven in a distributed Splunk Enterprise deployment.
Splunk Server RequirementsHardware Requirements for the Splunk Server:
• 8 GB or more RAM
• 4 or more CPU cores
Splunk Server Operating System:
SentinelOne App v3.6.2 is the last version that supports Splunk running on Windows Server 2012. From v3.6.3, only Splunk running on Linux x64 servers is supported.
• Linux x64 platforms running Splunk Enterprise v7.0.x - v7.3.x (assumed to work from v6.5.3):
• Ubuntu 14.04 or later
• CentOS 7 or later
• Windows Server 2012 (SentinelOne App v3.6.2 is the last version that supports this)
SentinelOne Version RequirementsSentinelOne Management Console:
SentinelOne App v3.6.2 is the last version that supports SentinelOne management versions Banff, Central Park, and Denali. From v3.6.3, Fuji and later management versions are supported.
We recommend that you use the latest build of your Management version.
These are the minimum required builds:
• Grand Canyon (all)
• Fuji build #21
• Denali build #20 (SentinelOne App v3.6.2 is the last version that supports this)
• Central Park build #119 (SentinelOne App v3.6.2 is the last version that supports this)
• Banff build #106 (SentinelOne App v3.6.2 is the last version that supports this)
SentinelOne Splunk and SentinelOne Integration 9

SentinelOne TA & App:
If you have earlier versions of SentinelOne TA or App v3.0.4 or earlier installed, you must completely remove them before you install a 3.5 or later SentinelOne TA or App.
Follow the instructions here [38] to resolve event time Indexing from 3.6.1 and earlier.
Download the latest stable releases from Splunkbase.
• v3.6.x SentinelOne TA (Technology Add-on)
• v3.6.x SentinelOne App for Splunk
End of Life Information
• SentinelOne TA & App v3.6.2 and lower will not be supported from January 1st, 2020
• Expected end of life for v3.6.3 is July 2020
The SentinelOne TA can safely install on all tiers of your Splunk platform deployment. To avoid unnecessary data duplication, follow the guidelines for SentinelOne API input configuration. To learn about tiers of your Splunk platform architecture for add-on installation, see Where to install Splunk add-ons.
Using Splunk Deployment Server to Install SentinelOne TAYou can use the deployment server to install the TA to your forwarders.
Important: The SentinelOne TA uses modular scripted inputs to collect data from remote SentinelOne Management Consoles (sources). If you use a deployment server to deploy the configured add-on to multiple forwarders acting as data collectors, there will be duplication of data.
You can safely use a deployment server to deploy unconfigured add-ons.
For more information about using a deployment server, see About deployment server and forwarder management in the Splunk Enterprise documentation.
Using SentinelOne TA on Splunk Search Head ClustersUnless otherwise noted, add-ons are supported on search head clusters (Splunk SHC) for search-time functionality (CIM model mapping, lookup tables and similar functionality), but not for data collection. To avoid creating duplicate inputs, do not configure SentinelOne API inputs in a search head cluster.
SentinelOne Splunk and SentinelOne Integration 10

Installing and Upgrading the SentinelOne TA and App for Splunk
Installing the SentinelOne TAIf you have earlier versions of SentinelOne TA or App (v3.0.4 or earlier) installed, make sure they are completely removed before you install the new SentinelOne TA.
We strongly recommend that you delete data indexed from previous versions. The new version will safely collect all existing data from the SentinelOne Management Console into the new index, after it is configured properly.
Use one or more of these deployment options for the SentinelOne TA:
• Install SentinelOne TA in a single-instance Splunk Enterprise deployment.
• Install SentinelOne TA on a Splunk Heavy Forwarder after you verify it is properly configured to forward SentinelOne collected data toward your distributed Splunk Enterprise or Splunk Cloud deployment.
• Install SentinelOne TA on distributed Splunk Enterprise deployment. Note that no special TA customization is required. Generally it is recommended to use Splunk Heavy Forwarder to collect the data, it may make sense to install the SentinelOne TA also on the Search Head Cluster, for CIM model mapping and associated lookup functionality, which will augment raw threat information with agent and user information
• Install the SentinelOne TA on Splunk Cloud. Deployment of the SentinelOne TA has similar deployment considerations for both Self-service and Managed Splunk Cloud that assume Heavy Forwarder usage for data collection and use of input free deployment on Search Head for CIM and lookup functionality.
If Splunk Enterprise prompts you to restart, do so.
If the SentinelOne TA is not listed (or if your Splunk Cloud is fully-managed) you will need to contact Splunk Support and ask them to install the SentinelOne TA for you on your Splunk Cloud instance.
Installing the SentinelOne AppYou must have an existing Splunk platform deployment and the SentinelOne TA installed and configured for the SentinelOne App to work. If you have an earlier version of the SentinelOne App (v3.0.4 or earlier), make sure it is completely removed before you install the latest version.
Use one or more of these deployment options for the SentinelOne App:
• Install the SentinelOne App on Splunk Enterprise.
• Install the SentinelOne App on Splunk Cloud.
• In a single instance deployment, Splunkbase and WebUI are enough.
• A distributed Splunk Enterprise deployment (with multiple Splunk Enterprise components, including Search Heads, Indexers, and Forwarders) might require you to download the app and use
SentinelOne Splunk and SentinelOne Integration 11
a Splunk Deployment Server to install or upgrade the SentinelOne App across Search Heads. See Use the deployer to distribute apps and configuration updates in the Distributed Search manual.
The SentinelOne App does not query the SentinelOne management API. It relies on the data already collected and indexed. The configuration options are optional. They enable you to execute SentinelOne actions from within Splunk, using custom actions or adaptive responses on SentinelOne managed entities (such as threats and agents).
If the SentinelOne App is not listed (or if your Splunk Cloud is fully-managed) you will need to contact Splunk Support and ask them to install the SentinelOne App for you on your Splunk Cloud instance.
SentinelOne Splunk and SentinelOne Integration 12

Setup and Configuration
Overview of the workflow:
• From Splunk UI > Apps, make sure that the SentinelOne TA and SentinelOne App are in the list of Apps and Add-ons.
• Create one or more SentinelOne users with a API tokens, for Splunk-based data collection. Optional: Give users Admin rights to allow Splunk actions.
• Create one or more indexes to host the data collected from SentinelOne.
• Configure the SentinelOne TA for data collection or provide CIM model mapping.
• Configure the SentinelOne App if you want to take actions from Splunk.
Creating a SentinelOne User & API Key for Splunk IntegrationYou must generate an API Token for each SentinelOne Management Console. To get that, create a user in the Management Console.
• The API token you generate is time limited. To regenerate a new token (and invalidate the old one), login with the dedicated admin account (no need to create a new account).
• A Viewer user role is sufficient to query the SentinelOne API from the SentinelOne TA, but it does not allow actions from Splunk. To act on SentinelOne managed endpoints (disconnect, reconnect) or on threats (mark benign, threat, or resolve) your API token must have Admin user permissions.
To generate an API Token:
1. Log in to the SentinelOne Management Console with Admin user credentials.
2. In your Management Console, click Settings > USERS.
3. Click New User.
The New User window opens.
4. Enter a Full Name and Email address for the user.
Users log in with their email address.
5. Enter a Password for the user, and in Confirm Password, enter it again.
Passwords must:
• Have 10 or more characters.
• Contain 3 or more of these character types: Capital letters, lower case letters, numbers, special characters.
SentinelOne Splunk and SentinelOne Integration 13

• NOT contain whitespace.
6. For Central Park and higher: Select the correct User scope.
For Banff and earlier: Select a Role.
7. Click Save.
8. Log in to the SentinelOne Management Console with the credentials of the new user.
9. Click your user, or hover and click its edit button.
a. You can generate a token only for your own user.
b. Click the edit button. The Edit User window opens.
10. In the API Token section, click Generate.
If you see Revoke and Regenerate, you already have a token. If you revoke or regenerate it, scripts that use that token will not work. There is no confirmation. Revoke removes the token authorization. Regenerate revokes the token and generates a new token.
If you click Generate or Regenerate, a message shows: This is the last time you can see this token. It shows the token string and the date that the token expires.
11. Copy or download this API Token (to use with your SentinelOne TA and App).
Creating Dedicated Indexes for SentinelOne Collected DataWe highly recommend that you create one or more dedicated indexes for SentinelOne collected data.
SentinelOne Splunk and SentinelOne Integration 14

By default, SentinelOne TA and App use a Search Macro called s1_index, that is configured to use “index=sentinelone”. This configuration is simplest, but the Apps can work with multiple indexes and indexes with different names. To fit role-based access control, optimize data retention, or tune performance, change the configuration to fit your needs. You might want to consult with Splunk experts to configure your indexes optimally for the needs of your environment.
To create a dedicated data index:
1. In the Splunk Console, from Apps, select Sentinelone.
2. Select Settings > Data > Indexes.
3. Click New Index.
4. Create a new index.
In this example the name of the index is sentinelone, but it can have a different name.
SentinelOne Splunk and SentinelOne Integration 15

5. Click Save.
To change the definition of the default s1_index:
1. In the Splunk Console, from Apps, select Sentinelone.
2. Select Settings > Knowledge > Advanced search.
SentinelOne Splunk and SentinelOne Integration 16
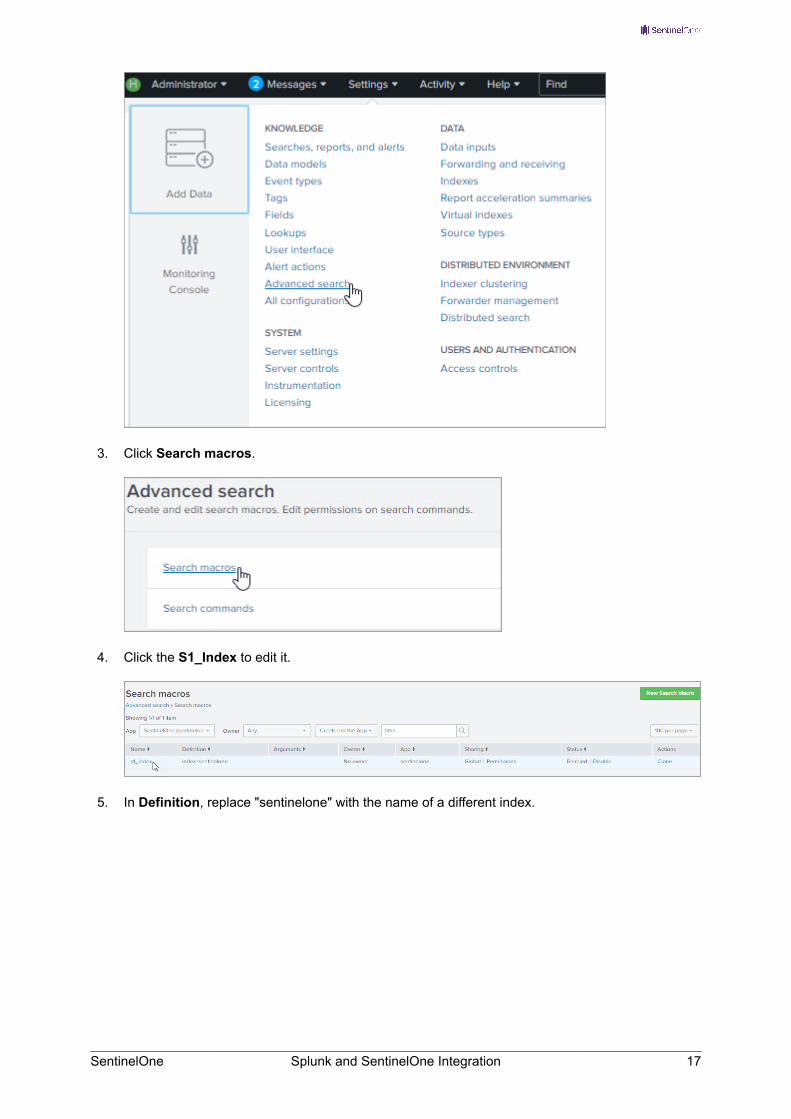
3. Click Search macros.
4. Click the S1_Index to edit it.
5. In Definition, replace "sentinelone" with the name of a different index.
SentinelOne Splunk and SentinelOne Integration 17

6. Click Save.
Configuring SentinelOne API for Splunk Data InputThe SentinelOne data collection is controlled through the dedicated Data Inputs called SentinelOne API. The API implementation is provided and controlled by the SentinelOne TA. The SentinelOne API data provider uses the SentinelOne Management Console API, and does not use the SentinelOne provided Syslog or CEF notifications. The API is more reliable, because it uses the SentinelOne query interface to look for changes in the underlying data model since the last successful query. This makes data recovery possible, even after an extended network or Splunk service outage.
You can have multiple inputs for one Management Console and multiple inputs for disconnected SentinelOne Management Consoles.
Each input can poll different API channels and have different interval settings. For example, you can get alerts for threats as soon as they are detected without the noise of every device “last-seen” update.
Note: If the same entity type is collected by multiple SentinelOne API data inputs, data duplication can occur. Examples of entity types are agents, threats, activities, and groups.
To add a SentinelOne Management Console source:
1. In the Splunk Console, from Apps, select Sentinelone TA.
2. Click Create New Input.
A new windows opens for the data input information.
SentinelOne Splunk and SentinelOne Integration 18

3. Enter the information for the Management Console integration and then click Add.
Field Description Example and NotesName Unique name for the
SentinelOne Management Console
Typically, this is the Management Console domain name, but it can be any name.
Interval Default polling interval for Management Console updates
Index Pointer for the TA, to keep the data collected from SentinelOne
The SentinelOne App uses the “s1_index”.
Hostname Management Console domain name
For example, this would be “my-management” for “https://my-management.sentinelone.net”
Domain FQDN Suffix of the SentinelOne management console name.
Given the above example this would be “sentinelone.net”
API Token API token generated in the SentinelOne Console
API Version Version number of the SentinelOne API
Central Park and higher - v2.0Banff and earlier - v1.6
API Channels
Objects from which to collect data: Activities, Agents, Groups, and Threats.
Entry1 polls threats and Agents. Entry2 polls groups and activities less frequently.
SentinelOne Splunk and SentinelOne Integration 19
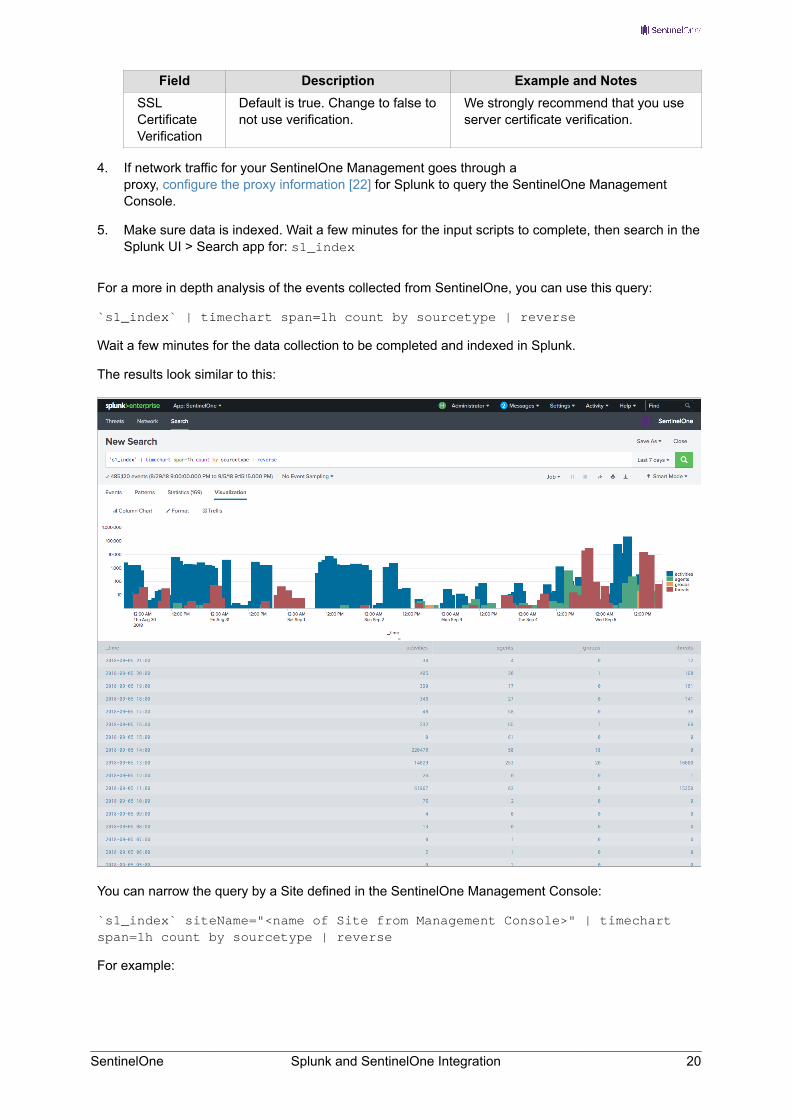
Field Description Example and NotesSSL Certificate Verification
Default is true. Change to false to not use verification.
We strongly recommend that you use server certificate verification.
4. If network traffic for your SentinelOne Management goes through a proxy, configure the proxy information [22] for Splunk to query the SentinelOne Management Console.
5. Make sure data is indexed. Wait a few minutes for the input scripts to complete, then search in the Splunk UI > Search app for: s1_index
For a more in depth analysis of the events collected from SentinelOne, you can use this query:
`s1_index` | timechart span=1h count by sourcetype | reverse
Wait a few minutes for the data collection to be completed and indexed in Splunk.
The results look similar to this:
You can narrow the query by a Site defined in the SentinelOne Management Console:
`s1_index` siteName="<name of Site from Management Console>" | timechart span=1h count by sourcetype | reverse
For example:
SentinelOne Splunk and SentinelOne Integration 20

• To query events from a Site named "DataCenter":
`s1_index` siteName="DataCenter" | timechart span=1h count by sourcetype | reverse
• To query events from all Sites:
`s1_index` siteName="*" | timechart span=1h count by sourcetype | reverse
Note: If you do not see the data within 10 minutes, see the troubleshooting to identify and recover from errors, such as user input typos and network or authentication errors.
Agent-related changes are a large portion of the events stored in Splunk indexes. If you feel there are too many events, you can split the agent collection to a slower SentinelOne API data input with a slower polling interval. This reduces the Splunk persistent store (at the cost of up-to-the-minute accuracy).
Configuring the SentinelOne App for Splunk Triggered ActionsBy default, the SentinelOne App provides some saved searches, dashboards that use the data collected by the SentinelOne TA. The SentinelOne App also provides actions you can use with the predefined dashboards or Splunk defined alerts.
These actions rely on a SentinelOne Admin user API token from the SentinelOne Management Console,
It can be the same SentinelOne token used in the SentinelOne App setup page for the Splunk TA, or a different user and token from the SentinelOne Management Console. It must be an Admin User.
To configure the App to take actions on SentinelOne Agents and threats:
1. In the Splunk Console, from Apps, select Manage Apps.
2. If necessary, search for Sentinelone.
3. In the line for SentinelOne, click Set up.
SentinelOne Splunk and SentinelOne Integration 21

4. Enter the details for the new Console.
The required fields are the same as the fields defined in the SentinelOne TA, but the polling interval and index information are not included here, because the SentinelOne App is limited to actions.
5. If network traffic for your SentinelOne Management goes through a proxy: Click Proxy Settings to configure the proxy information [22] for Splunk to query the SentinelOne Management Console.
6. Click Save Console.
Proxy ConfigurationBoth the SentinelOne TA and the SentinelOne App support HTTP proxy configuration.
If your network traffic goes through a proxy, configure the proxy for the TA and App.
To configure a proxy for the SentinelOne TA:
1. In the Splunk Console, select Apps > SentinelOne TA.
2. Click Configuration.
3. In the Proxy tab:
SentinelOne Splunk and SentinelOne Integration 22

a. Select Enable.
b. Enter details for the Proxy server.
c. Click Save.
To configure a proxy for the SentinelOne App:
This is only required if you want to take action from Splunk.
1. In the Splunk Console, select Apps > Manage Apps.
SentinelOne Splunk and SentinelOne Integration 23

2. In the line for SentinelOne, click Set up.
3. Fill in the details to Add a New Console or click Edit next to an existing Console to add proxy details.
4. Click Proxy Settings.
5. Enter the details for the proxy.
6. Click Save Console.
Setting TA Data SharingIn the SentinelOne TA configuration, set if you want to share metadata and crash reports with SentinelOne. Sharing this data helps SentinelOne improve our product.
To configure the TA data sharing:
1. In the Splunk Console, select Apps > SentinelOne TA.
SentinelOne Splunk and SentinelOne Integration 24

2. Click Configuration.
3. In the Add-on Settings tab, select or clear Share data.
4. Click Save.
SentinelOne Splunk and SentinelOne Integration 25

Exploring Common Use-Cases
SentinelOne App and Splunk Adaptive Response ActionsWhen both SentinelOne TA and SentinelOne App are configured, you can create saved searches that produce Splunk alerts, and then take actions.
You can utomatically handle detections with SentinelOne responses.
Adaptive Response Example 1
This shows how to disconnect a managed endpoint with active threats. (This is a naïve scenario, as an example. You will add more operational restrictions that go beyond the SentinelOne policy control.)
1. Use a query to find active threats.
2. Click Save As and Select Save As Alert.
3. In the window that opens, enter a title, and optionally, a description for the alert.
4. Select the Alert type: Scheduled or Real-time.
5. Under Trigger Conditions, select when the alert is triggered.
6. Under Trigger Actions, select the action done when an alert is triggered.
In this example, the SentinelOne Management Console will disconnect the Agent.
Adaptive Response Example 2
This Alert example shows a different way that you can automatically handle detections with a SentinelOne response. In the example, SentinelOne automatically marks the detection as resolved when it meets the criteria in the query.
SentinelOne Splunk and SentinelOne Integration 26

Other responses are:
• Mark as Threat – Invokes policy-defined mitigation actions, if the policy of the agent has “protect” associated with threat level detections. The file hash (or active content signature) is added to the SentinelOne blacklist.
• Mark as Benign – Adds the file hash (or active content signature) to the whitelist and marks the threat as resolved.
• Mark as Resolved – Marks the threat as resolved and reduces the active threat count associated with the agent (reduces the total number of threats tracked in various dashboards).
Adaptive Responses in ESTo make SentinelOne adaptive responses show in Splunk Enterprise Security, you must add the naming convention of SentinelOne to Splunk ES.
To make SentinelOne adaptive responses show in Splunk ES:
1. On the Enterprise Security toolbar, go to Configure > General and select App Imports Update.
2. Edit the update_es input.
SentinelOne Splunk and SentinelOne Integration 27

3. Update the Application Regular Expression field, adding the naming convention sentinelone to the list of supported naming conventions, using a regex.
For example, change the Application Regular Expression field from:
(appsbrowser)|(search)|([ST]A-.*)|(Splunk_[ST]A_.*)|(DA-ESS-.*)|(Splunk_DA-ESS_.*)|(My_datasource)
to:
(appsbrowser)|(search)|([ST]A-.*)|(Splunk_[ST]A_.*)|(DA-ESS-.*)|(Splunk_DA-ESS_.*)|(My_datasource)|(sentinelone)
Note: When changing the Application Regular Expression field, always append to the default regex (as shown in the example above), so the existing app imports will still work.
4. Click Save.
5. Restart Splunk Enterprise Services to activate the change.
SentinelOne TA and Splunk Common Information Model (CIM)Make sure that the Splunk Common Information Model App is installed on your Splunk instance.
Make sure that the SentinelOne TA is configured correctly and running.
You can use these queries to test Splunk's CIM mapping:
CIM Query Example 1
| from datamodel :" Malware.Malware_Attacks " | search vendor_product =SentinelOne
SentinelOne Splunk and SentinelOne Integration 28

CIM Query Example 2
| from datamodel :" Compute_Inventory.OS " | search vendor_product =SentinelOne
SentinelOne Splunk and SentinelOne Integration 29

Splunk Enterprise Security InteroperabilityWhen data is retrieved from SentinelOne, you should see SentinelOne provided data in the Enterprise Security Dashboards for Malware and Endpoints.
SentinelOne Splunk and SentinelOne Integration 30

If the data does not show, but it is available by search, make sure your Enterprise Security is configured correctly with SentinelOne.
How to Integrate SentinelOne Data with Splunk Enterprise Security
To integrate SentinelOne data into Splunk Enterprise Security:
1. After you install and test the SentinelOne TA and SentinelOne Add-on, import them to Splunk Enterprise Security.
2. From the Enterprise Security toolbar, select Configure > General and then select App Imports Update.
3. Click update_es.
4. Update the Application Regular Expression field: Add the naming convention of your Add-on to the list of supported naming conventions. Use a regex. For example:
(appsbrowser)|(search)|([ST]A -.* )|(Splunk_[ST]A_.*)|(DA-ESS-.*)|(Splunk_DA-ESS_.*)|(sentinelone.*)
Do not delete your existing apps from the field, but make sure that (sentinelone.*) is added at the end.
5. Click Save.
6. To confirm the changes, select Apps > Search & Reporting, and search for:
|rest services/data/inputs/ app_imports_update | table title app_regex app_exclude_regex updated
The updated update_es field shows.
7. If Splunk asks for it, restart your Splunk Enterprise Services.
8. See the app imports. Run the | rest search commands.
You must have Splunk administrator permissions to run the command. For example, to view the imports for the SplunkEnterpriseSecuritySuite app while authenticated as the admin user, run:
| rest /servicesNS/admin/system/apps/local/SplunkEnterpriseSecuritySuite/import splunk_server =local | fields import
Look for sentinelone in the results.
SentinelOne Splunk and SentinelOne Integration 31

9. From the Enterprise Security toolbar, select Security Domains > Endpoint > Malware Center.
Look for Malware Activity related to your SentinelOne environment.
SentinelOne Splunk and SentinelOne Integration 32
Troubleshooting
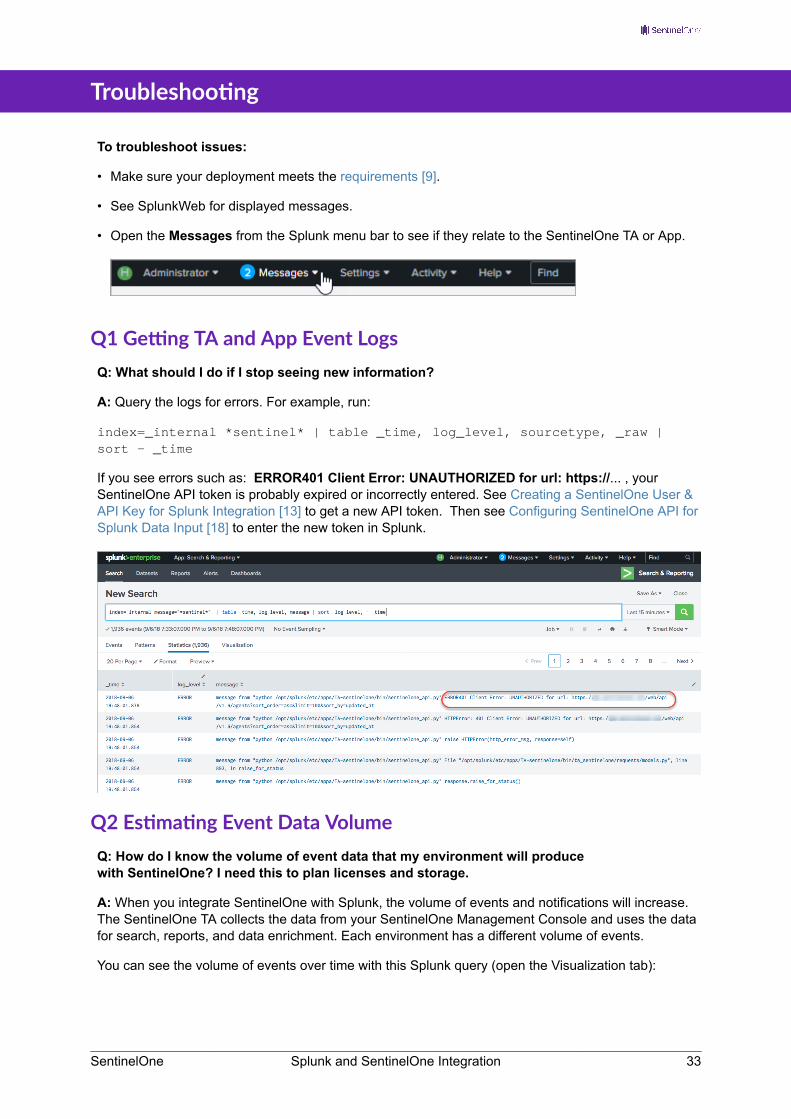
To troubleshoot issues:
• Make sure your deployment meets the requirements [9].
• See SplunkWeb for displayed messages.
• Open the Messages from the Splunk menu bar to see if they relate to the SentinelOne TA or App.
Q1 Getting TA and App Event LogsQ: What should I do if I stop seeing new information?
A: Query the logs for errors. For example, run:
index=_internal *sentinel* | table _time, log_level, sourcetype, _raw | sort - _time
If you see errors such as: ERROR401 Client Error: UNAUTHORIZED for url: https://... , your SentinelOne API token is probably expired or incorrectly entered. See Creating a SentinelOne User & API Key for Splunk Integration [13] to get a new API token. Then see Configuring SentinelOne API for Splunk Data Input [18] to enter the new token in Splunk.
Q2 Estimating Event Data VolumeQ: How do I know the volume of event data that my environment will produce with SentinelOne? I need this to plan licenses and storage.
A: When you integrate SentinelOne with Splunk, the volume of events and notifications will increase. The SentinelOne TA collects the data from your SentinelOne Management Console and uses the data for search, reports, and data enrichment. Each environment has a different volume of events.
You can see the volume of events over time with this Splunk query (open the Visualization tab):
SentinelOne Splunk and SentinelOne Integration 33

`s1_index` | timechart span=1h count by sourcetype | reverse
Wait a few minutes for the data collection to be completed and indexed in Splunk.
The results look similar to this:
These factors contribute to the event volume:
• The number of managed endpoints, their activities, and their exposure to network threats.
• The number of SentinelOne Agents.
• The polling interval. At each polling interval, the data changed from the last polling interval is gathered from your SentinelOne Console and brought into Splunk.
• How long the data stays in your Splunk environment. This is based on the decommission policy associated with your index and on which data you delete. You can delete data that you do not need.
• The number of threats. If threat processes are active, SentinelOne Agents send data about them.
Q3 Balancing the Index Data StorageQ: How can I balance the index data storage?
A: You can change the polling interval of the SentinelOne scripts in Settings > Data Inputs > SentinelOne API. When you extend this interval, you get fewer events because you do not
SentinelOne Splunk and SentinelOne Integration 34
see changes between the polling intervals. If you shorten the interval, you see the changes as separate events.
One option to consider is to split Data Inputs and have threat data polled more frequently than agents. To do that, you can create multiple inputs: one each for threats (fast, for example every 30 seconds), agents, activity (slower, for example every 10 minutes or 600 seconds) and one for policy and groups (very slow, for example once every 24 hours or 86400 seconds).
Note - After you change the polling interval, it can take a few hours to see the changes.
Q4 Getting Missing LogsQ: We had a technical problem and Splunk did not pull logs from SentinelOne for a few days. How can I get the logs for the missing days?
A: If you lose event data due to API key expiration or to Splunk indexing outage (license, capacity, or other), the SentinelOne TA data collection scripts keep the last successful retrieval time. After the connection is restored, all events from after the last retrieval are automatically pulled.
If you rename the Input, it will start to collect logs again from the beginning of the SentinelOne integration.
Q5 Defining a Start Time for Log CollectionQ: How can I define a start time for log collection?
A: See the instructions here to define a start time for a SentinelOne API event cache.
The Splunk TA holds a local SentinelOne API cache that restricts event indexing to significant attribute changes. For example, the last logged in user changed is indexed. but not an event where the last seen changed but only by a couple of seconds. The SentinelOne TA holds this cache per Management Console input defined in the Inputs tab.
Also see Configuring SentinelOne API for Splunk Data Input [18].
Method 1: Create a new Input
1. In the Splunk Console, from Apps, select SentinelOne TA.
2. Click Inputs.
3. In the row of an Input, click Action and select Disable.
(It is better to disable and not delete the Input so you have a record of Input names that were used.)
SentinelOne Splunk and SentinelOne Integration 35
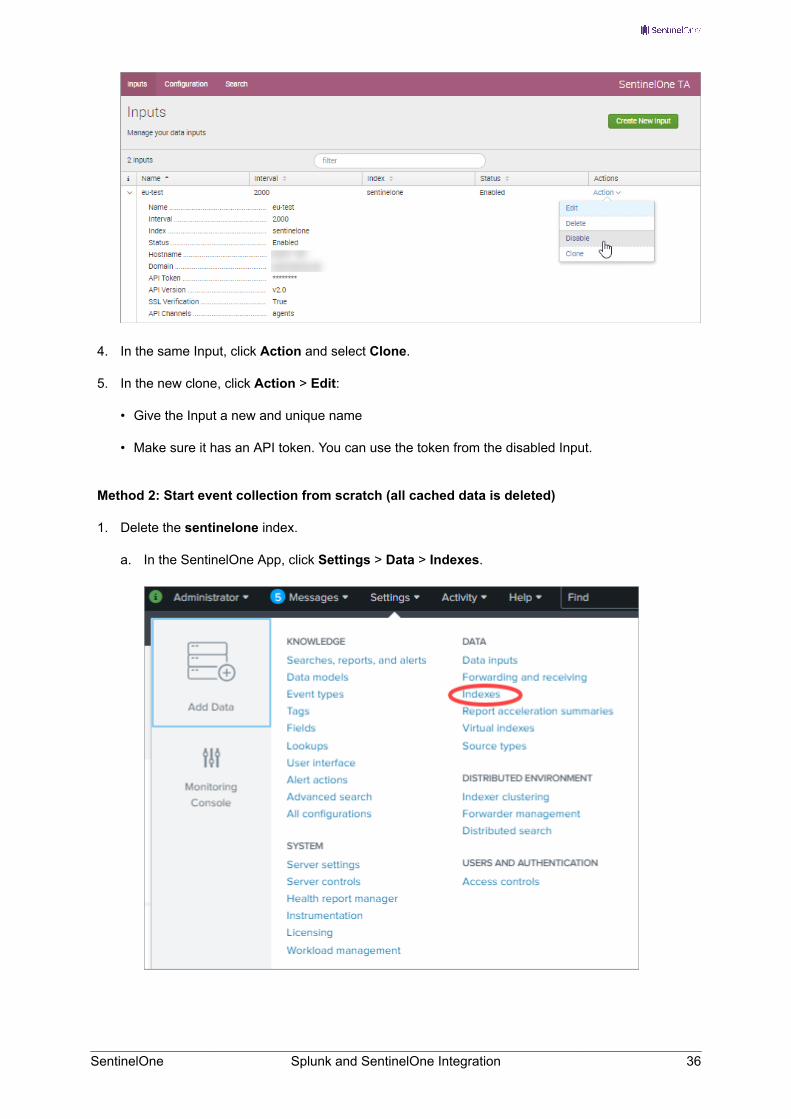
4. In the same Input, click Action and select Clone.
5. In the new clone, click Action > Edit:
• Give the Input a new and unique name
• Make sure it has an API token. You can use the token from the disabled Input.
Method 2: Start event collection from scratch (all cached data is deleted)
1. Delete the sentinelone index.
a. In the SentinelOne App, click Settings > Data > Indexes.
SentinelOne Splunk and SentinelOne Integration 36

b. Delete the sentinelone index.
2. Uninstall the SentinelOne TA.
3. Install [11] the SentinelOne TA v3.6.2 or higher.
4. Create the sentinelone index [14] again.
5. Redefine the API inputs [18].
Method 3: Disable the Input Collection and Re-enable it for a specific time using Lookup Editor
Advanced- we recommend that you do this with SentinelOne Support.
1. Follow steps 1-3 in Method 1 to disable the Input.
2. Install the Lookup Editor Splunk App from Splunkbase.
3. In this App go to Lookups > TA_sentinelone_checkpointer.
4. Wait at least ten minutes to let in progress API collection finish. Keep in mind that for a system with many Agents and threats, the TA’s API pull and push into Splunk indexes can take a few minutes to complete. Make sure that when you refresh the Lookup Editor, it shows no further updates to the relevant input.
5. In the state column, change the values to the time from which you want the SentinelOne TA to get events.
To find the value to edit, in the _key column, look for the Input name_Management Domain Name_tenant_<Source type: Agents, groups, threats or activities>_checkpoint. For example, Myinput_Example.net_tenant_Agents_checkpoint.
In the state column, edit the value field. For example, if you edit one of your defined “checkpoint” entries with “{\“value\“: \“2018-01-02T00:00:00.000000Z\“, \“time\“: \“2019-05-06T17:10:50.675897+00:00\“}”, the SentinelOne TA will start pulling all entries that changed from Jan 2nd, 2018.
6. Go back to the SentinelOne TA App > Inputs.
7. Enable the Input that you disabled earlier.
8. Wait at least ten minutes for the data to backfill from the SentinelOne API. You will know that the backfill is completed by looking at the “Lookup Editor”. When the “value” field has updated to a UTC time value between “now” and now minus the polling interval.
SentinelOne Splunk and SentinelOne Integration 37

Or use the Splunk search to see how many events were indexed from the source type you defined (keep in mind that queries are queued so it might take time for the backfill to start):
index=sentinelone sourcetype="threats" updated>"2018-01-02T00:00:00.000000Z" earliest=1 latest=now() | stats count
Q6 Missing Info in Splunk Enterprise Security (SE)Q: Why don't I see SentinelOne information or adaptive responses in Splunk Enterprise Security (SE)?
A: You need to configure SE to work with SentinelOne. See Splunk Enterprise Security Interoperability [30].
If you get error 404 in the incident review under the Splunk Enterprise Security App:
1. Go to Settings > Alert actions and check the permissions for the sentinelone alerts (SentinelOne Endpoint Network Control and SentinelOne Threat Control).
2. In the Sharing tab, if App shows, go to Permissions > All Apps and for Read/write, select Everyone.
3. Restart Splunk Enterprise Security.
4. Run the adaptive action again and make sure it works,
5. In the log directory (/splunk/var/log/splunk/sentinelone) and check sentinelone_alert_actions.log. In the incident review under the Splunk Enterprise Security App, make sure you see a 200 response.
Q7 Fixing Event Time Indexing from 3.6.1 and EarlierQ: How can I get the fix for SentinelOne generated event time indexing with Splunk event “dedup” logic (from v3.6.2)?
A: Customers who install the SentinelOne App and TA v3.6.2 as a clean installation automatically get this fix and all events will be synchronized.
If you upgrade to 3.6.2 from an earlier version, all events from after the upgrade will synchronize correctly, but older events might have incorrect dates.
• Choose a method to delete already indexed events before reloading them again from the SentinelOne Management Console
• Then choose a method to recover the data from SentinelOne.
Method 1: Selective delete from Splunk Search
1. Use the Splunk search to search for the range of events to delete.
2. Delete the events. For example:
index=* source=sentinelone_api earliest=1 latest=now() | delete
SentinelOne Splunk and SentinelOne Integration 38
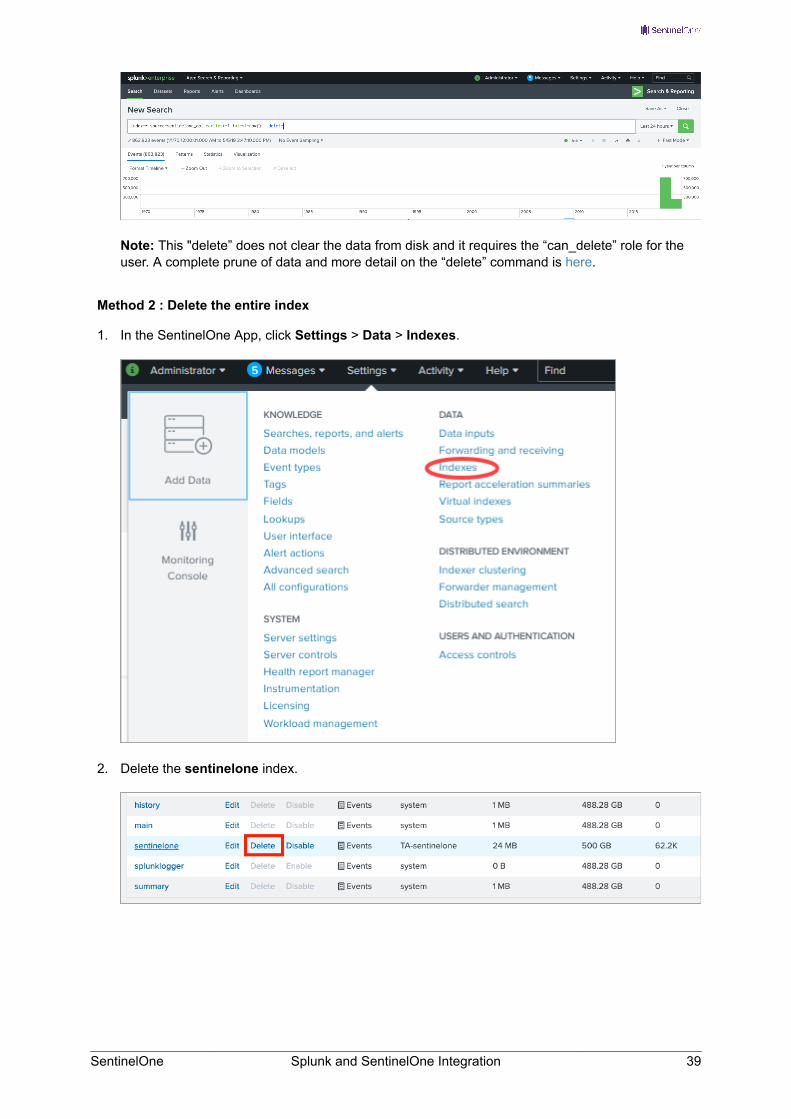
Note: This "delete” does not clear the data from disk and it requires the “can_delete” role for the user. A complete prune of data and more detail on the “delete” command is here.
Method 2 : Delete the entire index
1. In the SentinelOne App, click Settings > Data > Indexes.
2. Delete the sentinelone index.
SentinelOne Splunk and SentinelOne Integration 39
Use one of these methods to recover the data from SentinelOne:
A. Create a new Input [18], that will ignore old checkpoints.
B. Uninstall and reinstall the TA:
I. Uninstall the SentinelOne TA.
II. Install [11] the SentinelOne TA v3.6.2 or higher.
III. Create the sentinelone index [14] again.
C. Reset the input time with the Lookup Editor App (Advanced- we recommend that you do this with SentinelOne Support). See Method 3 in Q5 Defining a Start Time for Log Collection [35].
SentinelOne Splunk and SentinelOne Integration 40

Contacting SentinelOne Support
See Troubleshooting [33] to try to resolve issues on your own.
If you cannot resolve an issue, contact SentinelOne Support. Before you contact Support, collect this information:
Information to include in a SentinelOne Support ticket:
• Messages from SplunkWeb.
• Messages from the Splunk menu bar that relate to the SentinelOne TA or App
• Messages in the Splunkd log file. Use this query:
index=_internal message="*sentinel*"
• Files in these locations:
1. /opt/splunk/var/log/splunk/splunkd.log
2. /opt/splunk/var/log/splunk/*sentinel*.log
3. /opt/splunk/var/log/splunk/sentinelone/*
4. /opt/splunk/var/log/splunk/TA-sentinelone/*
• The versions of your SentinelOne Splunk Apps. To find this:
1. In the Splunk Console, select Apps > Manage Apps.
2. Search for Sentinelone.
3. See the SentinelOne Apps installed and their versions.
• Your Splunk version (Find your Splunk version).
• Your supported OS and version, for example, CentOS 7.
• Get more information, such as screenshots, logs, or a zipped tar of the installed TA directory:
tar cvzf TA-sentinelone.tgz /opt/splunk/etc/apps/TA-sentinelone
• A description of a feature and how you invoked it (such as UI clicks), or a description of a bug and how to reproduce it. Write what you expected compared to what you saw.
SentinelOne Splunk and SentinelOne Integration 41

Credits
• Splunk SDK for Python: http://dev.splunk.com/python
• PyCrypto Python Module: https://pypi.org/project/pycrypto
• Splunk Add-on Builder: https://splunkbase.splunk.com/app/2962/
SentinelOne Splunk and SentinelOne Integration 42

Release Notes
3.6.3
• New support for Splunk Server 7.3.
• UI fixes and improvements.
• Improved stability.
• Improved search of SentinelOne data.
• Fixed missing field extractions.
• Fixed issues related to cache management.
• Information for decommissioned Agents are now fetched.
3.6.2
• SentinelOne App v3.6.2 is the last version that supports SentinelOne management versions Banff, Central Park, and Denali. From v3.6.3, Fuji and later management versions are supported.
• SentinelOne App v3.6.2 is the last version that supports Splunk running on Windows Server 2012. From v3.6.3, only Splunk running on Linux x64 servers is supported.
• SentinelOne App v3.6.2 is now certified for Splunk Cloud Deployments.
• v2.0 SentinelOne API is supported by default, including fetching events with the API cursor.
• The log cache is now under the TA SentinelOne App directory.
• Resolved Critical Issue with SentinelOne generated event time indexing with Splunk dedup logic: SentinelOne recommends that customers who use Splunk event “dedup” logic to show the latest information first, follow the instructions here [38] to delete the existing index data and re-import the events.
3.6.1
• Added configuration to upstream metadata for better App experience and analysis.
• Modified logging to send all logs to the $SPLUNK_HOME/var/log/splunk/TA-sentinelone and $SPLUNK_HOME/var/log/splunk/sentinelone folders.
• Improved the Setup page for the SentinelOne App.
• Provided fallback for Splunk's KV Store functionality.
3.5.6
• Fixed a timestamp parsing bug with the SentinelOne TA that caused it to fail to collect past events from the SentinelOne Management Console. The SentinelOne TA now uses a Splunk-provided persistence mechanism.
SentinelOne Splunk and SentinelOne Integration 43
• Fixed a bug with the SentinelOne TA internal caching mechanism, to prevent over-polling. It now sporadically skips API poll requests, when the polling interval exceeds Splunk's persistence speed.
• Provided a fix for Splunk Enterprise v7.2.*, which did not show some chart data in the SentinelOne App Dashboard.
• To ease debugging, the Management URL now shows in the SentinelOne TA collector logs. This should help customers aggregate data from multiple SentinelOne Consoles.
Example of an improved logging message: 2018-12-02 17:10:45,466 INFO pid=25606 tid=MainThread file=base_modinput.py:log_info:293 | Collector[fqdn-for-mytest-console.sentinelone.net]: Iterating threats
• Provided a temporary workaround for customers that want to set the API log collection start time (by default it is the beginning of time). See How can I define a start time for log collection? [33].
3.5.5
• Added SentinelOne Multi-Site filter
• Added threat event creation indicator (creationIndicator) for each threat: update | create
• Made string detection indicators readable
• Improved TA data collection on Windows Server 2012
• Resolved issues
3.5.2
• Added missing CIM model mappings
• Resolved issues
3.5.1
• Added adaptive response actions
• Improved dashboards
• Added support for CIM model mappings
• Resolved issues
3.5.0
• Added support for SentinelOne Multi-Site Management Server versions
• Added support for Multi-Site features
• Verified backward compatibility for earlier Management Server versions
SentinelOne Splunk and SentinelOne Integration 44

Known Limitations
Known Limitations for this version
ID Description Reported on
Resolved in
INTG-180 Offline Agents incorrectly show the status is_active = true in the Splunk App.
3.6.3
INTG-180 When new Agents are added to a SentinelOne Default Group, the number of Agents in the Group does not update in the Network page of the Splunk App.
3.6.3
13 Resolved Critical Issue with SentinelOne generated event time indexing with Splunk dedup logic: SentinelOne recommends that customers who use Splunk event “dedup” logic to show the latest information first, follow the instructions here [38] to delete the existing index data and re-import the events.
2.0.0 3.6.2
15 Resolved: Issues with caching and Agents and Group lookups.
2.0.0 3.6.2
12 Resolved App Dashboard counting errors. 2.0.0 3.6.210 Resolved issue with App-provided adaptive
response actions failing to execute from the Dashboard.
3.5.0 3.6.2
1 Improved telemetry data for crash and error reporting for internet connected customers. To enable this: In the SentinelOne TA, click Configuration > Add-on Settings and select Share data.
N/A 3.6.2
1189 The Threat Description field does not update with mitigation or resolved state changes. Workaround: See the threat attributes.
3.5.0
1662 The SentinelOne TA currently does not allow time restricted inputs.
3.5.0
1664 Resolved: With a Splunk server running Splunk v7.2.0, SentinelOne App Dashboards do not search populated charts and columns as well as with supported versions [9].
3.5.0 3.5.6
SentinelOne Splunk and SentinelOne Integration 45