Embed Size (px)
Citation preview

Long-‐Term Storage Panel Session
Erik Riedel, EMC Library of Congress Workshop
September 2012 top picture “Once Blue” by Jesse Wagstaff via flickr/cc right picture by AusNn Marshall via flickr/cc
revision 3

Parameters
• Non-‐compressible data • Long-‐term storage • Very high reliability • Request rate of 10% per year • 5, 20, 50 PB in 2012, 2015, 2018

Density 2012 Disks (raw) @ 3TB Disks (protected) Racks @ 480 disks
5 PB 1,700 disks 2,700 disks 6 racks
20 PB 6,700 disks 11,000 disks 23 racks
50 PB 17,000 disks 27,000 disks 56 racks

Density 2012 Disks (raw) @ 3TB Disks (protected) Racks @ 480 disks
5 PB 1,700 disks 2,700 disks 6 racks
20 PB 6,700 disks 11,000 disks 23 racks
50 PB 17,000 disks 27,000 disks 56 racks
2015 Disks (raw) @ 6TB Disks (protected) Racks @ 600 disks
5 PB 830 disks 1,300 disks 3 racks
20 PB 3,300 disks 5,300 disks 9 racks
50 PB 8,300 disks 13,000 disks 23 racks
2018 Disks (raw) @ 10TB Disks (protected) Racks @ 600 disks
5 PB 500 disks 800 disks 2 racks
20 PB 2,000 disks 3,200 disks 6 racks
50 PB 5,000 disks 8,000 disks 14 racks

Performance 2012 10%/yr Disks Disk BW Racks Bandwidth Actual BW Days-‐to-‐fill
5 PB 16 MB/s 2,700 200 GB/s 6 30 GB/s 3 GB/s 19
20 PB 63 MB/s 11,000 1.1 TB/s 23 115 GB/s 11 GB/s 20
50 PB 159 MB/s 27,000 2.7 TB/s 56 280 GB/s 28 GB/s 21

Performance 2012 10%/yr Disks Disk BW Racks Bandwidth Actual BW Days-‐to-‐fill
5 PB 16 MB/s 2,700 200 GB/s 6 30 GB/s 3 GB/s 19
20 PB 63 MB/s 11,000 1.1 TB/s 23 115 GB/s 11 GB/s 20
50 PB 159 MB/s 27,000 2.7 TB/s 56 280 GB/s 28 GB/s 21
2012 10%/2day Disks Disk BW Racks Bandwidth Actual BW Days-‐to-‐fill
5 PB 2.9 GB/s 2,700 200 GB/s 6 30 GB/s 3 GB/s 19
20 PB 11 GB/s 11,000 1.1 TB/s 23 115 GB/s 11 GB/s 20
50 PB 29 GB/s 27,000 2.7 TB/s 56 280 GB/s 28 GB/s 21

Performance 2012 10%/yr Disks Disk BW Racks Bandwidth Actual BW Days-‐to-‐fill
5 PB 16 MB/s 2,700 200 GB/s 6 30 GB/s 3 GB/s 19
20 PB 63 MB/s 11,000 1.1 TB/s 23 115 GB/s 11 GB/s 20
50 PB 159 MB/s 27,000 2.7 TB/s 56 280 GB/s 28 GB/s 21
2018 10%/2day Disks Disk BW Racks Bandwidth Actual BW Days-‐to-‐fill
5 PB 2.9 GB/s 800 80 GB/s 2 10 GB/s 3.3 GB/s 17
20 PB 11 GB/s 3,200 320 GB/s 6 30 GB/s 10 GB/s 23
50 PB 29 GB/s 8,000 800 GB/s 14 70 GB/s 23 GB/s 25

Cost 2012 10%yr Disks Disk BW Racks Bandwidth Actual Days-‐to-‐fill
5 PB 16 MB/s 2,700 200 GB/s 6 30 GB/s 3 GB/s 19
20 PB 63 MB/s 11,000 1.1 TB/s 23 115 GB/s 11 GB/s 20
50 PB 159 MB/s 27,000 2.7 TB/s 56 280 GB/s 28 GB/s 21

Cost 2012 10%yr Disks Disk BW Racks Bandwidth Actual Days-‐to-‐fill
5 PB 16 MB/s 2,700 200 GB/s 6 30 GB/s 3 GB/s 19
20 PB 63 MB/s 11,000 1.1 TB/s 23 115 GB/s 11 GB/s 20
50 PB 159 MB/s 27,000 2.7 TB/s 56 280 GB/s 28 GB/s 21
2012 $/month @ $0.01/GB
5 PB $50,000/month
20 PB $200,000/month
50 PB $500,000/month
Cost if using e.g. “cold” public cloud storage

Cost 2012 10%yr Disks Disk BW Racks Bandwidth Actual Days-‐to-‐fill
5 PB 16 MB/s 2,700 200 GB/s 6 30 GB/s 3 GB/s 19
20 PB 63 MB/s 11,000 1.1 TB/s 23 115 GB/s 11 GB/s 20
50 PB 159 MB/s 27,000 2.7 TB/s 56 280 GB/s 28 GB/s 21
2012 sqN/person $/sqN $/month
20 employees 90 $48 $86,000/month Washington, DC
80 employees 75 $48 $288,000/month Washington, DC
200 employees 75 $24 $360,000/month Minneapolis, MN
2012 $/month @ $0.01/GB
5 PB $50,000/month
20 PB $200,000/month
50 PB $500,000/month
Cost if using e.g. “cold” public cloud storage
For comparison, the cost to “store” 20 librarians or data scienNsts

AssumpNons • Data protecNon in a single data center, using an erasure-‐coding
scheme at 1.6x overhead • 480 drive racks in 2012 (40U) • 600 drive racks in 2015 and 2018 (50+U) • 10%/year access assumes 10% of total data is accessed in even
distribuNon over 365 days/year, 24 hours/day – opNmisNc • 10%/2day access assumes 10% of data is accessed on only 2 days
per year (say Thanksgiving and Xmas) – very bursty • Bandwidth is theoreNcal bandwidth at 40 Gb/s per rack (4x 10 GbE) • Actual bandwidth is 1/10 of theoreNcal maximum for 2012 and
2015; up to 1/3 theoreNcal max for 2018 (sohware improvements) • sqh per person and $/sqh references
hip://www.inc.com/news/arNcles/2010/10/washington-‐dc-‐rents-‐top-‐those-‐in-‐nyc.html hip://newsfeed.Nme.com/2011/02/08/youre-‐not-‐imagining-‐it-‐your-‐cubicle-‐is-‐gekng-‐smaller/
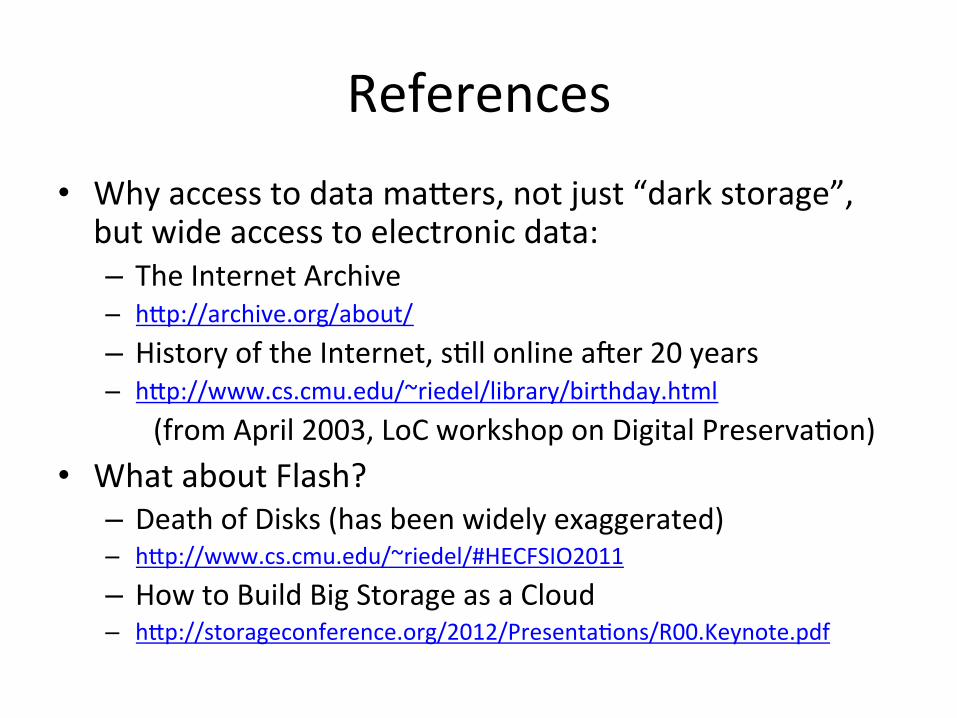
References
• Why access to data maiers, not just “dark storage”, but wide access to electronic data: – The Internet Archive – hip://archive.org/about/ – History of the Internet, sNll online aher 20 years – hip://www.cs.cmu.edu/~riedel/library/birthday.html
(from April 2003, LoC workshop on Digital PreservaNon) • What about Flash?
– Death of Disks (has been widely exaggerated) – hip://www.cs.cmu.edu/~riedel/#HECFSIO2011 – How to Build Big Storage as a Cloud – hip://storageconference.org/2012/PresentaNons/R00.Keynote.pdf

Backup

What About Tape?
pictures by Gill Wildman via flickr/cc

What About Tape? • Tapes are not a commodity technology • 2011 total worldwide market for tape cartridges is about 8m units (just under $1b annual revenue)
• Compare to the HDD business at 650m units in 2010 (close to $40b annual revenue)
• 80 disk drives are manufactured for each tape cartridge; robots are complicated
• Fits parNcular applicaNon segments very well, but is not a general-‐purpose soluNon
hip://www.storagenewsleier.com/news/tapes/sccg-‐ww-‐tape-‐market-‐lto-‐1q11 hip://techreport.com/discussions.x/20890

David Anderson, James Dykes, Erik Riedel “SCSI vs. ATA -‐ More than an interface” 2nd Conference on File and Storage Technology (FAST). San Francisco, CA. April 2003. www.cs.cmu.edu/~riedel/#SCSIvsATA