Embed Size (px)
Citation preview

Harnessing the Power of Network Data

Network Data is the Next Frontier of Supply Chain Innovation
The combination of large, fast-moving, and varied streams of big data and advanced tools and techniques such as geoanalytics represents the next frontier of supply chain innovation.
Making Big Data Work: Supply Chain Management. Boston Consul*ng Group January, 2015
The Supply Chain Officer’s Report SCM World September, 2014

What is Network Data?
• Combination of data from: – Your ERP – Trading partner systems – Network applications – Elemica Logistics or Supply Chain Applications – Plus, outside data feeds

Network Data Addresses >70% Concerns
Weather. Raw material pricing.
Wars.
Carrier availability. Strike.
Demand.
Weather.
Government regula*ons
Track and trace.
First run quality stats.
Impact of ERP upgrade
Emerging markets – supply, currency fluctua*ons
Emerging markets – supply, currency fluctua*ons
80/20 project – 80% of business by 20% of customers.
Transit availability / *mes.
Transport (import, export, domes*cs).
Rail performance.
Truck performance. Food and pharma need a high degree of lot / batch management.
Business process requirements of customers might go beyond what we can support.
Rail performance
Truck performance
Manufacturing scheduling – to forecasts and orders.
Warehousing network performance.
Product stewardships (EHS, app support, providing the right level of technical info).
M&A
Insight into research / experimental products – schedule, setup.
Experimental samples.
Impact of new CRM.
Preproduc*on trials – not in SAP; manual.
Where are we headed?
How real is demand.
What is the future.
Strategic direc*on of the company.
Serializa*on requirements.
Forecasts.
Source 2015 Elemica Focus Group
Batch xyz has an issue. Show me the serial numbers and where each is: in-‐transit, on-‐
shelf, or sold. Will my carrier’s performance for lane xyz be worse or beaer than expected based on all known data.
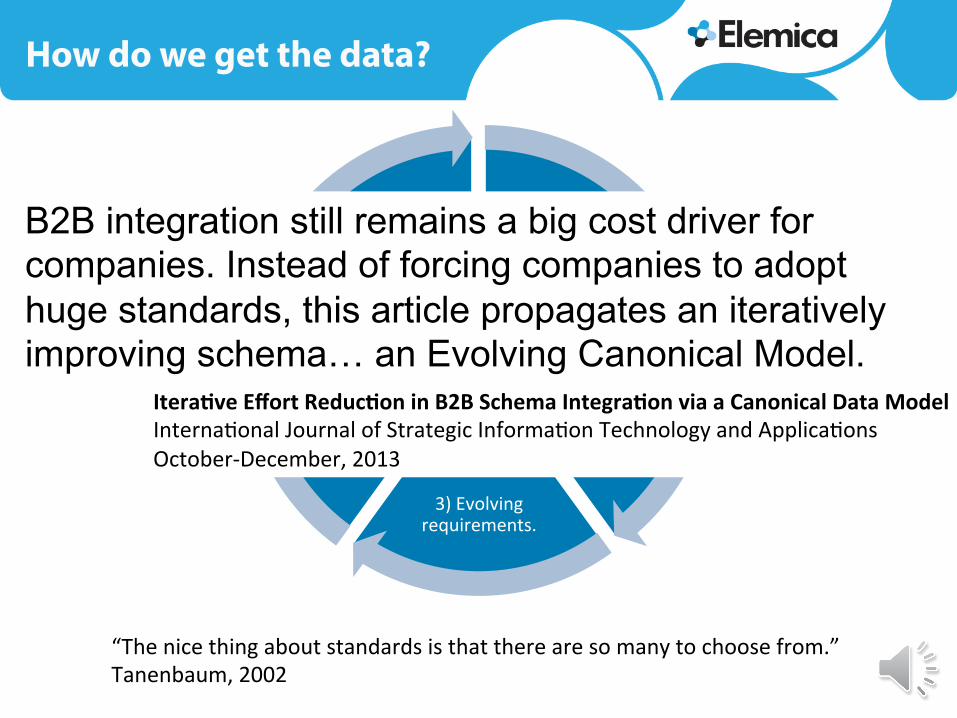
How do we get the data?
1) Companies send their standard.
2) Different iden*fier values.
3) Evolving requirements.
4) Desire to interpret non-‐structured
data
5) Non-‐standard use of
standards.
“The nice thing about standards is that there are so many to choose from.” Tanenbaum, 2002
B2B integration still remains a big cost driver for companies. Instead of forcing companies to adopt huge standards, this article propagates an iteratively improving schema… an Evolving Canonical Model.
IteraHve Effort ReducHon in B2B Schema IntegraHon via a Canonical Data Model Interna*onal Journal of Strategic Informa*on Technology and Applica*ons October-‐December, 2013

Elemica Evolving Canonical Model
Model real-‐world supply chains • Serializa*on. Track. Trace. • Complex packaging
Shared data model • Across messages and applica*on.
Lifecycle management • Backward compa*bility. • Evolve by partner. Mapping efficiency.
“…omen a company’s data defini*ons are inconsistent… this reduces value. ”
Addressing this was a priority for Elemica when developing our
canonicals.
How to Avoid the Big Bad Data Trap Boston Consul*ng Group June, 19, 2015

Business Process Areas Supported on 2.0
Finance Invoice…
LogisHcs Shipment Status…
Order Management
Orders…
Quality COA…
SerializaHon Serial# Hierarchy…
Supply Chain Forecast…

Example of New 2.0 Functions
“The farmer’s ability to locate a precise position in a field allows for.... optimal application of seeds, fertilizer, herbicides… A “pedigree” of each seed or plant…that shows exactly what chemical (and even batch) that was applied to each plant… communicated through the supply chain operating network across all steps in the food and beverage value chain.” Internet-‐Based Technology Redefines F&B Supply Chain Opera=ons
Food Logistics Magazine August 14, 2015
• Consumer specification of batch numbers and expirations – For example, scarce supply of perishable materials – Serial numbers, batch numbers, expiration dates, temperature – Request specified characteristics in an order
• Stronger support for packaged goods – For example, multi-customer pallet with multiple drop-offs – Multiple pallets of packaged products supported – Multiple serialized labels per packaging layer
• Geo-spatial coordinates – Latitude, longitude, elevation, depth
• Strong, consistent data model to support analytics across all

Some Statistics
30 Message Canonicals
• Invoice • Shipment Instruc*ons
• Order Crea*on • Cer*ficate of Analysis
• Serializa*on Hierarchy
• Etc.
56 Major Structures
• Date Time • Partners • Packaging structure
• Test Specs • etc.
52 Type Lists
• HazMat Type • Partner ID Type • PO Type • Etc.
139 Unique Data Fields
• La*tude • Payment Ac*on Code
• Product Iden*fier
• Seal Number • etc.