Embed Size (px)
Citation preview

Gnocchi Numbers
Benchmarking 2.1.x
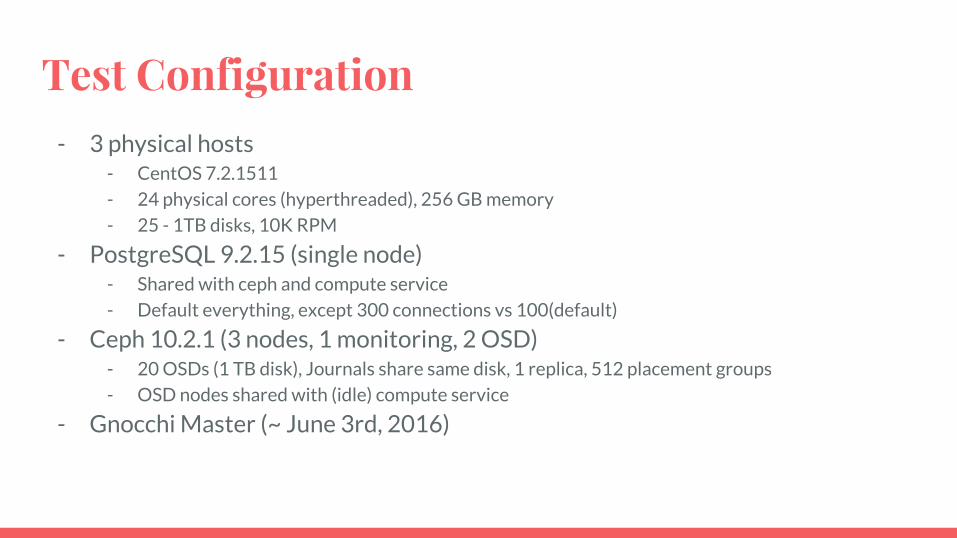
Test Configuration- 3 physical hosts
- CentOS 7.2.1511
- 24 physical cores (hyperthreaded), 256 GB memory
- 25 - 1TB disks, 10K RPM
- PostgreSQL 9.2.15 (single node)- Shared with ceph and compute service
- Default everything, except 300 connections vs 100(default)
- Ceph 10.2.1 (3 nodes, 1 monitoring, 2 OSD)- 20 OSDs (1 TB disk), Journals share same disk, 1 replica, 512 placement groups
- OSD nodes shared with (idle) compute service
- Gnocchi Master (~ June 3rd, 2016)

Host Configurations- Host1
- OpenStack Controller Node (Ceilometer, Heat, Nova-stuff, Neutron, Cinder, Glance, Horizon)
- Ceph Monitoring service
- Host2- OpenStack Compute Node
- Ceph OSD node (10 OSDs)
- Host3- OpenStack Compute Node
- Ceph OSD node (10 OSDs)
- Gnocchi API+PostgreSQL
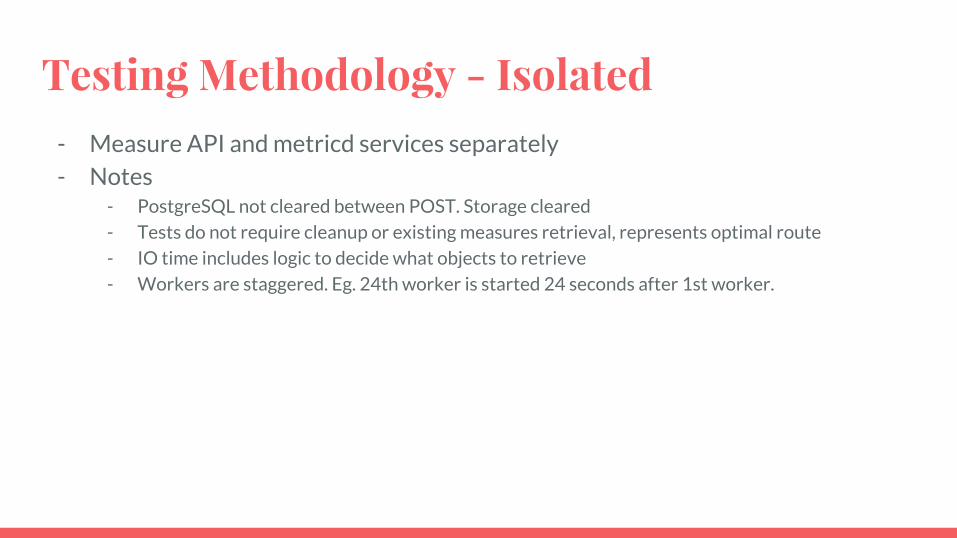
Testing Methodology - Isolated- Measure API and metricd services separately- Notes
- PostgreSQL not cleared between POST. Storage cleared
- Tests do not require cleanup or existing measures retrieval, represents optimal route
- IO time includes logic to decide what objects to retrieve
- Workers are staggered. Eg. 24th worker is started 24 seconds after 1st worker.

api tests

API Configuration- Single uWSGI service
- 32 processes, 1 thread
- Performance is (significantly) worse with threads enabled
- Much easier to manage than httpd
- No authentication enabled- Everything else is default- POST ~1000 generic resources spread across 16 workers, 20 metrics each.
- 12 hr worth of data, 1 minute granularity, 720 points/metric
- 20 160 metrics, medium archive policy
- 1 min for a day, 1 hr for a week, 1 day for a year, 8 aggregates each

API Profile (uwsgi)
- 4 CPU node- 16 workers posting data
- ~1000 resources
- 20 metrics each
- 1 minute granularity
- 720 points/metric
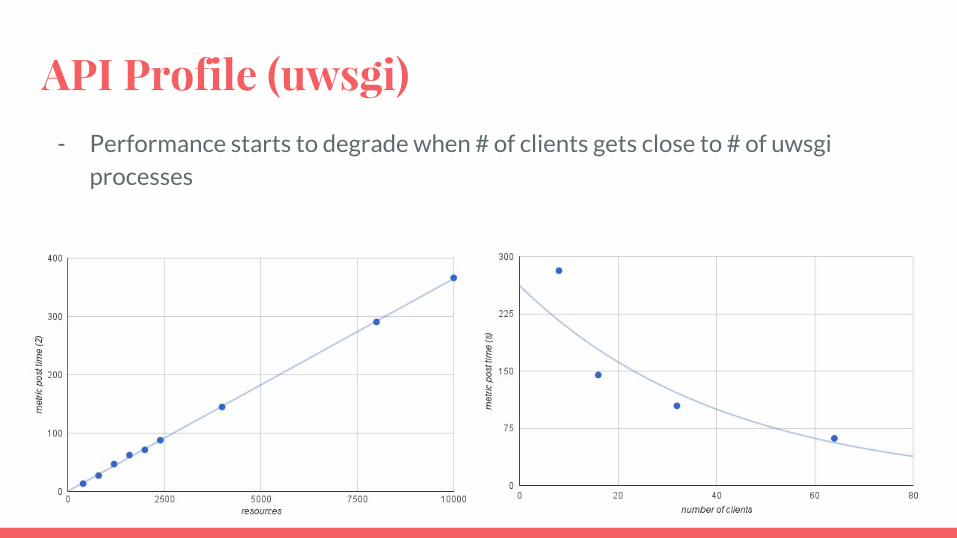
API Profile (uwsgi)- Performance starts to degrade when # of clients gets close to # of uwsgi
processes

metricd tests

metricd Configuration- 1 to 3 metricd daemons
- Deployed on separate physical nodes
- 24 workers each with 1 aggregation worker
- Redis 3.0.6 to manage coordination- metric_processing_delay set to 1 (essentially no delay)- Everything else is default- Gnocchi pool is always empty to begin- Working against 1000 resources in backlog, start 1|2|3 metricd services
- Analyze results from 5 of 24 workers.
Single MetricD service (ceph)- Deployed on host1- Injection time (time to process measures in backlog) - ~ 633 seconds- Per metric injection - avg=0.69s, min=0.49s, max=2.08, stdev=0.16- Average IO time - ~30% of _add_measures()- Overhead - ~5.5%
- job/data retrievals, building/storing backlog timeseries, no ops, etc…
- Time from first read to last write vs time spent in _add_measures()
- Overhead looping through each granularity/aggregate - ~2.6%- Time difference between all _add_measures() time vs mapping function

Job Distribution (1 daemon)

Processing speed (1 daemon)

Ceph Profile (1 daemon)

Ceph Profile (1 daemon)- Read speed
- avg = 4049 kB/s, max = 8123 kB/s, stdev = 1599.27
- Write speed- avg = 1201 kB/s, max = 2240 kB/s, stdev = 442.14
- Operations- avg = 3441 op/s, max = 6706 op/s, stdev = 1314.43

2 MetricD services (ceph)- Deployed on host1 and host2- Injection time - ~ 358 seconds- Per metric injection - avg=0.768s, min=0.44s, max=3.35s, stdev=0.239- Average IO time - ~36.8% of _add_measures()
- ~34.3% on controller node service
- Overhead - ~6.5%- Overhead looping through each granularity/aggregate - ~2.5%

Job Distribution (2 daemons)

Processing speed (2 daemons)

Ceph Profile (2 daemons)
Ceph Profile (2 daemons)- Read speed
- avg = 7335 kB/s, max = 16968 kB/s, stdev = 3227.60
- Write speed- avg = 2108 kB/s, max = 4232 kB/s, stdev = 937.75
- Operations- avg = 6098 op/s, max = 12835 op/s, stdev = 2698.31

3 MetricD services (ceph)- Deployed on host1, host2, host3- Injection time - ~ 274 seconds- Per metric injection - avg=0.85s, min=0.44s, max=2.78s, stdev=0.29- Average IO time - ~42.2% of _add_measures()
- ~38.5% on host1
- Overhead - ~8.3%- Overhead looping through each granularity/aggregate - ~2.2%
- Time difference between all _add_measures() time vs mapping function

Job Distribution (3 daemons)
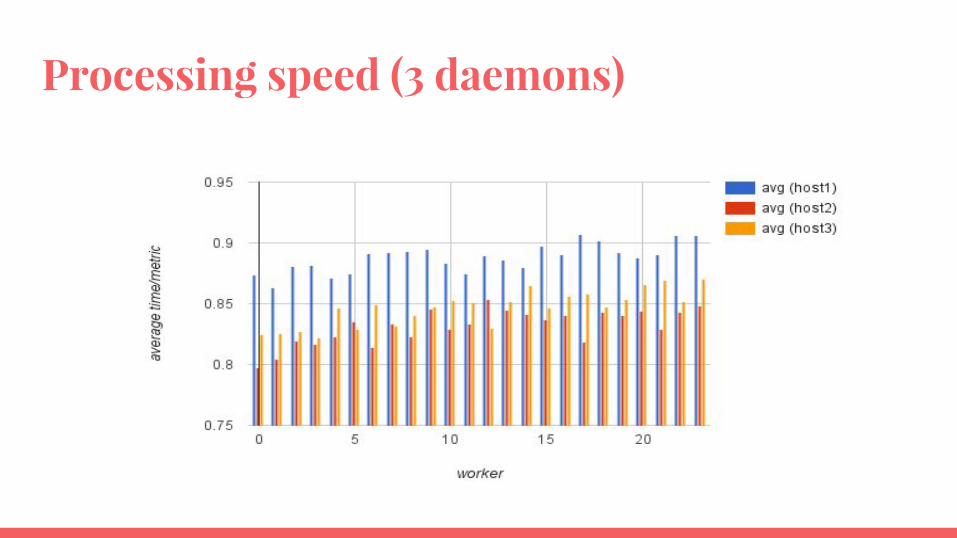
Processing speed (3 daemons)

Ceph Profile (3 daemons)

Ceph Profile (3 daemons)- Read speed
- avg = 9841 kB/s, max = 22373 kB/s, stdev = 4577.64
- Write speed- avg = 2735 kB/s, max = 5370 kB/s, stdev = 1162.23
- Operations- avg = 8000 op/s, max = 15935 op/s, stdev = 3518.21

Ceph Load Profile

Processing Time per Metric (host1)

‘real world’ testsapi + metricd together

Testing Methodology- Start 3 metricd services - 24 workers each- POST 1000 generic resources spread across 20 workers, 20 metrics each.
- POST Every 10 minutes
- 1 minute granularity, 10 points/metric/request
- 20 160 metrics, medium archive policy
- 1 min for a day, 1 hr for a week, 1 day for a year, 8 aggregates each

Batch1 metricd details- POST time - avg=31.31s, stdev=0.61- Injection time - ~ 197 seconds- Host1
- Per metric injection - avg=0.599s, min=0.236s, max=4.418s, stdev=0.359
- Average IO time - ~67.8% of _add_measures()
- Overhead - ~17.3% (~15.8% minus all IO once metric locked)
- Host2- Per metric injection - avg=0.587s, min=0.252s, max=4.454s, stdev=0.352
- Average IO time - ~67.4% of _add_measures()
- Overhead - ~15.4% (~14% minus all IO once metric locked)
- Host3- Per metric injection - avg=0.602s, min=0.233s, max=4.484s, stdev=0.359
- Average IO time - ~67.7% of _add_measures()
- Overhead - ~15.2% (~13.8% minus all IO once metric locked)

Batch2 metricd details- POST time - avg=101.08s, stdev=5.51- Injection time - ~ 559 seconds- Host1
- Per metric injection - avg=1.69s, min=0.286s, max=8.47s, stdev=1.17
- Average IO time - ~78.3% of _add_measures()
- Overhead - ~16% (~13.6% minus all IO once metric locked)
- Host2- Per metric injection - avg=1.69s, min=0.307s, max=8.37s, stdev=1.18
- Average IO time - ~77.7% of _add_measures()
- Overhead - ~16% (~13.7% minus all IO once metric locked)
- Host3- Per metric injection - avg=1.69s, min=0.279s, max=9.71s, stdev=1.17
- Average IO time - ~78.8% of _add_measures()
- Overhead - ~16.3% (~13.9% minus all IO once metric locked)
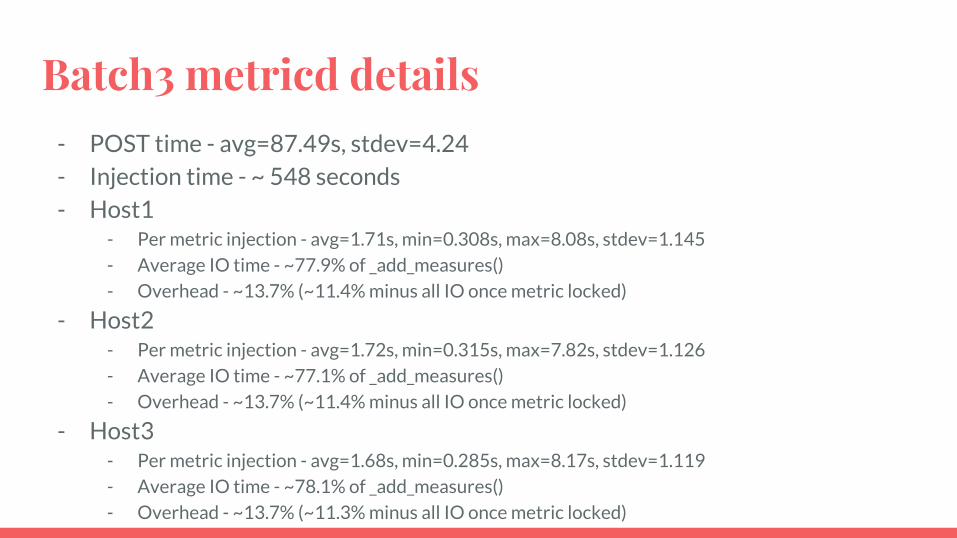
Batch3 metricd details- POST time - avg=87.49s, stdev=4.24- Injection time - ~ 548 seconds- Host1
- Per metric injection - avg=1.71s, min=0.308s, max=8.08s, stdev=1.145
- Average IO time - ~77.9% of _add_measures()
- Overhead - ~13.7% (~11.4% minus all IO once metric locked)
- Host2- Per metric injection - avg=1.72s, min=0.315s, max=7.82s, stdev=1.126
- Average IO time - ~77.1% of _add_measures()
- Overhead - ~13.7% (~11.4% minus all IO once metric locked)
- Host3- Per metric injection - avg=1.68s, min=0.285s, max=8.17s, stdev=1.119
- Average IO time - ~78.1% of _add_measures()
- Overhead - ~13.7% (~11.3% minus all IO once metric locked)

Job Distribution

Job Contentions Cost- Unscientific study - post 9000 metrics, enable 1 metricd agent, 24 workers
- With existing partitioning enabled - 3125 contentions
- With existing partitioning disabled - 38851 contentions
- Time difference - ~60s quicker with partitioning enabled.- ~1.6ms lost per contention- Disclaimer: did not factor in deviation in jobs
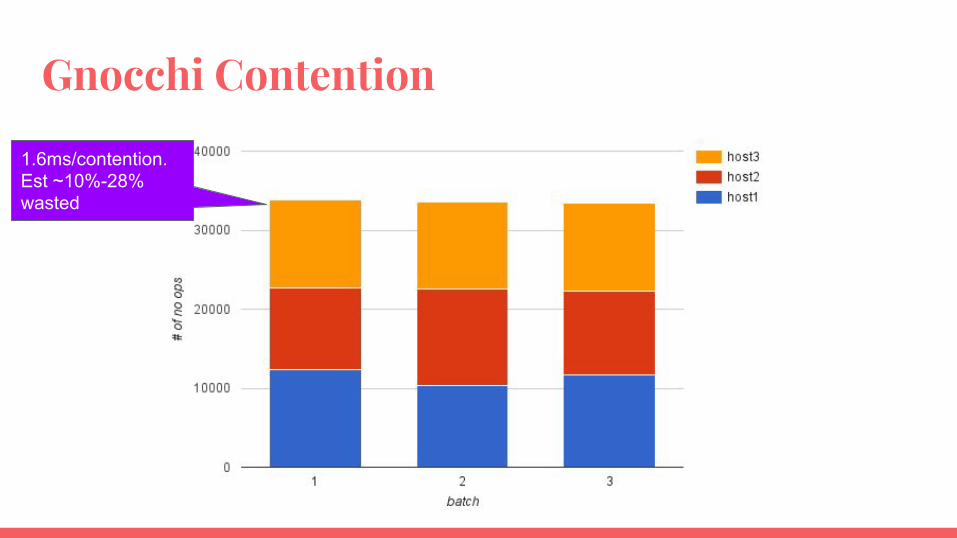
Gnocchi Contention
1.6ms/contention.Est ~10%-28% wasted

Gnocchi Contention

Metric Processing

Ceph Profile

Ceph Profile- Read speed
- avg = 5087 kB/s,
- max = 19212 kB/s
- stdev = 2484.30
- Write speed- avg = 1148 kB/s
- max = 4452 kB/s
- stdev = 763.44
- Operations- avg = 6149 op/s
- max = 19518 op/s
- stdev = 2979.53

Things to investigate...- Why does Ceph op/s and IO performance oscillate- Why is the initial write so much faster than subsequent writes- Measures the effects of a LARGE backlog- IO jumps nearly 3x after first batch, but Gnocchi update & resampling of
timeseries jumps up ~2x even though it should just have to aggregate the same number of points as first.
- Officially show gnocchi/python is slower with threads (even with high IO)

Up next...- 4 node test + more
- 3 dedicated OSD nodes,
- SSD Journals
- Ceph 10.2.2
- Minimising Ceph IO - Testing distributed temp storage- Minimise contentions as well
- Distributing across agents (in addition to current distribution across workers)

thanks gord[at]live.ca
irc: gordc