Embed Size (px)
Citation preview
1 / 15 �
Jeff Head; John Kinyanjui, Ph.D.; Mark Talbott, Ph.D. Division of Molecular Spectroscopy Shimadzu Scientific Instruments, Columbia, Md., USA ��
FTIR-ATR Characterization of Commercial Honey Samples and Their Adulteration with Sugar Syrups Using Chemometric Analysis

2 / 15 �2 / 15 �
Abstract
Honey is a valuable food commodity that gains a lot of attention due to its potential health benefits and usage to sweeten foods and beverages. To save on manufacturing costs, honey is susceptible to deliberate adulteration with sugar syrups such as corn syrup. Honey adulteration does not pose significant health problems, but it negatively influences market growth and consumer confidence. Fourier transform infrared spectroscopy (FTIR) with attenuated total reflectance (ATR) was used to collect absorption spectra of various commercial honey samples. Partial-least squares (PLS) was used to process FTIR spectra to determine the potential adulteration of honey samples. The techniques presented in this work provide and alternative to determine the purity and authenticity of foods, such as honey and other natural products.
3 / 15 �3 / 15 �
Introduction
Pure Honey contains multiple types of sugars primarily composed of fructose, glucose and sucrose.
Reported ratio of fructose:glucose for pure honey is 1.2:1. Elevations in glucose levels may suggest the presence of added sugars such as corn syrup, commonly referred to “glucose syrup”. Relative percentages of each sugar:
l Fructose: 33-43% l Glucose: 25-35% l Sucrose: 0-2%
It is expected that honey adulterated with cheaper alternatives such as corn syrup will show elevated levels of glucose.
4 / 15 �4 / 15 �
Method
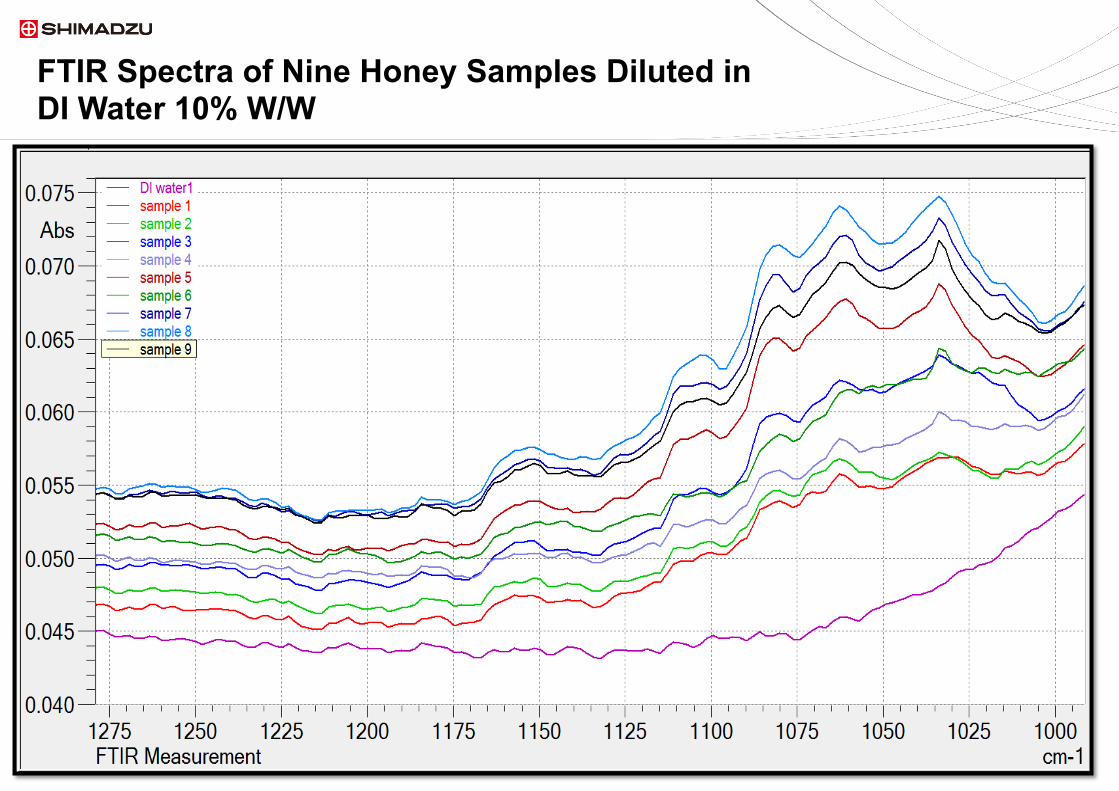
Nine separate commercial honey samples were obtained and diluted 10% w/w in deionized water.
Absorbance spectra was collected on the Shimadzu IRTracer-100 with ZnSe Quest ATR from Specac.
Using chemometric analysis, sugar content was estimated for fructose, glucose and sucrose for each of the samples.

5 / 15 �5 / 15 �
Characterization of Commercial Honey
6 / 15 �6 / 15 �
FTIR Spectra of 50% Aqueous Sucrose, Fructose, Glucose, Corn Syrup and Honey
Sucrose Fructose Glucose Corn Syrup Honey DI Water

7 / 15 �7 / 15 �
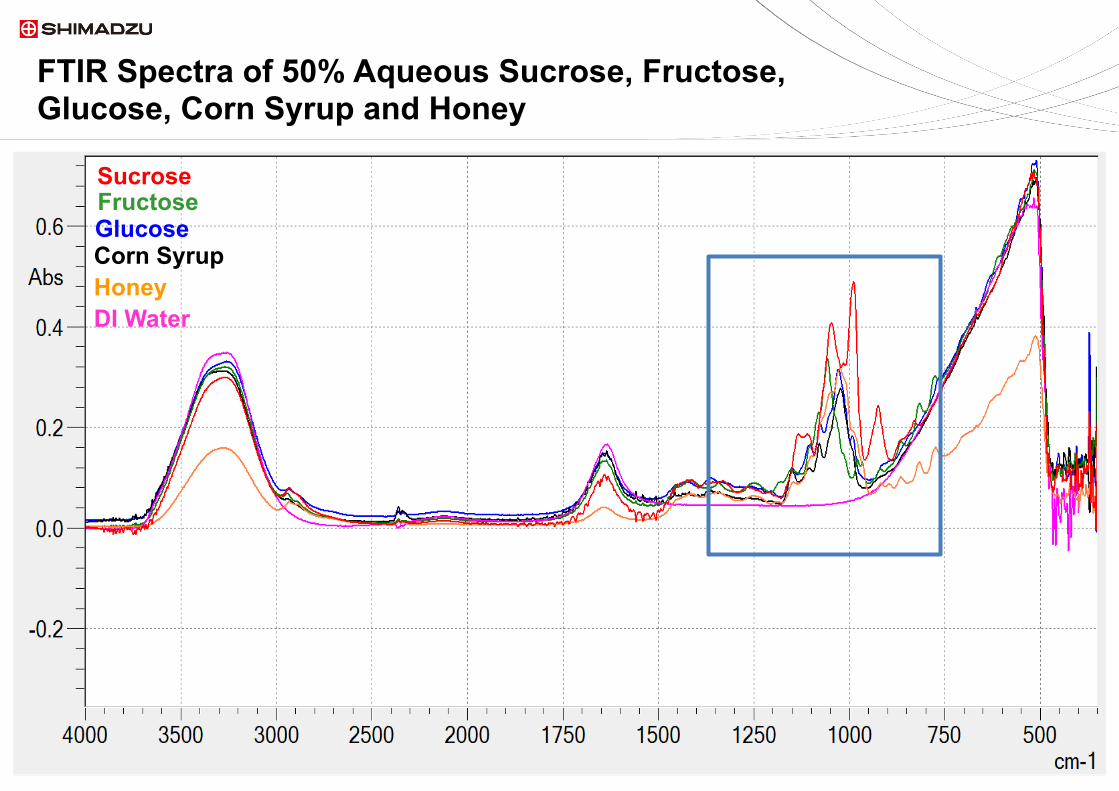
FTIR Spectra of 50% Aqueous Sucrose, Fructose, Glucose, Corn Syrup and Honey
Sucrose
Fructose
Glucose Corn Syrup
Honey
cm-1
DI Water
1,250 1,000
8 / 15 �8 / 15 �
FTIR Spectra of Nine Honey Samples Diluted in DI Water 10% W/W

9 / 15 �9 / 15 �
Chemometric Analysis
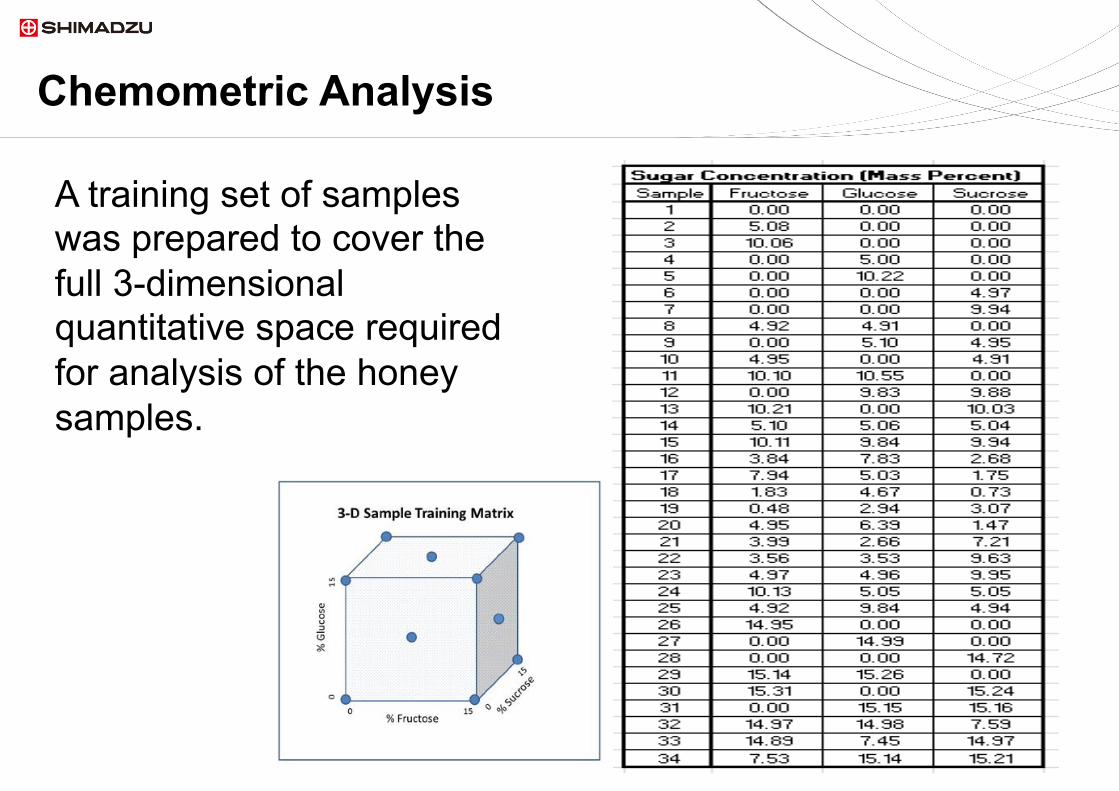
l Chemometric factor-space analysis was utilized to establish simultaneous calibration curves for the three sugar aqueous mixtures.
l Partial Least Squares (PLS) was selected as the factor-space routine of choice.
l Amounts of fructose, glucose and sucrose were estimated.
10 / 15 �10 / 15 �
A training set of samples was prepared to cover the full 3-dimensional quantitative space required for analysis of the honey samples.
Chemometric Analysis

11 / 15 �11 / 15 �
PLS Calibration Report

12 / 15 �12 / 15 �
Calibration Results for Nine Separate Honey Samples
Sample Claim Fructose Glucose Sucrose Fructose:Glucose
1 100% Pure Honey 0.081 0.242 0.00 0.33
2 100% Pure Honey 0.119 0.180 0.00 0.66
3 100% Pure Honey 0.186 0.367 0.00 0.51
4 Pure Clover Honey 0.031 0.236 0.00 0.13
5 100% Pure Honey 0.279 0.404 0.00 0.69
6 Made with 7% Honey 0.00 0.299 0.089 0.00
7 N/A 0.462 0.428 0.00 1.08
8 N/A 0.536 0.464 0.00 1.16
9 Grade A 0.379 0.363 0.000 1.04
13 / 15 �13 / 15 �
Conclusions
Based on the obtained results, the honey samples which claim to be 100% pure honey (samples 1-5) actually show elevated levels of glucose. This may suggest that these samples potentially could contain other adulterants such as corn syrup, commonly known as “glucose syrup”.
Sample 6, labeled to contain 7% real honey, exhibited a large concentration of sucrose, which may suggest the use of sugar water in the preparation of that product.
FTIR-ATR analysis is an ideal technique for the quick screening of honey samples for adulteration.
14 / 15 �14 / 15 �
References
l Clifford, R.I., Head, J., Kinyanjui, J., & Talbott, M. (2014, January). Quantification of Natural Sugars in Baby Food Products by MID FTIR Spectroscopy. Application News No. FTIR-1401.
l Jagdish, T., & Irudayaraj, J. (2004, June). Quantification of saccharides in multiple
floral honeys using Fourier transform infrared microattenuated total reflectance spectroscopy. J. Agric Food Chem, 52(11), 3237-43.
l Tucker, M., Nguyen, Q., & Eddy, F. (2001). Fourier Transform Infrared Quantitative
Analysis of Sugars and Lignin in Pretreated Softwood Solid Residues. Applied Biochemistry and Biotechnology, 91-93, 51-61.
l Cadet, F., & Offmann, B. (1997). Direct Spectroscopic Sucrose Determination of
Raw Sugar Cane Juices. J. Agric. Food Chem., 45, 166-171. l Kramer, R. (1998). Chemometric Techniques for Quantitative Analysis. New York,
NY: Marcel Dekker Inc.
15 / 15 �
Thank you for viewing this presentation. Should you have any questions or require additional information about our research, products or services, please visit our support page: www.ssi.shimadzu.com/support/
@shimadzussi
Follow us on Twitter
Need More Info?