Embed Size (px)
Citation preview
Is the Indian Automation and Process Control Industry on the Verge of Rapid Growth?
Srivatsan Murali,Research Analyst
Economics Research and AnalyticsSeptember 11, 2008
2
Focus Points
2. Political Overview
1. Industry Segmentation
4. Manufacturing Overview
Metals and Mining
Power, Oil and Gas
5. End User Analysis
Automobiles
Chemicals, Pharmaceuticals and Food Processing
6. Growth Opportunities
3. Economic Overview
3
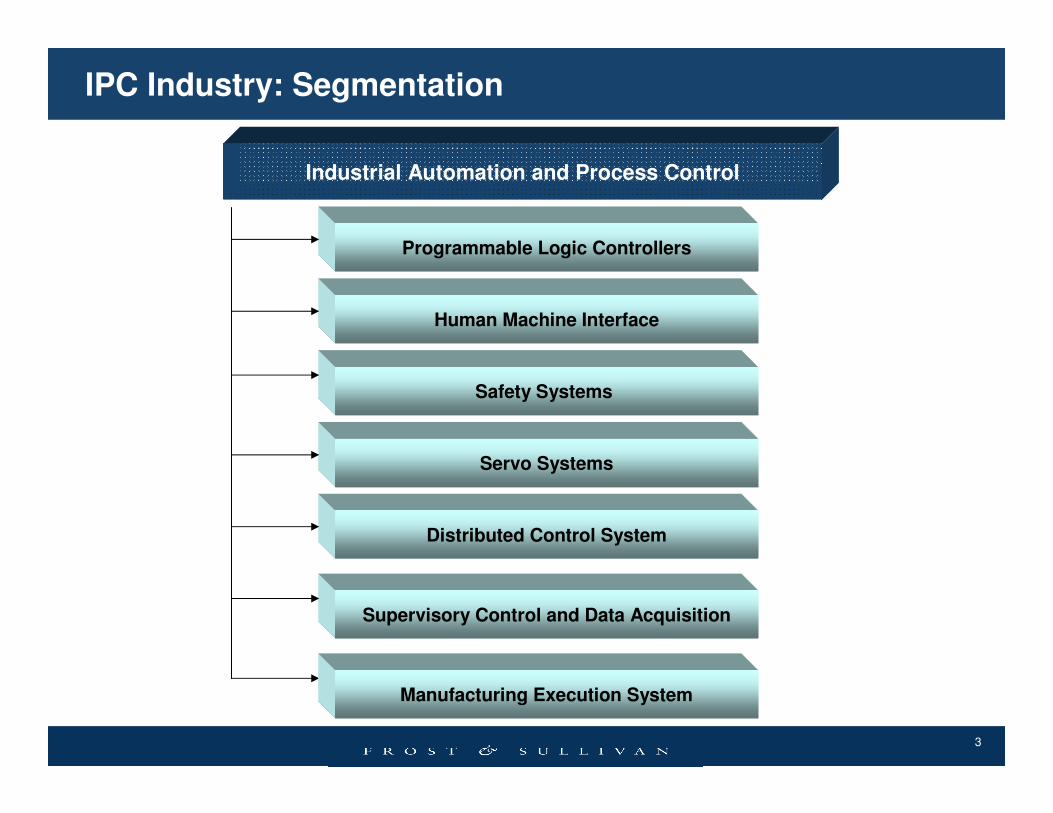
IPC Industry: Segmentation
Industrial Automation and Process Control
Programmable Logic Controllers
Human Machine Interface
Safety Systems
Servo Systems
Distributed Control System
Manufacturing Execution System
Supervisory Control and Data Acquisition

4
Political Overview
Composition of the Parliament (2008)
Elections 2009
� Hung Assembly � Emergence of BSP on the national stage� Coalition Government: Holding up reforms, � Slowdown in growth� Unlikely to see progress on key reform area of
labor laws.
Key Areas for Governance
� Currently infrastructure requires $ 300 Billion
� Investment reforms� Reforming labor laws � Pension reforms� Banking reforms� Reign in inflation
Current Situation
� Prospect of reforms being passed because left not in government.
� Political uncertainty and current coalition holding up key reforms essential for growth.
� Government adopting socialist policy with a view towards elections.
� Interest groups pressurizing government.
Source: Frost & Sullivan
Left Front
NDA
Others
UPA Plus
Allies
•UPA: United Progressive Alliance
•NDA: National Democratic Alliance
•Others: BSP, TDP and Independents
5
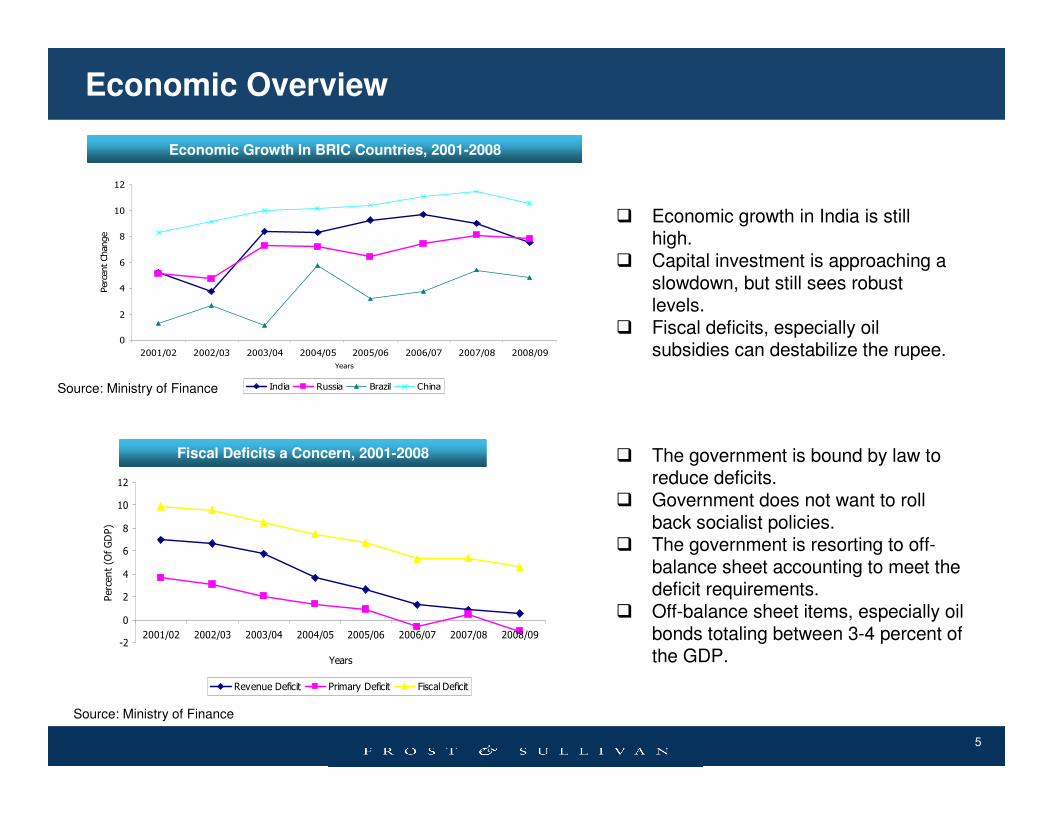
Economic Overview
� Economic growth in India is still high.
� Capital investment is approaching a slowdown, but still sees robust levels.
� Fiscal deficits, especially oil subsidies can destabilize the rupee.
Fiscal Deficits a Concern, 2001-2008
Economic Growth In BRIC Countries, 2001-2008
0
2
4
6
8
10
12
2001/02 2002/03 2003/04 2004/05 2005/06 2006/07 2007/08 2008/09
Years
Perc
en
t C
han
ge
India Russia Brazil China
-2
0
2
4
6
8
10
12
2001/02 2002/03 2003/04 2004/05 2005/06 2006/07 2007/08 2008/09
Years
Pe
rce
nt
(Of
GD
P)
Revenue Deficit Primary Deficit Fiscal Deficit
Source: Ministry of Finance
Source: Ministry of Finance
� The government is bound by law to reduce deficits.
� Government does not want to roll back socialist policies.
� The government is resorting to off-balance sheet accounting to meet the deficit requirements.
� Off-balance sheet items, especially oil bonds totaling between 3-4 percent of the GDP.
6
0
2
4
6
8
10
12
14
5/1/2008 2/2/2008 1/3/2008 29/03/2008 26/04/2008 24/05/2008 21/06/2008 19/07/2008
Percent
Inflation CRR Repo Rate
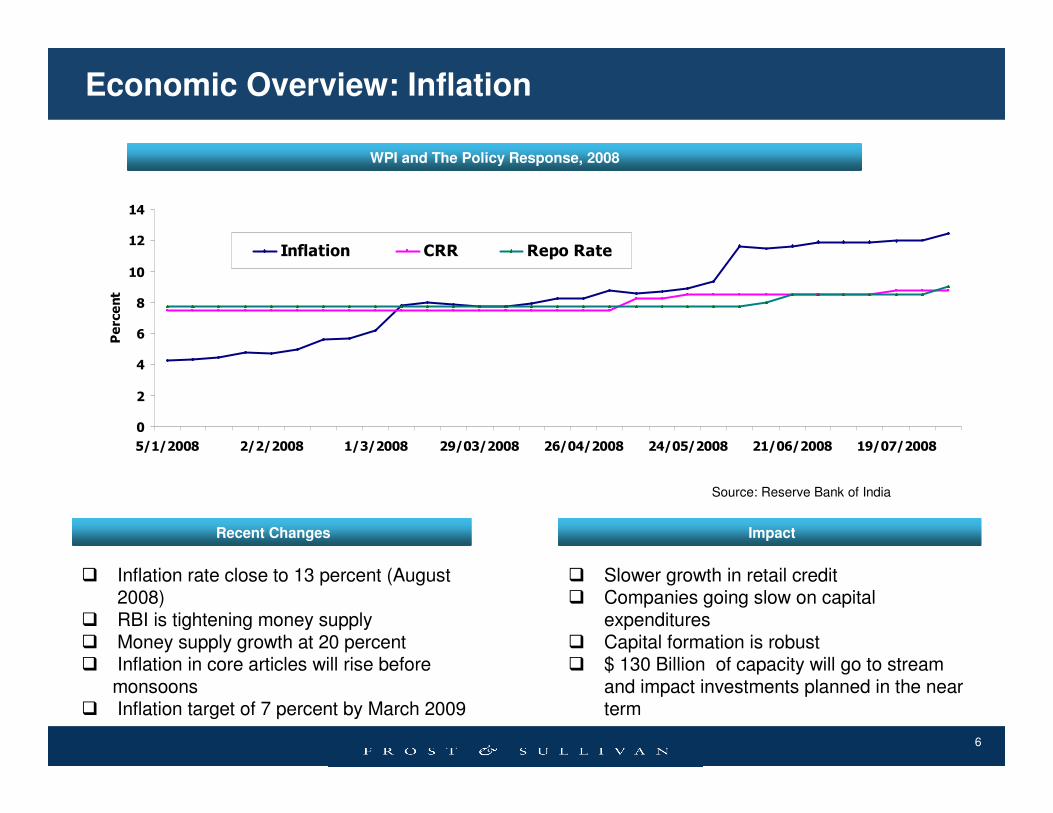
Economic Overview: Inflation
WPI and The Policy Response, 2008
� Inflation rate close to 13 percent (August 2008)
� RBI is tightening money supply� Money supply growth at 20 percent� Inflation in core articles will rise before
monsoons� Inflation target of 7 percent by March 2009
� Slower growth in retail credit � Companies going slow on capital
expenditures� Capital formation is robust� $ 130 Billion of capacity will go to stream
and impact investments planned in the near term
Impact
Source: Reserve Bank of India
Recent Changes
7
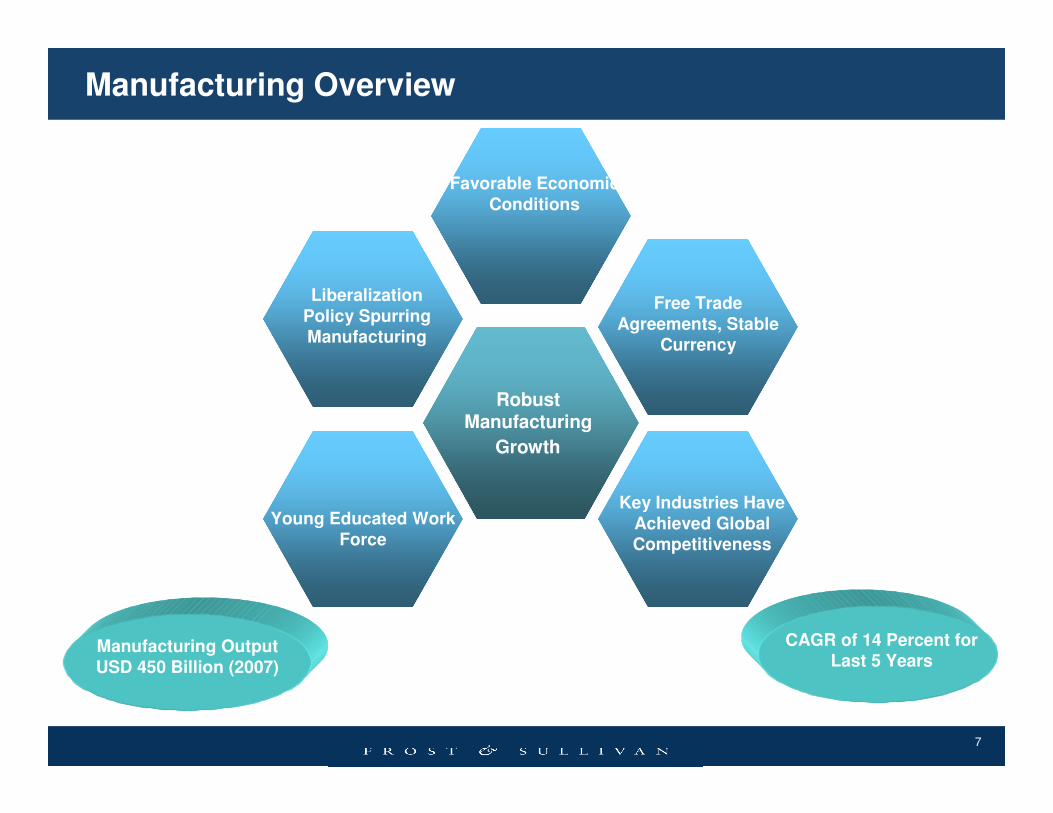
Manufacturing Overview
Liberalization
Policy Spurring Manufacturing
Favorable Economic
Conditions
Free Trade
Agreements, Stable Currency
Key Industries Have
Achieved Global Competitiveness
Young Educated Work
Force
Rapid Expansion in Manufacturing. High Growth anticipated
Manufacturing Output
USD 450 Billion (2007)
CAGR of 14 Percent for Last 5 Years
Robust Manufacturing
Growth
8
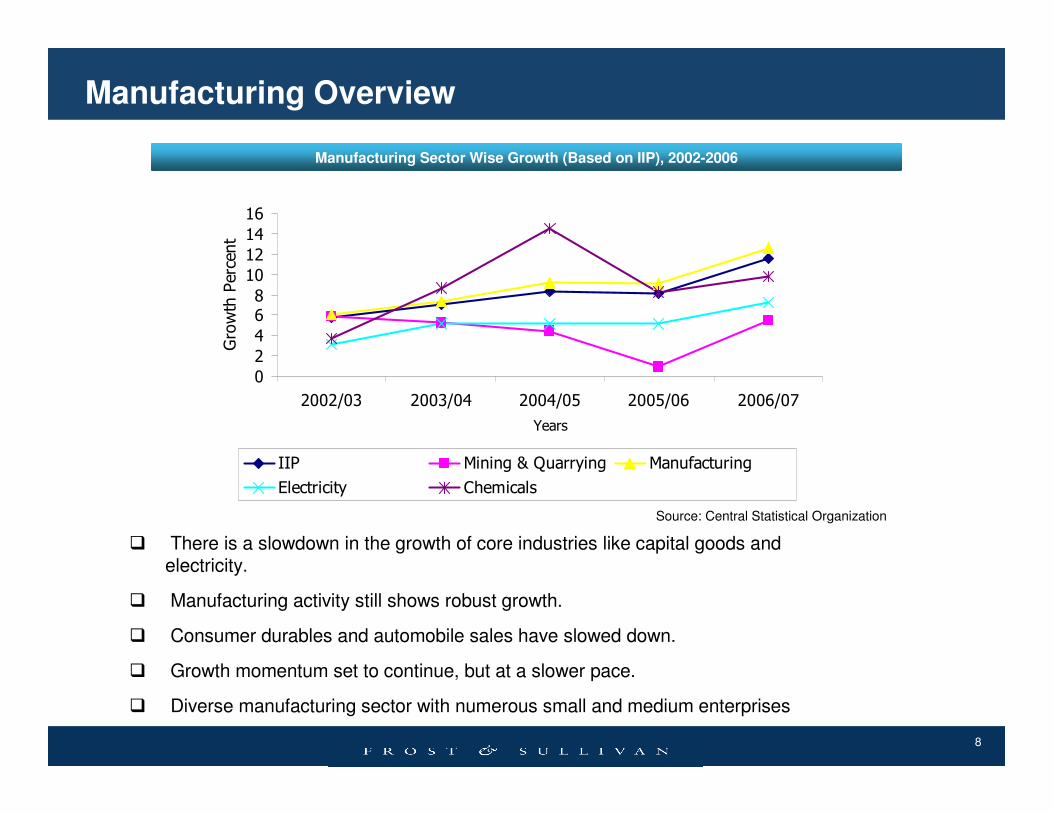
Manufacturing Overview
� There is a slowdown in the growth of core industries like capital goods and electricity.
� Manufacturing activity still shows robust growth.
� Consumer durables and automobile sales have slowed down.
� Growth momentum set to continue, but at a slower pace.
� Diverse manufacturing sector with numerous small and medium enterprises
Manufacturing Sector Wise Growth (Based on IIP), 2002-2006
0
2
4
68
10
12
14
16
2002/03 2003/04 2004/05 2005/06 2006/07
Years
Gro
wth
Pe
rce
nt
IIP Mining & Quarrying Manufacturing
Electricity Chemicals
Source: Central Statistical Organization

9
Manufacturing Investment
Investment, 2000-2008
Source: Ministry of Finance
-40
-20
0
20
40
60
80
100
120
2000/01 2001/02 2002/03 2003/04 2004/05 2005/06 2006/07 2007/08 2008/09
Percent
Gross Domestic Capital Formation Private Capital Formation
� Investment has been volatile to interest rates.
� Private investment has been the engine of capital formation in the country.
� Capital expenditure by listed firms showed a 40 percent increase last year.
� Capital expenditure is anticipated to drop by 30 percent in the year 2009.
� This slowdown is on the account of increasing cost of capital and global liquidity conditions.
� Liberalized mining law key stimulus for automation end-users.
10
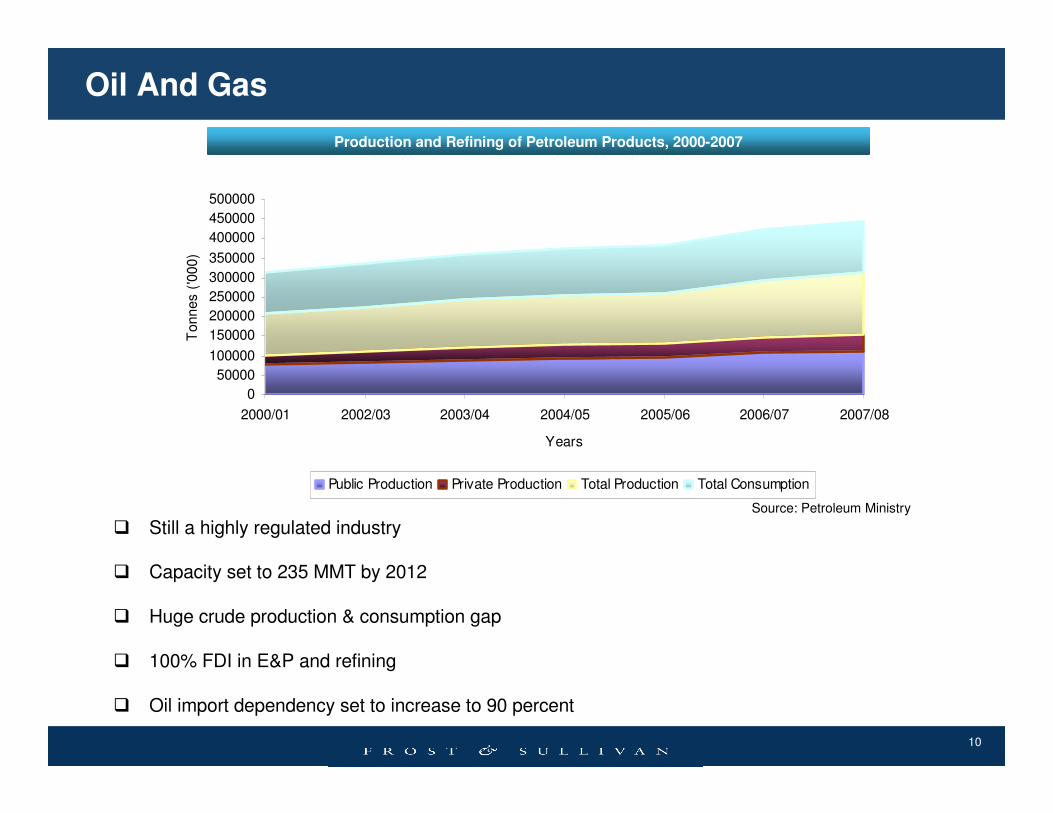
Oil And Gas
� Still a highly regulated industry
� Capacity set to 235 MMT by 2012
� Huge crude production & consumption gap
� 100% FDI in E&P and refining
� Oil import dependency set to increase to 90 percent
Production and Refining of Petroleum Products, 2000-2007
0
50000
100000
150000
200000
250000
300000
350000
400000
450000
500000
2000/01 2002/03 2003/04 2004/05 2005/06 2006/07 2007/08
Years
Tonn
es (
'000
)
Public Production Private Production Total Production Total Consumption
Source: Petroleum Ministry

11
Oil And Gas
� Demand supply gap in gas set to rise to 154.9 MMSCMD in 2011 and to 221.0 & MMSCMD in 2025
� 100% FDI in exploration and production
� Huge demand for gas from captive power plants
� Pricing issue for gas still remains to be sorted out
� The development of a national grid creates huge investment opportunity.
Natural Gas Snapshot,2002-2007
0
500
1000
1500
2002 2003 2004 2005 2006 2007
Years
Qu
an
tity
(B
illio
n
Cu
bic
Me
ters
)
Onshore (Reserves) Offshore (reserves)
Total (Reserves) Total Production
Total Consumption
Source: Petroleum Ministry
12
Oil and Gas: Ethanol
0
2
4
6
8
10
12
2002-03 2003-04 2004-05 2005-06 2006-07
Year
Mo
lass
es
Pro
du
ctio
n
(M
illio
n L
trs)
0
500
1000
1500
2000
2500
Alc
oh
ol
Pro
du
ctio
n
(M
illio
n L
trs)
Molasses Prod. Production of Alcohol
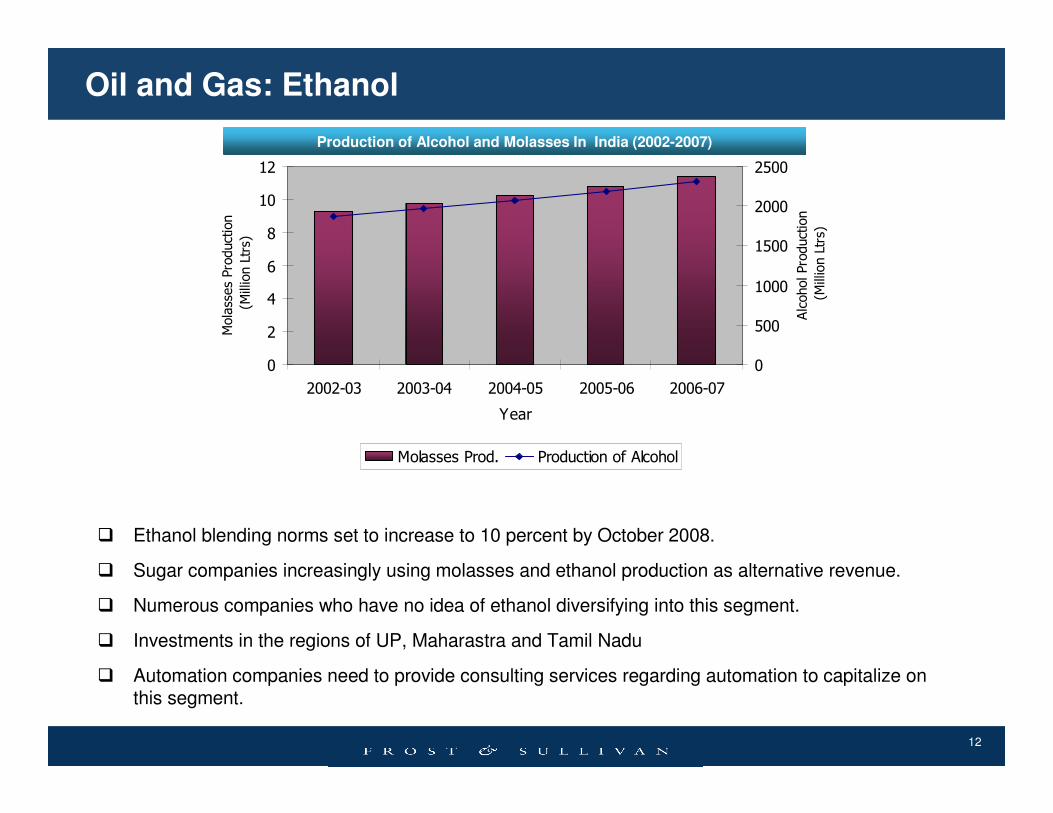
Production of Alcohol and Molasses In India (2002-2007)
� Ethanol blending norms set to increase to 10 percent by October 2008.
� Sugar companies increasingly using molasses and ethanol production as alternative revenue.
� Numerous companies who have no idea of ethanol diversifying into this segment.
� Investments in the regions of UP, Maharastra and Tamil Nadu
� Automation companies need to provide consulting services regarding automation to capitalize on this segment.
13
0
20000
40000
60000
80000
100000
120000
2000/01 2001/02 2002/03 2003/04 2004/05 2005/06 2006/07
Years
Qu
an
tity
(M
Ws)
0
2
4
6
8
10
12
14
16
Pe
rce
nta
ge
Peak Demand Peak Met Peak Shortage
30538
40425 41110
78700
1083219119 21180
16423
0
20000
40000
60000
80000
100000
8th Plan 9th Plan 10th Plan 11th Plan
Period
Ta
rge
t (M
Ws)
0
10
20
30
40
50
60
Pe
rce
nt
Target Achieved Achievement Percent
Power
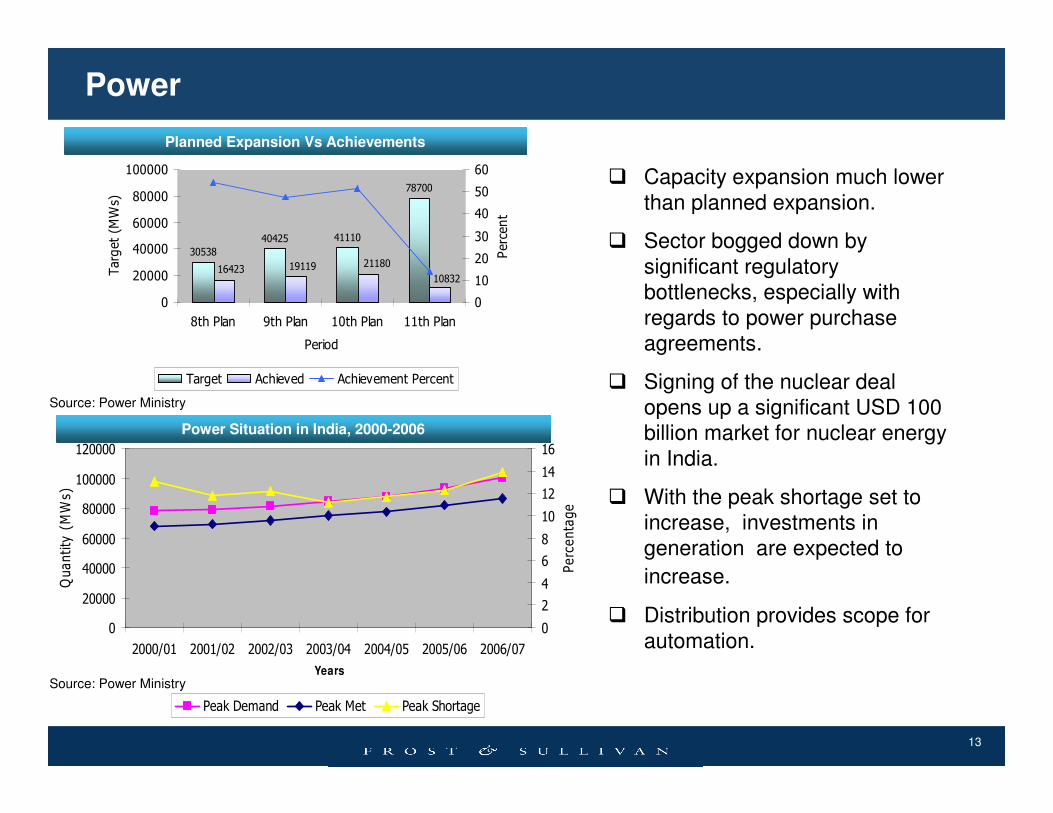
Planned Expansion Vs Achievements
Power Situation in India, 2000-2006
Source: Power Ministry
Source: Power Ministry
� Capacity expansion much lower than planned expansion.
� Sector bogged down by significant regulatory bottlenecks, especially with regards to power purchase agreements.
� Signing of the nuclear deal opens up a significant USD 100 billion market for nuclear energy in India.
� With the peak shortage set to increase, investments in generation are expected to
increase.
� Distribution provides scope for automation.
14
Power
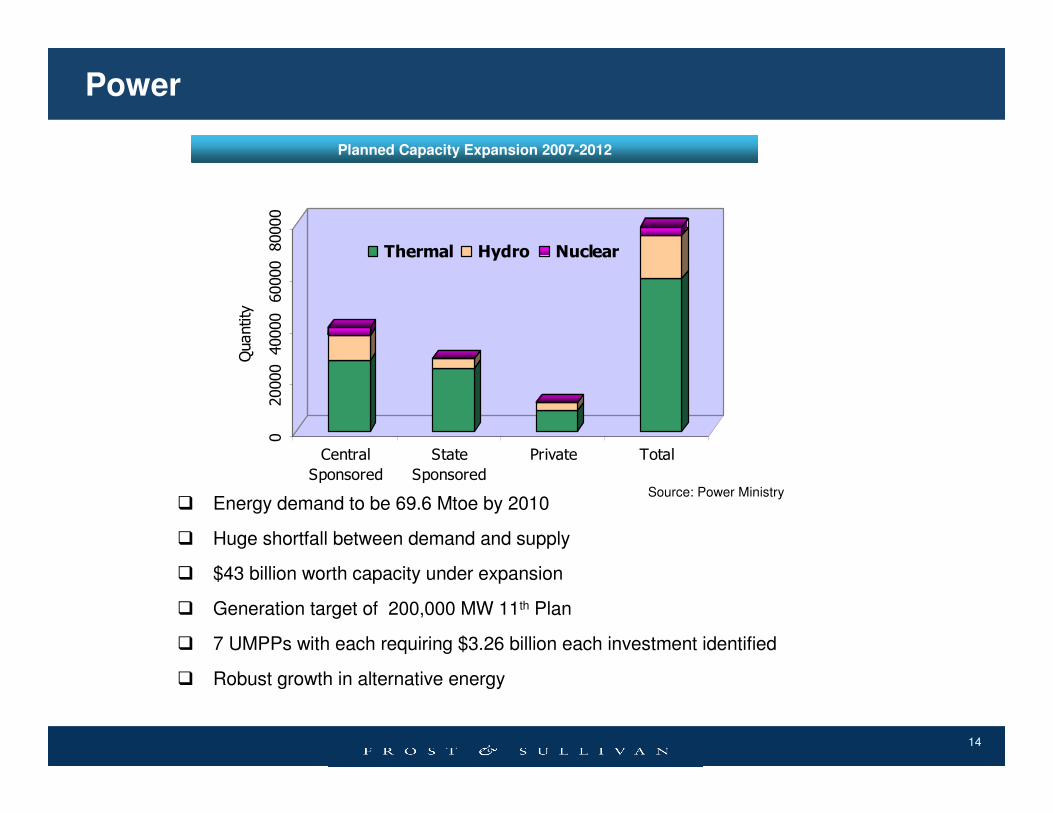
Planned Capacity Expansion 2007-2012
� Energy demand to be 69.6 Mtoe by 2010
� Huge shortfall between demand and supply
� $43 billion worth capacity under expansion
� Generation target of 200,000 MW 11th Plan
� 7 UMPPs with each requiring $3.26 billion each investment identified
� Robust growth in alternative energy
Source: Power Ministry
02
00
00
40
00
06
00
00
80
00
0
Qu
an
tity
Central
Sponsored
State
Sponsored
Private Total
Thermal Hydro Nuclear

15
Metals
0
10
20
30
40
50
60
2002/03 2003/04 2004/05 2005/06 2006/07 2007/08 (April-
December)
Years
Ou
tpu
t ('
00
00
00
) T
on
ne
s
Crude Steel Production Finished Steel Including Alloys Production Finished Steel Including Alloys Consumption
Finished Steel Including Alloys Import Finished Steel Including Alloys Export
� Set to become second largest producer of steel
� Capacity expansion to 124 million Tons by 2011-12
� 194 MOUs signed to establish new plants
� Total Investment USD 140 billion by 2012
Steel Production,2002-2007
Non Ferrous Metals Production, 2002-2006
� Power sector attracting investments leading to increased aluminum demand
� Copper demand boosted by electronics industry
� Consolidation and expansion in non-Ferrous Metals
� Reduction in import duties� Growth in steel production leading to
zinc demand
0
500000
1000000
1500000
2000000
2500000
3000000
2002/03 2003/04 2004/05 2005/06 2006/07
Year
Pro
du
ctio
n (
To
nn
es)
Zinc Production Copper Production Aluminium Production
Source: Steel Ministry
Source: Ministry of Mines & Minerals
16
0
200000
400000
600000
800000
1000000
1200000
1400000
1600000
1800000
2001 2002 2003 2004 2005 2006 2007
Years
Ou
tpu
t (U
nit
s)
0
5
10
15
20
25
30
35
Perc
en
t
Cars Commercial Vehicles Growth
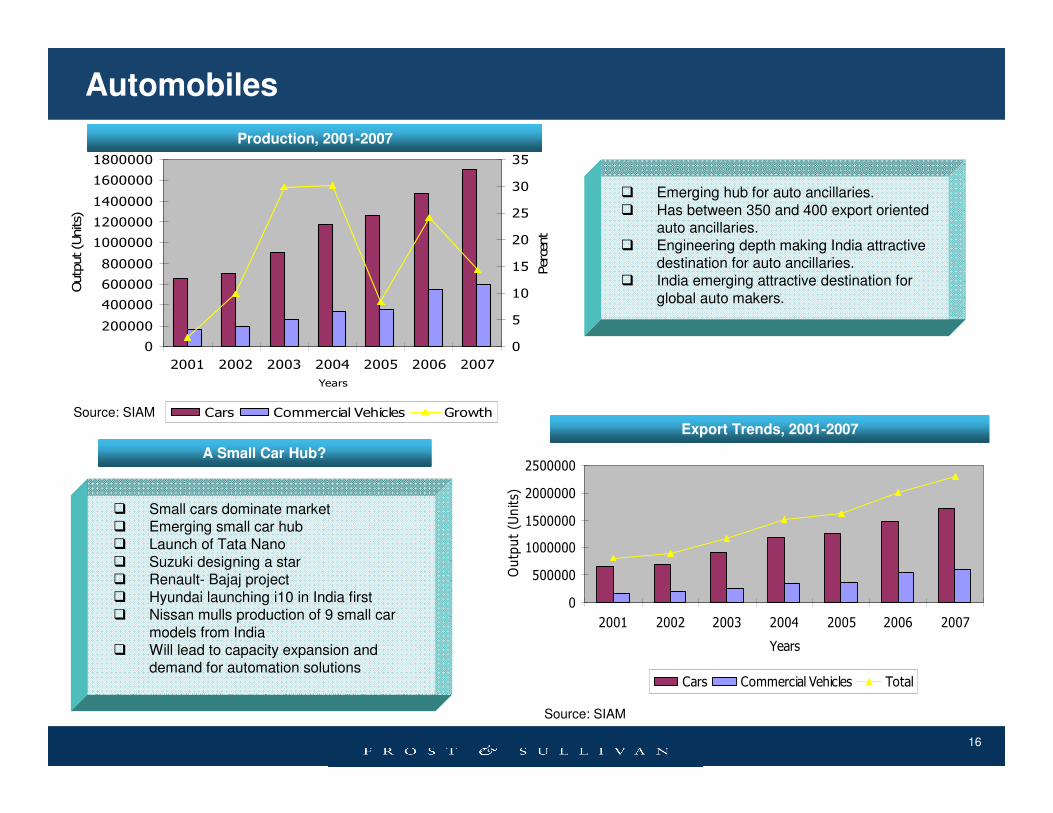
Automobiles
� Small cars dominate market � Emerging small car hub � Launch of Tata Nano� Suzuki designing a star � Renault- Bajaj project � Hyundai launching i10 in India first� Nissan mulls production of 9 small car
models from India� Will lead to capacity expansion and
demand for automation solutions
� Emerging hub for auto ancillaries. � Has between 350 and 400 export oriented
auto ancillaries. � Engineering depth making India attractive
destination for auto ancillaries. � India emerging attractive destination for
global auto makers.
A Small Car Hub?
Production, 2001-2007
Export Trends, 2001-2007
0
500000
1000000
1500000
2000000
2500000
2001 2002 2003 2004 2005 2006 2007
Years
Ou
tpu
t (U
nit
s)
Cars Commercial Vehicles Total
Source: SIAM
Source: SIAM
17
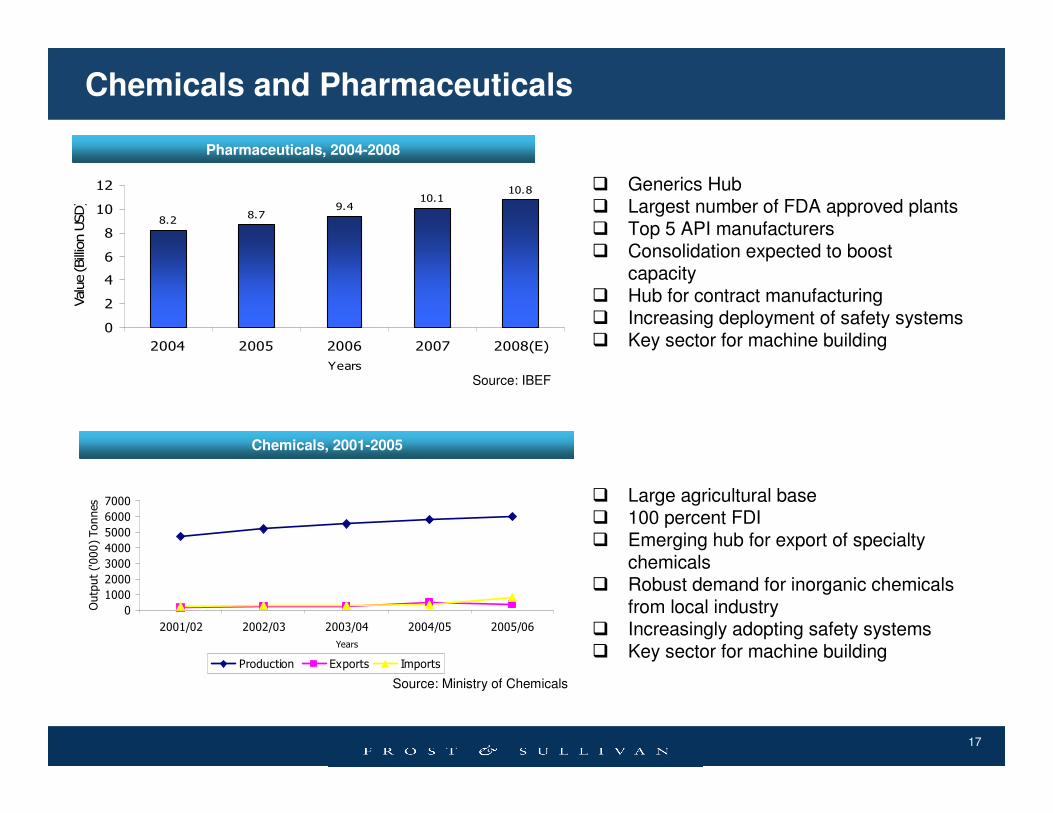
8.28.7
9.410.1
10.8
0
2
4
6
8
10
12
2004 2005 2006 2007 2008(E)
Years
Valu
e (
Bill
ion
US
D)
0
1000
2000
3000
4000
5000
6000
7000
2001/02 2002/03 2003/04 2004/05 2005/06
Years
Ou
tpu
t ('
00
0)
To
nn
es
Production Exports Imports
Chemicals and Pharmaceuticals
� Generics Hub � Largest number of FDA approved plants � Top 5 API manufacturers� Consolidation expected to boost
capacity � Hub for contract manufacturing � Increasing deployment of safety systems� Key sector for machine building
Pharmaceuticals, 2004-2008
� Large agricultural base � 100 percent FDI � Emerging hub for export of specialty
chemicals � Robust demand for inorganic chemicals
from local industry� Increasingly adopting safety systems� Key sector for machine building
Chemicals, 2001-2005
Source: Ministry of Chemicals
Source: IBEF
18
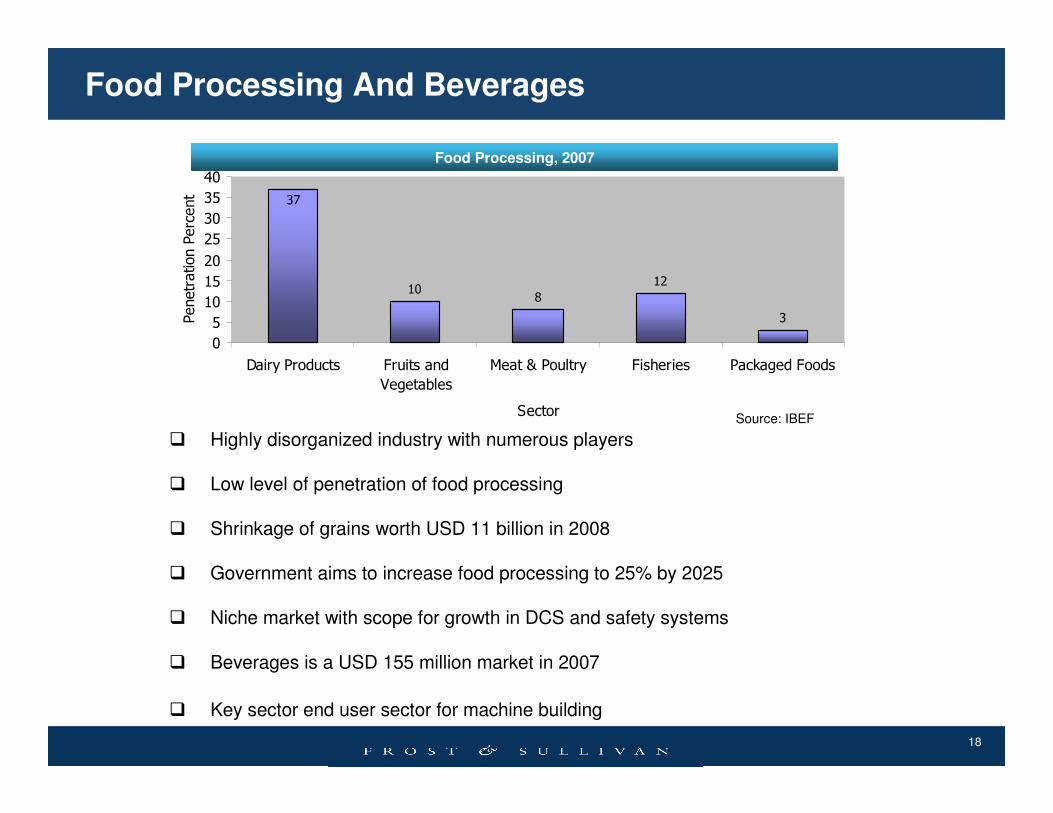
Food Processing And Beverages
Food Processing, 2007
� Highly disorganized industry with numerous players
� Low level of penetration of food processing
� Shrinkage of grains worth USD 11 billion in 2008
� Government aims to increase food processing to 25% by 2025
� Niche market with scope for growth in DCS and safety systems
� Beverages is a USD 155 million market in 2007
� Key sector end user sector for machine building
Source: IBEF
108
12
3
37
0
5
10
15
20
25
30
35
40
Dairy Products Fruits and
Vegetables
Meat & Poultry Fisheries Packaged Foods
Sector
Pe
ne
tra
tio
n P
erc
en
t
19
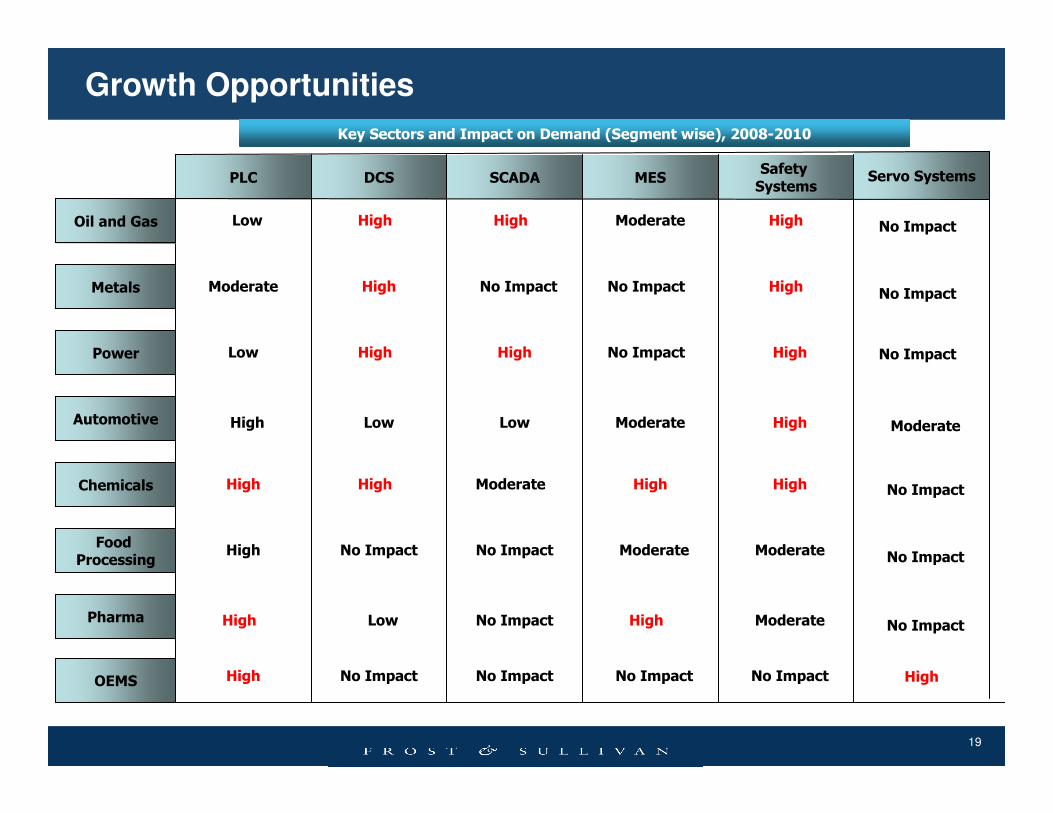
Growth Opportunities
PLC DCS SCADASafety Systems
MES
Oil and Gas Low High High Moderate High
Metals Moderate High HighNo ImpactNo Impact
Power Low High High No Impact High
Automotive High LowHigh Low Moderate
Chemicals High High Moderate HighHigh
Food Processing
High No Impact No Impact Moderate Moderate
High Low No Impact High Moderate
Key Sectors and Impact on Demand (Segment wise), 2008-2010
OEMS High No Impact No Impact No Impact No Impact
Servo Systems
High
No Impact
No Impact
No Impact
Moderate
No Impact
No Impact
No Impact
Pharma

20
Your Feedback is Important to Us
Growth Forecasts?
Competitive Structure?
Emerging Trends?
Strategic Recommendations?
Other?
Please inform us by taking our survey.
What would you like to see from Frost & Sullivan?
21
For Additional Information
• To leave a comment, ask the analyst a question, or receive the free audio segment that accompanies this presentation, please contact Stephanie Ochoa, Social Media Manager at (210) 247-2421, via email, [email protected], or on Twitter at http://twitter.com/stephanieochoa.