Embed Size (px)
Citation preview

TRENDS SPECIAL REPORTVIDEO
SOCIAL MEDIAMOBILE
BIG DATACONTENT
MAGAZINE MEDIAREVENUE
BIG DATATRENDS

2
BIG DATA FOR MEDIA 2015
!e European Publishers Council is a high level group of Chairmen and CEOs of leading media groups in Europe. Representing companies with newspapers, magazines, online publishing, journals, databases, books and broad-casting, the EPC has been communicating with Europe’s legislators since 1991 on issues that a"ect freedom of expression, media diversity and the health and viability of professional media in the EU.
www.epceurope.eu
FIPP — the worldwide magazine media association represents companies and individuals involved in the creation, publishing, or distribution of quality content, in whatever form, by whatever channel, and in the most appropriate frequency, to de#ned audiences of interest. FIPP exists so that its members develop better strategies and build better media businesses by identifying and communicating emerging trends, sharing knowledge, and improving skills worldwide.
www.!pp.com
!e World Newsmedia Network is a not-for-pro#t, mul-tiple media research company devoted to assisting media companies achieve their business objectives across the media spectrum through research, events and consultan-cy. WNMN consults to and produces events and research for media companies around the world.
www.wnmn.org
WNMNWORLD NEWSMEDIA NETWORK
Publisher: World Newsmedia NetworkCEO Martha [email protected]
Designer: John Moreno
Editor: Leah McBride Mensching
Big Data for Media 2015 is a part of a nine-part series of re-search reports that comprise Global Digital Media Trendbook 2015.
GDMT 2015, in its tenth year, explores revenue and usage trends across digital platforms, including social media, video, mobile, tablets, the Internet and beyond. !e yearbook also
analyses data from 60+ global research companies in order to project plausible futures of digital channels for media compa-nies worldwide.
!e World Newsmedia Network publishes GDMT with the support of two major research partners: European Publishers Council and FIPP.

3
BIG DATA FOR MEDIA“Big Data” is a buzz phrase at the height of its popularity. Industries across the spectrum are exploring how they can leverage Big Data to create more and better business opportunities. But how has the de!nition of Big Data evolved and how can media companies create Big Data strategies that will
create insights and revenue across their value chains?
What are Big Data?Media companies collect, process and generate data of all kinds, big and small. One de#nition for “big” data might be data that cannot be processed on an average personal com-puter, that is, computers that have processing capacities in gigabytes (GB). !e digital content universe is measured in zettabytes (ZB). One zettabyte is equal to 1 trillion gigabytes.
Small data can be processed on personal computers. !is might include spreadsheets with structured data, and media companies’ daily quotients of unstructured data, such as the unstructured data output of an average newsroom, including video, social media, photos, audio and text.
However, once these data multiply and accumulate over time, they can very quickly become “Big Data” and require gigantic storage solutions, powerful processing capability and so$ware that is able to analyse and parse these data instantly.
No matter the industry, the catchphrase “Big Data” has en-compassed three key elements in the past. !ey are: Volume, Velocity and Variety. !at is, volume, or large amounts of data;
velocity, or the need to be analysed quickly; and variety, or di"erent types of unstructured and structured data.
As Big Data becomes more utilised, a fourth, and perhaps most important, “V” is being added. !at “V” stands for value. Without value as part of the end game for Big Data, the #rst three “Vs” are worthless. Audience insights and revenue are
the most sought-a$er values from Big Data circa 2015.
Big Data popularity: Why now?Structured and unstructured data are proliferating expo-nentially. Unstructured data, including video, photos, audio/music and text, make up 80 percent of all data coursing
through the byways of digital media platforms, while only 20 percent are structured data, or those data organised in #elds and categories within databases.
Structured databases could include governmental databases such as census data, taxpayer logs, real estate transactions, school records and police records, or business-oriented relational databases on mobile phone records, bank accounts, cancer incidences, shopping trends and more.
Big data: The four Vs
Source: World Newsmedia Network © World Newsmedia Network 2015
Large amounts of data
VOLUME
Need tobe analysed
quickly
VELOCITY
Different typesof unstructuredand structured
data
VARIETY
Extractingbusiness insights
and revenuefrom data
VALUE

4
BIG DATA FOR MEDIA 2015
!e digital content universe will more than treble between 2013 and 2017, according to audit, consulting, #nancial advisory, risk management, tax and related services #rm Deloitte. Video and photo generation, consumption and sharing, and social media usage, will make up the bulk of unstructured data during that period.
Among the online consumer activities that
contribute to the proliferation of Big Data
are the following actions that happen every
minute, according to Intel in 2014:
A huge contributor to the explosion of data consumption, generation and sharing is global mobile data tra%c. !e average mobile data user consumes and generates 900MB of data each
Digital content universe generated by consumersVideo and photo generation, consumption and sharing and social media usage made up the bulk of online content in 2013.
© World Newsmedia Network 2015
15
12
9
6
3
0ZE
TABY
TES
(ZB)
2005 2006 2007 2008 2009 2010 2011 2012
>4ZB(+50% Y/Y)
13ZB(+40% Y/Y)
2013 2014 2015 2016
Note: 1 petabyte = 1 million gigabytes. 1 zetabyte = 1 million petabytes
Source: Deloitte, May 2014, as reported by Internet Trends 2014 by Mary Meeker for Kleiner Perkins Caufield & Byers
Global mobile data growthTotal monthly mobile global data traffic (uploaded and downloaded) in petabytes (millions of gigabytes)
Source: We are Social, Ericsson Mobility Report, November 2014 © World Newsmedia Network 2015
2,800
2,600
2,400
2,200
2,000
1,800
1,600
1,400
1,200
1,000
800
600
400
200
0Q3
2009Q4
2009Q1
2010Q2
2010Q3
2010Q4
2010Q1
2011Q2
2011Q3
2011Q4
2011Q1
2012Q2
2012Q3
2012Q4
2012Q1
2013Q2
2013Q3
2013Q4
2013Q1
2014Q2
2014Q3
2014
Average monthly mobile data per user: 900mb
• US$400 million spent during Alibaba peak day sales• 438,801 Wiki page views• 10 million WeChat messages at its peak• 34.7 million instant messages sent• 194,064 app downloads• US$133,436 in sales on Amazon• 31,773 hours of music played on Pandora• 38,194 photos uploaded on Instagram
• 57,870 page views on Pinterest• 347,222 tweets on Twitter• 3.3 million pieces of content shared on Facebook and 6.9
million messages sent• 23,148 hours of video watched on Net&ix• 138,889 hours of video watched on YouTube and 100
hours of video uploaded• 4.1 million searches on Google

5
BIG DATA FOR MEDIA 2015
month, according to Ericsson’s Mobility Report, published in Nov. 2014. Since 2009, the consumption, creation and sharing of mobile data has skyrocketed from less than 100 petabytes to more than 2,800 petabytes in 2014. A petabyte is 1 million gigabytes. !e surging trend shows no sign of relenting.
!e digital ecosystem has been growing at the speed of light. !e growth has accelerat-ed a variety of factors, which in turn has perpet-uated the explosion of Big Data creation, consumption and sharing. !e virtuous cycle of Big Data content is driven by the consumer, who is motivated by the a"ordability of digital devices such as
PCs, smartphones and tablets, and also by the steep decline in the price of data usage
and storage on these devices and on mobile networks.
!is proliferation of consumers’ digital
usage behaviour drives exponentially more high-bandwidth content consump-tion and sharing, which in turn causes high-bandwidth audiences to grow.
When advertisers and publishers see high-val-
ue content groups expanding, they target the
users with advertising and content. !e virtuous cycle con-
tinues as the number of digital users and their frequency of use surges.
605
10
15
3035 25
2040
45
50
55
Source: Intel, 2014© World Newsmedia Network 2015
Media use in an Internet
minute
31,773 hours of music played
on Pandora
10 million WeChat messages
at its peak
US$133,436 in sales on Amazon
347,222 tweets on Twitter
3.3 million pieces of content
shared on Facebook and 6.9
million messages sent
138,889 hours of video
watched on YouTube
and 100 hours of video uploaded
38,194 photos uploaded
on Instagram
4.1 million searches on
57,870 page views on
US$400 million during Alibaba peak day sales
438,801 Wiki page views
23,148 hours of video
watched on Netflix
194,064 app downloads
34.7 million instant messages
sent
Source: World Newsmedia Network 2015© World Newsmedia Network 2015
Connectivity,data storageprices drop
Advertiserstarget Big Data
content audiences
High-bandwidthcontent
audience grows
Number of digital devices
soars
Amount of high-bandwidth
content skyrockets
Virtuous cycleof Big Data
content

6
BIG DATA FOR MEDIA 2015
The Big Data strategyBig Data actually is a catch-all strategy for multiple strategies, including audience analytics, advertising and content tar-geting, sentiment analysis, data journalism, budget analysis, e%ciencies analysis and much more.
!e No. 1 strategy for media companies regarding Big Data is audience analytics, according to a global survey of media companies by World Newsmedia Network. !e No. 2 overall strategy for CEOs of companies in all industries is data mining and analytics, according to PricewaterhouseCoopers. Data mining and analytics were only second to mobile technology for customer engagement, with 81 percent and 80 percent re-sponding these were important strategies for their companies, respectively.
WNMN’s Big Data for Media surveySeventy respondents from 32 countries and #ve continents concluded that audience analytics was by far the most im-portant Big Data strategy for their media companies in 2015. Media executives took the survey from the third and fourth quarters of 2014 and the #rst quarter in 2015.
!e Big Data strategy is relatively new for media companies around the world. About half of the responding companies are only launching one Big Data sub-strategy, such as an audience analytics or data journalism strategy to start.
2015 is the year of the Big Data strategy launch, according to the survey. !e majority of the respondents (22) declared their launches to be this year, while almost the same number of respondents (19) said they launched their strategies in 2013 or 2014. Seven respondents each said they either launched their Big Data strategy between 2010 and 2012, or will launch
Source: eMarketer, 2015 © World Newsmedia Network 2015
Top technologies for strategic purposesCEOs from industries around the globe prioritised technologies that drive strategy
0 20% 40% 60% 80% 100%
Mobile technologies for customer engagement
Data mining and analysis
Cyber security
Internet of things
Socially enabled business processes
Wearable computing
3-D printing
Robotics
Battery and power technologies
Cloud computing
81%
80%
78%
65%
61%
60%
47%
37%
33%
27%
70 respondents, 32 countries, 5 continentsNumber of respondents from each country
Source: World Newsmedia Network, “Big Data for Media Survey,” 2014-2015 © World Newsmedia Network 2015
South Africa
Nigeria
2
United ArabEmirates
1SaudiArabia
1
Malaysia1
3
Italy 4
Poland
Czech Republic
11
Austria
Hungary
1Turkey 1
1
Denmark
United Kingdom
BelgiumGermany
Switzerland
Norway
4
12
France
Portugal
22
2
Ireland 11
3Finland 2
Sweden 1
United States4
Bolivia1
Chile1
Brazil1
Argentina1
Canada5
India1
China4
Korea2
Taiwan1

7
BIG DATA FOR MEDIA 2015
between 2016 and 2017. !irteen respondents said they have no plans to launch a comprehensive Big Data strategy, but a handful of them will launch sub-strategies, such as audience analytics or data journalism practices. !e most popular sub-strategy for Big Data is audience ana-lytics, with 20 companies responding it is their No. 1 strategy. Data journalism is the second most popular strategy, with 12 respondents, followed by nine respondents for audience segmentation, seven respondents prioritising targeted editorial content to segments, #ve for targeted advertising campaigns
and four for cost-cutting initiatives inspired by Big Data analysis.
More than half of the respondents said they wanted to launch multiple Big Data initiatives in the future.Newspaper respondents made up more than half of the survey respondents (41), while digital media was the second most popular respondent category (16), followed by broadcast (four) and magazine and multimedia, each with two. Four re-spondents chose “other,” as they were consultants or vendors.
Launch dates for Big Data StrategiesNumber of respondents from each country
Source: World Newsmedia Network, “Big Data for Media Survey,” 2014-2015 © World Newsmedia Network 2015
7
19
22
7
13
2
0
5
10
15
20
25
2010 2011 2012 2013 2014 2015 2016 2017 No plans to launch a Big Data
strategy
No answer
What is your company’s most important business-side or journalism-side initiative with Big Data?
Source: World Newsmedia Network, “Big Data for Media Survey,” 2014-2015 © World Newsmedia Network 2015
20
12
9
7
4
5
2
1
2
0 5 10 15 20
Audience analytics
Data journalism
Audience segmentation
Targeted editorial content to segments
Cost-cutting initiatives inspired by Big Data financial analysis
Targeted advertising campaigns
Sentiment analysis
Ad campaigns and analytics
Targeted marketing campaigns

8
BIG DATA FOR MEDIA 2015
!ose companies with the longest-lived strategies of three to #ve years tended to be from large media companies in Asia, North America and Europe and from developed countries. !ose companies that launched in the past one to two years tended to be European from innovative medium to large companies, plus two from North America and two from South America.
Planning next year included primarily newspaper compa-nies: four large and medium media companies from China, one from the Nordic region and one from India, plus medi-um-sized companies from Latin America, Europe and Africa. !ose planning two years from now tended to be smaller papers from countries such as Korea, South Africa, Italy, Por-tugal, Argentina, Finland, Germany and Hungary. Respondents who said they had no plans were either from emerging countries in South Africa, or from Saudi Arabia and the United Arab Emirates, from small publications, or from businesses supporting media companies such as stra-tegic consultants or vendors. Some of the media companies declared they were experimenting with smaller strategies, such as data journalism or audience analytics, and not considering an overarching Big Data strategy.
Big Data for Media conference 2015!e World Newsmedia Network founded the Big Data for Media conference in 2013 at the University of Oxford’s Reuters Institute for the Study of Journalism. !e international confer-ence focused on the 2013 and 2014 Reuters research associate
projects by Martha Stone. !e conference drew more than 100 participants from around the world, #rst at the Open Society Foundations in 2013, and then Microso$ Corp. in 2014 in London.
In an e"ort to expand in order to reach more of the news-media industry, the International News Media Association joined Stone’s research company, World Newsmedia Network, to create the third annual Big Data for Media conference at Google’s London headquarters in March 2015. !e conference played host to a sold-out crowd of about 200 participants from 30 countries and #ve continents.
Among the speakers for the #rst day were Simon Rogers, data editor of Google; Jim Roberts, chief content o%cer of Mashable; Shane Murray, executive director of analytics for !e New York Times; Martha Stone, founder and co-host of the Big Data for Media conference; Earl Wilkinson, CEO of INMA and co-host for the conference; and Jodie Hopperton, an international media consultant and the conference em-cee. Big data company dunnhumby hosted a pre-conference session with three members of its Big Data team: chief data scientist Giles Pavey, head of data analytics; Jason Nathan; and Tom Langley.
Key trends and opportunities for media companiesBy Caroline Lees
What is the state of Big Data for media companies as it regards bridging legacy and digital cultures? What is the status of Big Data at media companies? What are the key trends and oppor-tunities, according to media executives?
No subject touches the essence of the transition of media companies — from enterprises based on serendipity and gut-based decisions to ones based on an-alytics — better than Big Data.
Martha Stone, CEO World Newsmedia Network, introduced the Big Data for Media Survey of 70 respondents from 32 countries, primarily from newspaper companies.
!e survey revealed that most respondents are launching their Big Data strategies about now. !e second key #nding was that audience analytics was considered the most important business side or journalism-side initiative with Big Data.
While there is still no agreed upon de#nition of Big Data for media, the standard de#nition continues to be the “three ‘Vs’: volume, velocity and variety of data,” Stone said. !e challenge
What is the primary form of publishing for the media company you represent?In number of respondents
Source: World Newsmedia Network, “Big Data for Media Survey,” 2014-2015© World Newsmedia Network 2015
41
4
2
2
4
1
0 10 20 30 40 50
Primarily newspaper company
Primarily digital media company
Primarily broadcast company
Primarily magazine company
Multimedia
Other
Cinema
16
Martha Stone

9
BIG DATA FOR MEDIA 2015
for the conference was to agree on a de#nition of Big Data, suitable for the media industry, she added.
“I would like to add a fourth ‘V’: value. Business insights and revenue from data. If there is any focus of this conference, it is the value of data,” she said.
Stone outlined key areas where the media could use Big Data, in particular product development: “Product development is the No. 1 area where we can bene#t from Big Data and analytics.”
Earl Wilkinson, executive director and CEO of INMA, o"ered a global view of Big Data in Media. “!is conference is about what adds value,” he said. “I want to bring together some best practices.”
Wilkinson described the current state of the media as “two ends of a rope burning towards each other. On one end are legacy media compa-nies, like most of you in this room, on the other end are digital media companies,” he said.
Legacy media companies “are companies that think and inno-vate through heart and soul, at the other end, digital compa-nies are making value judgments.”
At digital companies it is o$en about “raw eyeballs visiting a site,” he said. Data is crucial to building bridges between the two cultures, Wilkinson said. He outlined four key technology trends for news publishers: “Connectivity, personal data centres, access ownership, and proliferation of screens as devices proliferate.” “I believe we are drowning in information today. In the future, it is going to be about simpli#cation and become the signal in all the noise, becoming a trusted voice.” Wilkinson said that INMA was focusing on Big Data issues in response to requests from its members. “We asked our members what we need to be focusing on and they said mobile, data and data analytics.
“I believe that Big Data is bang on the centre of the burning rope,” he said. “It is the tension between data analytics and hu-man judgment. I believe that data is one of the four priorities for news publishers, and I believe we are under-selling it.”
Peter Barron, director of communications and public a"airs at Google for Europe, Middle East and Africa, agreed that data is at the heart of media.
“!is event is not just about data journalism. It is everything you need to know about engaging audiences through smarter use of data,” he said.
Barron outlined ways Google is trying to be helpful to the media industry. First is product development: Google is doing a wide range of fusion tables, analytics, Google cloud plat-form, as well as using Google’s internal tools and making them useful to the broader media industry.
“Education and training is a big area,” Barron said. “We are doing a lot of work and workshops with newsrooms around the world to help them get to grips with these tools. We are trying to bring them in a meaningful way to newsrooms around the world.”
Another way Google is supporting the media industry is by supporting and stimulating innovation. Barron explained that there is a variety ways Google can do this, such as grants and funding awards such as the data journalism awards: “It is also about supporting events like this event today.”
Rogers: Understand, plan, engageBy Brandon Tensley
Google data editor Simon Rogers encourages news media companies to look at hashtags for trending stories they might be able to tell with Big Data, decide what makes sense to share, then #nd an engaging way to do it.
What are some ways to harness the power of Big Data?
Understanding sentiment about news topics, spotting stories before they go viral and developing better business acumen are three tools that some media giants use to leverage data for success.
!is requires an understanding of data journalism: taking apart the Big Data that’s all around and making it small, man-ageable and easy to understand, because, according to Rogers, “numbers with-out context are just numbers.”
But the good news is that anyone can do this. According to Rogers, a key #rst step is #nding out what readers are interested in. “Journalists aren’t always experts,” he pointed out. Seeing what’s bubbling to the fore of conversations – looking at those Twitter hashtags, for example – is a great way to gather data.
So, you’ve got your data. But just having a bunch of it isn’t really helpful. If you want to tap into the payo"s of data, then think about where you’re headed, what you want to show, for instance, changes in public attitudes or burgeoning public trends.
Earl Wilkinson
Simon Rogers

10
BIG DATA FOR MEDIA 2015
Were the 2011 London riots concentrated in certain parts of the city? (!ey were.) What part of the world was particu-larly keen to snap up the midnight release of Beyoncé’s 2012 album? (!e United States, predictably).
And last, how can you tell this information in an engaging way? Interactive maps are an option, said Rogers. With a healthy dose of consumer-centered thinking, maps can be as informative as they are appealing to the eye. And they don’t require the aptitude of a so$ware engineer.
Rogers doesn’t pretend to have the gi$s of a data scientist or a statistician, but he can still conjure up a user-friendly map of all of the Underground stops in London in about 45 minutes.
In short, trend-spotting stories that are resonating with the public and then disseminating them in an easily digestible way are part and parcel of using big data successfully. And luckily, “none of this is new,” Rogers said.
Taking in data has always been the modus operandi of jour-nalists, and making people hungry to consume it has always been their end-goal. !e only twist now is not to let the media’s digital shi$ obscure business sense in the quest toward big data success.
New York Times pay model successBy Brandon Tensley
!e New York Times’ analytics team has been redesigned to meet the evolving needs of consumers and the news media company in its post-paywall era.
!e New York Times launched its digital pay model in 2011, and by 2014, it had already reached some 910,000 digital-only subscribers. How did the news media company do it?
“Analytics and data have had to evolve to support strategy, measurement, and optimisation,” said Shane Murray, executive director of analytics at !e Times. Over the past few years, the Times’ analytics team has been re-organised and re-fashioned to include three teams that support speci#c internal customers and two teams that maintain a centre of excellence around the media giant’s functional capabilities. !ese teams com-pared !e Times’ pre-paywall metrics (page views, sessions, and unique visitors) with the post-pay-wall ones (sessions per visitor, articles per visitor, and paywall &ow of visitors). Looking at these metrics allowed the teams
to generate, explore, and re#ne ideas on a level that’s more user-friendly and consumer-oriented.
!is led Murray to ask a more fundamental question: “How do digital subscriptions happen?”
It turns out, the answer is best explained in three steps: 1. People develop a habit. !is stems from providing con-
tent that people want and in a style they want.2. People are met with an important decision point:
To pay or not to pay? In other words, how big is this “want”?
3. People justify the cost.
Moving into its #$h year of the digital subscription model, !e Times continues to see success with attracting subscribers who crave having more digital content. On the surface, it doesn’t seem as if this success can be easily replicated. !ough business operators and data engineers have built an environment to support advanced analytics, fancy calculus isn’t really needed. Rather, what you have to do is analyse reader behaviour and measure success.
All you have to do, concludes Murray, is “incorporate the user experience.”
Roberts: Data journalism at MashableBy Caroline Lees
Mashable leverages the data gleaned from its audience usage to identify trends in content consumption, which impacts its internal processes.
How does Mashable use Big Data to create more compelling content from the editorial operation? Big Data is essential to the operation, Jim Roberts, the company’s executive editor and chief content o%cer, told delegates at the conference. Mash-able has a small sta" and relies on data to enable it to #nd stories, as well as to understand audience behaviour.
Data allows Mashable, which employs 60 reporters globally, to successfully compete with news organisations that employ thousands of reporters, such as !e New York Times, which employs around 1,100 journalists.
Roberts, a former editor at !e New York Times, said that in the past, journalists, including himself, did not understand the role of data. “For decades, newsrooms weren’t on good terms with data. Editors paid more attention to their budgets. Most of us had no clue about what our audiences were consuming and … for the most part we didn’t care,” Roberts said. “Our attitude was we know what news is. We are the people trained to do that.”
He said the only thing that mattered was that readers kept buying the newspaper. “In fact, most of us thought that if we only published what the audience were interested in, we would
Shane Murray

11
BIG DATA FOR MEDIA 2015
end up publishing &u",” he said.
But Roberts said that since arriving at Mashable, his attitude towards data has changed: “Many people in the news business fear data because it will tell them they are doing something wrong. But I can assure you that data is our friend — in fact it is our lifeblood at Mashable.”
Mashable’s web-site, which has 42 million unique monthly visitors and 21 million social media followers, uses its own Velocity so$ware to aggre-gate news and reveal trends on social me-dia, Roberts said. “It is a multi-purpose predictive tool and it helps us #nd good stories.”
Velocity also promotes cooperation between Mashable’s data experts and its editorial team, which work together to under-stand audience behaviour. It also allows Mashable to maintain an automated home page. An algorithm places stories on the home page according to the number of shares they have received on social media, he said.
It is essential to understand how the website’s content is shared, he pointed out.
“We are constantly asking ourselves what data science can tell us about audience behaviours,” Roberts said. “People are look-ing for di"erent things at di"erent times of day. It’s very likely that someone at 11pm is looking for a bit more entertainment. So we wonder if we are di"erentiating our content enough. We are starting to think what types of stories we should be sharing at di"erent times of day. !is is where data is essential to us.”
Mashable also uses other data tools, such as location-based social media monitoring platform Geofeedia and Dataminr, which crawls real-time information on social media sites, to help #nd and break stories before the competition.
Big Data panel: What keeps you up at night?By Caroline Lees
Wrapping up the #rst day of the Big Data Media conference, Shane Murray of !e New York Times, Simon Rogers of Goo-gle and Jim Roberts of Mashable discussed business models, privacy, making money from data, the best data tools and future trends.
!e panel was asked to what extent they allow data to inform their editorial decisions. Roberts said that while data in&uenc-es editorial decisions at Mashable, it does not dictate them.
“!ere are stories that we pay attention to that we think are important to our identity,” he said.
Roberts gave the example of Mashable’s recent decision to cover the Scottish referendum. “I found it interesting, but it didn’t move our audience needle very much. But I liked it because it made me feel we were expanding our #eld of vision. On the other hand, there are stores that we will go for because we know they will enter the viral jet stream.”!e panel was also asked about what “keeps them awake at night.”Rogers said that, apart from his children, he is kept awake by the desire to tell compelling stories that are interesting to other people.
Murray said for him it is the drive to make sure that data is used in the right way.
“I am trying to use the best of design and the best of the news-room to feed into the way we use analytics,” he said. “So not to simply use data to make decisions.”
Roberts said he is kept awake by the knowledge that Mashable needs to innovate to stay ahead of the competition. Some of the “tricks” and tools that have helped make Mashable so successful are easily learnt and replicated by competitors. For example, tools Mashable employs, such as Dataminr and Geo-feedia, are widely available.
“When those tricks are adopted more broadly, we will lose our competitive edge,” Roberts said.
Martha Stone, head of WNMN, asked the panel what data tools they could recommend to the audience. Murray said !e New York Times analysts use Python and Tableau, describing them as “good predictive visualisation tools.”
Roberts mentioned Geofeedia and Dataminr, but also Mash-able’s own Velocity so$ware.
Rogers said he rated Raw, by Density Design, “a way to make vectored charts, and it’s free,” and Excel.
!e panel also agreed that even small organisations can use Big Data e"ectively.
Jim Roberts
Emcee Jodie Hopperton (right) led the panel of key Day 1 speakers, from le!, Murray, Roberts and Rogers.

12
BIG DATA FOR MEDIA 2015
“Focus on a few things you can do well and try to be as good as you can,” Rogers said. “!en focus on partnerships; lots of organisations are up for helping. It is not about size; with one person you can do amazing things.”
dunnhumby’s Big Data legacyBy Brandon Tensley
Do you know your customers’ online shopping habits? What kind of reviews do they write about products or services? Has someone asked them if they’re happy with your company’s service? You should.
How your company uses customer data can drive customer loyalty and sustain overall success, say the top data executives of dunnhumby, an international success story for the implementa-tion of a 25-year Big Data strategy. dunnhumby hosted a pre-confer-ence session to share their wealth of experience in the realm of whole-company Big Data strategy implementation. According to dunnhumby chief data scientist Giles Pavey, the answer to a company’s problems usually lies in #rst adopting a customer-fosuced approach. In other words, making a customer’s needs and wants at the epicenter of decision-making.
dunnhumby was established to deliver services through Big Data. !e concept isn’t totally clear-cut, but keep in mind the “four Vs: data that’s high in validity, variability, velocity, and volume,” he said.
But how does dunnhumby realise success? Getting good data – paying attention to a customer’s demographics and trans-action history – is a critical starting point. Companies ought to understand and document data, which gives insight into a customer’s journey – discovering, shopping, buying, and re&ecting – and then they should benchmark and score this data against the known best practices of other organisations, Jason Nathan, head of data analytics for dunnhumby, told the attendees.
Generating data, including “hidden data,” comes in many forms. A few examples of essential known and unknown data-gathering techniques include:
• Online shopping (does the customer like to use substi-tutes?)
• Customer reviews (what does the customer like to talk about?)
• Phone conversations (was the customer ultimately satis-#ed with the journey?)
But having data isn’t enough; the key is to translate data into action.
“[Data is] only a function of value, depending on what you do with it,” Nathan said.
dunnhumby was among the #rst companies to use a customer loyalty scheme: For instance, introducing a loyalty card, which rewards repeat customers, at Tesco stores doubled the compa-ny’s pro#ts over the course of only a decade. !is is important for connecting gathered data around a single customer view.
!e takeaway, according to Pavey and Nathan: Make goods relevant. !is is the core idea of segmenting, or knowing as many people as possible as well as possible. And it fuels dunnhumby’s customer-centric principle that anything that
can be personalised should be personalised.
If you’ve followed the above tips, then chances are, you’ll see a change in customer behaviour, they said.
Achieving this vision of success isn’t easy, but dunnhumby’s tried and true embrace and utilisation of the power of Big Data has helped the data science compa-ny to create better experiences for more than 770 million customers all across the globe. dunnhumby’s model – data,
insight, action, and change in behaviour – is the crux of its success.
Day 2 of the Big Data for Media conference!e second day of the Big Data for Media conference fo-cused on speci#c case studies of subscription retention, data department sta%ng, customer focus, targeted advertising, data journalism, automated journalism and mobile strategy. Speakers presenting during Day 2 of the Big Data for Media conference included:
• Andy Day, business intelligence director of News UK• Laura Evans, vice president of audience development
and data science at Scripps Networks• Stéphane Pere, !e Economist’s chief data o%cer• Klaus Miller, head of digital research and analytics at
Ringier• Jan Willem Tulp, data experience designer at TULP
Interactive• Greg Doufas, vice president of data science and audience
intelligence at !e Globe and Mail• Kirk MacDonald, AdTaxi president• Dirk Milbou, De Persgroep’s business manager of con-
sumer relations• Larry Birnbaum, co-founder of Narrative Science and
professor at Northwestern University
From le!, Giles Pavey, Jason Nathan and Tom Langley
13
BIG DATA FOR MEDIA 2015
• Helena Bengtsson, editor of digital projects at the Guard-ian
• Alison Holt and John Walton, data journalists at the BBC• Chris Babayode, managing director, EMEA, Mobile Mar-
keting Association• James Collier, managing director, EMEA, AdTruth• Ben Crain, chief strategy o%cer, Improve Digital• Frederic Joseph, CEO, Performics, ZenithOptimedia
Global Mobile Lead• Aly Nurmohamed, vice president, Global Publisher
Strategy and RTB EMEA, Criteo• Paul O’Grady, senior communications planning manag-
er, Unilever, UK
Decision-making at News UK driven by data, customersBy Brandon Tensley
What is at the heart of decision-making?
“Data and customers,” said Andy Day, News UK’s business intelligence director. And this twin focus is what helps to drive success, even for “old guard” newspaper publishers, he told conference delegates.
But it wasn’t always this way. A quick look at newspaper sales over the past decade shows that the #gures are in decline. So why did Day, a self-described “data geek,” join a dying industry? Because he believed in News UK’s core mission: People should be paid for good journalism, content should be di"erentiated and distinctive, and the industry should be customer-driven.
Plus, there’s room for a data geek to maneuver because there’s value in the data game. Day said he has found that companies that invest heavily both in advanced analytical capabilities and in developing analytical skills see huge bottom-line payo"s.Putting data in the broadest sense at the heart of business has been key to News UK’s success. !e newspaper publisher uses a multi-pillar strategy:
• Putting all of its data in one place• Democratising the use of this data• Making customers the centre of the decision-making
process• Helping to deliver a signi#cant measured value
Adhering to this multi-pronged model has been one of the underlying mechanisms that has driven News UK’s success.
But take care: !is may come as a surprise to attendees, but it’s not all about data, Day said. !is data has to be valuable in order for customers to #nd it signi#cant. !ere’s a tendency in editorial rooms to pitch content to one type of person. Howev-er, it’s crucial for sta" to be in sync with their readers and put out information that keeps an audience active and engaged in the content. Or to put it more plainly, Day said, “forget the customer at your own peril.”
Even the most basic of insights can start to challenge a busi-ness to do better by thinking better.
“It’s all about gut feel and looking for simple stu" in data,” ad-vised Day, whose takeaway point was that companies shouldn’t get too wrapped up in this burgeoning talk of Big Data.
Changing the mindsets of business-side and journalism-side employees to focus on customers hasn’t been an easy task for News UK, but it has paid o". !e trick is not only in harness-ing the power of data – data without context is just data – but also in leveraging data to empower the editorial workforce to think more about customers and potential and existing prod-ucts, and to understand and predict consumer behaviour in a more nuanced, thoughtful way.
Keeping in mind both data and customers will ensure that you’ll never lose sight of what makes your product great.
Milbou: How to make data actionableBy Brandon Tensley
Data must be collected, stored, controlled and analysed prop-erly before it can be put to use in real-time action.
“How do you turn Big Data into smarter and actionable data?”
Dirk Milbou, De Persgroep’s business manager of consumer relations, asked conference attendees.In response, he provided audience members #ve easy steps to create data coherence across three di"erent domains: audi-ence, editorial, and advertising.
First, companies must collect the right consumer data. !is requires going from the anonymous to the social by looking at user information, operational data and brand interaction, Milbou said.
Steps two and three work jointly: Companies must store and
Andy Day

14
BIG DATA FOR MEDIA 2015
control the quality of the data, which can be done in many ways. !ese include external sources, operation-al systems, o'ine interactions and online interactions.
!e fourth step is to analyse the data to derive insights. !ink about what has already been attained and what is still needed. !ere are dif-ferent ways to model the data. What’s the di"erence between active and churn?
“!ere’s much power to be found in the churn model,” he noted.
Compan ies can also use an acquisition model: Who sub-scribes? Who doesn’t? In general, the more interaction readers have with the brand, the more likely they are to subscribe.
Finally, turn the data into real-time action.
“Build reach and create relevance,” Milbou said. “Go from one-size-#ts-all to segmented o"ers.”
Of course this isn’t easy. Using Big Data e"ectively never is. But understanding the relationship between better customer data management and a better business is a critical #rst step, he said.
Team, not individual, drives Scripps NetworksBy Brandon Tensley
No single employee can do everything an organisation requires to manage data, but successful companies can build comprehensive, cohesive and innovative teams.
!e term “data science” is admittedly broad and almost nebulous, but a few of its key components are that it encom-passes both business understanding and analytical capabilities, including statistical expertise, data architecture, coding and development skills.
It’s hard to #nd all of the above skills in one person. It may be easier to #nd a unicorn, said Laura Evans, vice president of audience development and data sci-ence at Scripps Networks.But newsmedia companies are in luck: Evans assured delegates there are many bene#ts of using a team.
!e easiest way to make this clear is with an example, she said. Site recommendation engines, for instance, are useful, but “they can take up a lot of a site’s real estate.” Moreover, organisations don’t always know how e"ective the engine is at warding o" missed-clicks, and, according to Evans, “what peo-ple click on a site is just as important as what they don’t click.”
!ere are six steps that Scripps Networks used to surmount this particular obstacle, she said:
• Understand and be clear about what the company wanted to achieve
• Create a data warehouse and extraction options for data processing
• Review and analyse the data collected in order to
determine what key metrics and associations drove the desired behaviour
• Create an algorithm that re&ected the optimal content path
• Build an algorithm so it could be applied to user experiences
• Iterate base-level formulas to outpace the current vendor performance
If that’s too much to remember, then keep in mind these three things: “Capture and collection; report and analyse; and use and grow,” Evans said.
Reorganising Scripps Networks’ strategy around the data de-velopment lifecycle allowed the company to sidestep challeng-es and get on the path to success. Speci#cally, it clari#ed what works best, where, and with whom, which unearthed how to make site recommendation engines both more e"ective and more personal to users.
!ose replicating this process may learn a few more things along the way, such as patience and the importance of actually starting at the beginning in order to reach the end, and it’s important to not skip steps, she said.
!e takeaway? “I don’t have a data scientist,” Evans said. “I have a data organisation.”Each step of the process allowed Scripps Networks to tap
The Data Scientist
Linda Evans
Dirk Milbou
15
BIG DATA FOR MEDIA 2015
into individuals’ areas of expertise, which could range from statistical modeling to front-end development and anything in between.
“Don’t wait around for mythical, omniscient data scientists.” !ey’re probably not coming, she said.
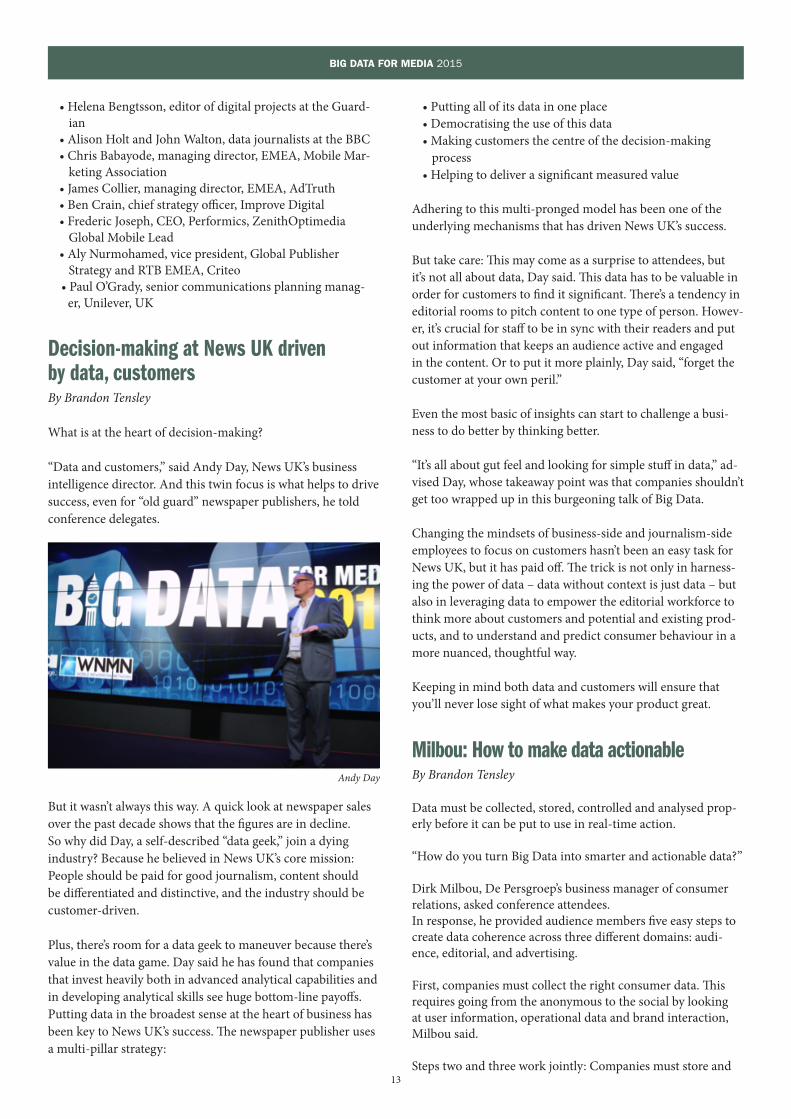
Economist: Personalisation drivinginsights and engagementBy Caroline Lees
At !e Economist, data is used to understand the customer and derive insights that drive engagement through content personalisation.
“Data is a new currency,” said Stéphane Pere, !e Economist’s chief data o%cer. “Our ability to collect and make sense of data at scale is very valuable.”
!e goal is to “increase advertising revenue and reduce costs using data,” he noted. Key questions remain, however; namely how can we make money from data, and how can we leverage data to drive value?
“We need to elevate data as a cor-porate asset, protect this corporate asset, and explore the potential unlocked by Big Data,” Pere said.
But where to start?
!e Economist uses data to achieve a single view of the cus-tomer and derive insights to drive engagement through per-sonalisation. It leverages its audience via its own platforms as well as external platforms beyond the company’s own websites.
“We build content people are willing to pay for to build our audience, and we give marketers access to that audience,” Pere said, describing !e Economist’s business model.
!at’s a lot of information, but Pere said he learned a key les-son when he started at !e Economist nearly 18 months ago: “It’s important to think big, but you need to start small.”
He noted his #rst move toward leveraging data was with reve-nue. “It is the best way to attract attention internally about the potential of data.”Changes to the media industry have hit advertising particu-larly hard. “!ere are so many more outlets online and our customers are spending more time elsewhere,” he said. “!is has a huge impact … we used to know our competitors but now nobody does.”
As such, he noted, “advertisers don’t need publishers anymore. !ey want to be publishers.” However, by leveraging data, these trends can be addressed in the following ways:
• Leverage media with data. “We used to sell media only. Now we have data about our readers that we can leverage.”
• Incorporate automation. “It is good to have data but you need to be able to activate the data and leverage it using inventory and price.”
• Companies can target the audience beyond their own channels.
• Embrace digital budgets. Re-target readers on social media, video, mobile, and search marketplaces.
• Use an integrated agency set-up. Run promotional and digital activities for advertisers looking for content solutions.
• Measure campaign impact ROI with reach and en-gagement.
!e Economist uses data to enhance engagement and lower “churn.” It also uses a personalised approach to leverage en-gagement and retention.
Pere described a new project that learns to identify when a subscriber is about to cancel a subscription. !e aim is to pick up on the signs when a subscriber loses interest. “When we notice the signs, we send a push noti#cation with per-sonalised content,” he said.
Pere acknowledged that data security and privacy is an ongoing concern. “We have to #nd the right balance.”
He said his job is to enhance the role of marketers at !e Economist, not
replace them. “We want to make it easier to scale and person-alise,” he said.
Since the appointment of a new editor at !e Economist, data is increasingly being used to support editorial. “!is is a huge shi$ for us,” he said, noting the new editor is committed to getting new readers and doubling the publication’s audience. “!e big change in the last two weeks has been that we are trying to understand what type of content is more appealing to readers.”
What’s next? Data can drive value and it “can bring a contribu-tion to the bottom line, but for this to happen you need a good organisational framework,” he said. “!ere is always a new solution coming in. Keep an open mind.”
Big, small data support Ringier’s digital transformationBy Caroline Lees
An assortment of Big Data and small data tools assist with content personalisation and recommendations, comment moderation, headline optimisation and consumer research at Ringier.
Stéphane Pere

16
BIG DATA FOR MEDIA 2015
“Ringier is a legacy media organisation, and our biggest challenge is digital transformation,” said Klaus Miller, head of digital research and analytics at the Zurich-based international media company, which publishes more than 120 newspapers and magazines internationally.
Ringier has developed a mobile and digital strategy. “It was a lot of work to get print editors to work with mobile and digital, but they are open to the change,” Miller told confer-ence-goers.
Ringier’s Big Data strategy was #rst developed in 2011. “We use data to understand why things have happened, and we also want to move toward predicting why things happen,” Miller said.
He said the company’s analytics work focuses on #ve key areas: mobile, social, video, advertising, and technology.“Big Data tools we use are real-time dashboards, comment moderation and the recommendation and personalisation of content,” he said.
Small data tools are reporting and content e%ciency, headline optimisation and consumer research.
Miller said the company uses real-time dashboards and an-alytics tools such as Chartbeat. !e company has also devel-oped its own tool called Life Monitor.
Data-mining tools used by Ringier to #nd news stories and determine social trends include Dataminr and Geofencing,
Source: Ringier, 2015 © World Newsmedia Network 2015
Ringier’s Blick: A study in Big Data implementationMonthly unique users
227,000 244,000 223,000 280,000 328,000
596,000798,000 816,000
912,0001,098,000
1,015,0001,079,0001,103,000
1,269,0001,189,000
Feb ’15Jan ’15Dec ’14Nov ’14Oct ’14Sep ’14Aug ’14Jul ’14Jun ’14May ’14Apr ’14Mar ’14Feb ’14Jan ’14Dec ’13
27%Social traffic
70%Mobile visits
Social media, mobile
65,430 fans 88,200 followers 220 Followers In Bearbeitung
Source: Ringier, 2015 © World Newsmedia Network 2015
Blick analyticsBig Data and small data feed into analytics strategy
Big Data Small dataReal-time dashboards and social trends
Reporting and content efficiency
Headline optimisation and search engine optimisation
Consumer research
Comment moderation
Recommendation and personalisation
Mobile
Optimisationof mobile
usage
Socialmedia
Maximisationof
social traffic
Video
Improvementof videogames
Creativeadvertising
Morevaluabletargeted
advertising
Technology
Usage of state-of-the-art
analytics tools
Blick analytics
1
2
3
4
5
6

17
BIG DATA FOR MEDIA 2015
a location-based so$ware. However, editorial decisions are still “driven by humans,” rather than data-mining so$ware, he said. Ringier editors also use social media and crowd-sourcing to create news stories.
Comment moderation is done by so$ware, which segments and analyses comments in real time, Miller said. !e tool #lters o"ensive language, using capital letters, and content, which makes comment moderation much faster and saves money.
Personalised content recommendations increases reader en-gagement, he said. Ringier uses semantic analysis and content tagging to better understand content consumption.
“We can tell if readers are male or female and what their inter-ests are. We can then use this to display personal recommen-dations on the website, based on the data, as a way to keep our readers on the page for longer.”
Ringier extends this behavioural targeting across platforms within the group’s extensive network, he said. “We use infor-mation across all our media brands within our networks, so if a reader looked at a car on one website, he would get a car ad on another.”
Another new tool Ringier uses is one that uses data to deter-mine which headlines work best.
“We found out that if you speak directly to readers using ‘you’ and with a good picture, they click through. We are trying to #nd out why,” he said. With this data, Miller said his compa-ny is better able to advise editorial sta" on creating e"ective headlines.
“We want to build this tool into the CMS, so that the system can pick the optimal headline,” he said. “!is will help us optimise our tra%c.”
Miller pointed out that making customers feel comfortable with data usage is important.
“We want consumers to share the data voluntarily … we do not force them to do this. It is important to help the user, and use their information to give them a better experience and better service,” he said. “We place a lot of emphasis on data security. We do not want to step across the line so that it does not back#re. We want a trusted relationship with the user.”
Miller ended the session with three key takeaways that has helped his company:
• Big and small data can help drive content engagement and revenues. !e editor should take responsibility for the article and help market the article
• Individualised and exciting user experiences increase consumers’ willingness to share personal data. !ere has to be something in it for the reader
• User is king, so guarantee data security and good data governance
AdTaxi: Programmatic advertising drives higher revenuesBy Brandon Tensley
Programmatic advertising is one piece of a bigger sales model, and in the digital realm it o"ers opportunities not contained by physical borders.
How can companies use data-driven programmatic adver-tising buying to increase revenue? “!is is an important question,” AdTaxi president Kirk MacDonald told delegates, “because this is the #rst time legacy media companies have the opportunity to go outside of their countries.”
It’s the end of geography: If your business is a digital company, then your geography has no borders, he said.
Programmatic advertising is the pairing of data and media on the right platforms, Mac-Donald explained. Real-time bidding is a subset of pro-grammatic, which #ts into a broader sales model that includes the following:
• Local newsmedia (display, mobile, and video)• Social media, native advertising, and e-mail marketing• Programmatic• Search marketing
MacDonald hones in on programmatic, integrating adver-tising campaigns with a blend of display, mobile and video through limitless sources. Data is about campaign perfor-mance using demand platforms.
“It’s about possibilities and not about boundaries,” MacDonald concluded. Programmatic is a customer experience, not mere-ly a marketing strategy. If they are leveraged e"ectively and e%ciently, programmatic advertising and real-time bidding data matter for a publisher’s pro#tability and targetability.
Globe and Mail: Big Data roadmapBy Brandon Tensley
Big Data strategy is evolving, and Greg Doufas, vice president of data science and audience intelligence at !e Globe and
Klaus Miller
Kirk MacDonald

18
BIG DATA FOR MEDIA 2015
Mail, has laid out a roadmap for harnessing the power of Big Data.
Businesses hoping to harness the power of Big Data need to understand and implement the organisation’s Big Data objec-tives, develop an appropriate sta", acquire the right data assets and manage the data infrastructure, he said.
“I’m not really a data guy,” he told conference delegates, “but a businessman who under-stands the power of data and how it relates to doing good business.”
First, it is critical to start with business objectives. !at is, what are a company’s intentions and values? Figuring this out requires being transparent and understanding evolving audience metrics. Businesses should also increase engagement, or optimisation, and #gure out how this #ts into lifecycle management.
Second, these objectives aren’t important without talent. One of the core competencies is Web or digital analytics, which is focused on tools. !e second is data science, which is a disci-pline that uses exploratory and predictive modeling, machine learning, and data engineering, he said.
!ird, data assets are key to the roadmap. Digital logs (such as tra%c or events), registration/#rst-party/third-party, and billing (transactional) are a few examples of data sources.
And fourth, businesses shouldn’t forget infrastructure, which includes analytical and reporting tools (such as Adobe Analyt-ics, Google Analytics) and data science (Python, R, and other cloud-based tools).
Using the above balanced, clear and concise plan can help practitioners drive an e"ective capability within their organ-isations to acquire an audience, engage and stimulate these people, and retain them over time. Big Data strategy is evolv-ing, and it’s time to embrace it, he said.
Narrative Science: Data-driven contentBy Caroline Lees
!ough insightful, automated journalism is unlikely to replace traditional journalism, automated programmes can help news organisations tell what their customers like based on be-haviour in social media. However, there are still uncertainties that rely on human judgment.
Larry Birnbaum, a professor of computer science at North-western University, and one of the masterminds behind Narra-tive Science, a Chicago startup, enables the automated creation of stories from data.
“It is clear that there is a lot of data and a lot of stories in that data, but it is not easy to #nd them,” he said. “I tend to start with a question.”
In his talk, titled “Finding and Telling Stories at Internet Scale,” Birnbaum outlined a number of free tools to exploit free data built by journalism and computer science students at Northwestern University.
!e #rst, TweetCast Your Vote, is an engagement tool used to predict how a user will vote according to their tweets. Type in any name and it will search for key words used in that person’s tweets.
LocalRx (local recommendations) is another tool, also based on tweets, which currently only works in the United States and in Barcelona. “It can tell you what people who patronise your business are tweeting about, which helps business owners to
build a pro#le of their custom-ers,” Birnbaum said.
Another, NewsRx (news recommenda-tions), aggre-gates news stories based on tweets. For ex-ample, if a user regularly tweets
about food, news stories about food or restaurants could be recommended.
Birnbaum pointed out these tools allow access to free data because they are based on Twitter, an open platform.
“If you are !e New York Times or [!e Times in London], you have a lot of access to data about your readers. Small pub-lications do not have a lot of data about their readers,” he said. “By using these tools, you can #nd out about your readers. All you need are their Twitter handles.”
Birnbaum said these mechanisms were relatively simple to build. “It only took 50 lines of code to build them. !e #rst version of NewsRx was built by four undergrad students in 10 weeks.
“Another system we built is Local Angle to help locally relevant stories surface in national news. It goes through a news feed, pulls out names from the feed, then #nds locations
Greg Doufas
Larry Birnbaum

19
BIG DATA FOR MEDIA 2015
associated with the people mentioned, and it sorts stories into local areas,” he said. Birnbaum described other tools includ-ing Buzz Lite and Quill Connect, which also analyse Twitter behaviour.
Birnbaum also described his work for Narrative Science, a U.S. technology startup company that builds algorithms to write stories from data. Most of the stories created by algorithms currently are based around sports reports and #nance news.
“!e critical thing is working out what to say and how to say it. We use a language generator,” he said. “Clichés are great because people get them. Clichés are good.”
He said automated journalism is unlikely to take the place of human journalism, but he acknowledged that there are still uncertainties around automated journalism. “A lot of the work the company is doing is not traditional journalism,” he pointed out.
In answer to a question about legal problems that might arise when an algorithm describes a company as “performing bad-ly,” Birnbaum agreed it was an unresolved issue.
Data journalism ultimately about storytellingBy Caroline Lees
Instead of letting Big Data overwhelm, journalists should hone in on details to #nd uncovered stories.
Helena Bengtsson, editor of digital projects at the Guardian newspaper, does not like the term Big Data. “I don’t talk about Big Data,” she told delegates. “I do ‘large data’ for journalism. Big Data is complex, and you can’t process it using traditional tools.
Bengtsson gave a number of examples of how Big, large and small data have been used in journalism in stories at the Guardian and worldwide.
!e #rst, Reading the Riots, the product of a collaboration between the Guardian and the London School of Eco-nomics, was based on data acquired by analysing 2.5 million tweets during the 2011 London riots.
She also mentioned the Centre for Public Integrity’s data journalism project, Cracking the Codes. Based on data gath-ered from 84 million Medicare claims in the United States, it revealed that medical providers were getting extra Medicare fees by exaggerating medical claims.
Bengtsson then discussed a project based on Big Data con-ducted by Japanese Broadcaster, NHK. !is consisted of a series of documentaries based on “disaster data” around the 2011 Japanese earthquake and tsunami. NHK analysed reconstruction and recovery e"orts using Big Data, including demographic trends based on mobile phone signals, which showed where people were living a$er the disaster.
!e data journalists collected and analysed information from 750,000 company computers, revealing that 20,000 business connections were lost a$er the earthquake. !ey also stud-ied movement of tra%c in the period a$er the disaster, using signals from car satellite navigation systems.
Bengtsson said that, although it was an example of excellent data journalism, NHK was able to use data journalists would not normally be able to access, she said.
!e data in the WikiLeaks Iraq war logs, on the other hand were “the most exciting database I have ever worked with,” Bengtsson said.
“We analysed it using traditional and non-traditional meth-ods,” she said. “One of the reasons I love data journalism is that it helps me to pick that needle out of the haystack. It is about #nding the story, #nding the detail, more than #nding the trends.
“We could have found more stories from the WikiLeaks data if we had had some of the tools we have now,” she said.
Asked by an audience member for advice on how to persuade reporters not to be afraid of data, Bengtsson answered: “I don’t know why journalists think it is too di%cult for them. I #nd it ba'ing that journalists can take on the complexities of stories, yet when you try to teach them to understand an Excel #ve document, they panic.”
But, she said, as data journalism becomes more widely prac-tised, the better journalists will become pro#cient. “We just need stories, stories, stories,” Bengtsson said.
BBC: Data-driven public service tool draws traf!cBy Caroline Lees
!e BBC used publicly available data to create a tool to help its audience understand a new government policy about fund-ing social care in the United Kingdom and attracted 400,000 interested users in the process.
Alison Holt and John Walton of the BBC used data journalism to build a Care Calculator for the BBC’s website using publicly available data. !e Care Calculator was designed to help the public understand a new government policy about funding social care in the United Kingdom.
Working with a team of three journalists, a data analyst, a Web
Helena Bentsson

20
BIG DATA FOR MEDIA 2015
designer and a Web developer, the project was an attempt to model the government’s policy. It took one year to build.
“We wanted to boil down all the information and numbers and present it to the audience in a way that wouldn’t terrify them,” Walton told delegates at the conference. “We needed to make sure that when we had #nished, people could under-stand it and use it.”
!rough extensive user testing and re-testing, the team identi#ed two key groups of people who would be using the Care Calculator: those older than 65 and their grandchildren, or children, looking at the calculator on their behalf. When it was launched, the Care Calculator had one million unique browsers, and 400,000 active users.
Here’s how it works: Users input their postal code into the calculator on the BBC’s website and are given an estimated cost of residential care. !ere is also a means test with about seven detailed, personal questions about home ownership and income – questions the government would take into account. !e #nal #gure informs users how much social care could cost them under the government’s new policy.
Holt, also speaking at the conference, said the motivation for building the Care Calculator came from the complexity of the subject. She had been asked to explain the new policy on BBC’s Today programme, but had found it di%cult.
“We needed to get to the core of changes to social care policy and explain them in an accessible way,” Holt said. “We believe the Care Calculator is a good example of using data for public service broadcasting. We might think that social care has little to do with us, but we probably all know someone it will impact at some time.”
Walton said the data used by the BBC team was all publicly available.
“!e data wasn’t particularly big, or particularly glamorous. It was more utilitarian than that. Data projects can be messy, complicated and time consuming, but at the end of the day, they are worth it,” he said.
Walton closed the session with advice for those thinking of initiating a similar data journalism project: “If you have a good idea, don’t let complexity throw you. Data projects are o$en lengthy, but they can o"er a unique insight for audienc-es,” he said. “If you are going to spend all this time and e"ort you need to make sure that when somebody sees the Web page they know what to do with it.”
Data should tell stories, stimulate interestBy Brandon Tensley
Big Data can be overwhelming and di%cult to comprehend when simply presented as a collection of numbers. Finding a way to illustrate this information makes it much more appeal-ing to people.
Data is much more than simply a collection of numbers. “It’s all about the human side of data,” Netherlands-based TULP Interactive’s data experience designer Jan Willem Tulp told delegates . Tulp made the convincing case that data visuali-sation – present-ing data in a way that users under-stand – is becom-ing increasingly important to understand and communicate in a data-driven world.
But why would someone want to visualise data? It’s simple: Humans work best when abstract concepts and data can be digested and stored without too much di%culty.
Tulp was quick to head o" the next question: “What makes a good visualisation?” !e bad news is the answer is, in part, “it depends,” he said. !e good news is Tulp provided some direction.
First, remember that content should explain by presenting insights and explore by helping audiences to discover these in-sights. Data, in other words, should tell a good story and make an impression. Ideally, Tulp said, people will be le$ thinking, “Wow, this story is really big and important!”
And second, visualisation should ask several key questions:
• It should ask “what?” What type of data are you dealing with? What is its availability? What are its attributes?
• It should ask “why?” Why do users want this data? Why do they want certain types of it?
• It should ask “how?” How is the data arranged? How is it manipulated?
!ere are lots of questions to turn over, and these questions churn out lots of possibilities.
Tulp concluded with some advice about how to put the con-cept of visualisation into action: Primarily use prototypes, and #gure out both what’s worked and what hasn’t. Entrepreneur-ially spirited visualisers should keep in mind that real data should be used to create various sorts of data visualisations, but the main thing to keep in mind is aesthetics.
In fact, even in his presentation, Tulp’s beautifully designed data-visualised charts and schematics shone a light on the importance of techniques and technologies used in creating engaged and engaging data visualisation.
Jan Willem Tulp
21
BIG DATA FOR MEDIA 2015
Closing panel: Data and mobile offer opportunitiesBy Caroline Lees
A panel of executives from media, technology and advertising companies agreed that media alliances and consumer focus are important for monetising Big Data. !e future of Big Data monetisation will likely require better cross-device tracking, a focus on the people who use mobile devices and media alli-ances that share data.
Members of the closing panel at the conference discussed how newsmedia companies can attract mobile advertising revenue through the understanding and application of Big Data and analytics about their audiences.
In a wide-ranging discussion, panelists Chris Babayode, man-aging director, EMEA, Mobile Marketing Association; James Collier, managing director, EMEA, AdTruth; Ben Crain, chief strategy o%cer, Improve Digital; Frederic Joseph, CEO, Per-formics, and ZenithOptimedia Global Mobile Lead; Aly Nurmohamed, vice president, Global Publisher Strategy and RTB EMEA, Criteo; and Paul O’Grady, senior communications planning manager, Unilever, UK, all had a chance to discuss their insights into the barriers to monetisation in mobile and the need for publishers to take control of their data.
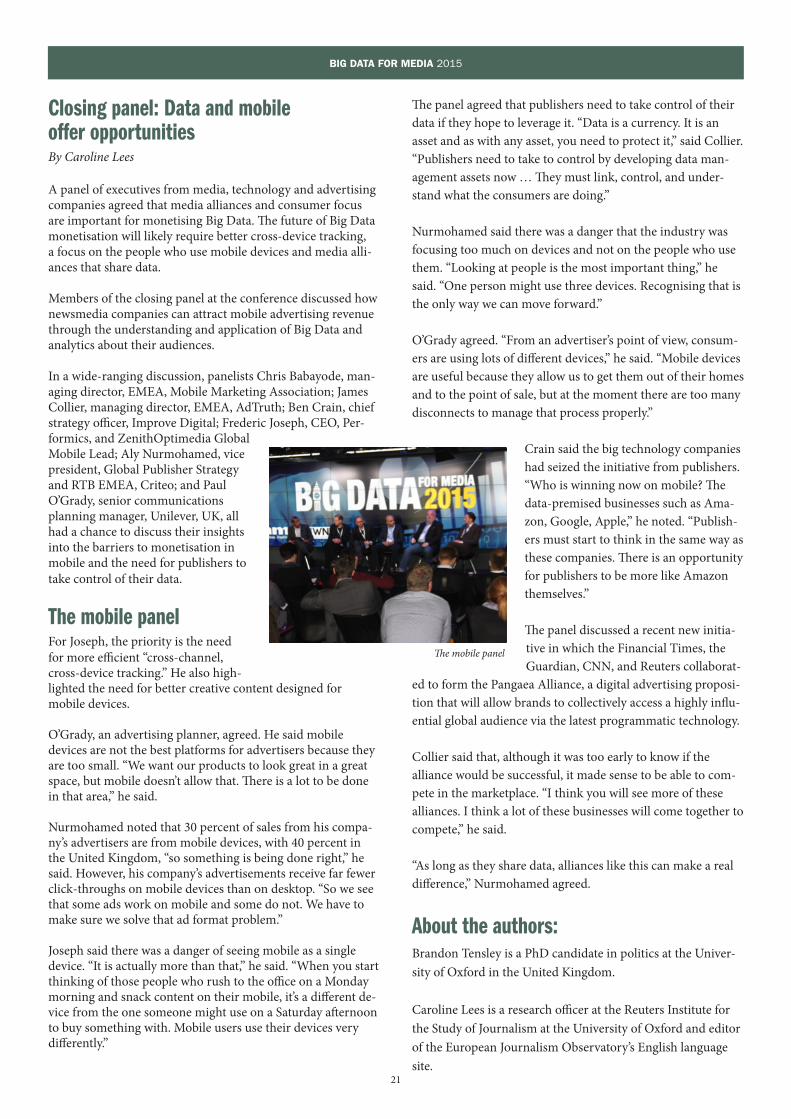
The mobile panelFor Joseph, the priority is the need for more e%cient “cross-channel, cross-device tracking.” He also high-lighted the need for better creative content designed for mobile devices.
O’Grady, an advertising planner, agreed. He said mobile devices are not the best platforms for advertisers because they are too small. “We want our products to look great in a great space, but mobile doesn’t allow that. !ere is a lot to be done in that area,” he said.
Nurmohamed noted that 30 percent of sales from his compa-ny’s advertisers are from mobile devices, with 40 percent in the United Kingdom, “so something is being done right,” he said. However, his company’s advertisements receive far fewer click-throughs on mobile devices than on desktop. “So we see that some ads work on mobile and some do not. We have to make sure we solve that ad format problem.”
Joseph said there was a danger of seeing mobile as a single device. “It is actually more than that,” he said. “When you start thinking of those people who rush to the o%ce on a Monday morning and snack content on their mobile, it’s a di"erent de-vice from the one someone might use on a Saturday a$ernoon to buy something with. Mobile users use their devices very di"erently.”
!e panel agreed that publishers need to take control of their data if they hope to leverage it. “Data is a currency. It is an asset and as with any asset, you need to protect it,” said Collier. “Publishers need to take to control by developing data man-agement assets now … !ey must link, control, and under-stand what the consumers are doing.”
Nurmohamed said there was a danger that the industry was focusing too much on devices and not on the people who use them. “Looking at people is the most important thing,” he said. “One person might use three devices. Recognising that is the only way we can move forward.”
O’Grady agreed. “From an advertiser’s point of view, consum-ers are using lots of di"erent devices,” he said. “Mobile devices are useful because they allow us to get them out of their homes and to the point of sale, but at the moment there are too many disconnects to manage that process properly.”
Crain said the big technology companies had seized the initiative from publishers. “Who is winning now on mobile? !e data-premised businesses such as Ama-zon, Google, Apple,” he noted. “Publish-ers must start to think in the same way as these companies. !ere is an opportunity for publishers to be more like Amazon themselves.”
!e panel discussed a recent new initia-tive in which the Financial Times, the Guardian, CNN, and Reuters collaborat-
ed to form the Pangaea Alliance, a digital advertising proposi-tion that will allow brands to collectively access a highly in&u-ential global audience via the latest programmatic technology.
Collier said that, although it was too early to know if the alliance would be successful, it made sense to be able to com-pete in the marketplace. “I think you will see more of these alliances. I think a lot of these businesses will come together to compete,” he said.
“As long as they share data, alliances like this can make a real di"erence,” Nurmohamed agreed.
About the authors:Brandon Tensley is a PhD candidate in politics at the Univer-sity of Oxford in the United Kingdom.
Caroline Lees is a research o%cer at the Reuters Institute for the Study of Journalism at the University of Oxford and editor of the European Journalism Observatory’s English language site.
"e mobile panel

39
GLOBAL SOCIAL MEDIA TRENDS 2015
the worldwide magazine media associationwww.!pp.com/Insight