Embed Size (px)
DESCRIPTION
Presented by Colin McNaught, AEA 19 September 2012
Citation preview

Financing Renewable Energy
Session 1
Colin McNaught

Aim
Introduction of main finance options and key concepts
How finance options shape a project
Increase your fluency in finance matters
In short: How would you like to pay for that?
2

Scope
Focus is on renewable energy
– Solar, Wind, Hydro, Biomass etc.
– Investment up to around £10 million:
Wind: Up to 7 MW
Solar: Up to 6 MW (small projects)
Hydro: Up to 3 MW
Key concepts also apply to energy efficiency
3

My Background
Energy sector experience over 20 years
Energy efficiency, CHP & renewables
Financial models for wind, solar, anaerobic digestion
Background in engineering – so presenting finance from a different perspective
4

Your Background
Internal Finance?
5
External Finance?
Renewable Energy?
Mortgage?

Agenda for Part 1
The Drivers – why invest and finance a project?
Risk and Reward
Finance Options
Decision Tree
6

Types of Drivers
Reduce energy bills
Invest capital and generate financial returns
Reduce greenhouse gas emissions
Improve corporate image
Enhance energy security
Address fuel poverty
7

8
Motivation Main benefits Influence on the set up of the project
Energy bills
Reduction in energy bills
Hedging against future rises in energy costs
Finance option which maximises and retains the value of energy generation potential should be selected.
Finance must be set up so that developers can use the energy for their own use.
Projects that supply onsite energy demand will inherently offer this.
Investment returns
Financial returns
Greater rate of return than investment in core activities
Finance option which maximises the rate of return on investment should be selected.
Different financing options and choices of incentive should be explored to determine the option that maximises such returns, without incurring significant risks.
Greenhouse gas emissions
Reduction in greenhouse gas emissions
Reduction in carbon footprint
The selected finance option, and any incentives claimed, will need to allow the carbon value of the renewable energy generated to be claimed.
Energy from waste or biomass electricity projects that recover heat as well as generate electricity may offer this.
Corporate image
Improved public perception of environmental values of the organisation
Finance option needs to allow the developer sufficient control over real or perceived environmental risks.
Finance should be setup so that local benefits are easily discernible and communicated in an appropriate manner.
Wind or solar PV projects may provide this opportunity.
Energy Security
Reduction in dependence on fossil fuels and electricity supplies
Reduction of UK imports of energy
If energy security required on site, systems should be engineered so that they can operate without a grid supply. This will add capital costs and should be weighed against the cost of energy supply interruptions.
For biomass and energy from waste this will require on site storage of sufficient fuel.
Fuel poverty
Energy security for poorer communities
Reduction in energy costs and impact of price rises
Finance set up should allow benefits of the project, e.g. lower energy prices or a profit share, to be passed on to the communities in need.
For example, the roll out of solar PV to housing stock.
See Copy of Guide: Page 4

Types of Drivers
Reduce energy bills
Invest capital and generate financial returns
Reduce greenhouse gas emissions
Improve corporate image
Enhance energy security
Address fuel poverty
9
Most of these drivers are based on the income that can be earned

Income from renewables
Feed in Tariff (FIT)
Electricity systems up to 5 MW
Solar PV, Wind, Hydro, Anaerobic Digestion…
Tariff for 20 years
Inflation indexed once registered
But reduces for new schemes in future years
Export tariff
10

Feed in Tariff – Non domestic schemes (since April 2010)
Income from renewables
11

12
Technology Band (kW) Tariff (p/kWh)
Hydro
≤15 21
15-≤100 19.6
100-≤500 15.5
500-≤2000 12.1
2000-≤5000 4.48
Wind
≤1.5 21
>1.5-≤15 21
>15-≤100 21
>100-≤500 17.5
>500-≤1500 9.5
>1500-≤5000 4.48
Solar
≤4 15.44
>4-≤10 13.99
>10-≤50 13.03
>50-≤100 11.5
>100-≤150 11.5
>150-≤250 11
>250-≤5000 7.1
Standalone 7.1
Export All 4.5
Current FIT Subject to change depending on rate of market growth Solar PV needs to be on a building with an EPC of D or better to earn > 7.1 p

Income from renewables
Renewable Heat Incentive (RHI)
Heat systems
Biomass, Ground Source Heat Pumps, Solar thermal...
Tariff for 20 years
Inflation indexed
13

14
Technology Band (kWth) Tariff (p/kWh)
Commercial Biomass
≤200 Tier 1 8.3
≤200 Tier 2 2.1
> 200 < 1000 Tier 1 5.1
> 200 < 1000 Tier 2 2.1
> 1000 1.0
Ground Source Heat Pumps
≤100 4.7
> 100 3.4
Solar Thermal all 8.9
Biomethane/biogas all 7.1
Current RHI Tier 1: < 1314 hours full load Tier 2: > 1314 hours

RHI – Non domestic schemes (since Dec 2011)
Income from renewables
15

Risk & Reward
Risk increases the cost of finance, restricts the options for finance and adds to the cost of obtaining finance.
Identifying and managing risk will improve all these finance issues.
Risk management may involve a partnership approach.
16

Types of Risk
Financial risks, capital costs, energy prices, credit risks and inflation
Development risks, the costs of undertaking feasibility and the risk of planning
Construction risks, construction costs and long lead in times
Technology risks, particularly around efficiency and reliability of the technology
Operational risks, operational and maintenance costs, fuel availability
Policy risks, changes to renewable energy policy and incentive structures = investment returns
17

18
Risk Description
Economic / Financial
Capital costs higher than budget
Operational costs higher than budget (including maintenance, interest rates and insurance)
Cost of finance higher than expected
Borrowing conditions breached and associated risks
Risks associated with energy price fluctuations
Carbon prices reduce
New competitors in the market
Rate of inflation
Currency risks (if cross-border projects, or if purchasing components in other currencies)
Development
Cost of resource assessment and feasibility studies
Cost of environmental impact studies, EIA reports etc.
Cost of grid connection assessments
Planning time longer – delay in generation income / possible lower incentive value received
Failure to gain planning consent
Development partners disagree and part company
Construction
Planning consent requires cost to comply with conditions
Construction costs higher than budget
Construction time longer, delaying income from generation
Connection to energy networks delayed
Environmental / social
Costs of impact assessment (often a legal requirement) higher than budgeted
Issues identified during impact assessment delay or prevent project development
Costs of mitigation actions higher than budgeted
Technology Technology less efficient than predicted, so less energy produced
Technology less reliable than expected, less energy produced and higher maintenance costs
Operational
Renewable energy resource is lower than predicted (e.g. lower wind speed)
Access to site prevents repair or maintenance
Replacement parts required
Delays in supply or installation of spare parts
Fuel costs higher than expected (e.g. biomass fuel costs higher or there is an increase in price of electricity for heat pump projects)
Fuel supply problems, (poor quality or interruptions in delivery)
Site energy use falls, reducing the value of avoided energy costs
Policy
Planning requirements changed
Capital grants removed or oversubscribed
Revenue incentive removed or reduced in value
Eligibility for capital grants or revenue incentives changed
Finance sector regulatory changes, reducing availability, and cost, of finance
Tax treatment changed
See Copy of Guide: Page 5

Assessing Risk
For each type of risk:
– How could your project be affected?
– How significant are the impacts?
– How could you reduce the risks?
– How could someone else reduce the risks?
19

Financing options
20
Type Examples
Own development
– Internal funding
– Debt finance
– Equity finance
– Leasing
Partnership structures
– Partnership – majority control
– Partnership – equal split
– Partnership – minority control
Third party
– Land lease agreements
– Service concessions
– Energy Service Companies (ESCOs)

Own Development
Greatest control + Rewards + Risks
Internal Funding
– Business Case and internal reviews
– May not be deemed core business
External Funding
– Grants or low cost loans
– May be incompatible with income from the FIT or RHI etc
21

Own Development
Debt Finance:
– Full ownership of rewards and risks
– Likely to be part of capex (so need internal funds)
– Added costs of interest payments
– Capital repayments
– May be step in-rights
22

Partnership Development
Many different forms of partnership
Different structures, benefits and risks
Majority control
– You closely control risks
– Partners bring niche skills or assets
Minority control
– Driver is not financial – reward share is low
– Partner controls
– Can you gain what you hope for without control?
23

Third Party
Transfer of almost all aspects
Best when you lack the skills and capital
Small income – e.g. land rent
24

Service Concessions
Useful for the public sector
Grant a right to develop and exploit a resource
Often long term (25 years)
Payments made to public authority
– (fixed + revenue elements)
Used for energy from waste contracts and other renewables
25

Choosing an Option
What are your drivers and expected outcomes?
Does the arrangement provide these outcomes?
Which risks are retained?
26

27
Own Development Partnership Third Party
Financial risks
Rate of inflation / Capital costs / Operational costs / Cost of finance / Borrowing conditions
All risks typically held by the developer.
Will depend on which party has access to the lowest cost of capital.
All risks typically held by the third party.
Construction risks
Longer planning time / Planning consent difficulties or costs / Construction costs / Construction delays
All risks typically held by the developer.
Potential to include some risks (e.g. construction time) in the contracts let.
Will depend on which party has responsibility for construction of the project.
All risks typically held by the third party.
Potential to include some risks (e.g. construction time) in the contracts let.
Environmental / social risks
Impact assessment costs / Delays due to impact assessment / Costs of mitigation
All risks typically held by the developer.
Will depend on which party has responsibility for construction of the project.
All risks typically held by the third party.
Technology risks
Lower technology efficiency / Lower technology reliability
All risks typically held by the developer.
Potential to manage these through warranty with the equipment supplier and through performance contracts with the equipment supplier.
Will depend on the setup arrangements for the project. Who has the experience of the technology and the allocation of benefits (in terms of energy savings and revenue streams from generation)?
All risks typically held by the third party.
Potential to manage these through warranty with the equipment supplier and through performance contracts with the equipment supplier.
Operational risks
Lower levels of resource / Repair or maintenance issues or delays / Higher fuel costs / Lower site energy use falls / Carbon prices / Market competition
All risks typically held by the developer.
Will depend on which party has responsibility for construction of the project, as well as on the setup arrangements for allocation of benefits.
All risks typically held by the third party.
Policy risks
Planning requirements changed
Changes in requirements or eligibility for: Capital grants / Revenue incentives / Tax treatment
All risks typically held by the developer.
Policy risks are out of the hands of the developer or a third party. Neither can manage these. So, appropriate to share these risks.
All risks typically held by the third party.
Some tax benefits for the third party – e.g. enhanced capital allowances.
See Copy of Guide: Page 11

Sources of Finance
Two main options – but many variants
On Balance Sheet:
– Part of normal activities of the organisation
Off Balance Sheet:
– Separate company who owns the asset
28

On Balance Sheet
Balance Sheet Debt
– Usually through a bank as a loan
– Banks have the first claim on the assets of a business (senior debt).
– Bank loans are lower risk = lower returns
– Two main types of bank debt:
Non recourse
Recourse
29

On Balance Sheet
Non recourse debt:
– Loan is secured on the value & income of the asset
– Bank focuses on the value and income of the asset
Will it perform? Will it break down?
– Added scrutiny on the asset
– Not as suitable for higher risk projects
– Lender will limit the risk e.g. 75% debt
– Fixed at outset, all consents etc. needed
– Often needs special purpose company
– Higher costs to set up
– Typically larger projects (> £25 million)
30

On Balance Sheet
Recourse debt:
– Loan is secured by the borrower
– Bank focuses on the credit status of the borrower
– May suit higher risk projects
– May not suit borrowers with high levels of existing borrowing
31

Practical example
Non recourse finance
– Large wind investments typically need 1 year of on site wind measurements + detailed analysis
– Cautious use of wind data
– Adds to development cost
– Adds to development timescale
– May miss higher incentives
Recourse finance
– Farmers securing loan for 1 MW wind turbines against the farm
– No met mast = saving 18 months + costs
32

Lessons from Non Recourse
The tests are tougher because they are external
Debt Service Cover Ratio: The operating cash flow compared to the debt payments?
– Aim for at least 1.3 : 1 in any operating year
Loan Life Cover Ratio: The operating cash flow compared to the debt payments over the entire term of the loan?
– Aim for at least 1:5 : 1
33

Lessons from Non Recourse
Debt Service Reserve: The cash kept to cover debt payments:
– In Project Finance – typically 6 months debt payments
Maintenance Service Reserve: The cash kept to cover maintenance:
– Often at least 3 months
P90 output: The output which will be exceeded 90% of the time.
34

Output and Cash Flow
Three hydro schemes in Argyll
Use bank thinking in the business case
35

Balance Sheet Equity
Raise funds by creating and selling new shares
Shareholders gain via:
– A share of the operating profits (dividends)
– Capital value in price of shares
– Must be possible to sell share – all investors need an exit strategy
36
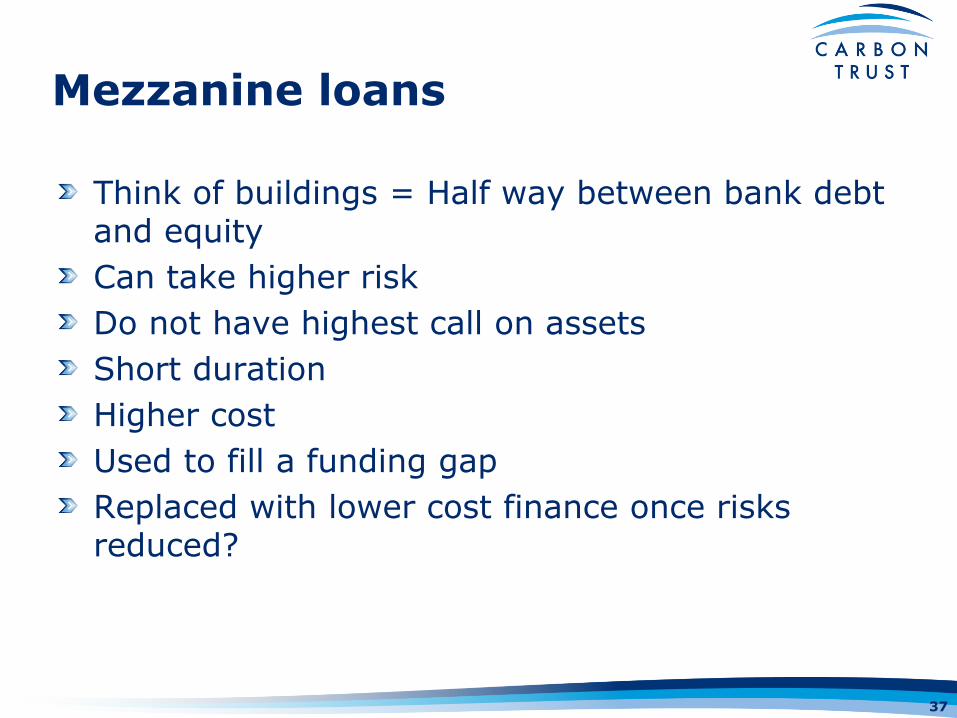
Mezzanine loans
Think of buildings = Half way between bank debt and equity
Can take higher risk
Do not have highest call on assets
Short duration
Higher cost
Used to fill a funding gap
Replaced with lower cost finance once risks reduced?
37

How much will finance cost?
38
Guide Page 14
Only an indication:
• Your project, your risks, your security, all influence the cost
Debt Equity
Type of finance Bank Senior Debt
Bank Mezzanine Debt*
Pension Funds* Infrastructure Funds*
Private Equity*
Type of risk typically taken
Proven technology
Established companies
Demonstrator / proven technology
New Companies
Proven technology
Proven technology
Private companies
Demonstrator technology
Typical level of return expected by the various types of lender / investor**
~5.5% to 6% ~7.5% to 10% ~15% IRR ~7% IRR ~35% IRR
39
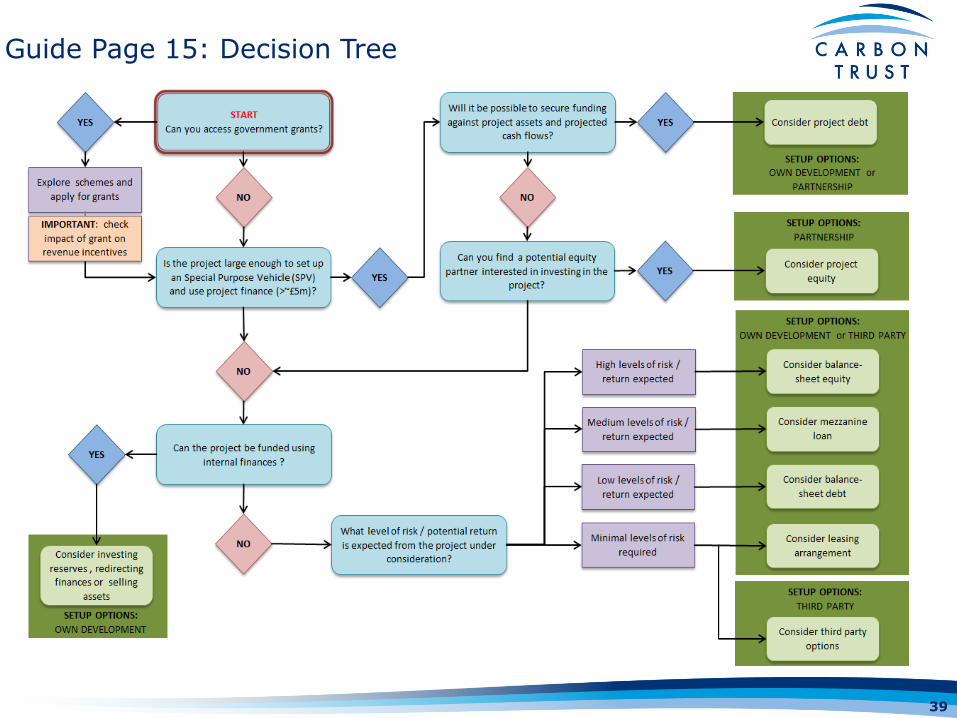
Guide Page 15: Decision Tree

QUESTIONS PLEASE
40

BREAK
41
Financing Renewable Energy
Session 2
Colin McNaught

Agenda for Part 2
Illustrations of the income and finance options for a renewable energy projects
More on incentives
Short case studies
Short exercise
43

Own Development
Risks
– Planning risk – upfront costs / 60% failure rate
– Requirement for equity can be as high as 30%
– Understanding project finance
– Selecting bankable technology –big issue under FIT
Benefits
– ‘Guaranteed’ income stream from electricity generation – regardless of use
– Energy Security – Generation of your own electricity for use on site
44
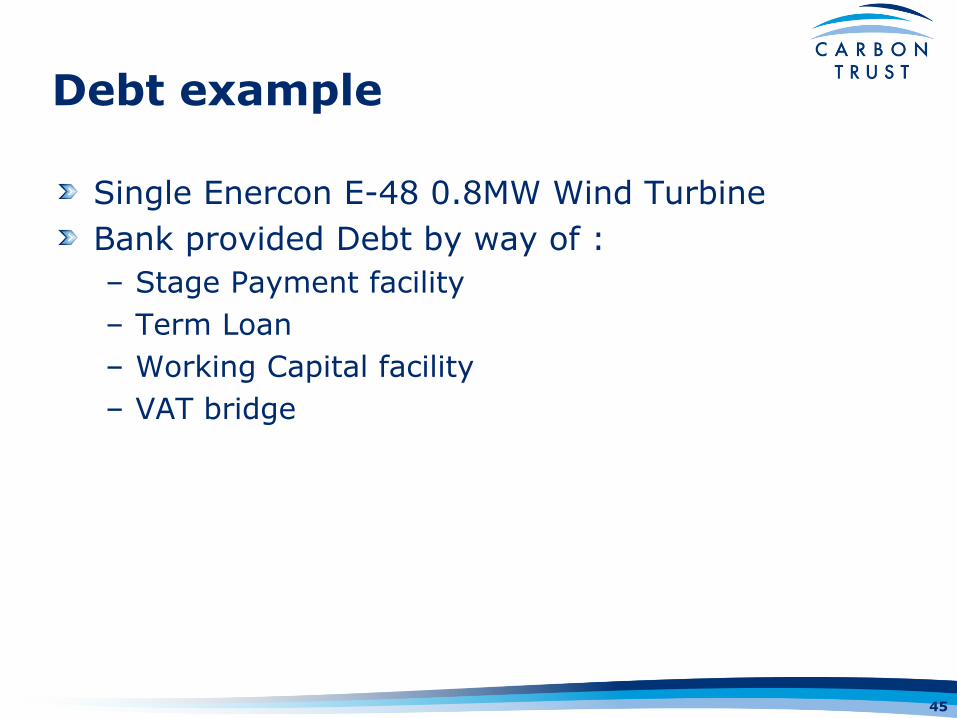
Debt example
Single Enercon E-48 0.8MW Wind Turbine
Bank provided Debt by way of :
– Stage Payment facility
– Term Loan
– Working Capital facility
– VAT bridge
45

Debt example (cont’d)
45 Documents to sign including :
– Banking documents
– Turbine Supply & Maintenance documents
– Land / Lease documents
– Grid Connection documents
– Planning documents (Section 75) / Decommissioning Bond
– Insurance documents
– Civils construction documents
46

Debt example (cont’d)
18 weeks to reach financial close
3 sets of lawyers (Bank, SPV and Landowners)
18 different Parties Involved
– Lawyers, Accountants, Technical Advisors, Insurance Advisors, PPA off takers, Turbine Suppliers, Civil Engineering Companies, Grid Connection provider, Project Manager /Planning Consultants, Wind Report Assessors.
Turbine/ project performance to be monitored continually
Which type of debt finance is this?
47

Project Finance Example
Bank will typically lend 70% - 90% of the project cost (dependant on technology )
Landowner will need to invest the remainder
Term of up to 15 years
Lend of between £1m and £25m
Lent against the forecast future cash flows
Bank will require legal, technical, financial and insurance overview
These costs to be met by the SPV – part of equity investment
48
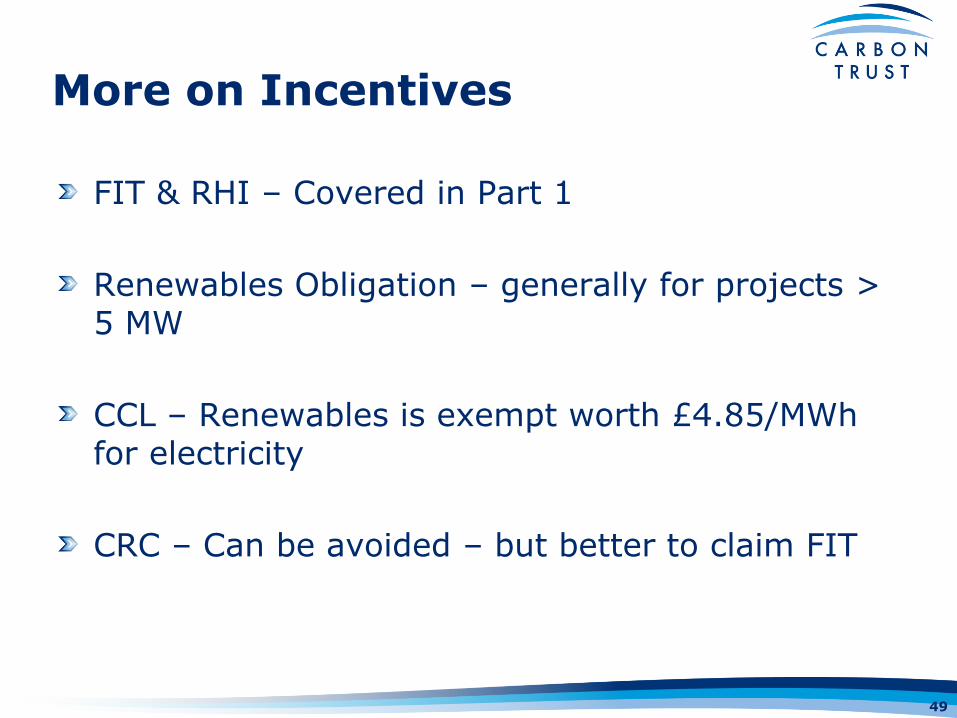
More on Incentives
FIT & RHI – Covered in Part 1
Renewables Obligation – generally for projects > 5 MW
CCL – Renewables is exempt worth £4.85/MWh for electricity
CRC – Can be avoided – but better to claim FIT
49

More on Incentives
EU-ETS – Large sites only, renewable heat would avoid purchase of fossil fuel and need fewer EU-ETS allowances
CCA – Larger sites – Cant claim if earn FIT or RHI
Public Capital Grants – Cant claim FIT or RHI
– Some expenditure is eligible (development, heating network)
– Private sector grants are OK
50

More on Incentives
Enhanced Capital Allowances – a benefit against corporation tax paid. Not available if FIT or RHI is earned
Business rate relief – Stepped by scheme size, 100% relief for small schemes, to 2.5%
51

Example
300 kW wind turbine
27% load factor = 710 MWh pa
372 tonnes CO2 pa
Capex £450k
Operating & Maintenance £13.2k
52

Example
Interest of 6.5% pa
Deprecation of 10%
Corporation tax 30%
53

Example – Scenario 1
Earn CRC at £12/tonne
CRC worth £4.4k
Electricity used on site worth £64k
Payback in year 14
IRR 9.6%
54

Example – Scenario 2
Earn FIT at 17.5p/kWh + 3.1p export*
FIT worth £124k
Export worth £22k
Payback in year 6
IRR 25.2%
55
* Guide and its examples were drafted when export tariff was 3.1 – this is now higher at 4.5p

Example – Scenario 4
Earn FIT at 17.5p/kWh + 9 p/kWh on site use
FIT worth £124k
On site use worth £64k
Payback in year 5
IRR 38.9%
56

57
Scenario 1 Scenario 2 Scenario 3 Scenario 4
Electricity used on site 100% 0% 40% 100%
Electricity exported 0% 100% 30% 0%
Electricity wheeled 0% 0% 40% 0%
CRC savings £4,467 - - -
Electricity savings on site £63,860 - £25,544 £63,860
FIT - £124,173 £124,173 £124,173
Export - £21,996 £6,599 -
Extra for Wheeling - - £20,455 -
Exempt Services - - -£1,500
Total revenue (Year 1) £68,327 £146,169 £175,271 £188,033
Payback by: Year 14 Year 6 Year 5 Year 5
IRR 9.6% 25.2% 30.5% 32.9%
NPV £104,875 £727,786 £957,422 £1,058,483
ROI 12.3% 29.5% 36.0% 38.9%
Guide Page 22
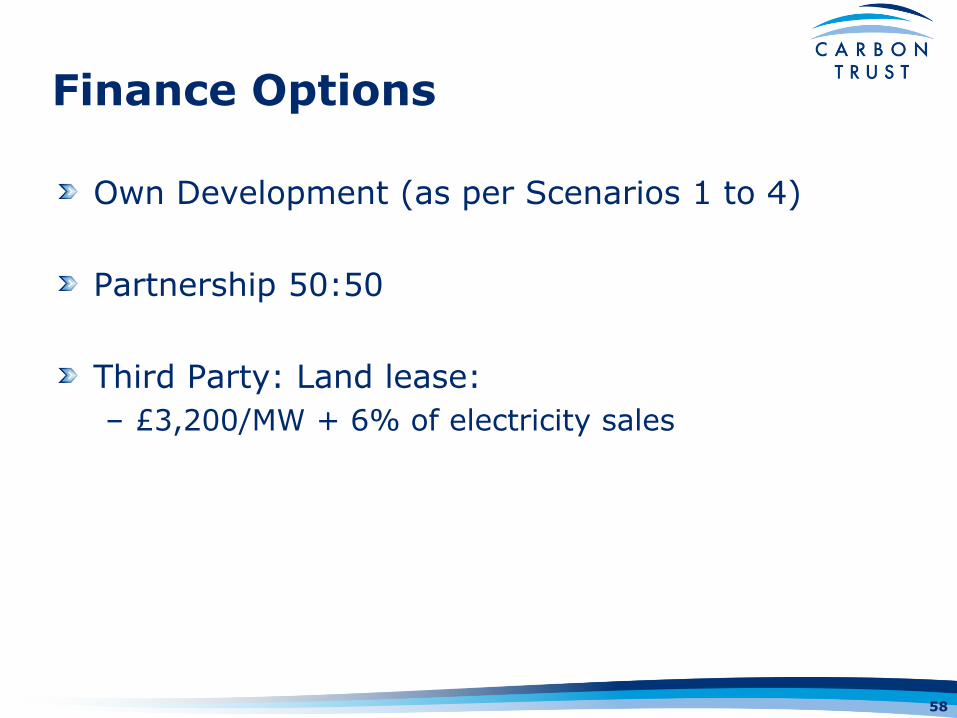
Finance Options
Own Development (as per Scenarios 1 to 4)
Partnership 50:50
Third Party: Land lease:
– £3,200/MW + 6% of electricity sales
58

59
Own development with debt finance
Partnership development with 50-50 split of risk and reward
Land lease arrangement with third
party developer
Annual turbine output 710 MWh 710 MWh 710 MWh
FIT value (generation & export) £206/MWh £206/MWh £206/MWh
FIT £124,173 £62,087 -
Export £21,996 £10,998 -
Land rent per MW - - £3,200
Percentage of electricity sales - - 6%
Land rental income - - £13,673
Total revenue (Year 1) £146,169 £73,085 £13,673
Payback by: Year 6 Year 6 N/A
IRR 25.2% 25.2% N/A
NPV £727,786 £363,893 N/A
ROI 29.5% 29.5% N/A
Guide Page 23

Worked Example
Company plans to build a 1 MW wind turbine on their warehouse site costing £1.5 million
Expect to generate 2,600 MWh pa.
The relevant FIT is 9.5 p/kWh generated
The export tariff is 4.5 p/kWh generated
Operation costs are 1.7 p/kWh generated
They are offered a finance on 75%:25% debt equity basis at 7% pa.
60
Knowledge Review
How much did they borrow?
What was the annual interest payment?
How much income (£/yr) from the FIT is due?
What is the net annual income?
61

Knowledge Review
How much did they borrow? – £1.125 million (75% x £1.5 million)
What was the annual interest payment? – £78.8k pa (7% x £1.25 million)
How much income (£/yr) from the FIT is due? – £247k pa (9.5 p/kWh x 2,600,000 kWh)
What is the net annual income? – (FIT + Export – Interest – O&M)
– (£247k + £117k) – (£78.8k + £44.2k)
– (£364k) –(£123k) = £241k
62
NB this is a Simple Example which did not include: • Repayments, Insurance, Business rates, Land rent , P90
Output etc.

Further Resources
Co-operative Bank; project case studies
Financing renewable energy projects; A guide for developers
Financing Renewable Energy Projects for Farmers
Private Financing of Renewable Energy; A Guide for Policymakers
West Midlands Local Authority Low Carbon Economy Programme; Local authority funding guide
Scottish Future Trust; Report on the Commercial Aspects of Local Authority Renewable Energy Production
63

Questions
0
0.5
1
1.5
2
2.5
3
3.5
00:00 02:00 04:00 06:00 08:00 10:00 12:00 14:00 16:00 18:00 20:00 22:00