Embed Size (px)
DESCRIPTION
VMWARE CP
Citation preview

Data Collection GuideCapacity Planner 2.6
VMware, Inc.3401 Hillview Ave.Palo Alto, CA 94304www.vmware.com
2 VMware, Inc.
Data Collection Guide
You can find the most up-to-date technical documentation on our Web site at
http://www.vmware.com/support/
The VMware Web site also provides the latest product updates.
If you have comments about this documentation, submit your feedback to:
© 2007 VMware, Inc. All rights reserved. Protected by one or more of U.S. Patent Nos. 6,397,242, 6,496,847, 6,704,925, 6,711,672, 6,725,289, 6,735,601, 6,785,886, 6,789,156, 6,795,966, 6,880,022, 6,944,699, 6,961,806, 6,961,941, 7,069,413, 7,082,598, 7,089,377, 7,111,086, 7,111,145, 7,117,481, 7,149,843, 7,155,558, 7,222,221, 7,260,815, 7,260,820, 7,269,683, 7,275,136, 7,277,998, 7,277,999, 7,278,030, 7,281,102, and 7,290,253; patents pending.
VMware, the VMware “boxes” logo and design, Virtual SMP and VMotion are registered trademarks or trademarks of VMware, Inc. in the United States and/or other jurisdictions. All other marks and names mentioned herein may be trademarks of their respective companies.
Data Collection GuideRevision: 20071207

VMware, Inc. 3
Contents
Preface 11Intended Audience 11Document Feedback 11VMware Capacity Planner Documentation 11Technical Support and Education Resources 12
1 Overview 13VMware Capacity Planner Description 13How Does VMware Capacity Planner Work? 14
Capacity Planner Collector 14Capacity Planner Data Manager 15Capacity Planner Information Warehouse 15Capacity Planner Data Analyzer 15Capacity Planner Dashboard 15
Tasks Performed by the Collector 16Discovery Process 16Inventory Data Collection 17Performance Data Collection 17Data Synchronization 17
About the Information Warehouse 18Detection of Performance Anomalies 18Data Upload and Processing 18
Network and Authentication Requirements 18Network Connections 19Capacity Planner API Overview 19
Discovery Process APIs 20Domains 20Servers 20
Inventory Collection API 20Performance Collection 20
Moving Ahead with Capacity Planner 20
2 Planning an Assessment 21Assessment Strategy 21Basic Assessment Process 21Project Road Map 22
Week 1 22Pre-Assessment 22Preinstallation 22Installation 23Data Collection Verification 23
Week 2 23Collector Management 23Data Analysis 23
Week 3 24Collector Management 24Data Analysis and Consolidation Scenarios 24

Data Collection Guide
4 VMware, Inc.
Week 4 24Consolidation Reports 24Assessment Report and Proposal 24Uninstalling 24
3 Preinstallation Requirements 25Personnel Requirements 25
VMware Capacity Planner Certification 25Windows and Linux and Unix Troubleshooting 25
System Connections 26Data Collection Methods 26
Network Troubleshooting 26Data Collector System Requirements 26
Data Collector Host System 27Host System Characteristics 27Determining the Number of Collectors to Install 27
Accessing the Capacity Planner Download 27Windows User Account for Collector Service 27
Target System Platforms 28Considerations for UNIX and Linux Collection 29
Security, Network, and Firewall Requirements 29Security Requirements 29Trusted Domains 29Account Privileges 29Stored Account Information 30Network Authentication 30Firewall Considerations 30Bandwidth 30
Preinstallation Checklist 31Assessment Team 31Collector Systems Information 31Target Systems Information 31Network Issues 32
4 Installing the Collector 33Installation Overview 33Downloading the Installation Package 34Installing the Collector and Data Manager 34
Performing a Clean Installation 34Upgrading an Existing Installation 35
Running the Setup Wizard 35Installing a New Collector 35Upgrading a Collector Installation 36
Upgrading a Version 2.x.x Installation 36Starting the Data Manager 37About the Collector Service 37Viewing the Status of the Collector Service 38Possible Installation Problems 40About Automatic Collector Updates 40
About Update Verification 40Scheduling Component Updates 41
5 Setting Up the Collector 43Introduction to the Data Manager 43

VMware, Inc. 5
Contents
Using the Setup Wizard 43About the Global Connection Account 44Running the Setup Wizard 44
Registering the Collector 45Local Collector Database ID 45
Setting Global Options 47General Tab 47
Global Connection Account 47Logging and Other Settings 47Host and Domain Masking (Data Privacy Feature) 48
Modules, Jobs, Connections, File Paths, and Collection Tabs 48Considerations for UNIX and Linux Collection 48Considerations for Collection from Microsoft Clustered Servers 49
6 Navigating the Data Manager 51Data Manager User Interface 51Basic Navigation 51
Main Data Manager Window 51Title and Status Bars 52Menu and Tool Bars 52
Navigation Pane 53Active and Inactive Objects 54Searching the Navigation Tree 55Adjusting the Width of the Navigation Pane 56Managing Objects in the Navigation Tree 56Collector Ownership 56
Details Pane 57Adjusting Display Areas in the Details Pane 59Refreshing the Details Pane 59
Message Pane 59Excluding Systems from Collection 60
Menu Structure 61File Menu 61View Menu 61Tasks Menu 62Reports 62
Inventory Descriptions Reports 63Inventory Reports 63Performance Reports 63Collector Reports 64
Admin Menu 64Options 64Collector Management 65Database Management 65Setup Wizard 65
7 Discovery with the Data Collector 67Discovery Overview 67
Discovery with Name Services 67Windows Internet Naming Service (WINS) 68Active Directory 68DNS 68
Alternatives to Naming Services 68

Data Collection Guide
6 VMware, Inc.
IP Scanning 68Manually Adding Domains and Systems 68Linux and UNIX Considerations 69
General Discovery Process 69Discovering Domains 70
Discovering All Domains 70Importing Domains and Systems 71Manually Adding Domains 72Deactivating Domains 72
Discovering Systems 73Adding Systems 75
Adding a New System Manually to a Group 75Adding Existing Systems to a Group 76
Working with Systems 76Testing System Connections 76
Reviewing Collector Status Reports 77Testing Windows System Connections 78
Working with Unknown Objects 78Deactivating Systems 79
Deactivating a System in the Navigation Pane 79Deactivating Objects from the Details Pane 79
Excluding Systems from Modules 80Configuring the Collector for UNIX and Linux Collection 80
PuTTY Application 80Validating Linux and UNIX Systems 80Linux and UNIX Collection 81
Scripts Used for Linux and UNIX Collection 81Manually Creating a crontab Entry When SSH Is Unavailable 82
Accessing the Discover Options 82Setting the Discover Options 83
Setting the Group or Domain Discovery Options 83Setting the System Discovery Options 83Setting the IP Subnets Options 84Setting the Active Directory Options 84Setting the DNS Domains Options 84Setting the Node Discovery Options 84
Scheduling Discovery Jobs 84About Discovery Tuning 84
8 Inventory 87Inventory Overview 87
Windows Management Instrumentation 87Remote Registry and Perfmon 88Secure Shell 88
Running Inventory Collection 88Accessing the Inventory Options 88Setting the Inventory Options 89
Setting the Inventory Collect Options 89Setting the Inventory Control Options 89Setting the Inventory Objects Options 90Setting the Inventory Import Options 90Setting the Inventory Export Options 90
Scheduling Inventory Collection 91Inventory Reports 91
VMware, Inc. 7
Contents
Inventory Descriptions Reports 92Inventory Troubleshooting Issues 93Refreshing Inventory 93
9 Collecting Performance Data 95Performance Overview 95Running Performance Collection 95Accessing the Performance Options 95Setting the Performance Options 96
Setting the General Performance Options 96Setting the Performance Collect Options 96Setting the Performance Control Options 97Setting Performance Counters 97
Scheduling Performance Collection 99Performance Reports 99
10 Data Synchronization 101Data Synchronization Overview 101
Information Warehouse 101Data Synchronization Process 101Data Processing Schedule 102
Accessing the Data Synchronization Options 102Setting Data Synchronization Options 103
Data Synchronization General Options 103Data Synchronization Import Options 103Data Synchronization Export Options 103
Scheduling Data Synchronization Jobs 104Viewing Your Data on the Web 104
11 Management Tasks 105Management Tasks Overview 105Setting Up Connection Accounts 105About Admin Options 106
General Tab 106Defining a Global Connection Account 106Setting Logging Global Options 107Setting Other Global Options 107
Modules Tab 108Jobs Tab 108Collection Tab 113File Paths Tab 113Connection Tab 114
Reports 114
12 Troubleshooting Capacity Planner 115Troubleshooting Overview 115
Tracking the Current Status and Activity 115Using Data Collector Log Files 115General Connection Issues 116
Firewalls 116Unmanaged Systems 116
Error Codes 116Discovery Troubleshooting 117
Bad Path 117

Data Collection Guide
8 VMware, Inc.
Unknown User 118Access Denied 118Administrator Privileges 118Testing the Access Paths 118Logon Server Not Available 119RPC Error 119Some Domains Not Discovered 119
Data Collection Issues 119Network Issues 120Service Failures 120Authentication Failures 120Problems Resulting from Decentralized Management 120Inventory Collection Using the Registry Only Option 121Issues with Inventory Collection from Windows Vista Machines 121Timeouts During Inventory Collection 121CD-ROM Drives Might Not Appear as Expected After Inventory 121Expected Performance Data Is Not Collected 121
Registry Only Collection 122Perfmon Collection 122Issues with Performance Collection from Windows Vista Machines 122
Limiting Groups of Systems Monitored by the Collector 122Useful Troubleshooting Tools 122
ping 123nbtstat 123net view 123net use 123Perfmon 123tracert 124Computer Management Utility 124Registry Editor 124PuTTY 124
Dashboard Access to the Data 124Data Does Not Appear on the Dashboard Web Site 125Collector Does Not Seem to be Sending Data 125
General Collector and Data Manager Issues 125Unsuccessful Database Compaction 125Purge Database 126Timeouts 126
A Error Codes 127Common Errors 127Data Collection Errors 127
Collection Through WMI 127General Data Collection Errors 129
Data Synchronization Errors 130Miscellaneous Errors 131
B Uninstalling the Data Collector 133Uninstalling a Collector System 133
Uninstalling the Collector Service 133Removing the Capacity Planner Application 134
Removing Data Files 134

VMware, Inc. 9
Contents
C Inventory Data 135
D Capacity Planner Performance Counters 139Performance Counters 139Derived Performance Counters 160
E Linux and UNIX Tools and Utilities 161Inventory Utilities 161Performance Utilities 162Commands Used for Linux and UNIX Inventory Collection 163Monitoring Tools 163
vmstat 163proc/swaps 164iostat 164netstat 165
Import Classes 165Import Class Details 165
F Linux and UNIX Scripts 171Running Scripts Manually 171Removing Scripts After Data Collection 173
Glossary 175
Index 181

Data Collection Guide
10 VMware, Inc.

VMware, Inc. 11
The VMware Capacity Planner Data Collection Guide introduces Capacity Planner and provides information about installing the client-side collector. After the collector is installed, this book guides you through steps required for Capacity Planner to assess the client environment.
Information about using the Web interface to Capacity Planner (the Dashboard) is described in the VMware Capacity Planner Dashboard Users Guide. The VMware Capacity Planner Dashboard Users Guide describes how to view the company inventory and performance data. The Dashboard guide also describes how to analyze the results to recommend consolidation and virtualization opportunities for the client.
Intended AudienceThe intended audience for this book is primarily technical VMware personnel (consultants, Professional Services Organization, training, support, and so on) and VMware partners who are responsible for installing and using Capacity Planner in assessment engagements.
Document Feedback If you have comments about this documentation, submit your feedback to:
VMware Capacity Planner DocumentationVMware Capacity Planner documentation consists of the following publications:
VMware Capacity Planner Data Collection Guide (this book)
VMware Capacity Planner Dashboard Users Guide
VMware Capacity Planner Release Notes
Documentation is available as PDF files that can be downloaded from https://optimize.vmware.com.
Abbreviations Used in FiguresThe figures in this manual use the abbreviations listed in Table 1.
Preface
Table 1. Abbreviations
Abbreviation Description
database VirtualCenter database
datastore Storage for the managed host
dsk# Storage disk for the managed host
hostn VirtualCenter managed hosts

Data Collection Guide
12 VMware, Inc.
Technical Support and Education ResourcesThe following sections describe the technical support resources available to you. You can access the most current versions of this manual from the Portal link on the Capacity Planner Dashboard. You must have a valid Dashboard user ID and password. The Dashboard is available at:
http://optimize.vmware.com
You can access other VMware documentation by going to:
http://www.vmware.com/support/pubs
Online and Telephone SupportUse online support to submit technical support requests, view your product and contract information, and register your products. Go to http://www.vmware.com/support.
Customers with appropriate support contracts should use telephone support for the fastest response on priority 1 issues. Go to http://www.vmware.com/support/phone_support.html.
Support OfferingsFind out how VMware support offerings can help meet your business needs. Go to http://www.vmware.com/support/services.
VMware Education ServicesVMware courses offer extensive hands-on labs, case study examples, and course materials designed to be used as on-the-job reference tools. For more information about VMware Education Services, go to http://mylearn1.vmware.com/mgrreg/index.cfm.
SAN Storage area network type datastore shared between managed hosts
tmplt Template
user# User with access permissions
VC VirtualCenter
VM# Virtual machines on a managed host
Table 1. Abbreviations (Continued)
Abbreviation Description
VMware, Inc. 13
1
The following topics are described in this chapter:
“VMware Capacity Planner Description” on page 13
“How Does VMware Capacity Planner Work?” on page 14
“Tasks Performed by the Collector” on page 16
“About the Information Warehouse” on page 18
“Network and Authentication Requirements” on page 18
“Capacity Planner API Overview” on page 19
“Moving Ahead with Capacity Planner” on page 20
VMware Capacity Planner Description VMware Capacity Planner is an IT capacity planning tool that provides analysis, planning, and decision support functionality. Delivered as a hosted application service, Capacity Planner enables comprehensive capacity planning, virtualization, and server consolidation assessments. These assessments help you advise clients how to:
Virtualize and consolidate data center infrastructure
Redeploy strategic IT assets
Optimize workload capacity utilization
Capacity Planner assessments are:
Consolidation Estimate (CE) - A step-by-step workflow that quickly guides you through setting up and conducting a new assessment. Within a week or so, you can present the customer with a report that recommends two potential consolidation scenarios. This is typically enough information for the customer to decide whether to conduct a full assessment.
Full Assessment - A thorough study of the customer’s IT environment conducted over a month or more. After completion of a full assessment, you can present a detailed analysis of potential savings to the customer available through consolidation and virtualization. You can also use findings from a consolidation estimate by converting your CE assessment to a full assessment.
Capacity Planner can help you make informed decisions because it:
Collects infrastructure data quickly without agents
Provides improved visibility of heterogeneous and complex IT environments
Delivers critical insights into resource utilization
Overview 1

Data Collection Guide
14 VMware, Inc.
At the core of Capacity Planner is a unique Information Warehouse. The Information Warehouse contains industry reference data that is used for comparative analysis and benchmarking to help guide validated server consolidation and capacity optimization plans.
How Does VMware Capacity Planner Work?VMware Capacity Planner components provide data collection, data analysis, decisioning, and monitoring capabilities. The collector and Data Manager reside on the client side. The Information Warehouse, Data Analyzer, and Dashboard reside at the secured central host site. The components are illustrated in Figure 1-1.
Figure 1-1. VMware Capacity Planner Architectural Overview
Capacity Planner CollectorThe collector is installed on a Windows system at the company site. (Specific system requirements are provided in Chapter 3, “Preinstallation Requirements,” on page 25.) The Collector runs as a Windows service, performing all of its jobs in the background.
Capacity Planner quickly discovers systems within your client company’s IT environment, collects detailed hardware and software inventory data, and collects key performance metrics from a target list of servers.
No agents are installed on any of the target systems. The target systems can be Windows, Linux, or UNIX systems as described in Chapter 3, “Preinstallation Requirements,” on page 25. For Windows target systems, collection is performed using standard Microsoft interfaces. For UNIX and Linux target systems, simple scripts collect inventory and performance information using Secure Shell (SSH) connections.
The Collector has an advanced scheduler that allows it to manage jobs that are submitted to run discovery, inventory, performance, and data synchronization modules at user-defined time intervals. For more information, see “Tasks Performed by the Collector” on page 16.
On the average, each Collector system can monitor approximately 500 systems in the network. Multiple Collector systems can be installed in the network, as deemed necessary. Chapter 3, “Preinstallation Requirements,” on page 25 addresses the various factors that are used to determine how many Collector systems will be required for an assessment.
InformationWarehouse
over 1 billionperformance
records
localcollectordatabase
secured central host site
Data Analyzer
data aggregationdata comparison
Dashboard
Web-basedanalysis and
reporting
Collector
discovery, data collection,
and datasynchronization
Data Manager
user interfaceto the
collector
collector host
company’snetwork

VMware, Inc. 15
Chapter 1 Overview
Capacity Planner Data ManagerThe Data Manager is the graphical user interface for the collector and is installed with the Collector. The Data Manager provides an organized view of the collected information, along with administrative control for the Collector.
The Data Manager configures the Collector components to:
Set up and maintain job schedules
Set user ID and password combinations for access to target systems
Manually perform jobs
View job progress, especially collection progress
Monitor execution messages that the Collector writes out
The Data Manager also:
Manages the process by which collected data is sent to the Information Warehouse
Provides detailed and summary views and reports on all discovered objects, collected inventory information, and monitored performance data
Enables you to start and stop the Collector
Capacity Planner Information WarehouseThe Information Warehouse is a secure and controlled central data warehouse that stores scrubbed data from all deployed collectors.
Information collected from each company’s server environment is stored in the Information Warehouse, along with aggregated information and metrics that serve as valuable industry benchmarks. You can use these benchmarks for comparative analytics and scenario modeling.
For a more in-depth discussion of the Information Warehouse, see “About the Information Warehouse” on page 18.
Capacity Planner Data AnalyzerThe Data Analyzer serves as the core analytical engine that performs the evaluation required for intelligent capacity planning. It includes advanced algorithms that extract data from the Information Warehouse to solve capacity optimization problems and support analysis capabilities such as:
Aggregation
Trending
Benchmarking
Scenario modeling and what-if analysis help model and test various planning scenarios, including:
Virtualization
Hardware procurement
Server consolidation scenarios
The Data Analyzer resides on the secured central host site along with the Information Warehouse.
Capacity Planner DashboardThe Dashboard is the Web-based user interface to the Information Warehouse and Data Analyzer. The Dashboard delivers capacity planning analysis and decision support in a secure and user-friendly manner. Through the Dashboard interface, you can:
Access your client company’s inventory and performance data in the Information Warehouse
Data Collection Guide
16 VMware, Inc.
View the status of data collection
Perform some remote data collection tasks
Access a rich set of pre-built analyses
View the polled information in a variety of useful ways
Produce standard and customized reports that include:
Performance monitoring and trending
Anomaly and alert detection
Consolidation opportunities and exceptions
Obsolete and redeployable servers
Scenario modeling (including “what-if” analysis and analysis of hardware that your client might be planning to buy but has not yet purchased)
To access the Dashboard, register with VMware to obtain a login ID and password. In addition, register the client company to have collected data correlated correctly for your assessment. Registration is usually completed with (or after) the purchase of assessment services from VMware. For more information, see Chapter 3, “Preinstallation Requirements,” on page 25.
Tasks Performed by the CollectorThe main tasks that the collector performs are: discovery, inventory data collection, performance data collection, and data synchronization.
In addition to these main tasks, the Execute Command task is provided. This optional task lets you schedule commands before or after one of the main tasks occurs. For example, before data synchronization, you can perform a command to retrieve additional data polled from other collectors and put this additional data in your outbox directory to upload with the new files. For more information, see “To specify a command” on page 108.
Discovery ProcessThe discovery process uses a combination of:
LanMan browser requestsLDAP requests for Active DirectoryDNS queries for legacy IP scanning
The discover task identifies:
DomainsSystemsWorkgroupsActive Directory nodes
Even though a system or node in the company’s network is discovered, collection of inventory or performance data from that system or node is not mandatory. Likewise, a node that is inventoried might not have performance data collected from it. The number of discovered nodes will probably be greater than the number of nodes that are inventoried or the number of nodes on which performance data is collected.
Domains can be excluded from any further processing. In this case, to proceed with inventory or performance data collection from the nodes in an excluded domain, the domain must be re-enabled for that subsequent
NOTE Use of the Capacity Planner Dashboard is documented in the VMware Capacity Planner Dashboard Users Guide.

VMware, Inc. 17
Chapter 1 Overview
processing. This setting is used because often a company does not want to inventory or collect performance data on all of the domains in their network. For more information, see “Deactivating Domains” on page 72.
Domains and systems can also be added manually to the collector database. Importing domain and system information from a comma-separated value (CSV) file is also an alternative method of getting the information into the database.
The discover task is run once manually after the collector is installed. It might be run subsequently on a schedule to determine whether additional nodes have appeared on the network and need to be discovered.
For more information about the discovery process, see Chapter 7, “Discovery with the Data Collector,” on page 67.
Inventory Data CollectionThe inventory task is run once manually after the collector completes the discover task. The inventory task collects data on any node that was not excluded after the discover task.
Inventory data collection from Windows systems is usually accomplished through Windows Management Instrumentation (WMI) first, and then by Registry connection, with the Collector connecting to each Windows system through an administrator-level user account.
For UNIX and Linux systems, inventory data is collected by using Secure Shell (SSH). Permissions are required. For more information, see “Considerations for UNIX and Linux Collection” on page 29.
The inventory task collects the following types of data:
Server informationMotherboard and chassis informationCPU (processor) informationRAM (memory) informationInformation on drives and adaptersFile system informationNetwork interface card informationInformation on applications and services
Inventory is multithreaded. If the inventory task cannot retrieve information from a node with one method, it tries alternative methods. The inventory process can be time onsuming. Messages on the progress of the inventory for each system are written to a log file.
For more information about the inventory process, see Chapter 8, “Inventory,” on page 87.
Performance Data CollectionThe performance job collects statistical information from all the discovered systems, as defined by specified or selected performance counters. Performance information is collected using one of two methods, as described in “Performance Collection” on page 20.
As with the other main collector tasks, the performance task is usually performed manually the first time. It is then scheduled to run repeatedly over a specified time period. The default scheduled interval is every hour.
The various aspects of performance data collection are discussed in Chapter 9, “Collecting Performance Data,” on page 95.
Data SynchronizationCapacity Planner collects data with the inventory and performance collection tasks, makes the data anonymous, and then uses the data synchronization task to transmit the data to the Data Analyzer for processing and storage in the Information Warehouse. In addition to the standard security offered with data anonymity, you can optionally mask server and domain names before data synchronization. In this case, names are replaced with a pseudonym to further protect your customer’s privacy.

Data Collection Guide
18 VMware, Inc.
Data synchronization normally occurs automatically every hour, but the first execution is usually performed manually after the first performance data collection is complete.
About the Information WarehouseCapacity Planner sends all collected inventory and performance data to the Information Warehouse where the Data Analyzer aggregates it. The Information Warehouse stores data collected from your client’s company as well as all companies from which recent data was collected. Having current industry performance data enables Capacity Planner to identify anomalies in the client’s company by comparing the performance of the company’s servers with similar servers in the industry.
Scoring of collected performance data is accomplished by determining how many standard deviations each statistic is from the industry average value stored in the Information Warehouse. The higher the number of standard deviations, the further the statistic is from the average.
Detection of Performance AnomaliesThe Data Analyzer generates performance anomalies that identify areas of potential improvement within applications. These changes might reduce resource consumption, and improve response times and service levels.
Anomaly detection allows industry performance averages to be used to provide a broad performance baseline. Anomaly detection helps to discover problems such as:
Poorly configured disk resources Excessive virus scanning on Exchange systemsBad index design on SQL Servers
By making performance tuning changes, you can help your client increase their company’s consolidation opportunities and improve current service levels. Part of a successful optimization and consolidation strategy is to improve a company’s processing environment so that they can experience these successes and feel confident about proceeding in the assessment.
For example, a company’s Exchange server might support only 200 active users efficiently. However, the Information Warehouse data might show that other Microsoft Exchange servers support 600 active users on a server with similar processor, memory, and disk configurations. The lower capacity of your client company’s Exchange server might indicate that a configuration or policy issue should be addressed. By limiting mailbox sizes and distribution lists, using replication, a RAID configuration, or virus scanning technique, the client might be able to increase the number of active users on that server.
Data Upload and ProcessingCompany inventory and performance statistic files are sent to the Data Analyzer at regular intervals; the default interval is one hour. The files must be loaded into the Information Warehouse before you can view the results through the Dashboard. This is a two-step process:
For efficiency, the raw performance statistics and inventory files are uploaded in bulk to staging tables as soon as they are collected.
Every 4 to 6 hours, the Data Analyzer processes the uploaded information in bulk. After this happens, you can view most of the information through the Dashboard. A nightly job analyzes the loaded information.
Network and Authentication RequirementsInstall the Capacity Planner Data Collector on a collector host with the following network/connection capabilities:
Authorized and able to connect to all the servers that it is to manage using the protocols and ports outlined in this document

VMware, Inc. 19
Chapter 1 Overview
Access to general purpose ports that Windows uses for most of its communications for file/print sharing and authentication; they range from 135-139, and 445 (See Table 1-1 for more information about port usage)
Account(s) with administrative rights to manage each server which can be a single account for all servers, an account per domain, an account per server, or any combination
Network ConnectionsThe collector system must be able to connect to all target systems by using specific protocols and ports. On Windows systems, the general-purpose ports 135, 137, 138, 139, and 445 are used primarily for file and print sharing and authentication. On UNIX and Linux systems, port 22 is required for Secure Shell (SSH).
The collector uses these ports first to pass credentials to a target system, and then to collect the actual data. Port usage is described in Table 1-1.
Capacity Planner API OverviewThis section provides an overview of the Capacity Planner APIs for discovery, performance, and inventory.
Table 1-1. Port Usage
Port Protocol Service Description
MS Windows Services That Use This Port
22 TCP/UDP SSH Used for secure logins, file transfers, and port forwarding
135 TCP/UDP Loc-srv/epmap Microsoft DCE Locator service, also known as End-point Mapper
DHCP ServerDNS ServerWINS Server
137 TCP/UDP Netbios-ns NetBIOS names serviceFirewall administrators frequently see large numbers of incoming packets to port 137. This is because of Windows servers that use NetBIOS (as well as DNS) to resolve IP addresses to names using the gethostbyaddr() function. As users behind the firewalls surf Windows-based Web sites, those servers frequently respond with NetBIOS lookups.
WINS ServerDNS Server
138 TCP/UDP Netbios-dgm NetBIOS datagramUsed by Windows, as well as UNIX services (such as SAMBA)Port 138 is used primarily by the SMB browser service that obtains Network Neighborhood information.
139 TCP/UDP Netbios-ssn NetBIOS SessionWindows File and Printer sharing
445 TCP/UDP DNS DNS Direct Hosting portIn Windows 2000 and Windows XP, redirector and server components now support direct hosting for communicating with other computers running Windows 2000 or Windows XP. Direct hosting does not use NetBIOS for name resolution. DNS is used for name resolution, and the Microsoft networking communication is sent directly over TCP without a NetBIOS header. Direct hosting over TCP/IP uses TCP and UDP port 445 instead of the NetBIOS session TCP port 139.
Active Directory

Data Collection Guide
20 VMware, Inc.
Discovery Process APIsThe discovery process uses two APIs; one for domains and one for servers. Both APIs require ports 135 through 139 to be open. If a WINS server is available, that server is used. Otherwise, the request is broadcast and the first browser service that responds provides the information.
Domains
The discovery of domains is accomplished using the WNet API (mpr.dll) of Windows NT and Windows 2000. This API uses the NetBIOS interface implemented by the Microsoft Lan Manager API to enumerate domains and other beneficial properties.
Servers
The discovery of target Windows servers is accomplished using the Netapi32.dll. This API uses the NetBIOS interface that the Microsoft Lan Manager API implements to enumerate servers of a certain class of system such as Workstation, Server, SQL Server, Cluster, or IIS.
Inventory Collection APIInventory is accomplished using WMI, Registry, and Perfmon API calls. The first thing that happens during an inventory collection is mapping an IPC$ resource to the remote system. This is done for authentication and for response time calculations.
After the IPC$ resource is mapped to the remote target system, the appropriate inventory method for target system platform is used to collect the information needed. The inventory methods include:
WMI—MS Windows 2000 / XP server data is usually collected using Windows Management Instrumentation control (WMI). WMI calls are carried over the standard NetBIOS or Direct Connection communications layers. These communications layers require ports 135 through 139 or 445 to be open.
Remote Registry and Perfmon—MS Windows NT 4.0 data is collected primarily with Remote Registry calls and Perfmon (for memory) calls. These communications layers require ports 135 through 139 to be open.
Performance CollectionPerformance information is collected using one of two methods; one method is for Windows and the other is Linux and UNIX. Windows performance collection allows you to add more counters. The performance collection methods are:
Perfmon—Windows data is collected using the Perfmon API, requiring the establishment of an existing authentication connection to any target system from which data is to be collected.
Perfmon calls are carried over the standard NetBIOS, requiring ports 135 through 139 or 445 to be open. (The Perfmon APIs themselves use ports 137 through 139.) WMI can be turned off on systems.
SSH—Linux and UNIX data is collected using SSH only. An SSH session is established and scripts are performed through that session or installed for later execution. If appropriate scripts are installed, the data is returned using Secure Copy (SCP).
Moving Ahead with Capacity PlannerCapacity Planner is a tool for assessment of a company’s environment. Before proceeding with an assessment, evaluate what the company wants to do, as well as what they need to do.
This requires the development of a thorough assessment plan, as described in Chapter 2, “Planning an Assessment,” on page 21.

VMware, Inc. 21
2
The following topics are described in this chapter:
“Assessment Strategy” on page 21
“Basic Assessment Process” on page 21
“Project Road Map” on page 22
“For tasks associated with or performed from the Dashboard, see the VMware Capacity Planner Dashboard Users Guide.” on page 24
Assessment StrategyA successful server consolidation assessment depends on understanding what you want to accomplish with the assessment. There are numerous reasons for conducting a consolidation assessment. The company’s IT infrastructure might be:
Operating at maximum capacity
The company wants to evaluate what is happening on every system in their network (such as, which systems are overused and which are underused) for confirmation of the perceived problems. With that information, the company can then explore the effect of server consolidation on their IT environment.
Experiencing physical expansion constraints
Expanding the company network might be constrained by space, power capacity, or weight limitations of the current data centers. It might be desirable to focus on assessing only older hardware and evaluate whether the loads currently handled by those older servers can be supported more effectively on newer state-of-the-art hardware, such as blade servers with virtualization.
Better service levels for databases
If service levels for databases are a concern, you can limit the assessment to those database servers with an emphasis on moving the load to larger, newer, more stable systems with greater memory resources.
Financially constrained and interested in saving money
The company wants to know how to use their current equipment more effectively, or if they can benefit from removing two or more older systems that are not performing well and consolidating the functions of those two systems onto a virtual machine. The assessment must focus on enough servers to show a return that is large enough to cover the actual cost of the consolidation.
Basic Assessment ProcessThe assessment process involves four basic phases:
1 Collecting data about the company’s network and IT infrastructure.
2 Monitoring and collecting performance data.
Planning an Assessment 2

Data Collection Guide
22 VMware, Inc.
3 Integrating collected data with existing data in the Information Warehouse for analysis.
4 Analysis of company’s data with comparison to other industry data, scenario modelling, and consolidation assessment.
After you understand the assessment strategy and company’s IT infrastructure, the first step using Capacity Planner is installing the collector system—the collector and Data Manager—on one or more computers at the company site. The number of installations of the collector system depends on the number of computers at the company that are part of the assessment. In some cases, only a single installation is required.
After a collector system is in place, it can monitor and collect the necessary inventory and performance data from a selected group of servers and other systems on the company’s network. Each collector system performs this process for the group of systems that it is monitoring. The collection of inventory and performance data is conducted over a specific period, as agreed upon with the company and Professional Services personnel involved in the assessment engagement.
As the performance data is collected over time, it is transmitted on a regular basis (typically, once an hour) to the Information Warehouse database, where it is processed and stored. As the data is collected.
Project Road MapThe successful assessment starts with an in-depth analysis and understanding of the company’s requirements and objectives. A team of IT professionals is needed to work together on the assessment, including at a minimum:
A person in the company who is completely knowledgeable about, and has access to, the company’s IT infrastructure.
A person who has in-depth knowledge of how to use Capacity Planner to perform the assessment, usually a systems engineer consultant who specializes in IT consolidations.
Initially, the team needs to make an accurate determination of the company’s IT infrastructure and goals, to understand the systems that are to be targeted for the assessment, and what is required to access those systems to collect the necessary data.
An assessment should take three to four weeks at a minimum for a comprehensive view of the company’s inventory and to collect significant data on how that inventory is performing. The following is a week-by-week description of the typical assessment process.
Week 1During the first week of the assessment, perform these tasks.
Pre-Assessment
Assess company objectives and requirements.
Review company activity.
Preinstallation
Compile a profile of the company’s IT infrastructure (networks, firewalls, routers, servers, security issues, operating system platforms, and so on).
Determine connection prerequisites (such as accounts and access rights).
Agree on which systems to observe for the assessment.
Determine the number of collectors to install and set up (typically one per 500 systems to be assessed).
Through the Capacity Planner Dashboard, register the company in the Information Warehouse.
Determine locations of the systems that will host the collector and Data Manager.

VMware, Inc. 23
Chapter 2 Planning an Assessment
Chapter 3, “Preinstallation Requirements,” on page 25 presents a complete discussion of the information that you must obtain, and the tasks that you must perform before the installation of the collector service and Data Manager.
Installation
For each collector:
Download the latest version of Capacity Planner from the Dashboard Web site.
Install Capacity Planner.
Configure the collector.
Perform initial discovery.
Test connections.
Resolve rights and firewall issues.
Qualify the domain and server list.
Verify communication to the Information Warehouse.
Verify performance counters.
Inventory the discovered systems.
Start performance collection.
Use the Capacity Planner Dashboard to register the local collector database with the Information Warehouse.
Verify processed data.
Verify data transfer to the Information Warehouse.
Set up scheduled jobs to:
Collect performance data.
Refresh discovery and inventory information.
Data Collection Verification
From the Dashboard, access and view initial data from the collector(s) in the Information Warehouse on the Support Dashboard page. See the VMware Capacity Planner Dashboard Users Guide for more information:
Week 2During the second week of the assessment, perform the following tasks.
Collector Management
At the collector, perform weekly management tasks:
Check on scheduled jobs.
Check collected data.
Adjust accounts and other access issues.
Check for any other network issues.
Correct any other problems that occurred.
Data Analysis
From the Dashboard:
Data Collection Guide
24 VMware, Inc.
View collected data.
Build inventory reports for the company.
Look at analysis reports and verify information.
Build performance reports for the company.
Group systems to identify organizational boundaries and assist in analysis of server loads and potential consolidation.
Monitor progress.
Week 3During the third week of the assessment, perform these tasks.
Collector Management
At the collector, perform weekly management tasks as described for Week 2.
Data Analysis and Consolidation Scenarios
From the Dashboard, continue as with Week 2. In addition:
Build and test consolidation scenarios.
Select appropriate models for consideration.
View reported anomalies and make recommendations.
Week 4 During the fourth week of the assessment, perform the following tasks.
Consolidation Reports
Near the end of the week (culminating a 30-day study), use the Dashboard to:
View data analysis and create appropriate recommendations.
Prepare supporting consolidation reports.
Assessment Report and Proposal
Prepare an assessment report and consolidation proposal for the company using the Dashboard consolidation reports as supporting data.
Uninstalling
Optional. Shut down and uninstall the collector installations.
For tasks associated with or performed from the Dashboard, see the VMware Capacity Planner Dashboard Users Guide.
VMware, Inc. 25
3
This chapter discusses what to do before installing the collector and Data Manager. The following topics are described in this chapter:
“Personnel Requirements” on page 25
“Data Collector System Requirements” on page 26
“Target System Platforms” on page 28
“Security, Network, and Firewall Requirements” on page 29
“Preinstallation Checklist” on page 31
Personnel RequirementsIdeally everyone on the assessment team is familiar with what Capacity Planner does, and what has to be done to set up and start a collector for the assessment. In addition, the assessment team needs to be qualified in three major areas:
VMware Capacity Planner Certification (not required if you are running CE assessments only)Windows and Linux Troubleshooting Network Troubleshooting
VMware Capacity Planner Certification At least one member of the team supporting the assessment must be certified in the implementation of Capacity Planner and application of its findings and recommendations. Most likely, this person is:
A qualified employee of VMware
A certified consultant
A VMware partner
Windows and Linux and Unix Troubleshooting The collector discovers systems in a company’s network for Capacity Planner to observe and assess. The collection of target systems is usually a mix of Windows, Linux, and UNIX operating system platforms.
A successful assessment requires:
Successful system connections (for more information see “System Connections” on page 26)
Access to data by means of one or more data collection methods (for more information, see “Data Collection Methods” on page 26)
Preinstallation Requirements 3

Data Collection Guide
26 VMware, Inc.
System Connections
To discover, inventory, and collect data from target systems, the collector must be able to access the target systems with sufficient privileges that allow it to collect the data to be used for the assessment.
The assessment team must include at least one person who can identify and correct connection issues for the collector. This person needs to identify which accounts are used to connect to the target systems, ensuring that each account has the correct permissions for accessing data by one of the data collection methods.
Data Collection Methods
Another key member of the assessment team is a person who is familiar with the data collection methods that the collector uses on the target systems.
For Windows systems, the data collection methods are:
Windows Management Instrumentation (WMI)Remote RegistryRPC MonitorFile and print sharing (IPC$)Performance Monitor (Perfmon)Protocol validation using nbtstat
For Linux and UNIX platforms, the data collection methods are:
Secure Shell (SSH)Standard Linux and UNIX utilities
Network Troubleshooting The assessment team must also have one or more members who are familiar with the company’s network architecture, from the dual perspective of security and performance. This expert must:
Be able to determine which domains exist and which systems belong to those domains.
Know the IT infrastructure (DNS, Active Directory, WINS, IP subnets, Active Directory organizational units, and so on).
Be familiar with routers, firewalls, DMZs, and WAN interfaces.
Know which ports can be used to gain access to any target systems behind firewalls, and be able to identify whether it is necessary to install Capacity Planner on a system behind a firewall.
Be able to identify which systems can be used to host Capacity Planner.
Know the general bandwidth of the network structure to optimize the number of collectors to be installed, and where they are located within the network.
Be able to assist Windows, Linux, and UNIX experts in troubleshooting connection issues between the collector and the target systems.
Data Collector System Requirements This section describes system requirements for installing Capacity Planner on the data collector host.
NOTE Linux and UNIX data collection is done through shell scripts using standard Linux and UNIX utilities to collect data from the target machines. Methods used to collect data are:
Remote execution of shell scripts run from the collector machine
Local execution of shell scripts that are installed and executed on the target machine

VMware, Inc. 27
Chapter 3 Preinstallation Requirements
Data Collector Host System The collector must be hosted on a Windows machine within the company’s network that can access target systems for observation and assessment. To discover target machines by using information stored in your Active Directory server, install the collector on a host machine that is within the same domain as the Active Directory server. Every environment is different, but typically, a single collector uses agentless discovery to detect and monitor up to 500 systems. Only one collector can be placed on a host.
Host System Characteristics
Each host system must have the following characteristics:
Windows 2000 (Server or Professional) SP 3, Windows XP Professional, or Windows Server 2003
You must use the English language version of Windows.
If the collector is installed on a Windows XP system on which SP2 is installed, the Windows firewall must be turned off.
If the collector is installed on a Windows 2003 machine, install the Win32_Product class, which is required to enable the inventory feature to work correctly. Log on as an administrator, and open Add or Remove Programs in the Control Panel. Under Management and Monitoring Tools, look for the WMI Windows Installer Provider.
WMI (Windows Management Instrumentation) or Remote Registry installed
Minimum 1000MHz CPU
Minimum 512MB of RAM
2GB of free disk space
Connection to the Internet with network bandwidth of 20,000 bytes per second during collection
A current version of MDAC (Microsoft Data Access Components)
To access the Capacity Planner Dashboard from the collector, the following is also required:
Microsoft Internet Explorer 5.5 or higher
Macromedia Flash Player
Determining the Number of Collectors to Install
The average performance of a collector and the speed of a typical network allows approximately one collector per every 500 target systems that you expect to discover.
You might have to install additional collectors to achieve optimal results of the assessment effort, but use as few collectors as possible. The goal is to collect hourly performance data on every system within the project scope. The realistic performance statistic depends on network throughput and server response, as well as the presence of firewalls and routers in the collection environment.
Wide area networks slow down collection considerably.
Accessing the Capacity Planner Download The collector and Data Manager components are installed from a file downloaded from a VMware Internet site. Access to this download file is provided when appropriate services are purchased for the assessment. Your VMware Capacity Planner representative can provide information about acquiring and setting up these services for access to the installation download file.
Windows User Account for Collector Service An administrator-level user account is needed to install the collector and Data Manager, as well as to run the collector service. The account used for installation can be the same or different from the account used to run

Data Collection Guide
28 VMware, Inc.
the service to collect inventory or performance data.The user name, domain, and password for this account are specified during the installation process. The user must have permissions to start a service on collector host. You can do one of the following:
Set up the account and define the necessary permissions before starting the installation. The collector service starts up automatically when the installation is complete.
Set up the account, but not the privileges. When you specify the account during the installation, the installer checks for these privileges and notifies you. You can do one of the following:
Cancel the installation, grant the permissions to the user, and restart the installation from the beginning. When the installation is finished, the service starts up.
Proceed with the installation and let it complete. The service does not start up at that time. Grant the permissions to the user, and manually start the service before proceeding with setting up the collector.
Defining the user and necessary permissions is described in Chapter 4, “Installing the Collector,” on page 33.
Target System PlatformsThe 2.6 collector supports the following platforms for all operations (discovery, inventory, and performance data collection). Platforms may be added or deleted at any time, so check the Capacity Planner Release Notes for the most up-to-date list of supported platforms. The supported platforms include:
Table 3-1. Supported Target System Platforms
Microsoft Windows systems Linux and UNIX systems
Windows NT 4.0 Server Sun Solaris 7 (SPARC)
Windows NT 4.0 Professional Workstation Sun Solaris 8 (SPARC)
Windows 2000 Server / Advanced Server / Datacenter Sun Solaris 9 (SPARC)
Windows 2000 Server (64-bit Itanium) Sun Solaris 9 (x86)
Windows 2000 Professional Workstation Sun Solaris 10 (SPARC)
Windows XP Professional Sun Solaris 10 (x86)
Windows XP Professional (64-bit x86 / EM64T / AMD64) HP-UX 10.xx (PA-RISC)
Windows 2003 Server HP-UX 11 (PA-RISC)
Windows 2003 Server (64-bit Itanium) HP-UX 11.11 (PA-RISC)
Windows 2003 Server (64-bit x86 / EM64T / AMD64) HP-UX 11.22 (PA-RISC)
HP-UX 11.23 (Itanium)
SUSE Linux Enterprise Server 9
SUSE Linux 10
SUSE Linux 9
SUSE Linux 8
RedHat Linux 9
RedHat Linux 8
RedHat Enterprise Linux (ES/AS/WS) 4
RedHat Enterprise Linux (ES/AS/WS) 3
AIX 5.1
AIX 5.2
AIX 5.3

VMware, Inc. 29
Chapter 3 Preinstallation Requirements
Considerations for UNIX and Linux Collection Capacity Planner can detect and collect data from UNIX and Linux target systems. Data collection is achieved on these target systems by running standard system utilities through an SSH connection. Every UNIX and Linux target system must have the SSH server daemon running and configured properly for a successful connection.
Security, Network, and Firewall Requirements Because Capacity Planner is a remote management system, it is highly impacted by the ability of the collector to connect to systems for information. If the security is too high or the network is too restrictive, security-related issues can occur.
Security Requirements For all of the target systems to be monitored, the collector must be able to connect to those systems using specific protocols and ports. The collector uses these ports to pass to the target system the credentials that the collector wants to use and to collect the actual data. The required ports are general-purpose communications ports used for file and print sharing and authentication.
On Windows systems, the following ports are required to be open for a TCP connection: 135, 137 through 139, and 445. On Linux and UNIX systems, port 22 is required for Secure Shell (SSH).
For information about how these ports are used, see “Network and Authentication Requirements” on page 18 in Chapter 1.
Trusted Domains The collector host does not have to be in a trusted domain. However, the fully qualified account the collector uses for connection to the target systems must be one of the following:
Account of the target system
Account of the target system domain
Account of a trusted domain of the target system
The following example illustrates the transitive trust relationship:
1 User A belongs to Domain A (and can connect to any system in Domain A).
2 Computer C belongs to Domain C.
3 Domain B trusts Domain A (allowing Domain A users to connect to Domain B systems).
4 Domain C trusts Domain B (allowing Domain B users to connect to Domain C systems).
5 Domain C trusts Domain A, and allows Domain A users to connect to Domain C systems.
6 Computer C (a system in Domain C) allows connection from User A (a Domain A user).
Transitive trust relationships did not exist for Windows NT 4.0 (or any Windows system that preceded Windows 2000). This means that Windows NT 4.0 accounts must be in the same domain as the collector or in a directly-trusted domain.
Account Privileges On Windows systems, the collector gathers inventory and performance data through WMI, the Registry, and Perfmon. An account with local administrative rights to the target system is required to successfully collect the information. The quickest way to collect information successfully is through a domain administrator account
NOTE Trust relationships are transitive in Windows 2000 and later. This means that the trust relationship extended to one domain is extended automatically to any other domain that domain trusts.

Data Collection Guide
30 VMware, Inc.
or any account with administrator rights to all or most of the target systems. If no appropriate domain account exists, a distinct account can be specified for each system after the collector discovers it.
For Linux or UNIX systems, data is collected using SSH scripts. The scripts are:
aog_setup.sh
aog_inv.sh
aog_inv_cron.sh
aog_perf.sh
aog_perf_cron.sh
aog_config_perf.sh
If you are not using the Data Manager to collect the data from the target Linux and UNIX machines, a root administrator account is required to execute the shell scripts from the command line, and to copy the collected data from the target machine to the import directory of the collector.
Stored Account Information When the collector is installed on a host system, it creates a Microsoft Jet database to store the data it uses and collects. When connection accounts are defined for the collector to use for accessing its target systems, the account information is stored in this database. Schedules and configuration settings are also stored in the database. The passwords are encrypted using a 256-bit AES reversible encryption method that uses a private key.
Network Authentication Network authentication requires that file and print services and remote procedure calls (RPCs) are enabled on target Windows systems. If the collector is using a domain account, you must be able to contact a domain controller to authenticate the account.
Firewall Considerations Firewalls protect the resources of private networks from unauthorized users from other networks. However, firewalls can also prevent access by legitimate administrative users.
The collector lets you specify an account that allows connection to a target system or trusted domain. If you cannot establish a connection directly between a target system (or a group of target systems) and the collector or a trusted domain, the collector uses either a local account in the domain containing the target system or a local account on the target system.
A firewall can affect a trust relationship. For example, a firewall might be open for the collector to connect to a target system with a domain account, but the firewall might inhibit connection from that system to a trusted domain to validate the provided account.
When a firewall is present within a network, it might be easier to install the collector and Data Manager on an additional system that resides within the firewall.
Bandwidth VMware recommends that you consider the effect of data collection on the network with regard to the rated network bandwidth. In general, peaks of 20,000 bytes per second can be expected for each collector when requesting inventory data or when collecting performance data. The performance data peak estimate presumes collection of 500 performance counters per collection from four target systems. For more information about performance counters, see Chapter 1, “Overview,” on page 13 and Appendix D, “Capacity Planner Performance Counters,” on page 139.

VMware, Inc. 31
Chapter 3 Preinstallation Requirements
Preinstallation Checklist Use this preinstallation checklist when you prepare for the initiation of an assessment engagement.
Assessment Team Be familiar with Capacity Planner concepts and requirements for setting up a collector. (See “Personnel Requirements” on page 25 and “Data Collector System Requirements” on page 26.)
Be certified for implementation of VMware Capacity Planner.
Purchase appropriate services for the assessment and obtain instructions on downloading the installation file. (See “Accessing the Capacity Planner Download” on page 27.)
Have Windows expertise, especially with:
System connections
Data connection methods
Troubleshooting
Have Linux or UNIX expertise, especially with:
System connections
Data connection methods
Troubleshooting
Possess network expertise, especially for potential firewall and router issues.
Collector Systems Information Get access to the installation download file (for more information, see “Accessing the Capacity Planner Download” on page 27).
Calculate the number of systems to be used for hosting the collector:
No. of collectors = no. expected target systems/500
You might want to optimize or adjust as discussed in “Determining the Number of Collectors to Install” on page 27.
Determine the location or collector host.
Determine the date of availability of host systems for installation of the collector.
Determine whether each host system meets minimum system requirements, as presented in “Data Collector System Requirements” on page 26.
On each collector, obtain an administrator-level account to set up for the collector (for more information see “Windows User Account for Collector Service” on page 27).
An administrator-level user account is also required to install the collector and Data Manager.
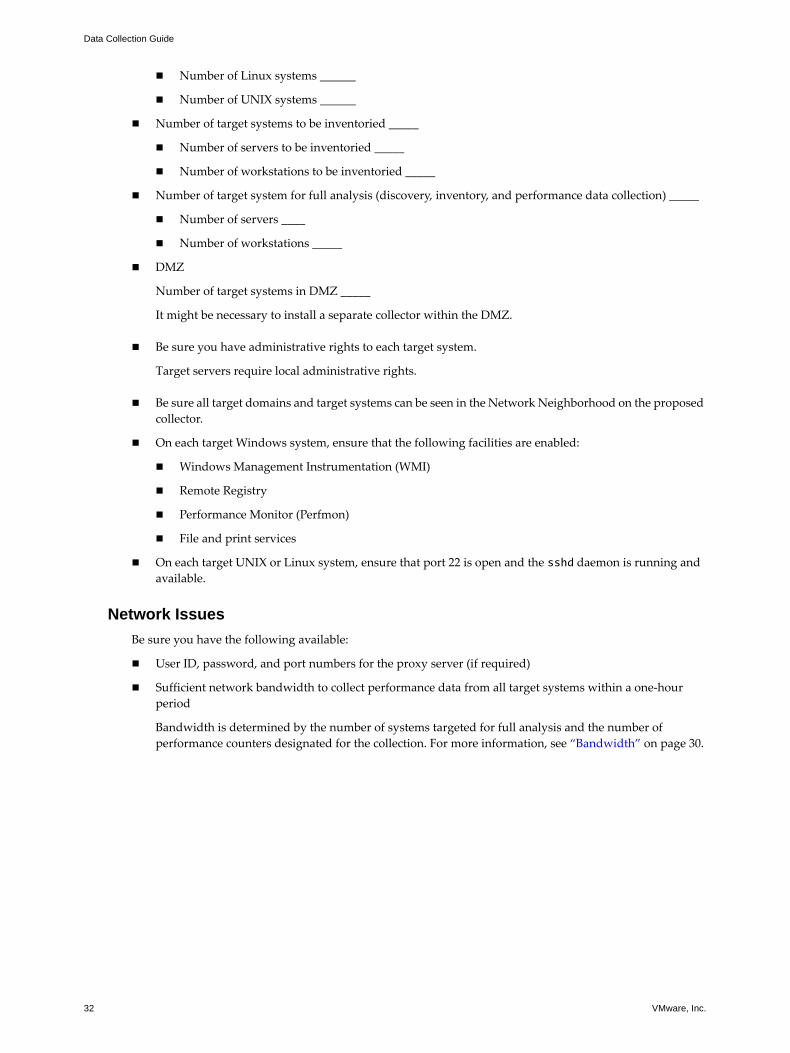
Target Systems InformationCalculate the following:
Number of target systems to be identified by discovery or from an import list ____ (See “Target System Platforms” on page 28.)
Number of servers ____
Number of workstations _____
Number of Windows systems _____
Data Collection Guide
32 VMware, Inc.
Number of Linux systems ______
Number of UNIX systems ______
Number of target systems to be inventoried _____
Number of servers to be inventoried _____
Number of workstations to be inventoried _____
Number of target system for full analysis (discovery, inventory, and performance data collection) _____
Number of servers ____
Number of workstations _____
DMZ
Number of target systems in DMZ _____
It might be necessary to install a separate collector within the DMZ.
Be sure you have administrative rights to each target system.
Target servers require local administrative rights.
Be sure all target domains and target systems can be seen in the Network Neighborhood on the proposed collector.
On each target Windows system, ensure that the following facilities are enabled:
Windows Management Instrumentation (WMI)
Remote Registry
Performance Monitor (Perfmon)
File and print services
On each target UNIX or Linux system, ensure that port 22 is open and the sshd daemon is running and available.
Network Issues Be sure you have the following available:
User ID, password, and port numbers for the proxy server (if required)
Sufficient network bandwidth to collect performance data from all target systems within a one-hour period
Bandwidth is determined by the number of systems targeted for full analysis and the number of performance counters designated for the collection. For more information, see “Bandwidth” on page 30.

VMware, Inc. 33
4
The following topics are described in this chapter:
“Installation Overview” on page 33
“Downloading the Installation Package” on page 34
“Installing the Collector and Data Manager” on page 34
“Running the Setup Wizard” on page 35
“Starting the Data Manager” on page 37
“About the Collector Service” on page 37
“Possible Installation Problems” on page 40
“About Automatic Collector Updates” on page 40
Installation OverviewFigure 4-1 summarizes the collector installation process.
Figure 4-1. Data Collector Installation Process
To create a clean installation on a system that has a previous version of the collector and existing data that you no longer want to keep, follow the instructions in Appendix B, “Uninstalling the Data Collector,” on page 133 before running the setup wizard. If you have a version of the collector installed (regardless of the version) and you want to retain the existing data, the setup wizard retains any existing data that you defined and collected. Prior to beginning the installation process, you must know the user ID and password for the administrative
Installing the Collector 4
Download Capacity Planner
Uninstall Old Version
(Optional - for “clean” install)
Run Setup Wizard

Data Collection Guide
34 VMware, Inc.
account that is specified as the collector service account in the setup wizard. For detailed information about this account and the credentials required, see “About the Collector Service” on page 37.
Possible installation errors are described in “Possible Installation Problems” on page 40.
After you successfully install the collector, you can start it as described in “Starting the Data Manager” on page 37.
Downloading the Installation PackageThe client-side components of Capacity Planner are the collector and the Data Manager. The installation package for the these components is available as a download from https://optimize.vmware.com after the purchase of assessment services.
To download the file
1 Open a browser window and navigate to the Capacity Planner Web site at:
https://optimize.vmware.com
2 Log in to the Web site with the user name and ID that your VMware representative provides.
When you log in with a valid account, the Home page of the Capacity Planner Dashboard appears.
3 Click the Portal link at the top right of the Dashboard page.
4 On the Resources page, click the link for VMware Capacity Planner 2.6 Collector Build <number> where <number> is the number of the current collector build. If multiple collector builds are listed, the highest number is the latest version.
A File Download - Security Warning dialog box appears, prompting “Do you want to run or save this file?”
5 Click Save, navigate to the place on your computer to download the installation file onto your system, and click OK. VMware recommends that the installation file be downloaded and run off the local system rather than over the network.
6 When you see the Download Complete message, click Run to begin the installation process.
Installing the Collector and Data ManagerAfter you download the collector installation package, run the setup wizard. If this is a new installation where no previous version of the collector is installed, proceed with “Running the Setup Wizard” on page 35.
If you have a previous installation of the collector on your system, read “Upgrading an Existing Installation” on page 35
Consider how you want to proceed with the installation:
Is this a new assessment effort, with no consideration of previously collected data? For more information, see “Performing a Clean Installation” on page 34.
Does the local database contain live data that you want to preserve for use in this assessment? If this assessment is a continuation of one that was started with an earlier version of the collector, proceed with “Upgrading an Existing Installation.”
Performing a Clean Installation
If this is a new assessment effort with no consideration of previously discovered or previously collected data, ensure that the previous installation is completely removed from your host system. The procedure to completely remove a Capacity Planner installation is documented in Appendix B, “Uninstalling the Data Collector,” on page 133.
When old installation is removed, proceed with “Installing a New Collector” on page 35. Even if the installer program detects that an older version of Capacity Planner is installed and offers you the option of uninstalling

VMware, Inc. 35
Chapter 4 Installing the Collector
it, this method of uninstalling the application does not clean off the old data. Because the collector attempts to update the old database, remove the old installation before you begin the new installation. For more information, see Appendix B, “Uninstalling the Data Collector,” on page 133.
Upgrading an Existing Installation
If you are installing the collector on a system on which a previous version of the collector is installed, the installer detects this and offers one of two options:
If the previous installation is the same version as the current installation, the installer uninstalls and reinstalls the collector.
If the previous installation is an older version of Capacity Planner, the installer upgrades the collector.
Confirming the automatic upgrade retains everything that was set up for the collector in the previous installation and allows you to continue your assessment with the newly installed software. See “Upgrading a Version 2.x.x Installation” on page 36. If you retain the database from the previous installation, the Data Manager does not automatically start the setup wizard for this new collector, and you need to manually run the wizard after installing the new collector. For more information about the setup wizard, see Chapter 5, “Setting Up the Collector,” on page 43.
Running the Setup WizardThere are two starting points for the installation of the collector. You can either install a new collector, or upgrade an existing collector.
Installing a New Collector
To install a new collector
1 If you are continuing the installation after just downloading, saving, and running the installation file, the Security Warning dialog box appears. Navigate to the downloaded installation file and double-click the file name.
2 Click Run to proceed.
3 Click Next to continue the installation of the new product.
4 Click Yes to accept the terms of the license agreement and click Next.
5 To specify the destination folder, do one of the following:
Click Next to accept the default destination folder (C:\Program Files\VMware\VMware Capacity Planner) and proceed to Step 6 to specify the collector service account.
Click Change. Designate an alternative destination folder, and click Next.
6 Enter the user name, password, and domain to be used as the service account for this collector.
The collector service account must have the following properties:
The user is assigned to the machine’s local Administrators group.
The specific user, or a group it belongs to (such as, the Administrators group), has the privilege to log on to Windows as a service.
If the collector service account does not meet these requirements, the service cannot start. For more information about what can be entered in this dialog box and the results, see the “About the Collector Service” on page 37.
NOTE The collector service account is not the same as the Global Connection Account that the collector uses to query target machines for their system information. For information about the Global Connection Account, see Chapter 5, “Setting Up the Collector,” on page 43.

Data Collection Guide
36 VMware, Inc.
The setup wizard authenticates the collector service account information. If the specified user cannot be authenticated, a warning appears.
Click OK to return to the Service Account screen and enter correct user credentials.
When correct user credentials are entered, the wizard is ready to begin installation.
7 Click Install to proceed.
If you see this message, do the following:
a Click OK to acknowledge the message and abort the installation.
b Free up sufficient disk space, or determine another location for the destination folderthat has sufficient available disk space. (For more information about system requirements for installation of the collector, see Chapter 3, “Preinstallation Requirements,” on page 25.)
c Restart the installation procedure from the beginning (return to “Installing a New Collector” on page 35).
8 Click Finish to exit the installer.
As the installer finishes, it registers and starts the collector service. You can verify the state of the collector service as described in Chapter 4, “About the Collector Service,” on page 37.
Upgrading a Collector InstallationThe following procedure describes how to upgrade from version 2.x.x to 2.5.
Upgrading a Version 2.x.x Installation
1 Download the collector installation file as described in “Downloading the Installation Package” on page 34.
2 Navigate to the downloaded installation file and double-click the file name.
The Open File - Security Warning dialog box might appear.
3 If it does, click Run to proceed.
Because a previous installation of the same version of Capacity Planner is detected, you must confirm the automatic upgrade.
4 Click Yes to proceed.
When the wizard completes the configuration of the Windows Installer, the wizard indicates that it is resuming the installation.
5 Click Next.
The wizard begins installing Capacity Planner.
When the installation is completed, one of two InstallShield Wizard Complete screens appears.
If the upgrade required any modification to the Windows Registry, you are directed to restart your computer.
If the Windows Registry was not modified, you do not have to restart your system.
NOTE When the wizard begins the installation, it checks whether sufficient disk space is available for the installation. If sufficient space is unavailable, the following message appears.
VMware, Inc. 37
Chapter 4 Installing the Collector
6 In either Installation Wizard Completed screen, click Finish to exit the installer, indicating (if necessary) whether you want to restart the system.
If you restart your computer, the collector service starts automatically. Verify the state of the collector service as described in “About the Collector Service” on page 37.
Starting the Data ManagerThe Data Manager is the user interface to the collector. Use the Data Manager to configure the collector, check their status, start and stop them, and generally manage them during the assessment.
To start the Data Manager, do one of the following
From the Windows Start menu, choose (All) Programs>VMware>Capacity Planner Data Manager.
On your Windows desktop, double-click the VMware Capacity Planner Data Manager icon.
Proceed with Chapter 5, “Setting Up the Collector,” on page 43, to define the initial startup parameters for the collector.
About the Collector ServiceThe collector is designed to run as a Windows service. At the end of the installation process, the installer registers and starts the service. Because the collector is set up as an automatic service, it automatically starts whenever its host system is started.
As with all Windows services, you can manage the collector service through the Windows Services facility as described in “Viewing the Status of the Collector Service” on page 38. You can start and stop the service, if necessary. (For more information, see Chapter 6, “Navigating the Data Manager,” on page 51 and Chapter 11, “Management Tasks,” on page 105.)
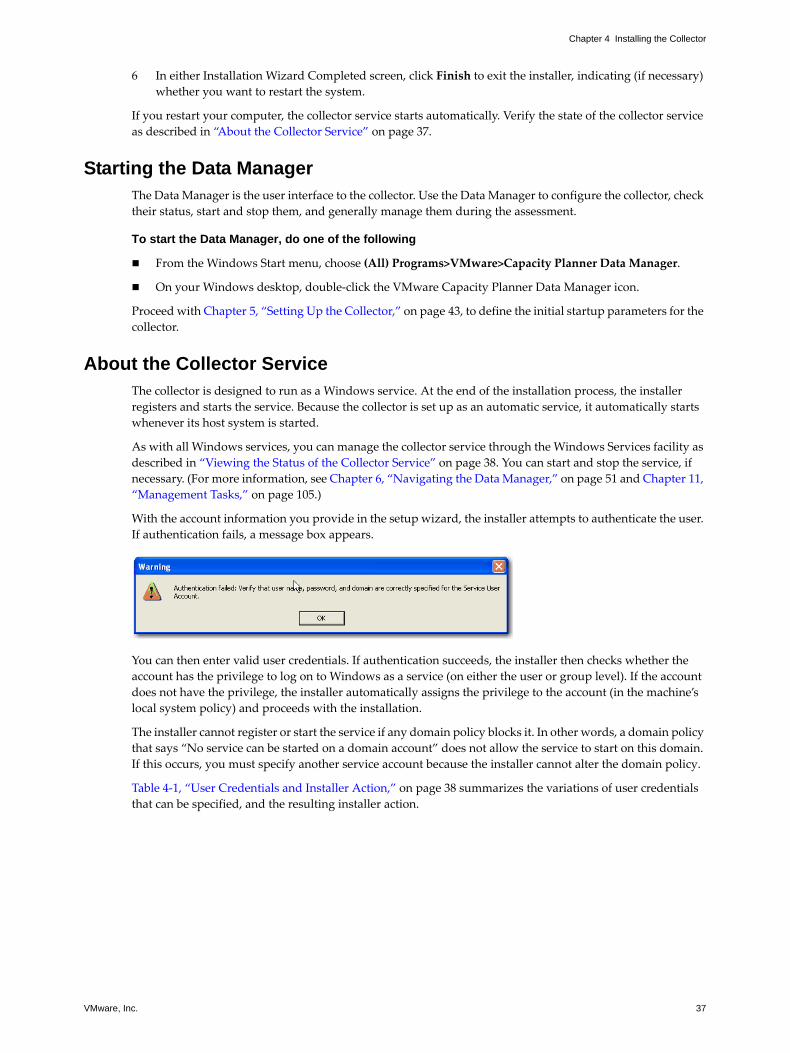
With the account information you provide in the setup wizard, the installer attempts to authenticate the user. If authentication fails, a message box appears.
You can then enter valid user credentials. If authentication succeeds, the installer then checks whether the account has the privilege to log on to Windows as a service (on either the user or group level). If the account does not have the privilege, the installer automatically assigns the privilege to the account (in the machine’s local system policy) and proceeds with the installation.
The installer cannot register or start the service if any domain policy blocks it. In other words, a domain policy that says “No service can be started on a domain account” does not allow the service to start on this domain. If this occurs, you must specify another service account because the installer cannot alter the domain policy.
Table 4-1, “User Credentials and Installer Action,” on page 38 summarizes the variations of user credentials that can be specified, and the resulting installer action.

Data Collection Guide
38 VMware, Inc.
Viewing the Status of the Collector ServiceThis section describes tools that help you view the status of the collector service.
To view the state of the collector service
1 In the Windows Control Panel, choose Administrative Tools.
2 In the Administrative Tools window, double-click Services.
3 In the Services window, scroll down the Name column to find VMware Capacity Planner Service.
Table 4-1. User Credentials and Installer Action
Type of Account
Local Administrator?
User Name Password
Domain Name Installer Action (Authentication)
Domain Yes Valid Valid Valid Passes
Valid Valid Blank Assumes account is a local account and authenticates as such.
Invalid Valid Valid Fails
Valid Invalid Valid Fails
Domain No Valid Valid Valid Passes, but service does not start.
Valid Invalid Valid Fails
Invalid Valid Valid Fails
Valid Valid Invalid Fails
Local Yes Valid Valid Blank Passes (assumed to be a local account)
Valid Valid machine name
Passes
Valid Valid Non-blank (assumed to be a domain name)
Attempts to authenticate as a domain account
No Valid Valid blank or machine name
Authenticates as a local account, but service does not start.
NOTE If the machine on which the collector is to be installed is not in a domain (that is, it is in a workgroup), you can leave the domain name field blank and the installer automatically adds the system name.

VMware, Inc. 39
Chapter 4 Installing the Collector
The Startup Type column shows that the service is Automatic, which means that it starts automatically whenever Windows is started. The Status column shows that the service is Started. If the service is not started, proceed with the next steps to verify service account designation.
4 To see more details about the service, right-click its name to see the Properties dialog box for the service.
5 To confirm that the service user is properly defined for the collector, click the Log On tab.
Verify that:
A specific account is defined as This account and the service is not running as a local system account.
The account that is defined is an administrator-level account with the privilege to log on as a service. For more information, see Step 6 in “Installing a New Collector” on page 35.

Data Collection Guide
40 VMware, Inc.
Possible Installation ProblemsCapacity Planner installation rarely encounters problems, especially if the collector system meets all of the requirements documented in Chapter 3, “Preinstallation Requirements,” on page 25. Ensure that:
You have sufficient available disk space for the Capacity Planner installation folder.
The Windows system on which the collector system is installed is properly updated.
The installation program might encounter Windows error 1931, although this is a rare occurrence. The error can occur because the installer copies over some .dll files that are being protected by Windows. If this occurs, click OK in the Windows error dialog box. The installation of Capacity Planner continues without any problems. See additional information about error 1931 in your Windows online help.
About Automatic Collector UpdatesPeriodically, updated components become available for the collector. These component upgrades can be made available as an official release, for example, version 2.5.2, but they are not always associated with an official update to the software. For example, a hotfix release might become available between versions 2.5.1 and 2.5.2.
In previous versions of Capacity Planner, the collector had to be upgraded manually when an update became available. As of the 2.5 version, the updates can be made available to collectors installed in client sites automatically. To use this feature, the collector machine must be able to connect to the Dashboard Web site.
The components that are subject to automatic updates are:
Collector binaries
Third-party binaries
UNIX scripts
Other utility scripts
Updater component
Product manifest file. This file contains information about all the components in the collector, including name, location, and checksum information for each component.
Any new package containing new components
When an automatic update occurs, the Data Manager shuts down and collector service restarts.
About Update VerificationDuring an automatic update, the manifest from the Capacity Planner Dashboard is downloaded to the collector as part of a data synchronization task. The Dashboard manifest is compared to the collector manifest. If the checksums of the manifest files match, the collector is current and no update is needed. If they do not match, the new/modified components are downloaded from the Dashboard and are installed in the collector.
A verification process takes place after the download to verify that the checksums of the newly downloaded components match those in the Dashboard manifest. If errors are found, they are logged into the collector log file, the update is aborted, and the update failure is reported to the Dashboard.
Receiving automatic updates is an optional feature and is turned off by default.
NOTE The collector service does not start if the user name or password is invalid. This can happen if it was specified incorrectly during installation, or if either have changed since the collector was installed. You can redefine either or both of the user name and password for the service account in the dialog box shown above.
For more information about managing Windows services, see Microsoft Windows Help .

VMware, Inc. 41
Chapter 4 Installing the Collector
To enable automatic updates
1 Choose Admin>Options.
2 On the Options screen, select the Jobs tab.
3 Double-click the Scheduled - Data Synchronize job.
4 Select the Tasks tab.
5 Double-click Data Synchronization.
6 Select Download and install product updates to enable automatic updates to the collector. No other check boxes should be selected.
Scheduling Component UpdatesIf you enabled automatic updates, the Dashboard queries the collector manifest on the data synchronization schedule established on the Jobs tab of the Options screen.
For example, if data synchronization is scheduled for every hour of every day, every hour the Dashboard compares the manifest checksum it has on file for this company with the manifest checksum in the collector. If they match, nothing happens. The verification is performed an hour later, continuously, until a mismatch occurs, at which time an update takes place. To limit the burden on the dashboard, add a data synchronization job, only for automatic updates, that runs weekly.
To add a weekly data sync job for automatic updates
1 Choose Admin>Options and select the Jobs tab.
2 Click Add to display the Add Job screen.
The General tab is selected by default.
NOTE The product-update feature must also be configured in the Dashboard.

Data Collection Guide
42 VMware, Inc.
3 Select Job Active, and enter a name and description for the weekly automatic collector data synchronization.
4 Select the Tasks tab, and click Add.
5 Select Data Synchronization and click OK.
The Add Job screen reappears, showing the new job.
6 Select the Schedule tab. Specify the task to run weekly, and select a day of the week for the update.
7 Click OK.
8 Click OK again. The data sync job, created specifically to perform updates of the collector, runs weekly on the day of the week you specified.
VMware, Inc. 43
5
The following topics are described in this chapter:
“Introduction to the Data Manager” on page 43
“Using the Setup Wizard” on page 43
“Registering the Collector” on page 45
“Setting Global Options” on page 47
“Considerations for UNIX and Linux Collection” on page 48
“Considerations for Collection from Microsoft Clustered Servers” on page 49
Introduction to the Data ManagerThe Capacity Planner Data Manager is the graphical user interface for the collector. Chapter 4, “Installing the Collector,” on page 33 provides instructions for installing these components of VMware Capacity Planner on a Windows system.
This chapter describes how to initially set up the collector including how to:
Start the Data Manager.
Use the setup wizard to define the main Global Connection Account. (Optional) Schedule the collection tasks.
Register the local collector database with the Information Warehouse.
(Optional) Set global options for the connection account, file paths, and logging.
Basic navigation and descriptions of additional menu options in the Data Manager is provided in Chapter 6, “Navigating the Data Manager,” on page 51.
To start the Capacity Planner Data Manager, select Programs>VMware>Capacity Planner Data Manager from the Windows Start menu.
What follows depends on whether an installation is completed.
First-time installation: The setup wizard automatically starts to guide you through the initial setup of the collector for the planned assessment. Proceed with “Using the Setup Wizard.”.
Already configured or upgrading a previous installation: The VMware Capacity Planner Manager screen appears with all collector settings maintained from the previous installation. To examine or adjust these settings, proceed with “Setting Global Options” on page 47.
Using the Setup WizardThe setup wizard configures the following key options for the collector:
Setting Up the Collector 5
Data Collection Guide
44 VMware, Inc.
Collect data—Choose whether you want to run a minimal assessment (Consolidation Estimate) or a full assessment. If you have run a previous assessment, you can also elect to preserve existing configuration settings.
Synchronization options—Configure settings that manage synchronization between the Data Manager and the Dashboard.
Logging details—Specify number of log files to keep, maximum log file size, and level of logging detail.
Add accounts—Set up the Global Connection Account and other accounts as needed to access the target machines within the scope of the assessment.
Ready to find systems—Choose whether to find systems by import or discovery.
The following sections explain how the collector uses these settings. “Running the Setup Wizard,” describes the procedure for setting these options.
About the Global Connection Account The Global Connection Account is the default account the collector uses to access discovered systems for inventory and performance data collection (it is not required for the discover task). The Global Connection Account is stored in the collector database.
The Global Connection Account allows the collector to authenticate against all or most of the systems and domains detected by the initial discover task. The Global Connection Account must be an account that has connection privileges on the domains and systems that are accessed for data collection.
However, because one account typically does not have administrative rights to every domain, server, or machine in the network, you might need to identify other accounts for specific servers or domains to enable connection to target systems for collection of inventory and performance data. “Setting Up Connection Accounts” on page 105 provides additional information about adding connection accounts to accomplish the inventory and performance tasks.
Running the Setup WizardAfter the setup wizard starts, follow the prompts to complete installation of the collector and Data Manager.
To run the setup wizard
1 Click the Setup Wizard link on the Data Manager Home tab.
2 Choose the type of assessment you plan to run and click Next when you are finished. Choose:
Minimal—if you are planning to run a Consolidation Estimate (CE)
Full—if you are planning to run a full consolidation assessment for at least 30 days
Preserve existing settings—only if you are running the setup wizard subsequent to a previous install and want to keep custom settings that you entered previously
3 Choose synchronization options and click Next when you are finished.
Allow changing some collector configuration settings—enables you to update a subset of configuration settings remotely from the Dashboard
Allow automatic software updates—enables automatic updates to the collector software when a patch or hot fix becomes available
Enforce data privacy—disguises domain and host names before they are uploaded to the Information Warehouse and Dashboard. For more information, see “Host and Domain Masking (Data Privacy Feature)” on page 48.
4 Choose logging settings and click Next when you are finished. You can configure:
Log File Size—determines the maximum size of a log file
# of Backup Logs—determines the number of log files to retain; you must have at least one

VMware, Inc. 45
Chapter 5 Setting Up the Collector
Log Level—determines amount of detail to be tracked in the log
5 Add user accounts needed to connect the collector host to the targeted systems. An account called the Global Connection Account gives you access to most machines. Enter an account name, domain, and user ID. Get this information from your contact at the customer site.
Click Add to set up additional accounts to access sequestered machines such as those behind a firewall. You can also edit and delete accounts as needed. When creating an account to access UNIX networks, ignore the Domain field.
6 Specify how to find systems.
You can find systems in two ways.
Import systems from file—enables you to define the scope of the assessment by importing a list of machines by host and domain name from a .csv file
Discover systems—configures the collector to find machines by discovering them in the customer’s IT environment
7 Click Finish.
8 Register the collector database with the Information Warehouse.
Registering the CollectorWhen the collector is installed and the service is started the first time, the collector service creates the collector database and a unique database ID. This database ID must be associated with your company. The database is where information such as the collected data, account, and user-defined information is stored.
Your company must be registered in the Information Warehouse. One or more users must be granted access to your company data with privileges at least at an Administrator level (within the Capacity Planner Dashboard). See Chapter 3, “Preinstallation Requirements,” on page 25.
Local Collector Database IDEach collector configured at a company site creates its own local database where data for the collector is stored. The ID for each collector database must be registered with the Information Warehouse using the Capacity Planner Dashboard.

Data Collection Guide
46 VMware, Inc.
Figure 5-1. Register the Collector Database ID in the Dashboard
This process ensures that the correct data is stored in the Information Warehouse and presented for the company in the Dashboard.
To register a database ID
1 Click Register Collector on the collector Home page.
2 When the Register Collector dialog box appears, record the content of the Database ID field.
3 Start an Internet Explorer browser window to connect to the Internet and navigate to the Capacity Planner Web site:
https://optimize.vmware.com
4 Enter an appropriate user name and password to log on to the Dashboard.
5 Click the customer’s company name in the My Assessments table to display the Enterprise Dashboard.
6 Choose Administration>Collector>Register Database IDs.
All of the collector database IDs that are currently registered for the selected company are listed in this table.
7 Click Add.
8 Enter the database ID for the collector database and click OK.
NOTE You must have Administrator privileges or greater in the Dashboard to register a collector.
NOTE An easy way to perform this process is to select the entire contents of the Database ID field and press Ctrl+C to copy it to the Windows clipboard.

VMware, Inc. 47
Chapter 5 Setting Up the Collector
The Dashboard displays the Database ID Registration table again, showing the newly registered database ID.
For more information about the Database ID Registration table, as well as other objects presented in the Capacity Planner Dashboard, see the VMware Capacity Planner Dashboard Users Guide.
At the collector system, you have done the following:
Installed the collector.
Set up the collector global options.
Registered the local collector database with the Information Warehouse using the Capacity Planner Dashboard.
You can proceed with your initial discovery of systems in your network. Guidance for setting up and performing the Discover task is provided in Chapter 7, “Discovery with the Data Collector,” on page 67.
However, before you proceed to that chapter, read the information presented in Chapter 6, “Navigating the Data Manager,” on page 51. This chapter familiarizes you with the layout of the Data Manager and enables you to use it more effectively.
To adjust the collector options that you just defined, rerun the setup wizard, or follow the appropriate procedures described in “Setting Global Options.”.
Setting Global OptionsIn addition to the options defined with the setup wizard (see “Using the Setup Wizard” on page 43), you can set many other collector options through the Options dialog box.
To open the Options dialog box
In the Capacity Planner Manager window, choose Admin>Options from the menu bar.
The Options window appears.
General TabThe General tab, which is the default, defines the following options:
Global Connection Accoun
Logging
Host and Domain Masking
Other global options such as message window size and job history retention
Global Connection Account
At the top of the General tab, you can define the Global Connection Account in the same manner as was presented by the setup wizard (see “Using the Setup Wizard” on page 43).
Logging and Other Settings
These options let you manage many aspects of the collector and Data Manager.
See Table 5-1, “Where to Find Information About Logging and Other Global Settings,” on page 48 for information about how you can set each of these options.
NOTE If you copied the database ID to the Windows clipboard when you retrieved it in the Data Manager, press Ctrl+V to paste it directly into the Database ID field.
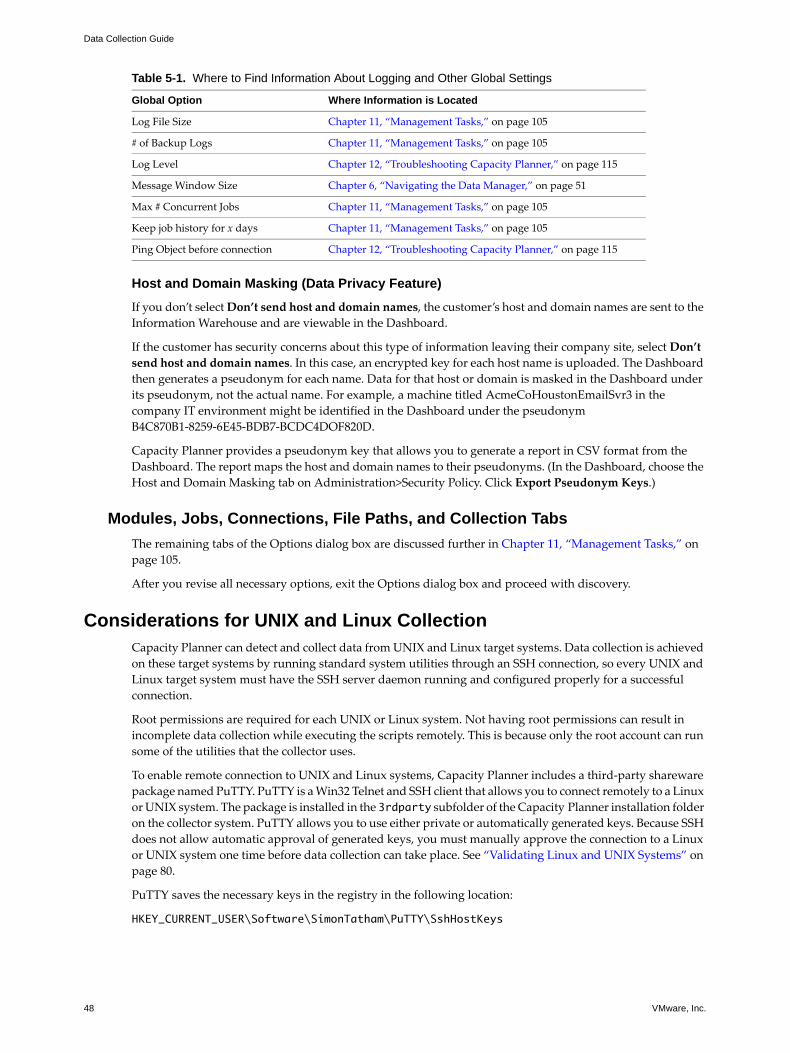
Data Collection Guide
48 VMware, Inc.
Host and Domain Masking (Data Privacy Feature)
If you don’t select Don’t send host and domain names, the customer’s host and domain names are sent to the Information Warehouse and are viewable in the Dashboard.
If the customer has security concerns about this type of information leaving their company site, select Don’t send host and domain names. In this case, an encrypted key for each host name is uploaded. The Dashboard then generates a pseudonym for each name. Data for that host or domain is masked in the Dashboard under its pseudonym, not the actual name. For example, a machine titled AcmeCoHoustonEmailSvr3 in the company IT environment might be identified in the Dashboard under the pseudonym B4C870B1-8259-6E45-BDB7-BCDC4DOF820D.
Capacity Planner provides a pseudonym key that allows you to generate a report in CSV format from the Dashboard. The report maps the host and domain names to their pseudonyms. (In the Dashboard, choose the Host and Domain Masking tab on Administration>Security Policy. Click Export Pseudonym Keys.)
Modules, Jobs, Connections, File Paths, and Collection TabsThe remaining tabs of the Options dialog box are discussed further in Chapter 11, “Management Tasks,” on page 105.
After you revise all necessary options, exit the Options dialog box and proceed with discovery.
Considerations for UNIX and Linux CollectionCapacity Planner can detect and collect data from UNIX and Linux target systems. Data collection is achieved on these target systems by running standard system utilities through an SSH connection, so every UNIX and Linux target system must have the SSH server daemon running and configured properly for a successful connection.
Root permissions are required for each UNIX or Linux system. Not having root permissions can result in incomplete data collection while executing the scripts remotely. This is because only the root account can run some of the utilities that the collector uses.
To enable remote connection to UNIX and Linux systems, Capacity Planner includes a third-party shareware package named PuTTY. PuTTY is a Win32 Telnet and SSH client that allows you to connect remotely to a Linux or UNIX system. The package is installed in the 3rdparty subfolder of the Capacity Planner installation folder on the collector system. PuTTY allows you to use either private or automatically generated keys. Because SSH does not allow automatic approval of generated keys, you must manually approve the connection to a Linux or UNIX system one time before data collection can take place. See “Validating Linux and UNIX Systems” on page 80.
PuTTY saves the necessary keys in the registry in the following location:
HKEY_CURRENT_USER\Software\SimonTatham\PuTTY\SshHostKeys
Table 5-1. Where to Find Information About Logging and Other Global Settings
Global Option Where Information is Located
Log File Size Chapter 11, “Management Tasks,” on page 105
# of Backup Logs Chapter 11, “Management Tasks,” on page 105
Log Level Chapter 12, “Troubleshooting Capacity Planner,” on page 115
Message Window Size Chapter 6, “Navigating the Data Manager,” on page 51
Max # Concurrent Jobs Chapter 11, “Management Tasks,” on page 105
Keep job history for x days Chapter 11, “Management Tasks,” on page 105
Ping Object before connection Chapter 12, “Troubleshooting Capacity Planner,” on page 115

VMware, Inc. 49
Chapter 5 Setting Up the Collector
Because the keys are stored in HKEY_CURRENT_USER, they are unique to the logged-on user that effectively runs the PuTTY application. The only way the collector can access those keys is if it is running as the same user as PuTTY when it created the keys. This turns out to be the same user running the Data Manager.
To ensure that the collector can access the SSH keys, the collector must be set up with a collector service account that matches the user who will be running the Manager.
Considerations for Collection from Microsoft Clustered ServersDuring the collection process, Capacity Planner detects whether a server is a member of a Microsoft Cluster Server cluster, and automatically makes the appropriate adjustments. There is no user intervention required for assessments containing clustered servers.
Capacity Planner collects performance and inventory data from active/passive and active/active clusters. In an active/passive cluster, Capacity Planner ignores the logical IP address(es) assigned to the cluster and collects data based on the server's physical IP address. Capacity Planner does not collect data from the passive node(s). If servers in the assessment participate in an active/active cluster, Capacity Planner collects inventory and performance data from those servers as if they were stand-alone machines.
NOTE Documentation on PuTTYis in its installation subfolder in the file putty.hlp. Double-click this file to open the documentation in online help format. For specific questions about PuTTY, see the PuTTY documentation, which is available from:http://www.chiark.greenend.org.uk/~sgtatham/putty/docs.html

Data Collection Guide
50 VMware, Inc.

VMware, Inc. 51
6
The following topics are described in this chapter:
“Data Manager User Interface” on page 51
“Basic Navigation” on page 51
“Menu Structure” on page 61
Data Manager User InterfaceThe Capacity Planner Data Manager is the graphical user interface you use to configure and manage the collector, including:
Configure and run the discover task to identify all of the systems in your network
Configure the collector that will collect your data
Configure and run the inventory data collection task
Configure and run the performance data collection task
Upload the collected data to the Information Warehouse (this process is called synchronization)
Monitor the data collection processes
This chapter describes the key features of the Data Manager user interface. To use the Data Manager, you must have:
Installed the Capacity Planner Data Manager and collector on a system in your network (or in a company’s network) as instructed in Chapter 4, “Installing the Collector,” on page 33.
Set up the collector and registered the Database ID in the Information Warehouse as instructed in Chapter 5, “Setting Up the Collector,” on page 43.
Basic NavigationTo start the Capacity Planner Data Manager, from the Windows Start menu, select Programs>VMware>Capacity Planner Data Manager.
Main Data Manager WindowWhen a newly-installed Data Manager first starts, the Capacity Planner splash screen and setup wizard appear, as discussed in Chapter 5, “Setting Up the Collector,” on page 43.
When the setup wizard finishes, the main Data Manager window appears.
Navigating the Data Manager 6

Data Collection Guide
52 VMware, Inc.
Figure 6-1. Data Manager Main Window
Optionally, you might use the View Menu to also display the Message Pane. If the main window is closed with the Message pane selected for view, this setting is remembered and the Message pane appears the next time the Data Manager is started.
Title and Status Bars
The title bar reflects the current version of the collector, along with the standard Windows buttons to minimize, maximize, and close the window.
Figure 6-2. Title Bar
The status bar displays the job status of the collector, the status of the scheduler, and the logging level.
Figure 6-3. Status Bar
Displaying the status bar is optional and is determined by the setting on the View menu, as described in “View Menu” on page 61.
If the Data Manager window is minimized, the current job status is also displayed in marquee fashion in the Windows task bar, allowing you to monitor job status while performing other non-Capacity Planner tasks on the collector.
Menu and Tool Bars
The menu bar displays six menus.
Figure 6-4. Data Manager Menus
“Menu Structure” on page 61 provides an expanded discussion of these menus and their submenus.
The tool bar appears if it is selected in the View menu.
NOTE Sometimes the logging level is not displayed if the Message Box is not displayed. (See “Message Pane” on page 59 and “Setting Logging Global Options” on page 107.)

VMware, Inc. 53
Chapter 6 Navigating the Data Manager
Figure 6-5. Data Manager Tool Bar with Icons
The icons allow you to perform the following functions (representing the icons from left to right):
Run Execute Command Task
Run Data Synchronization Task
Run Discover Task
Run Inventory Task
Run Performance Task
Configure Options
Show/Hide Inactive Objects
The task-oriented icons correspond to the manual tasks that can be selected from the Tasks menu. The Configure Options icon corresponds to the Options item on the Admin menu, and the last icon corresponds to the item by the same name on the View Menu.
Figure 6-6. Tool Tip
Navigation PaneThe Navigation pane appears on the left side of the main Data Manager window. Objects known to the collector are displayed as an expandable tree structure in the Navigation pane. To see everything, open and navigate to each branch.
Initially, only The World icon appears, as shown in Figure 6-7.
Double-clicking The World icon expands the tree one level.
Figure 6-7. Navigation Pane Showing The World Icon Expanded
Double-click any object in the navigation tree to expand the tree to display any subordinate objects.
The All Objects branch contains most of the objects with which you work, including all groups and systems. The following example below shows the many objects that are included after discovery takes place.
NOTE The branches in the Navigation pane tree structure often have subordinate objects, even when they do not indicate this. A branch might contain objects whenit does not have a plus (+) sign. The plus (+) and minus (-) signs indicating that a branch contains objects do not appear until you open each branch and expand them at least once.
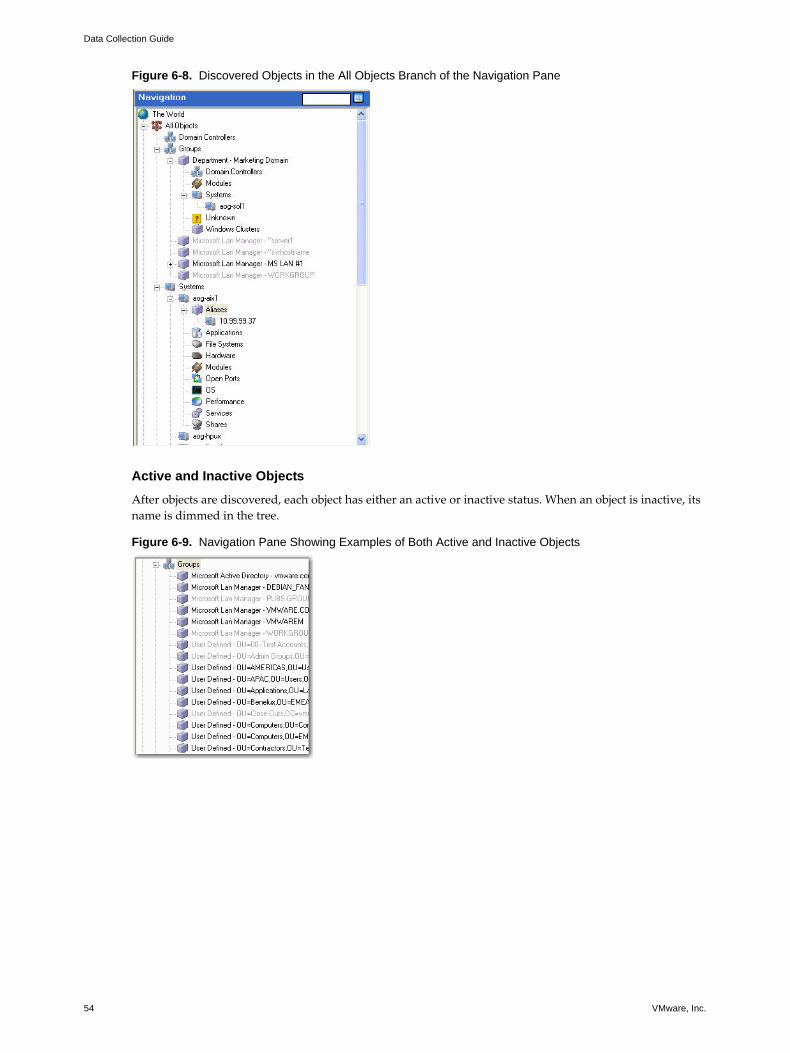
Data Collection Guide
54 VMware, Inc.
Figure 6-8. Discovered Objects in the All Objects Branch of the Navigation Pane
Active and Inactive Objects
After objects are discovered, each object has either an active or inactive status. When an object is inactive, its name is dimmed in the tree.
Figure 6-9. Navigation Pane Showing Examples of Both Active and Inactive Objects

VMware, Inc. 55
Chapter 6 Navigating the Data Manager
To change the active status of an object
1 Right-click the object to display a pop-up menu.
The menu differs with each object. For example, if you might right-click one of the Group objects, you might see the following menu.
If the object is active, the Active option in the right-click menu is selected. If the object is inactive, the Active option in the menu is not selected.
2 Click the Active option in the right-click menu to select or deselect.
By default, all objects appear in the tree, regardless of their status.
To hide inactive objects, do one of the following
In the toolbar, click the Hide Inactive Objects icon.
On the menu bar, select View>Hide Inactive Objects.
The display in the Navigation pane changes to show only active items, and the toolbar light bulb icon appears dim.
To display the inactive objects again, do one of the following
In the toolbar, click the Show Inactive Objects icon.
On the menu bar, select View>Show Inactive Objects.
The display in the Navigation pane changes to show the inactive objects.
Searching the Navigation Tree
A search box is provided at the top of the Navigation pane to make navigation of the tree easier.
Enter the name of the object to find and click the search icon next to the box. If the object is found, the tree is expanded to that point, and the object is highlighted and expanded (shown in Figure 6-10 for ada-win).
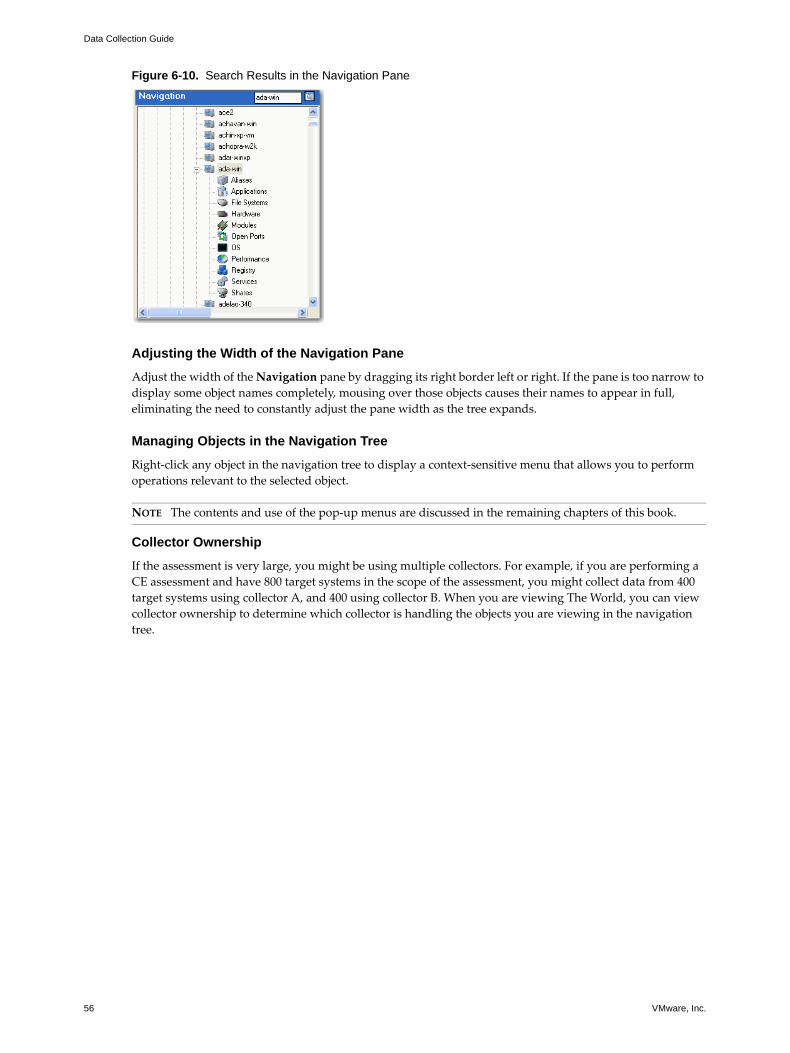
Data Collection Guide
56 VMware, Inc.
Figure 6-10. Search Results in the Navigation Pane
Adjusting the Width of the Navigation Pane
Adjust the width of the Navigation pane by dragging its right border left or right. If the pane is too narrow to display some object names completely, mousing over those objects causes their names to appear in full, eliminating the need to constantly adjust the pane width as the tree expands.
Managing Objects in the Navigation Tree
Right-click any object in the navigation tree to display a context-sensitive menu that allows you to perform operations relevant to the selected object.
Collector Ownership
If the assessment is very large, you might be using multiple collectors. For example, if you are performing a CE assessment and have 800 target systems in the scope of the assessment, you might collect data from 400 target systems using collector A, and 400 using collector B. When you are viewing The World, you can view collector ownership to determine which collector is handling the objects you are viewing in the navigation tree.
NOTE The contents and use of the pop-up menus are discussed in the remaining chapters of this book.

VMware, Inc. 57
Chapter 6 Navigating the Data Manager
To view collector ownership
1 Select an object in the navigation tree.
2 Right-click the object name to display a context-sensitive menu.
3 If Owned is selected, the selected object belongs to this collector. For more information, see the Capacity Planner Dashboard Users Guide topic describing load balancing.
Details PaneThe Details pane of the Data Manager screen appears to the right of the Navigation pane.
Figure 6-11. Details Pane of the Data Manager Screen
At the top of the pane are the following tabs:
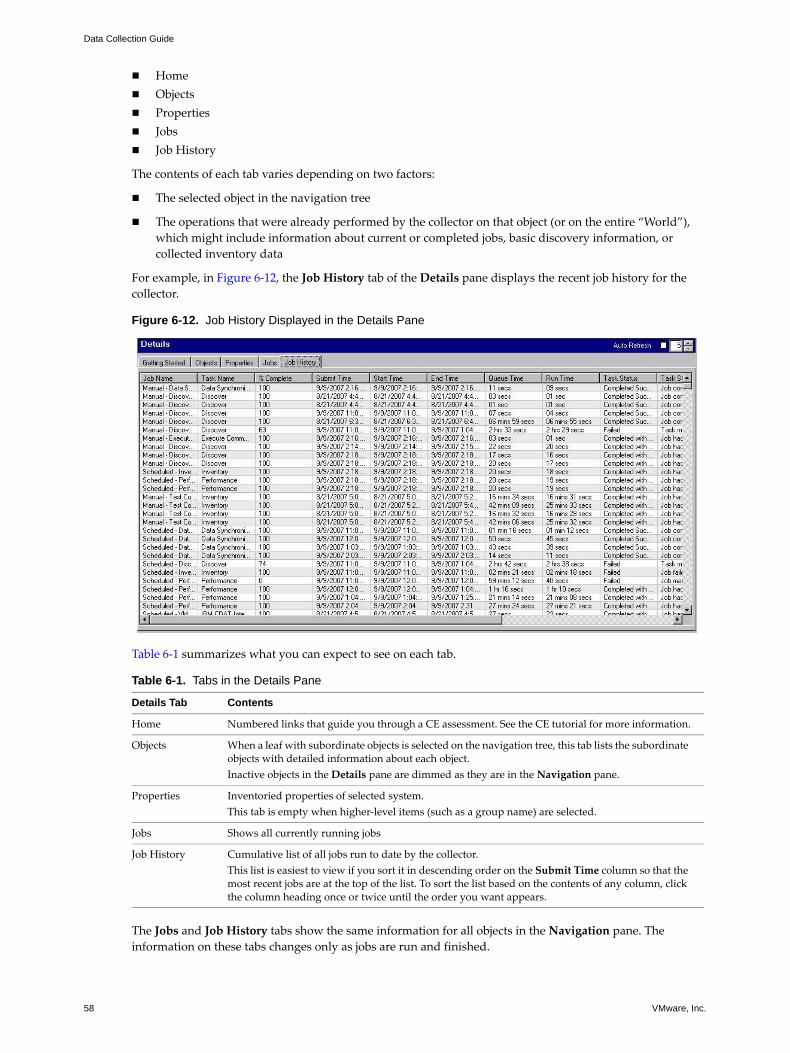
Data Collection Guide
58 VMware, Inc.
Home ObjectsPropertiesJobsJob History
The contents of each tab varies depending on two factors:
The selected object in the navigation tree
The operations that were already performed by the collector on that object (or on the entire “World”), which might include information about current or completed jobs, basic discovery information, or collected inventory data
For example, in Figure 6-12, the Job History tab of the Details pane displays the recent job history for the collector.
Figure 6-12. Job History Displayed in the Details Pane
Table 6-1 summarizes what you can expect to see on each tab.
The Jobs and Job History tabs show the same information for all objects in the Navigation pane. The information on these tabs changes only as jobs are run and finished.
Table 6-1. Tabs in the Details Pane
Details Tab Contents
Home Numbered links that guide you through a CE assessment. See the CE tutorial for more information.
Objects When a leaf with subordinate objects is selected on the navigation tree, this tab lists the subordinate objects with detailed information about each object.Inactive objects in the Details pane are dimmed as they are in the Navigation pane.
Properties Inventoried properties of selected system.This tab is empty when higher-level items (such as a group name) are selected.
Jobs Shows all currently running jobs
Job History Cumulative list of all jobs run to date by the collector.This list is easiest to view if you sort it in descending order on the Submit Time column so that the most recent jobs are at the top of the list. To sort the list based on the contents of any column, click the column heading once or twice until the order you want appears.

VMware, Inc. 59
Chapter 6 Navigating the Data Manager
Adjusting Display Areas in the Details Pane
Within the tabs of the Details pane, adjust columns by dragging the right border of the column heading accordingly.
You can widen or narrow the entire Details pane by dragging its left border.
Refreshing the Details Pane
The Details information is subject to change, especially as operations are run and completed. At the top right of the Details pane a check box allows you to specify a refresh period. Roll the cursor over the Auto Refresh label to display instructions for setting this refresh period.
Figure 6-13. Auto Refresh Check Box in the Details Pane
Message PaneYou can view the Message pane in the Data Manager window. Choose View>Message Box from the menu bar.
After the view is set to include the Message pane, the view remains that way for all subsequent starts of the Data Manager until the view is changed to hide the Message pane. When the Message pane is selected for viewing, it appears at the bottom of the Data Manager window.
Figure 6-14. Data Manager Window Showing the Message Pane
Adjust the height of the Message pane by dragging the upper border of the pane. To see the full text of any message line, point to the message line.
Figure 6-15. Full Text of an Inventory Message

Data Collection Guide
60 VMware, Inc.
Right-click anywhere inside the Message pane to display a pop-up menu that allows you to copy the contents of the pane to the Windows clipboard or to clear that portion of the window.
The messages displayed in the Message pane are the same messages that are logged in the collector’s log file. This log file is located in the Capacity Planner installation folder. If the default destination folder was accepted during the installation process, the path to the main log file is:
C:\Program Files\VMware\VMware CapacityPlanner\VMwareCP.log
The degree of detail in the logged messages is determined by the logging level that is defined as a global option.
Figure 6-16. General Tab of the Options Dialog Box Showing Log Level Settings
The current setting of the Logging Level field appears in the status bar. See an example in Figure 6-3, “Status Bar,” on page 52.
Other global options relevant to log management and the Message pane include:
Message Window SizeLog File Size# of Backup Logs
For more information about setting these global options, see “Admin Menu” on page 64 and Chapter 11, “Management Tasks,” on page 105.
To stop logging temporarily, select Pause Log at the top of the Message pane. Logging remains paused until the box is deselected. VMware recommends that you pause logging only for a short time.
Excluding Systems from CollectionYou can explicitly exclude systems from collection in the Data Manager. Exclude a system from all tasks, from inventory collection only, or from performance collection only.
To exclude a system from collection
1 In the Navigation pane, navigate to the Objects tree and select either Objects or Systems.
2 Select the system (or multiple systems using Ctrl+click) to exclude from a collection task.
3 Right-click and choose Exclude.
4 From the pop-up menu, choose the type of collection to exclude for this system.

VMware, Inc. 61
Chapter 6 Navigating the Data Manager
Menu StructureThis section describes the Data Manager menus.
File MenuThe File menu offers three options.
Import has two tabs; Host/Domains, and Pseudonym Keys.
The Host/Domains tab allows you to specify a comma-separated value (.csv) file as a file containing data to be imported. Click the View import systems template link for an explanation of how the .csv file must be formatted.
Figure 6-17. Import Dialog Box Showing Hosts/Domains Tab
For more information on importing host and domain information, see Chapter 7, “Discovery with the Data Collector,” on page 67.
The Pseudonym Keys tab allows you to specify the name of a file created in the Dashboard that contains data mapping keys for host/domain names that were disguised when exported to the Information Warehouse. See “Setting Logging Global Options” on page 107 for information on configuring data privacy options.
Export Host and Domain Keys starts an Export Keys dialog box that lets you name the .csv file in which you will export the host and domain name mapping data. Click Save to save the data under the name and location you selected.
Close terminates the current Data Manager session.
View Menu The View menu allows you to customize the Data Manager window.
You can choose whether to display the Toolbar, Status Bar, or Message Box, in addition to customizing what is shown in the Navigation tree.
In the Navigation Tree Options menu, you can hide (or display) inactive objects, as well as specify categories of objects to display.

Data Collection Guide
62 VMware, Inc.
Figure 6-18. Navigation Tree Options on the View Menu
Tasks Menu The collector can perform the following generic tasks: discovery, inventory, performance, data synchronization, and command execution. These tasks can be run at any time as manual tasks.
Some of these tasks need to be performed at specific times and at regular intervals. You can define scheduled jobs. By default, numerous scheduled jobs are defined at the time the collector is installed.
Tasks allows you to run either generic or scheduled tasks on demand. Run Manual Task allows you to run all manual tasks, or just a specific task.
Figure 6-19. Run Manual Tasks Menu
The Run Scheduled Jobs menu varies depending on the currently-defined scheduled jobs. For example, right after the installation of the collector, the menu appears as shown below.
Figure 6-20. Run Scheduled Jobs Menu
Information about manual and scheduled tasks is presented in the subsequent chapters on the corresponding operations of discovery, inventory, performance data collection, and data synchronization.
Information about scheduled tasks is also provided in Chapter 11, “Management Tasks,” on page 105.
Reports The Data Manager provides summary or detailed information on the data that is collected by the collector. Each report is a plain table displayed in a new window when the report is requested.
Chapter 11, “Management Tasks,” on page 105 presents guidelines and additional information on the content and use of the Data Manager reports.
Five report categories are available from the Reports menu of the Data Manager. They are Inventory Descriptions Reports, Inventory Reports, Performance Reports, Collector Reports, and Systems Summary Report.

VMware, Inc. 63
Chapter 6 Navigating the Data Manager
Inventory Descriptions Reports
The Descriptions reports provide basic reports of description information collected by the Inventory task.
Figure 6-21. Descriptions Reports Menu
See Chapter 8, “Inventory,” on page 87.
Inventory Reports
You can view collected inventory data in either Summary or Detailed Inventory reports.
Figure 6-22. Inventory Summary Reports Menu
Figure 6-23. Inventory Detailed Reports Menu
For a discussion of the Inventory process and the collection of inventory data, see Chapter 8, “Inventory,” on page 87.
Performance Reports
Performance reports allow you to view performance data that is collected. You can view a summary report of all performance statistics or focus on a specific category of performance data.
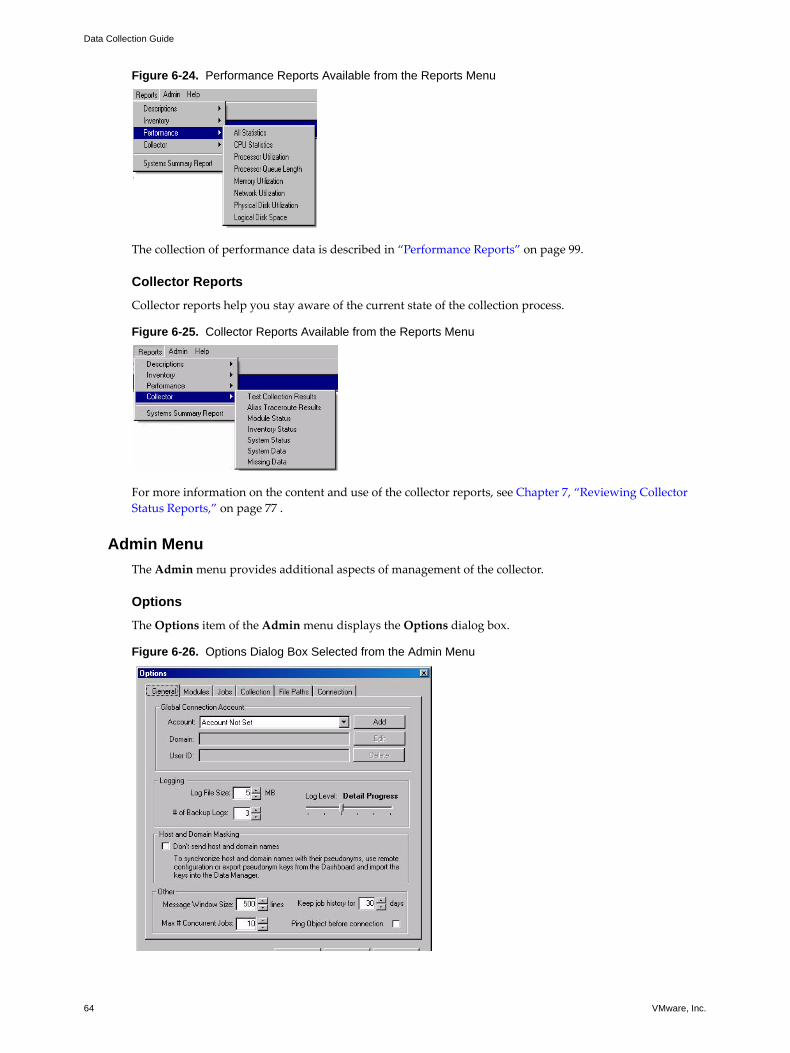
Data Collection Guide
64 VMware, Inc.
Figure 6-24. Performance Reports Available from the Reports Menu
The collection of performance data is described in “Performance Reports” on page 99.
Collector Reports
Collector reports help you stay aware of the current state of the collection process.
Figure 6-25. Collector Reports Available from the Reports Menu
For more information on the content and use of the collector reports, see Chapter 7, “Reviewing Collector Status Reports,” on page 77 .
Admin MenuThe Admin menu provides additional aspects of management of the collector.
Options
The Options item of the Admin menu displays the Options dialog box.
Figure 6-26. Options Dialog Box Selected from the Admin Menu

VMware, Inc. 65
Chapter 6 Navigating the Data Manager
This is one of the most important dialog boxes in the Data Manager and is described in Chapter 11, “Management Tasks,” on page 105.
Collector Management
The Collector item on the Admin menu allows you to control the execution of the collector service from the Data Manager.
Figure 6-27. Collector Options Available from the Admin Menu
You can stop, restart, or uninstall the collector using these menu choices.
Stop—Stops the collector service. A Stop Service dialog box prompts you to confirm your action. If you click Yes, the collector service stops until you manually start it. The menu path changes to Admin>Collector>Start. Choose Start when you are ready to run the service again.
Restart—Stops and restarts the collector service.
Uninstall—Uninstalls the collector. The Uninstall Collector Service dialog box prompts you to confirm your action. If you click Yes to continue, the collector is removed from the host machine. VMware recommends that you remove the collector service when you finish an assessment and will not be returning to the customer site.
Database Management
You can perform management functions on the local collector database through the Database submenu.
Figure 6-28. Database Management Options Available from the Admin Menu
Compact Database—Reclaims poorly used memory in the AOGCapPlan.mdb file. You must stop the collector service before compacting the database. The Compact successful message appears in the Message pane when the task is finished. Remember to start collector service again when compaction is complete. See “Unsuccessful Database Compaction” on page 125 for troubleshooting tips.
Check Database—Performs an integrity check of the AOGCapPlan.mdb file. The Database check completed message appears in the Message pane when the task is finished.
Purge Database—Clears collected data from the AOGCapPlan.mdb file. A Purge Database dialog box appears, prompting you to verify that you want to continue the purge process. All data in the AOGCapPlan.mdb file is destroyed if you click Yes to continue. There is no Undo command, so be sure you want to continue before clicking Yes. See “Purge Database” on page 126.
Display Database ID—Enables you to obtain the ID for this local database, so that it can be registered in the Information Warehouse. Registration of the Database ID is documented in Chapter 5, “Setting Up the Collector,” on page 43.
Setup Wizard
The Run Setup Wizard option (at the bottom of the Admin menu) usually runs automatically when the Data Manager is started after a new installation of the collector. It is described in Chapter 5, “Setting Up the Collector,” on page 43.

Data Collection Guide
66 VMware, Inc.
VMware, Inc. 67
7
The following topics are described in this chapter:
“Discovery Overview” on page 67
“General Discovery Process” on page 69
“Discovering Domains” on page 70
“Discovering Systems” on page 73
“Adding Systems” on page 75
“Working with Systems” on page 76
“Configuring the Collector for UNIX and Linux Collection” on page 80
“Accessing the Discover Options” on page 82
“Setting the Discover Options” on page 83
“Scheduling Discovery Jobs” on page 84
“About Discovery Tuning” on page 84
Discovery OverviewAfter installing and setting up the collector, identify all target systems to include in the assessment. Identify target systems using one of the following three methods:
Use the Discovery task to discover all target systems
Manually add each system interactively through the Data Manager
Import target system definitions from a comma-separated data file
The Discovery process uses standard naming services to find systems. An IP Scan option allows you to define subnet ranges and ports for scanning.
The Discovery process finds groups and domains first, then computers within the groups and domains.
Discovery with Name ServicesDiscovery depends on name services such as Windows Internet Naming Service (WINS), LAN Manager, Active Directory, and Domain Name Service (DNS). The majority of discovery problems occur when the collector cannot reach the name service from its physical location or through established network rules. These rules include firewalls, subnet masks, authentication, and network card configuration settings.
Chapter 12, “Troubleshooting Capacity Planner,” on page 115 presents many common problems with the discovery process and offers suggestions for eliminating or avoiding those problems.
Discovery with the Data Collector 7
Data Collection Guide
68 VMware, Inc.
This chapter provides a general description of each name service and a discussion of issues that might arise when you try to discover systems through that service. “General Discovery Process” on page 69 provides information about how to set up your discovery tasks with regard to these naming services.
Windows Internet Naming Service (WINS)
WINS and browser naming services generate a similar list of systems, yet are different in the way they are set up and accessed. WINS uses a dedicated server with a database of systems that is queried when the call is made. The browser naming service is a peer-to-peer-based name service that allows any system to be the manager of the database. The same Windows API call attempts to access both naming services to return a complete list.
To access the browser naming service, a broadcast method is used. The broadcast method is restricted to the Class C IP subnet in which the collector is a member. It also tries the LMHOST files. Workgroups in Microsoft networks use browser name resolution.
WINS can be set up by DHCP or it can be manually set up in the network card configuration. Microsoft allows up to 12 WINS servers to be specified in a search list. If problems are encountered when trying to access the WINS servers, it is usually because of incorrect network card settings or the presence of firewalls in the network.
Active Directory
Microsoft Active Directory usually requires the requesting system (that is, the collector) to be a domain member before Active Directory Service Interface (ADSI) queries can be used. If you get an error that indicates a table is missing during discovery, it is most likely that the Active Directory is unreachable or is not allowing your query.
DNS
The domain name service (DNS) is the primary naming service for the Internet. DNS translates Internet addresses to IP addresses. Within many customers’ networks, DNS is used as a primary naming service to resolve system and domain names to IP addresses.
DNS is set up similarly to WINS and is affected by the same problems. In many companies, the DNS server can restrict listing systems in the domain to reduce network use and DNS queries. If a company does not allow listing systems in a domain, an alternative method is needed for the discovery task.
Alternatives to Naming ServicesThis section describes alternative methods for discovery that do not rely on naming services.
IP Scanning
If all the naming services are failing, or you want to find systems that are not part of any naming service, use IP scanning to discover systems on the network. “Discovering Domains” on page 70 discusses how IP scanning can be specified for the discovery tasks.
Manually Adding Domains and Systems
As an alternative to the discovery process the collector performs, you can manually add named domains and systems. This can be a way of identifying additional domains and systems to complement those that were discovered by the standard discovery process. The following are the methods of manually adding named domains and systems:
Manually add a named domain or system, one at a time, through the navigation tree. See “Adding Systems” on page 75.
Import multiple named domains or systems from a comma-separated value data file. For instructions on how to import domains and systems, see “Importing Domains and Systems” on page 71.

VMware, Inc. 69
Chapter 7 Discovery with the Data Collector
Linux and UNIX Considerations
When the Discovery task encounters a UNIX or Linux system, it runs a simple script that runs the uname utility to get the host name and other basic system information. Later, when data collection is performed on the discovered UNIX or Linux system, more complex scripts and procedures are performed. See Chapter 8, “Inventory,” on page 87 and Chapter 9, “Collecting Performance Data,” on page 95.
General Discovery ProcessThe steps you follow to discover the systems in your client environment are somewhat flexible. However, VMware recommends the process outlined, especially for users who are new to VMware Capacity Planner. The general approach is to discover everything that exists and then make adjustments.
After you follow the process to discover the systems in the client environment, the discovery task runs once daily by default. Discovery runs daily because environments change frequently—systems might be removed, added, or might be offline temporarily. By running discovery daily or at least frequently, you ensure that all systems from which you want to collect inventory and performance data are included.
The recommended technique for discovering domains and systems is described in Table 7-1.
After you have discovered all targeted domains and systems, proceed to Chapter 8, “Inventory,” on page 87 to set up and perform inventory data collection.
NOTE This default setting applies only to MS LanMan systems and not to UNIX and Linux systems. Adjust the discovery settings for UNIX and Linux environments.
Table 7-1. Steps for Discovering Domains and Systems
Step Discovery Task Where to Find the Information
1. Run a special job to discover only the domains in the network.
“Discovering Domains” on page 70
2. Confirm that all targeted domains are discovered.Check the Message pane or log file to see if any errors occurred to affect the outcome of the Discovery task.
“Navigation Pane” on page 53
3. Deactivate any domains that are not to be included in further data collection or assessment efforts.
“Deactivating Domains” on page 72
4. Manually import or add any domains that were not discovered.
“Manually Adding Domains” on page 72 and“Importing Domains and Systems” on page 71
5. Run a Discovery task to discover only systems, setting the discovery options as appropriate.
“Discovering Systems” on page 73
6. Confirm that all desired systems were discovered.Check the Message pane or log file to see if any errors occurred to affect the outcome of the Discovery task.
“Navigation Pane” on page 53
7. If necessary, manually import any systems that were not discovered.
“Adding Systems” on page 75 and “Importing Domains and Systems” on page 71
8. Deactivate any systems that are not to be included in further data collection or assessment efforts.
“Deactivating Systems” on page 79
9. Validate connections for all systems. “Testing System Connections” on page 76 and “Validating Linux and UNIX Systems” on page 80
NOTE You might find it helpful to increase your logging level before beginning the discovery process. By raising the logging level to Light Debugging (level 4), you receive more detailed information about each phase of the Discovery task. This information is logged and can be viewed as it happens in the Message pane of the Data Manager window.
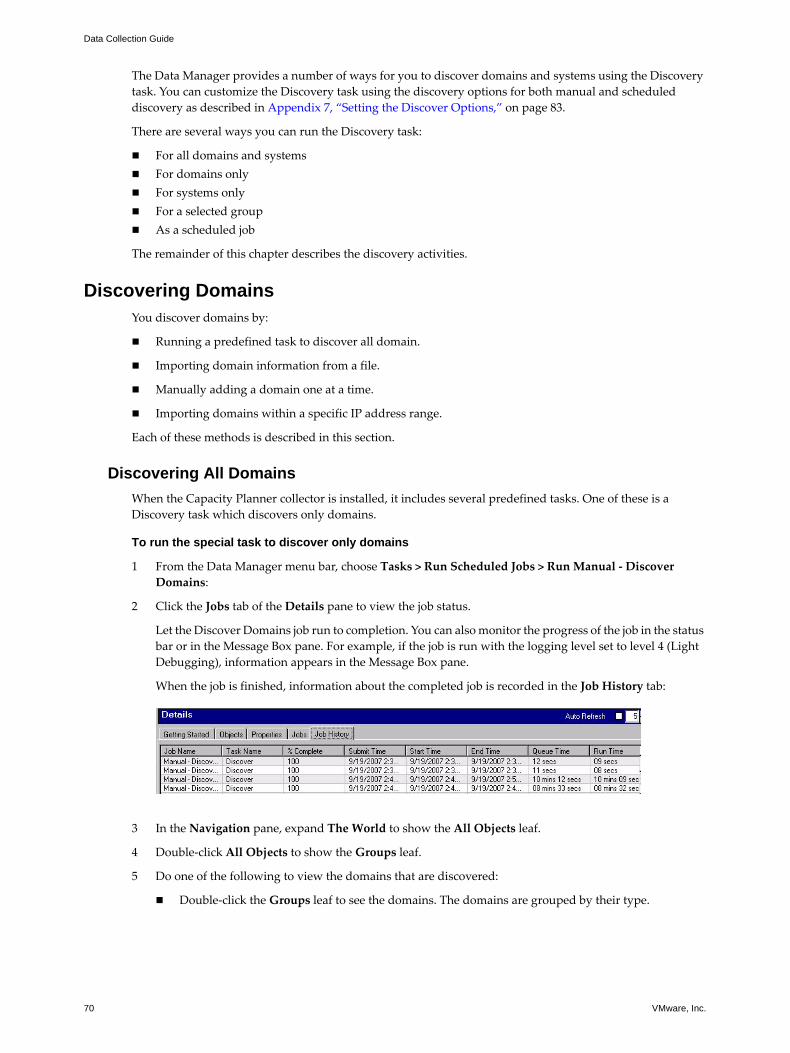
Data Collection Guide
70 VMware, Inc.
The Data Manager provides a number of ways for you to discover domains and systems using the Discovery task. You can customize the Discovery task using the discovery options for both manual and scheduled discovery as described in Appendix 7, “Setting the Discover Options,” on page 83.
There are several ways you can run the Discovery task:
For all domains and systemsFor domains onlyFor systems onlyFor a selected groupAs a scheduled job
The remainder of this chapter describes the discovery activities.
Discovering DomainsYou discover domains by:
Running a predefined task to discover all domain.
Importing domain information from a file.
Manually adding a domain one at a time.
Importing domains within a specific IP address range.
Each of these methods is described in this section.
Discovering All Domains When the Capacity Planner collector is installed, it includes several predefined tasks. One of these is a Discovery task which discovers only domains.
To run the special task to discover only domains
1 From the Data Manager menu bar, choose Tasks > Run Scheduled Jobs > Run Manual - Discover Domains:
2 Click the Jobs tab of the Details pane to view the job status.
Let the Discover Domains job run to completion. You can also monitor the progress of the job in the status bar or in the Message Box pane. For example, if the job is run with the logging level set to level 4 (Light Debugging), information appears in the Message Box pane.
When the job is finished, information about the completed job is recorded in the Job History tab:
3 In the Navigation pane, expand The World to show the All Objects leaf.
4 Double-click All Objects to show the Groups leaf.
5 Do one of the following to view the domains that are discovered:
Double-click the Groups leaf to see the domains. The domains are grouped by their type.

VMware, Inc. 71
Chapter 7 Discovery with the Data Collector
Select the Groups leaf in the tree to view the list of domains in the Objects tab of the Details pane. They are listed by name in alphabetical order.
The default domain discovery task discovered domains of the following types:
Active DirectoryLAN Manager
Importing Domains and Systems You can import domains (groups) and systems from an import file. The syntax for importing domains and systems is as follows:
groupname,servername1,[alias1, alias2, ..., aliasn]groupname,servername2,[alias1, alias2, ..., aliasn]groupname,servername3,[alias1, alias2, ..., aliasn]groupname,servername4,[alias1, alias2, ..., aliasn]...etc...
where groupname is a name that matches a group type in the list below and is always the same. Similarly, all systems in an import file should be the same type. Valid group and system types are described in Table 7-2.
Within the listed groups are the domains: Domain Name Service (DNS), Microsoft Active Directory, and Microsoft LAN Manager. In the case where the systems in the import file already exist and you are importing a group, the systems are not recreated but they are assigned to the group. This is another way to assign systems to groups.
To import domains and systems from a file
1 Choose File > Import.
2 Either type the fully qualified filename or browse the file system for the file.
3 Select the type of systems that are listed in the import file.
Include only one type of system in each import file.
Table 7-2. Valid Group and System Types
Valid Group Types Valid System Types
DepartmentDomain Name Service (DNS)EnvironmentFunctionIP SubnetLocationMicrosoft Active DirectoryMicrosoft LAN ManagerUser-Defined
Microsoft Windows WorkstationMicrosoft Windows ServerLinux and UNIXMicrosoft Windows PDCMicrosoft Windows BDCMicrosoft Windows Cluster

Data Collection Guide
72 VMware, Inc.
4 Select the type of group included in the file.
Include only one type of group in each import file.
5 Click Import.
Manually Adding DomainsIf the client environment has domains that you want to include but they are not added to the list of objects in the Navigation pane during the discovery process, you can add them manually one at a time.
To manually add a domain
1 In the Navigation pane, select the Groups branch under All Objects.
2 Right-click and choose Add Group.
3 Enter the name of the domain.
4 Enter the description of the domain.
5 Select the type of the domain.
6 Click Add.
The Data Manager adds a new group for this domain in two places:
The Groups branch
The specific domain branch; for example, if the domain is a Microsoft LAN Manager domain, the Microsoft LAN Manager branch also shows the new domain
To add systems to the new domain, see “Adding Existing Systems to a Group” on page 76.
Deactivating Domains After you discover or identify the domains in a network, you might want to prohibit one or more of them from being included in subsequent collection tasks. To do so, mark the domains as inactive. You can deactivate a domain from either the Navigation pane or the Details pane of the Data Manager window, using the latter technique to deactivate multiple domains in a single operation.
Deactivating a domain stops discovery on that domain and stops data about that domain from being uploaded to the Information Warehouse. However, if the domain has systems assigned to it, deactivating the domain does not stop inventory or performance collection on systems that belong to that group. This is because systems can belong to multiple groups. To stop collection on a system, you must explicitly select that system and deactivate it as described in “Deactivating Systems” on page 79.
If a domain that was discovered is no longer active, you can deactivate it and it won’t be uploaded to the Information Warehouse. However, it remains dimmed in the navigation list. Remove it from view by using the Show/Hide objects icon.

VMware, Inc. 73
Chapter 7 Discovery with the Data Collector
To deactivate a domain
1 In the Navigation pane, expand the navigation tree to show the domain to deactivate.
2 Select the domain and right-click it.
3 Select Active to deselect it (if necessary).
When Active is not checked, the domain is inactive and is not processed in any collection tasks.
Discovering SystemsThe purpose of discovering systems is to define the scope of the capacity planning assessment.
You can run the Discovery task at any time. For example, you might want to run the Discovery task if you added a domain or know that changes were made in your client’s environment.
The Data Manager includes built-in discovery tasks to help you:
Manually discover all systems. See “To discover all systems using the default settings provided with the Data Manager” on page 73.
Discover systems within an IP address range. See “To discover systems within an IP address range” on page 74.)
Set up a scheduled discovery job to automatically discover all systems or systems that fit specific criteria. See “Accessing the Discover Options” on page 82.
These processes are described in this section.
In addition to using the discovery tasks, you can also add systems from which you want to collect by:
Importing system information from a file (See “Importing Domains and Systems” on page 71.)
Manually adding a system one at a time (See “Adding Systems” on page 75.)
To discover all systems using the default settings provided with the Data Manager
1 Choose Tasks > Run Manual Tasks > Run Discover Task.
A new job appears in the Jobs tab of the Details pane. Scroll to the right to see additional columns and data.
In the Details pane, you can select multiple domains to deactivate by pressing the Control key. However, you can deactivate multiple domains only when they are grouped together on the same level under the same leaf of the navigation tree.
NOTE Inactive objects are dimmed in the Navigation pane. You can hide or show them by clicking the Show/Hide objects icon.

Data Collection Guide
74 VMware, Inc.
You can monitor the progress of the job in the status bar, on the Jobs tab, and in the Message pane. What you can see in the Message pane depends on the log level setting. The Message pane displays the progress of the discovery task, and the status bar displays the percentage complete. When the discovery job is complete, the following message appears in the Message pane:
Discover: Completed for Job Task ID=<number>
You can also view the status of this job and all others in the Job History tab of the Details pane.
2 When you see Discover:Complete as part of the message text, click Job History to view the status of the job.
Scroll to the right to see additional columns and data.
3 Confirm that systems you want are included by expanding the Systems branch to visually inspect the systems that are discovered.
To discover systems within an IP address range
To limit the discovery to an IP address range, modify the options for the task so that it includes the IP address range in its search for systems.
1 From the Data Manager menu bar, choose Admin > Options.
2 Select the Modules tab.
3 Double-click the Discover module.
4 Click the IP Subnets tab.
5 Under the IP Subnet Ranges box, click Add to define an IP subnet to be scanned by the Discover module.
6 Specify the necessary data in the Add Subnet dialog box.
7 Click Add.
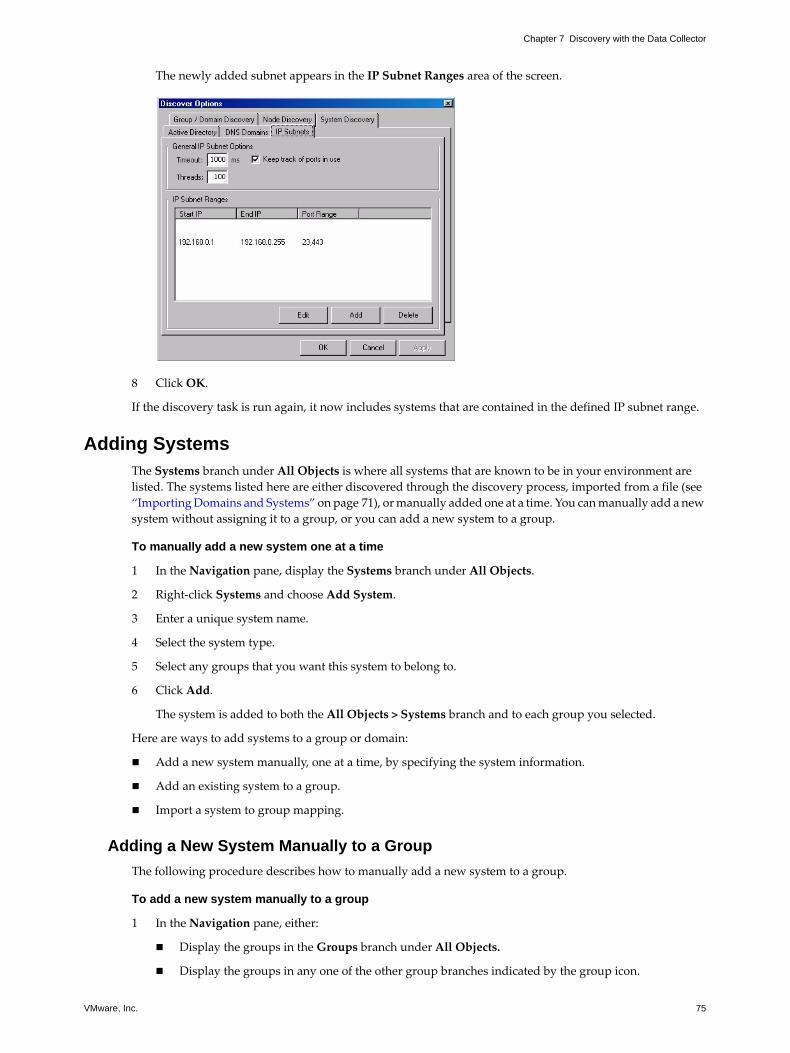
VMware, Inc. 75
Chapter 7 Discovery with the Data Collector
The newly added subnet appears in the IP Subnet Ranges area of the screen.
8 Click OK.
If the discovery task is run again, it now includes systems that are contained in the defined IP subnet range.
Adding SystemsThe Systems branch under All Objects is where all systems that are known to be in your environment are listed. The systems listed here are either discovered through the discovery process, imported from a file (see “Importing Domains and Systems” on page 71), or manually added one at a time. You can manually add a new system without assigning it to a group, or you can add a new system to a group.
To manually add a new system one at a time
1 In the Navigation pane, display the Systems branch under All Objects.
2 Right-click Systems and choose Add System.
3 Enter a unique system name.
4 Select the system type.
5 Select any groups that you want this system to belong to.
6 Click Add.
The system is added to both the All Objects > Systems branch and to each group you selected.
Here are ways to add systems to a group or domain:
Add a new system manually, one at a time, by specifying the system information.
Add an existing system to a group.
Import a system to group mapping.
Adding a New System Manually to a GroupThe following procedure describes how to manually add a new system to a group.
To add a new system manually to a group
1 In the Navigation pane, either:
Display the groups in the Groups branch under All Objects.
Display the groups in any one of the other group branches indicated by the group icon.
Data Collection Guide
76 VMware, Inc.
2 Select a group.
3 Right-click the group name to add a system to and select Add System.
4 Enter the system name.
5 Select the system type.
6 Select any additional groups to add this system to.
7 Click Add.
The system is added to both the All Objects > Systems branch and to each group you selected.
Adding Existing Systems to a GroupThis section describes ways to add an existing system to a group.
To edit the definition for each system one at a time
1 Select a system name, right-click and choose Edit.
2 In the Edit System dialog box under Group Membership, check all groups to which this system belongs.
3 Click OK.
To add an existing system to a group by specifying that system name
1 Follow the procedure to add a new system. (See “Adding a New System Manually to a Group” on page 75.)
2 Specify the name of an existing system.
To drag one or more systems to the group
1 In the Navigation pane, display the Systems branch under All Objects.
2 Select the Objects tab in the Details pane.
The Objects tab displays a list of all systems that are discovered or defined along with detailed information about each one.
3 Select one (or multiple systems using Shift-click) and drag it to any group name in the Navigation pane.
The group must not be expanded when you drag a system to the group. Systems can belong to multiple groups. See “Importing Domains and Systems” on page 71.
Working with SystemsYou can monitor and control collection from the systems in the client environment in several ways. This section discusses the following methods:
Testing system connections
Working with unknown objects
Deactivating systems
Excluding systems from modules
Testing System ConnectionsThe collector must be able to connect to each system to discover it and collect inventory and performance data. UNIX and Linux systems are validated automatically. If for some reason automatic validation does not happen, you can validate connection using the process described in “Validating Linux and UNIX Systems” on page 80. For Windows systems, you can test the connection. See “To test a Windows system connection” on page 78.

VMware, Inc. 77
Chapter 7 Discovery with the Data Collector
Attempt to collect inventory data first. After running the inventory task, you can see which systems were successful, which helps you focus on the systems that had problems with connectivity.
To test the system connections
Review the system connection status in the collector reports.
Test the individual system connection.
Reviewing Collector Status Reports
After running inventory or performance tasks, you can view the status of the system’s connectivity as well as the status of the modules in one of the collector reports. You can also view a report that shows you the alias for each system if you are using the data privacy feature, a report that shows you missing data to verify the completeness of your assessment, and reports that provide other helpful information related to data collection.
To view the collector reports, choose Reports > Collector and select a report. While viewing the collector reports, you can:
Scroll to the right and left to view all of the data.
Sort the data by any column by clicking on the column header.
Select multiple systems using Shift+select or Shift+Ctrl.
Select a system and right click to display a context-sensitive menu of other tasks you can perform on this system.
Click Export to save the report to a CSV file.
Click Run Test Collection to test connection to the systems.
Click Set Account to change the account being used for accessing a system or group of systems.
Click Activate to activate a currently inactive system.
Click Deactivate to inactivate a currently active system.
Click Refresh to refresh the view.
Click Close to exit the report.
Test Collection Results Report
The Test Collection Results report lets you view the account name and connection status (using WMI, Registry, and PerfMon) for all known systems. If you are using the data privacy feature, the host alias name appears in the Alias column. Otherwise, the column is blank.
Alias Traceroute Results Report
If you are using the data privacy feature, the Alias Traceroute Results Report provides information that lets you map alias names back to individual system names. This report also includes information that helps you troubleshoot connection, such as the IP address for each system, the data and time the system was found, the date and time a connection was last attempted and the status of the attempt, as well as the number of connection failures, if any.
Module Status Report
The Module Status report provides information that lets you view the history and status of the collector modules for each system in the assessment.
Inventory Status Report
The Inventory Status report lets you view the history and status of inventory collection on each known system.

Data Collection Guide
78 VMware, Inc.
System Status Report
The System Status report shows you which systems in the scope of the assessment are consolidatable. You can also see at a glance the operating system, which machines are virtual and which are physical machines, the valid account name, and other helpful information.
System Data Report
The System Data Report is another report that lets you quickly scan results after you have run an assessment. The report lists key inventory and performance data for each system. An X indicates data was not successfully collected. In this case, troubleshoot the assessment to find out why the data is not available.
Missing Data Report
As implied by the report title, this report lets you scan quickly for missing data. An X indicates data was not successfully collected.
Testing Windows System Connections
You can test the connectivity for Windows systems one at a time.
To test a Windows system connection
1 In the Navigation pane, select the system to test.
2 Right-click and choose Utilities > Test Connection.
The Data Manager displays the test results for the selected system in the Individual Test Results pane.
Working with Unknown Objects Unknown objects are objects for which the Discover process cannot determine the type. Currently, the Discovery process determines only UNIX, Linux, Microsoft Windows Workstation, Microsoft Windows Server, and Microsoft Windows Cluster system type objects.
The Discovery process cannot determine the object type in the following instances:
The object type is anything other than a UNIX, Linux, Microsoft Windows Workstation, Microsoft Windows Server and Microsoft Windows Cluster system.
The object type is one of the recognized systems, but the Discovery process was unable to connect due to an incorrect user account.

VMware, Inc. 79
Chapter 7 Discovery with the Data Collector
In both cases, the object is created in the Unknown branch of the All Objects tree in the Navigation pane.
To change the Unknown objects to System objects, visually review the objects in the Unknown branch. If you know that any are system objects, convert them to the appropriate system type by right-clicking the object in the Navigation pane and select Create System. This changes the object type from Unknown to System.
Deactivating Systems After you discover or identify the systems in a network, you might want to prohibit one or more systems from being included in subsequent collection tasks. Mark the appropriate systems as inactive. You can deactivate a system from either the Navigation pane or the Details pane of the Data Manager window by using the Details pane to deactivate multiple systems in a single operation.
Data collected for deactivated systems are not sent to the Information Warehouse. The collector behaves as if the deactivated systems don’t exist. If the Information Warehouse already has a record of the systems and then they’re deactivated, on the next Monday the monitored flag is set to off and four weeks later the system data are excluded from the four-week summary in the Dashboard.
Deactivating a System in the Navigation Pane
You can deactivate a system in the Navigation pane or the Details pane. This section describes how to deactivate from the Navigation pane.
To deactivate a system in the Navigation pane of the Data Manager window
1 In the Navigation pane, expand the navigation tree to show the system to deactivate.
2 Select the system and right-click.
3 Select Active to deselect the check mark (if necessary).
When the Active option is not selected, the object is inactive and is not processed in any collection tasks.
Inactive objects are dimmed in the Navigation pane. You can hide or show them by clicking the Show/Hide objects icon.
Deactivating Objects from the Details Pane
You can deactivate a system in the Navigation pane or the Details pane. This section describes how to deactivate from the Details pane. You can deactivate multiple objects only when they are grouped together on the same level under the same leaf of the navigation tree.
To inactivate one or more objects from the Details pane of the Data Manager window
1 In the Navigation pane, expand the navigation tree to show the object or objects to deactivate.
2 Select the leaf of the tree that contains the objects to deactivate.
3 In the Details pane, select the Objects tab to display all the objects contained in the selected leaf.
4 When the list of subordinate objects appears, select the objects to be deactivated, using standard Windows selection techniques of Shift-click and Ctrl-click to select multiple objects in the list.
5 When all objects are selected, right-click the selected objects.
6 If Active is selected, deselect it.
This clears the Active status for all selected objects, inactivating those objects.
NOTE You can select multiple objects by pressing the Control key. However, you can deactivate multiple objects only when they are grouped together on the same level under the same leaf of the navigation tree.
Data Collection Guide
80 VMware, Inc.
Excluding Systems from ModulesYou can exclude a system from data collection. For example, you might have a device acting as a firewall that you don’t want included in the scope of your assessment.
To exclude a system from collection
1 Select the system in the navigation panel and right click.
2 Select Exclude, and one of the following:
Exclude All Tasks—Excludes the system from both inventory and performance collection
Exclude from Inventory—Excludes the system from inventory collection only
Exclude from Performance—Excludes the system from performance collection only
Configuring the Collector for UNIX and Linux CollectionCapacity Planner detects and collects data from UNIX and Linux target systems by running standard system utilities through an SSH connection. Every UNIX and Linux target system must have the SSH server daemon running and configured properly for a successful connection.
In addition, Capacity Planner uses the PuTTY application to provide for the creation and validation of keys required to access each UNIX or Linux system. To ensure that the collector can access the SSH keys, the collector is set up with a collector service account that matches the user that is running the Data Manager when the keys are generated and validated.
PuTTY ApplicationThe PuTTY application is a free SSH client that you can download to the collector if it is not automatically downloaded during installation of Capacity Planner. To download PuTTY, go to the following Web site:
http://www.chiark.greenend.org.uk/~sgtatham/putty/
PuTTY executable files are stored in the Capacity Planner 3rdParty folder.
The PuTTY SSH keys are stored in the host Collector Registry.
To view SSH key entries
1 On the collector host, select Start > Run.
2 In the Open field, type regedit.
3 Search for PuTTY>SSHHostKeys.
Validating Linux and UNIX SystemsAfter a UNIX or Linux system is discovered, connection validation should happen automatically. However, if your system was not validated automatically, validate the connection to each system individually by generating and validating the necessary SSH key.
To validate the connection to UNIX and Linux systems
1 In the Data Manager window, do one of the following:
In the Navigation pane, expand the navigation tree to display the UNIX or Linux system.
In the Navigation pane, select a high-level leaf containing the UNIX or Linux system, and select the system on the Objects tab of the Details pane.
NOTE Documentation on PuTTY can be found in its installation subfolder in the putty.hlp file. Double-click this file to open the documentation in online help format. For specific questions about PuTTY, see the PuTTY documentation, which is available from:http://www.chiark.greenend.org.uk/~sgtatham/putty/docs.html

VMware, Inc. 81
Chapter 7 Discovery with the Data Collector
You can select more than one UNIX or Linux system to process in parallel by selecting the multiple systems on the Objects tab, using standard Windows selection methods.
2 Right-click the selected system (or systems) and choose Utilities > Unix Terminal.
3 An SSH session is started to each of selected target systems. If prompted by a security alert to verify the SSH key, click Yes. Log in using a valid login ID and password.
If multiple target systems were selected, an SSH session starts for the next target system until all selected systems are processed.
A fast way to close multiple open PuTTY windows is to open the Task Manager on the collector (using Ctrl-Alt-Delete). Click on the PuTTY applications, select all the PuTTY clients, and click End Task.
After the trust relationship is established for each UNIX and Linux target system, connections to the target systems are successful for collection.
Linux and UNIX CollectionAfter the SSH session connects and the sh script runs, the collected data is stored in a file local to the collector. Output is stored in C:\Program Files\VMware\VMware Capacity Planner\Temp.
Table 7-3 shows a comparison of the system information collected, depending on the data source of the information.
Scripts Used for Linux and UNIX Collection
You can configure how scripts collect data from Linux and UNIX target machines. You configure options on the Collection tab of the Options dialog box.
To configure how scripts collect data from Linux and UNIX machines
1 Select Admin > Options, and click the Collection tab.
2 You can either select Run scripts remotely, which does not install anything on the target machines, or Install and run scripts locally on each target machine. The advantage of running scripts remotely is that the process ensures that the most current scripts are running. The advantage of installing and running scripts locally is that there is less overhead on the collector host, since the work is distributed on each target machine being polled.
By default, scripts are stored in C:\Program Files\VMware\VMware Capacity Planner\scripts.
Table 7-3. System Information Polled by the Collector
Setting Linux and UNIX Viewable in Manager Viewable in Web
Host name Yes Yes Yes
System Partition Yes Yes No
Boot Directory Yes Yes No
PATH Environment Yes Yes No
Auto Logon Setting No Yes No
Shutdown without Logon No Yes No
Server Type Yes Yes Yes
Operating System Manufacturer
Yes Yes Yes
Operating System Type Yes Yes Yes
Operating System Version/Release/Service Pack
Yes Yes Yes

Data Collection Guide
82 VMware, Inc.
Manually Creating a crontab Entry When SSH Is Unavailable
If you cannot use SSH to collect data from the target machines, you can manually set up a crontab entry to run aog_perf.sh every hour. Open the aog_setup.sh file in any editor, such as Notepad or vi, and edit the script as shown in Figure 7-1.
Figure 7-1. Manual Edits to aog_setup.sh Script
Accessing the Discover OptionsThe Discover module has multiple options that let you control discovery. You set the default options for the discover module in the Discover Options dialog box to control the means of system discovery.
Manual discovery — Run discover at any time using the Tasks > Run Manual Tasks > Run Discover Task command. The discover options are what you set as the general default settings.
Scheduled discovery — Schedule one or more discover jobs by using customized discover options that you specify for each job.
Use the same Discover Options dialog box for setting up manual discovery and for scheduled discovery jobs set up using the job scheduler. Accessing the Discover Options dialog box is different for manual and scheduled discovery.

VMware, Inc. 83
Chapter 7 Discovery with the Data Collector
To access the Discover options for manual jobs
1 Choose Admin > Options.
2 Click the Modules tab.
3 Double-click the Discover module.
For information about each tab on the Discover Options dialog box, see “Setting the Discover Options” on page 83.
To access the Discover Options for running scheduled discover tasks
1 Choose Admin > Options.
2 Click the Jobs tab.
3 Select a Discover job under the Scheduled - Discover module and click Modify.
4 Click the Tasks tab.
5 Select the Discover task and click Settings.
For information about each tab on the Discover Options dialog box, see “Setting the Discover Options” on page 83. For information about defining and scheduling discover jobs, see “Scheduling Discovery Jobs” on page 84.
Setting the Discover OptionsWhen you access the Discover Options dialog box, either for setting the discover options that are started manually or for setting the options for a specific discover task, the options and their purpose are the same. The tabs on the Discover Options dialog box are described in this section.
Setting the Group or Domain Discovery OptionsThe Group/Domain Discovery tab specifies which groups and domains are targeted for discovery.
Figure 7-2. Group/Domain Discovery Tab on the Discover Options Dialog Box
Select Discover to exclude new domains from discovery.
Setting the System Discovery OptionsThe System Discovery tab specifies how system types are discovered and whether new systems are to be excluded from inventory or performance collection.
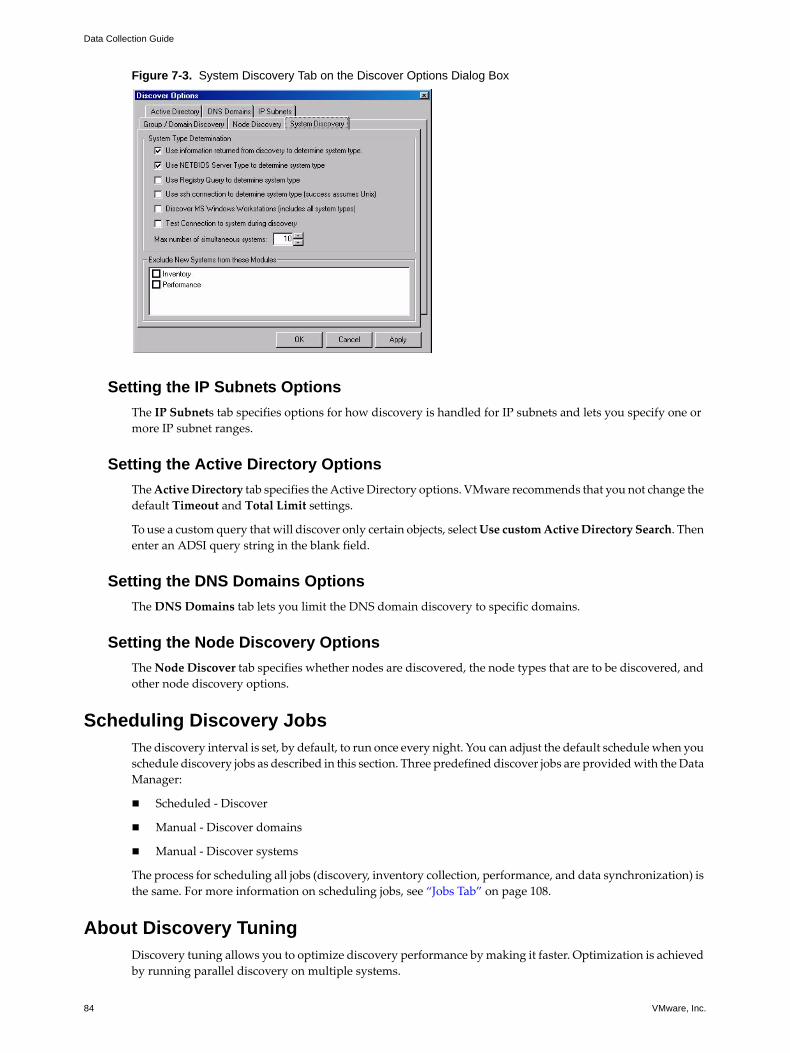
Data Collection Guide
84 VMware, Inc.
Figure 7-3. System Discovery Tab on the Discover Options Dialog Box
Setting the IP Subnets OptionsThe IP Subnets tab specifies options for how discovery is handled for IP subnets and lets you specify one or more IP subnet ranges.
Setting the Active Directory OptionsThe Active Directory tab specifies the Active Directory options. VMware recommends that you not change the default Timeout and Total Limit settings.
To use a custom query that will discover only certain objects, select Use custom Active Directory Search. Then enter an ADSI query string in the blank field.
Setting the DNS Domains OptionsThe DNS Domains tab lets you limit the DNS domain discovery to specific domains.
Setting the Node Discovery OptionsThe Node Discover tab specifies whether nodes are discovered, the node types that are to be discovered, and other node discovery options.
Scheduling Discovery JobsThe discovery interval is set, by default, to run once every night. You can adjust the default schedule when you schedule discovery jobs as described in this section. Three predefined discover jobs are provided with the Data Manager:
Scheduled - Discover
Manual - Discover domains
Manual - Discover systems
The process for scheduling all jobs (discovery, inventory collection, performance, and data synchronization) is the same. For more information on scheduling jobs, see “Jobs Tab” on page 108.
About Discovery TuningDiscovery tuning allows you to optimize discovery performance by making it faster. Optimization is achieved by running parallel discovery on multiple systems.

VMware, Inc. 85
Chapter 7 Discovery with the Data Collector
To configure the discovery tuning attribute for a discovery task that is run manually
1 Choose Admin > Options.
2 Select the Modules tab.
3 Double-click Discover.
4 Select the System Discovery tab.
In the Max number of simultaneous systems field, click the up and down arrows to indicate the preferred degree of parallelism.
Experiment with this setting using trial and error to find the optimal number of simultaneous discovery tasks for the collector machine you are tuning.
To configure the discovery tuning attribute for a scheduled discovery task
1 Choose Admin > Options.
2 Select the Jobs tab.
3 Double-click Scheduled - Discover.
4 Select the Tasks tab.
5 Double-click Discover.
6 Click the System Discovery tab.
7 In the Max number of simultaneous systems field, click the up and down arrows to indicate the preferred degree of parallelism.
8 Click OK to close the dialog boxes.

Data Collection Guide
86 VMware, Inc.
VMware, Inc. 87
8
The following topics are described in this chapter:
“Inventory Overview” on page 87
“Running Inventory Collection” on page 88
“Accessing the Inventory Options” on page 88
“Setting the Inventory Options” on page 89
“Scheduling Inventory Collection” on page 91
“Inventory Reports” on page 91
“Inventory Troubleshooting Issues” on page 93
Inventory OverviewThe Inventory job collects hardware and software information about systems identified by the Discover task and activated for data collection. You can inventory Windows, Linux, and UNIX systems. By default, inventory collection runs every 15 days. In most cases however, because the data does not change often, only a single inventory is necessary.
Typical inventory data that is collected might include information about a system’s CPU, memory, physical disks, network interface cards (NICs), services or daemons, shares, and file systems. Data is generated using utilities that are provided with the target machine’s operating system.
A list of collected information is provided in Appendix C, “Inventory Data,” on page 135.
Depending on the size of the system and number of installed applications, inventory collection for Linux and UNIX machines can use a noticeable amount of CPU. However, because inventory only runs every 15 days, the increase does not affect normal operation.
Inventory information is collected using one of three methods:
Windows Management Instrumentation (WMI)
Remote Registry and Perfmon
Secure Shell (SSH)
Windows Management InstrumentationWindows 2000, Windows XP, and Windows 2003 data is normally collected using WMI. WMI calls are carried over the standard NetBIOS or Direct Connection communications layers. These communications layers require ports 135 through 139 or 445 to be open. WMI can be disabled at target systems.
Inventory 8

Data Collection Guide
88 VMware, Inc.
Remote Registry and PerfmonWindows NT 3.51 and Windows NT 4.0 data is normally collected using Remote Registry and Perfmon (for memory) calls. These communications layers require ports 135 through 139 to be open. WMI can be installed on Windows NT 4.0.
Secure ShellYou can collect UNIX and Linux data only by using SSH. An SSH session is established and scripts are executed through that session or installed for later execution. If the scripts are installed, the data is returned using SCP.
Running Inventory CollectionConfigure and run an inventory job for a single system, group of systems, or all discovered systems from the Data Manager.
After the collector is installed, a Global Connection account is set up for the collector to connect to target systems. See Chapter 5, “Setting Up the Collector,” on page 43. If the Global Connection account has administrative privileges to connect to a target system, the account can inventory information from that system. If the Global Connection account cannot collect information from a target system, you can identify a specific user account and password for that target system, and the collector can use that account to connect to the system. Chapter 11, “Management Tasks,” on page 105 describes how to set up a specific user account and password for a target system.
To collect inventory data for a specific system in the navigation tree
1 Expand the navigation tree to see the target system.
2 Select the system and right-click it.
3 Choose Tasks > Run Inventory Task.
A new job is created to collect inventory on this single system.
To collect inventory data for multiple objects
1 Expand the navigation tree to see the target system.
2 Select the group name and right-click it.
3 Choose Tasks > Run Inventory Task.
A new job is created to collect inventory on all the objects in this group.
Accessing the Inventory Options The Inventory module has multiple options that let you control inventory collection. The Inventory Options dialog box is where you set the default options for the Inventory module to control the means of data collection from target systems and identify which network components are excluded from the data collection.
Inventory collection is started by:
Manual inventory collection — run inventory collection at any time. Select Tasks > Run Manual Tasks > Run Inventory Task. You set the inventory collection options as the general default settings.
Scheduled inventory collection —schedule one or more inventory jobs by using customized inventory options that you specify for each job.
You use the same Inventory Options dialog box for setting up manual inventory as well as for scheduled inventory jobs set up using the job scheduler. However, accessing the Inventory Options dialog box is different.

VMware, Inc. 89
Chapter 8 Inventory
To run manual inventory tasks
1 From the Data Manager menu bar, choose Admin > Options.
2 Select the Modules tab.
3 Select the Inventory module and click Default Settings.
To run scheduled job inventory tasks
1 From the Data Manager menu bar, choose Admin > Options.
2 Select the Jobs tab.
3 Select an inventory job under the Scheduled - Inventory module and click Modify.
4 In the Modify Job dialog box, select the Tasks tab.
5 Select the Inventory task and click Settings.
For information about defining and scheduling inventory collection jobs, see “Scheduling Inventory Collection” on page 91.
Setting the Inventory OptionsWhen you access the Inventory Options dialog box, either to set the inventory collection options that are invoked manually orto set the options for a specific inventory task, the options and their purpose are the same. The tabs on the Inventory Options dialog box are described in this section.
Setting the Inventory Collect OptionsThe Collect tab controls the method of inventory collection to be used, as well as the maximum number of systems that are collected from simultaneously.
Setting the Inventory Control OptionsThe Control tab specifies the criteria for determining which systems are inventoried.
Table 8-1. Collect Inventory Options
Option Description
Windows Inventory
Specify the method of inventory collection:Auto-detect method (try WMI then registry) — Automatically tries to use WMI for inventory collection that provides the most inventory data for a Windows system. However, if WMI is not available, the collector tries the Registry, which gives less information. Only use WMI (fails if missing) — Uses WMI for inventory collection. If WMI is missing, inventory collection fails.Only use registry — Uses the Registry for inventory collection.
Collection Tuning
Max number of simultaneous systems — Specify the number of systems the collector gathers inventory data from simultaneously. This value is 10. When collection for a system completes, another system is collected from so that this number of systems is always being collected from simultaneously. If the collector seems sluggish during inventory collection, adjust this number accordingly.

Data Collection Guide
90 VMware, Inc.
Setting the Inventory Objects OptionsThe Objects tab lists the types of data that are included during inventory collection and lets you modify inventory collection by excluding specific object types.
To exclude a type of inventory data
Check the box next to the data type and click OK or Apply.
The excluded inventory data is not collected for any system or object.
For a complete list of the specific inventory data that might be collected for each object type and system type, see Appendix C, “Inventory Data,” on page 135.
Setting the Inventory Import OptionsThe Import tab lists the types of inventory data that can be imported from a CSV file.
To exclude a type of inventory data
Check the box next to the data type and click OK or Apply.
The excluded inventory data is not collected for any system or object.
For a complete list of the specific inventory data that might be collected for each data type and system type, see Appendix C, “Inventory Data,” on page 135.
The import and export settings are used during data synchronization. The data synchronization module calls the import and export routines for all modules.
Setting the Inventory Export OptionsThe Export tab lists the types of inventory data that can be exported from the collector database to a local .csv file.
Table 8-2. Control Inventory Options
Option Description
Collection Control
Specify the criteria for which systems are inventoried.Only inventory systems that have not been successfully inventoried is the default. This lets you limit the systems that are inventoried to save processing time and the amount of data uploaded to the Information Warehouse.
Other Options Specify other inventory options to control the systems inventoried:Track inventory changes — When the inventory data for a system changes, the collector adds a new record. This is the default. If not selected, the previous inventory data for a system is deleted when the system in inventoried. Set to ‘Exclude’ status after <number> consecutive failures — If inventory collection fails for a system, the collector tries again the next day. This value sets the number of consecutive times that an attempt is made. When a system or object is excluded, it appears in the Details pane on the Objects tab. See “Excluding Systems from Collection” on page 60.

VMware, Inc. 91
Chapter 8 Inventory
Scheduling Inventory CollectionThe inventory collection interval is set to run once every day, and 100 systems are inventoried each day for 15 days for a total of 1500 systems. The inventory collection repeats. The first 1500 machines are inventoried twice a month. The Data Manager includes the Scheduled - Inventory predefined inventory job. The process for scheduling all jobs is the same. The collector multitasks and can perform inventory and the performance tasks simultaneously. Different jobs can run across different domains simultaneously.
The 500 machine limit is for performance, not inventory collection, because timing can be adjusted to account for higher numbers of machines. This is a recommendation and not an absolute limit.
Inventory ReportsYou can run summary inventory reports and detailed inventory reports to view the collected inventory data.
To run an inventory report
1 Choose Reports > Inventory and select either Summary or Detailed.
Different information displays on the Detailed version. See Table 8-4 and Table 8-5 below for a comparison.
2 Select a report from the list.
3 With a report displayed:
Sort the data by clicking on any of the column headers.
Click Export to save the report to a CSV file.
Click Close to close the report window.
Table 8-3. Export Inventory Options
Option Description
Export Rules Specify the criteria by which the data is exported:Automatic (based on date) — Automatically select the amount of information exported based on the last time an operation was performed on the system.Force status export only — Only status data is exported. This is the same data that appears in the module status report.Force full export of all systems (only during next Data Sync)— All system data is exported for every system only during the next data synchronization.Export System Identifiable Information such as IP Addresses, Shares, and Serial Numbers — This is an important security feature. You must explicitly check this to export the specified information.
Exclude these object types when exporting
Check the boxes in the list for any objects for which you do not want to export inventory data.
Table 8-4. Summary Inventory Reports
Report Description
Systems Host name, host pseudonym if the data privacy option is turned on, IP addresses, OS, OS version, OS service pack, serial number, chassis make, chassis model, maximum RAM, maximum CPUs, CPUs, CPU speed, RAM size, NICs, total NIC speed, drives, total drive space, number of applications, and number of services.
CPUs Number of CPUs, manufacturer, description, model, rated speed, FSB, first cache, second cache, and third cache.
Memory Install count, manufacture, model, type, size, speed, form factor, data width, and total width.
Drive Adapters Number of adapters, manufacturer, model, and type.
Drives Number of drives, manufacturer, model, type, size, and cache.

Data Collection Guide
92 VMware, Inc.
The detailed inventory reports are described in Table 8-5.
Inventory Descriptions ReportsThe inventory descriptions reports describe the target machines found within the scope of your inventory.
To run description reports
1 Choose Reports > Descriptions.
2 Select a report from the list.
3 With a report displayed:
Sort the data by clicking on any of the column headers.
Click Export to save the report to a CSV file.
Click Close to close the report window.
NICs Number of NICs, manufacturer, model, type, and speed.
Chassis Amount of RAM (in MB), manufacturer, model, CPU type, maximum # of CPUs, RAM type, # of RAM slots, maximum RAM, and # PCI slots.
Operating Systems Install count, manufacturer, name, version, major, minor, service pack, and build.
Applications Install count, manufacturer, name, version, major, minor, service pack, and build.
Services Number of services, display name, service name, and description.
Table 8-5. Detailed Inventory Reports
Report Description
System System name, installation locale, current locale, system partition, system boot directory, system comments, and system type.
CPUs System name, slot, CPU ID, current speed, manufacturer, description, model, rated speed, FSB, first cache, second cache, third cache, FP, HT, MMX, SSE, and SSE2.
Memory System, manufacturer, model, type, size, speed, form factor, data width, and total width.
Drive Adapters System name, manufacturer, model, type, serial number, and bus number.
Drives System name, adapter ID, device ID, manufacturer, model, interface type,and drive space (GB).
NICs System name, MAC address, IP address, IP type, DHCP server, name server, DNS domain, gateway, subnet mask, manufacturer, model, NIC type, and NIC speed (MB).
Chassis System name, serial number, manufacturer, model, BIOS make, number of CPU sockets, number of RAM slots, RAM max (MB), and number of PCI slots.
Operating Systems System name, company system registered with, registration owner, product ID, install date, install location, manufacturer, name, version, major, and minor.
Applications System name, company system registered with, registration owner, product ID, install date, install location, install source, manufacturer, name, version, major, and minor.
Services Seystem name, status, startup mode, run account, display name, unique name, and description.
Shares System name, net name, type, remark, permissions, maximum users, and path.
File Systems System name, path, provider name, type, size, freespace, drive type, media type, and compressed.
Table 8-4. Summary Inventory Reports (Continued)
Report Description

VMware, Inc. 93
Chapter 8 Inventory
Inventory Troubleshooting Issues Numerous issues can affect the success of data collection, such as inventory and performance. Generally, the problem areas are:
Network problemsService failuresAuthentication issues
Because the problems encountered are common to other Capacity Planner tasks, discussion of them and suggested troubleshooting steps are presented in Chapter 12, “Troubleshooting Capacity Planner,” on page 115.
Refreshing InventoryInventory is typically run every 15 days. If you run a manual inventory on one or more systems immediately after another inventory job is completed, you do not receive any results. Instead, the job is shown in the Job History tab as a failed job, and the following message appears in the Messages pane.
No systems found using current settings. Make sure that there are systems, they are not all inactive, and not Excluded at all levels, and haven't been collected recently. You can force a performance refresh by right-clicking on the system and select Force Refresh --> Refresh [inventory|performance] so that it has a check mark.
As directed in the message, you can reset the internal collection indicators by right-clicking the objects and selecting one of the Force Refresh commands.
Table 8-6. Inventory Descriptions Reports
Descriptions Reports Description
CPU Manufacturer, description, model, rated speed, FSB, first cache, second cache, and third cache
Memory Manufacturer, model, type, size, speed, form factor, data width, and total width
Drive Adapter Manufacturer, model, and type
Drive Manufacturer, model, type, and size
NIC Manufacturer, model, type, and speed
Chassis Manufacturer, model, BIOS info, CPU max number, CPU socket format, RAM number slots, RAM max, and PCI number slots
Operating System Type, manufacturer, name, version, major, minor, patch, and build
Application Application information for every system inventoried, including:type, manufacturer, version, major, minor, patch, and build
Services Display name, service name, service type, and description

Data Collection Guide
94 VMware, Inc.

VMware, Inc. 95
9
The following topics are described in this chapter:
“Performance Overview” on page 95
“Running Performance Collection” on page 95
“Accessing the Performance Options” on page 95
“Setting the Performance Options” on page 96
“Scheduling Performance Collection” on page 99
“Performance Reports” on page 99
Performance OverviewThe performance job collects statistical information from all the discovered systems. As with inventory collection, the collector must be able to connect to every target system with privileges to collect the performance data from that system. By default, performance collection runs hourly.
Performance information is collected by using one of the following methods:
For Windows systems, data is collected using Perfmon. Perfmon calls are carried over the standard NetBIOS, requiring ports 135 through 139 or 445 to be open. The Windows performance collection allows users to add more counters.
For UNIX or Linux systems, data is collected using SSH only. An SSH session is established and scripts are executed through that session or installed for later execution. If the scripts are installed, the data is returned using SCP.
Running Performance CollectionYou can use the same collector host to collect performance information that you used to collect inventory information. Performance collection success depends on the same attributes as inventory.
Accessing the Performance OptionsYou can control performance data collection using the options in the Performance module. Set the default options in the Performance Options dialog box to control the means of data collection from target systems and identify which network components are excluded from the data collection. Use one of the following ways to start performance collection:
Manual performance collection — Run performance collection at any time. Select Tasks > Run Manual Tasks > Run Performance Task. You set the performance collection options as the general default settings.
Scheduled performance collection —Schedule one or more performance jobs by using customized performance options that you specify for each job.
Collecting Performance Data 9

Data Collection Guide
96 VMware, Inc.
Use the same Performance Options dialog box to set up manual performance as well as for scheduled performance jobs set up using the job scheduler. Accessing the Performance Options dialog box is different for manual and scheduled jobs. See “Setting the Performance Options” on page 96 for information about each tab on the Performance Options dialog box.
To access the Performance Options for running manual performance tasks
1 From the Data Manager menu bar, select Admin > Options.
2 Click the Modules tab.
3 Select the Performance module and click Settings.
To access the Performance Options for running scheduled job performance tasks
1 From the Data Manager menu bar, select Admin > Options.
2 Click the Jobs tab.
3 Select a performance job under the Scheduled - Performance module and click Modify.
4 Click the Tasks tab.
5 Select the performance task and click Settings.
Setting the Performance OptionsWhen you access the Performance Options dialog box, either to set the performance collection options that are invoked manually or to set the options for a specific performance job that you are scheduling, the options and their purpose are the same. The four tabs on the Performance Options dialog box are described in this section.
Setting the General Performance OptionsThe General tab controls what performance data is stored, how the data is averaged, and the maximum number of systems that are collected from simultaneously.
Setting the Performance Collect OptionsThe Collect tab controls the sampling rate at which performance data is collected.
Table 9-1. General Performance Options
Option Description
Storage Specify what performance data is stored:Write to CSV file — Automatically writes all performance data to a CSV file for sending during the data synchronization phase. If not selected, no data is saved in the outbox.Store detail statistics in file — Stores detail performance data in a local file that is used to generate graphs. Do not store summary during import or UNIX/Linux collection — Suspends storage of summary data in the local database during an import or when collecting from UNIX and Linux systems.
Averaging Specify how much weight each data point has when averaged using the techniques below. The higher the weight, the less effect each data point has on the average; the lower the weight, the more effect each data point has on the average.Geometric mean weight — The weight of each data point when data is averaged using the geometric mean. This averaging technique removes peaks and valleys and is popular for benchmarking.Arithmetic mean weight — The weight of each data point when data is averaged using the arithmetic mean.
Other Max number of simultaneous systems — Specify the maximum number of systems that performance is collected from at the same time. The larger the sample size, the less value each data point has.

VMware, Inc. 97
Chapter 9 Collecting Performance Data
Increasing the performance collection interval or the number of samples reduces the number of systems that can be collected from each cycle.
Each time performance data is collected from a system, the collector collects a sample, waits the specified interval period, takes another sample, waits again, and so on. The total collection time is the performance collection interval multiplied by the number of performance samples. A typical setting is three samples at 4-second intervals, which gives a 12-second total collection time for each machine.
For data collected using Perfmon APIs, performance averaging algorithms use collected samples to calculate an average value for the hour that more accurately represents the activity for the entire hour than is achieved using the sample-based calculation.
Setting the Performance Control OptionsThe Control tab controls which systems are included in performance collection. For example, you can limit performance collection to specific systems to focus only on systems for which you don’t have performance data. You can also specify whether the performance counters are rediscovered at each collection.
Setting Performance Counters The Counters tab lists the available performance counters and lets you import, add, remove, enable, or disable performance counters.
Each performance counter shows whether it is active, the class that it belongs to, the specific instance that it applies to: an asterisk (*) means any instance, and the actual metric that is collected. The performance counters are listed alphabetically by class. These settings are global, not confined to a single task.
Table 9-2. Collect Performance Options
Option Description
Performance Collection Interval
The time period, in seconds, between samples.
Number of Performance Samples
The number of performance samples taken each time performance data is collected from a system.
Table 9-3. Control Performance Options
Option Description
Collection Control
Specify one of the following performance collection criteria: All systems — Collect performance statistics from all systems.Only systems that failed last collection attempt — Collect performance statistics only from systems that failed during the last collection attempt. This shortens the length of time required for performance collection.Only systems that have not been successfully collected — Collect performance statistics only from systems that have not been successfully collected.Only systems that have not been attempted — Collect performance statistics only from systems that have not yet been attempted.Only systems that have not been updated since <number> days ago — Collect performance statistics only from systems for which data has not been collected for the specified number of days. You can also limit the number of systems collected from at a time during each performance cycle. By default, the maximum is 100 systems.
Other Options Force rediscover of performance counters every time — Specify that you always want to reevaluate what’s running on a system and thus what performance counters are appropriate. The effect is to rediscover performance counters every two days when performance is collected. This option is deselected by default. Note: Performance collection takes longer when this option is checked.Exclude system after <number> consecutive failures — Specifies that any system that has the specified number of consecutive failed performance collection attempts is excluded from performance collection.
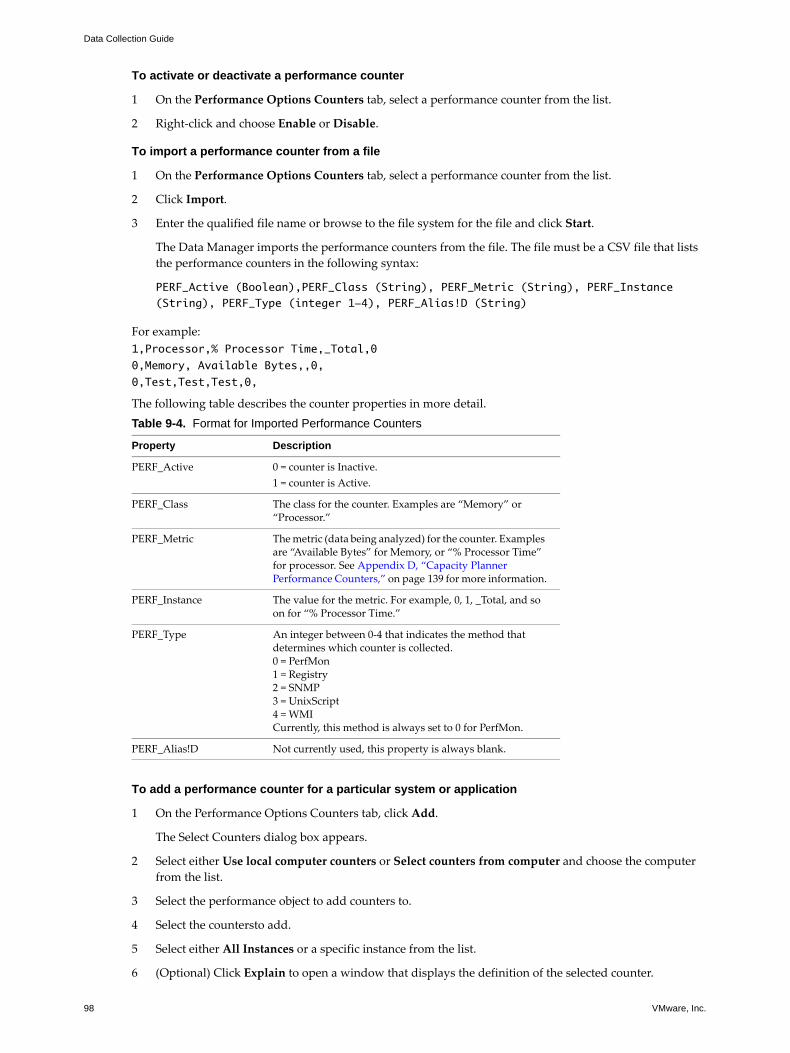
Data Collection Guide
98 VMware, Inc.
To activate or deactivate a performance counter
1 On the Performance Options Counters tab, select a performance counter from the list.
2 Right-click and choose Enable or Disable.
To import a performance counter from a file
1 On the Performance Options Counters tab, select a performance counter from the list.
2 Click Import.
3 Enter the qualified file name or browse to the file system for the file and click Start.
The Data Manager imports the performance counters from the file. The file must be a CSV file that lists the performance counters in the following syntax:
PERF_Active (Boolean),PERF_Class (String), PERF_Metric (String), PERF_Instance (String), PERF_Type (integer 1-4), PERF_Alias!D (String)
For example:1,Processor,% Processor Time,_Total,00,Memory, Available Bytes,,0,0,Test,Test,Test,0,
The following table describes the counter properties in more detail.
To add a performance counter for a particular system or application
1 On the Performance Options Counters tab, click Add.
The Select Counters dialog box appears.
2 Select either Use local computer counters or Select counters from computer and choose the computer from the list.
3 Select the performance object to add counters to.
4 Select the countersto add.
5 Select either All Instances or a specific instance from the list.
6 (Optional) Click Explain to open a window that displays the definition of the selected counter.
Table 9-4. Format for Imported Performance Counters
Property Description
PERF_Active 0 = counter is Inactive.1 = counter is Active.
PERF_Class The class for the counter. Examples are “Memory” or “Processor.”
PERF_Metric The metric (data being analyzed) for the counter. Examples are “Available Bytes” for Memory, or “% Processor Time” for processor. See Appendix D, “Capacity Planner Performance Counters,” on page 139 for more information.
PERF_Instance The value for the metric. For example, 0, 1, _Total, and so on for “% Processor Time.”
PERF_Type An integer between 0-4 that indicates the method that determines which counter is collected. 0 = PerfMon1 = Registry2 = SNMP3 = UnixScript4 = WMICurrently, this method is always set to 0 for PerfMon.
PERF_Alias!D Not currently used, this property is always blank.
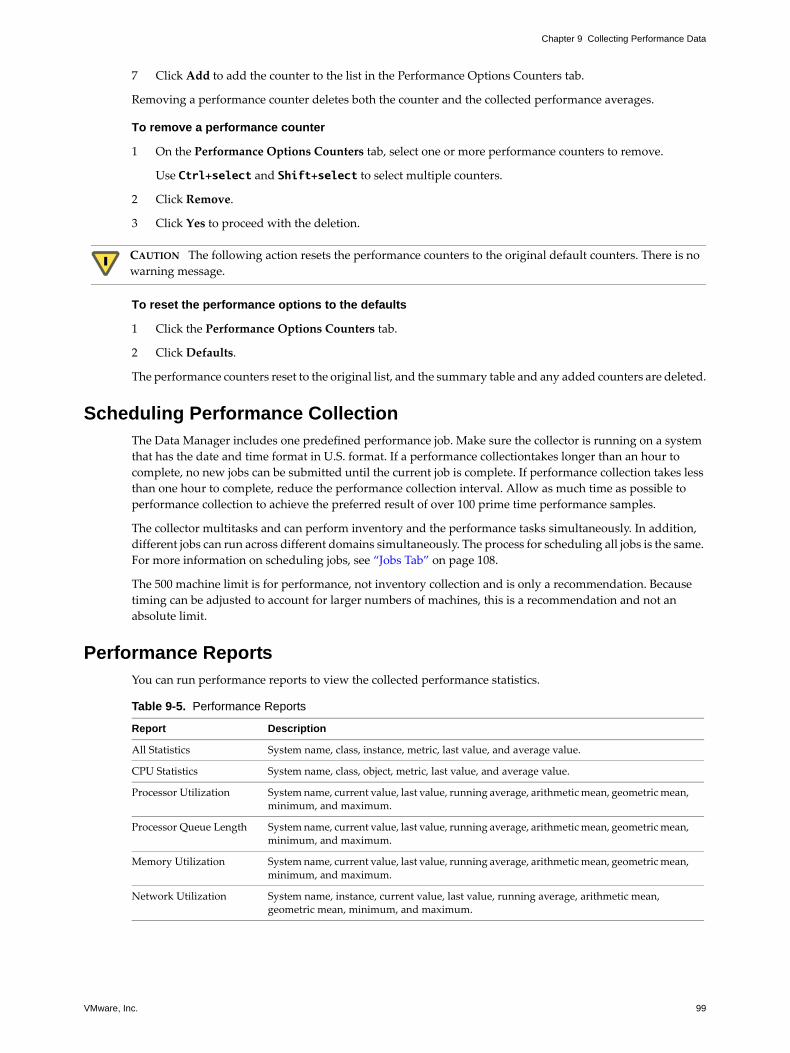
VMware, Inc. 99
Chapter 9 Collecting Performance Data
7 Click Add to add the counter to the list in the Performance Options Counters tab.
Removing a performance counter deletes both the counter and the collected performance averages.
To remove a performance counter
1 On the Performance Options Counters tab, select one or more performance counters to remove.
Use Ctrl+select and Shift+select to select multiple counters.
2 Click Remove.
3 Click Yes to proceed with the deletion.
To reset the performance options to the defaults
1 Click the Performance Options Counters tab.
2 Click Defaults.
The performance counters reset to the original list, and the summary table and any added counters are deleted.
Scheduling Performance Collection The Data Manager includes one predefined performance job. Make sure the collector is running on a system that has the date and time format in U.S. format. If a performance collectiontakes longer than an hour to complete, no new jobs can be submitted until the current job is complete. If performance collection takes less than one hour to complete, reduce the performance collection interval. Allow as much time as possible to performance collection to achieve the preferred result of over 100 prime time performance samples.
The collector multitasks and can perform inventory and the performance tasks simultaneously. In addition, different jobs can run across different domains simultaneously. The process for scheduling all jobs is the same. For more information on scheduling jobs, see “Jobs Tab” on page 108.
The 500 machine limit is for performance, not inventory collection and is only a recommendation. Because timing can be adjusted to account for larger numbers of machines, this is a recommendation and not an absolute limit.
Performance ReportsYou can run performance reports to view the collected performance statistics.
CAUTION The following action resets the performance counters to the original default counters. There is no warning message.
Table 9-5. Performance Reports
Report Description
All Statistics System name, class, instance, metric, last value, and average value.
CPU Statistics System name, class, object, metric, last value, and average value.
Processor Utilization System name, current value, last value, running average, arithmetic mean, geometric mean, minimum, and maximum.
Processor Queue Length System name, current value, last value, running average, arithmetic mean, geometric mean, minimum, and maximum.
Memory Utilization System name, current value, last value, running average, arithmetic mean, geometric mean, minimum, and maximum.
Network Utilization System name, instance, current value, last value, running average, arithmetic mean, geometric mean, minimum, and maximum.

Data Collection Guide
100 VMware, Inc.
To run a performance report
1 Select Reports > Performance.
2 Select a report from the list.
3 With a report displayed, sort the data by clicking on any of the column headers.
4 Click Export to save the report to a CSV file.
5 Click Close to close the report window.
Physical Disk Utilization System name, current value, last value, running average, arithmetic mean, geometric mean, minimum, and maximum.
Logical Disk Size System name, drive, current value, last value, running average, arithmetic mean, geometric mean, minimum, and maximum.
Table 9-5. Performance Reports (Continued)
Report Description

VMware, Inc. 101
10
The Data Synchronization process sends the data from the collector system to the Information Warehouse for analysis and performs other tasks needed to synchronize the data.
The following topics are described in this chapter:
“Data Synchronization Overview” on page 101
“Accessing the Data Synchronization Options” on page 102
“Setting Data Synchronization Options” on page 103
“Scheduling Data Synchronization Jobs” on page 104
“Viewing Your Data on the Web” on page 104
Data Synchronization Overview
Information WarehouseThe Information Warehouse is a repository of billions of performance statistics. It receives data from all companies performing assessments with Capacity Planner. This allows Capacity Planner to compare and contrast recent performance statistics for particular hardware and software configurations across companies. The data in the Information Warehouse is kept anonymous. A company can view only its own specific data in the Dashboard. However, it can view statistics from all of the other companies without the company-specific information. The Dashboard allows companies to compare the performance of servers in their environment with similar servers in the industry to identify performance anomalies and performance targets.
Inventory and performance statistics are sent to the Information Warehouse for processing. Appendix C, “Inventory Data,” on page 135 and Appendix D, “Capacity Planner Performance Counters,” on page 139 list the specific types of data that are collected and sent to the Information Warehouse.
Data Synchronization ProcessThe data synchronization process includes the following steps:
1 Export inventory files to the outbox directory.
2 Create log files.
3 Send files in the outbox directory to the Information Warehouse.
4 (Optional) Download remote configuration information from the Information Warehouse.
In addition, the data synchronization process can:
5 Download product updates if you selected Allow automatic software updates of the Data Manager/collector on the Collector/Dashboard Synchronization Options screen in the setup wizard.
Data Synchronization 10

Data Collection Guide
102 VMware, Inc.
6 Import inventory and performance files from the import directory if you enabled Import collection data for systems on the General tab of the Data Synchronization module.
Data Processing ScheduleThe collector is installed with a Data Synchronization job that automatically runs every hour by default. You can also run the job manually.
The Data Synchronization job sends the inventory files and raw statistics to the Information Warehouse where they are uploaded in bulk into staging tables and processed. After processing, the information can be viewed in the Dashboard.
The Information Warehouse processes nightly and weekly jobs to analyze the collected information. Data from these jobs populates the graphs and tables in the Capacity Planner Dashboard.
Accessing the Data Synchronization OptionsThe Data Synchronization module has multiple options that let you control data synchronization. The data synchronization Options dialog box is where you set the default options for the Data Synchronization module to control the processing of collected data. You can run data synchronization in the following ways:
Manual data synchronization — Run data synchronization at any time. Select Tasks > Run Manual Tasks > Run Data Synchronization Task. You set the data synchronization options as the general default settings.
Scheduled data synchronization —Schedule one or more data synchronization jobs by using customized data synchronization options that you specify for each job.
You use the same data synchronization Options dialog box to set up manual data synchronization as well as for scheduled data synchronization jobs set up by using the job scheduler. However, accessing the data synchronization Options dialog box is different.
To access the data synchronization Options for running manual data synchronization tasks
1 From the Data Manager menu bar, choose Admin > Options.
2 Click the Modules tab.
3 Select the Data Synchronization module and click Settings.
To access the data synchronization Options for running scheduled tasks
1 From the menu bar of the Data Manager window, select Admin > Options.
2 In the Options dialog box, select the Jobs tab.
3 Select a job that contains a data synchronization task under the Scheduled - Data Synchronization module and click Modify.
4 In the Modify Job dialog box, select the Tasks tab.
5 Select the data synchronization task and click Settings.
The navigation between screens is illustrated in the following figure.

VMware, Inc. 103
Chapter 10 Data Synchronization
Setting Data Synchronization OptionsWhen you access the data synchronization Options dialog box, either for setting the data synchronization options that are run manually or for setting the options for a specific data synchronization job or task that you are scheduling, the options and their purpose are the same. The tabs on the data synchronization Options dialog box are described in this section.
Data Synchronization General OptionsThe General tab for the data synchronization module specifies the operations that are executed each time data synchronization occurs.
To retrieve collector settings
Data Synchronization Import OptionsThe Import tab for the data synchronization module lets you exclude modules from import. Text files are created in the temp directory while running inventory and performance jobs on Linux machines and are deleted after the job is complete. To prevent files from being deleted, check the Archive files after data processing option on the File Paths tab by using Admin > Options.
Data Synchronization Export OptionsThe Export tab for the data synchronization module lets you exclude modules from export.
The data that is exported depends on the selections you choose on the Export tab of the Inventory Options dialog box.
1 Select the Modules tab.
2 Click the Inventory module to display the Inventory Options dialog box.
Table 10-1. General Data Synchronization Options
Option Description
Data Send Uploads everything in the outbox directory to the Information Warehouse.
Import collection data for systems Imports inventory and performance files from the import directory.
Export collection data for systems Writes inventory data to the outbox directory.
Get collector settings changes from Dashboard Retrieves the collector settings from the Dashboard.
Download and install product updates Automatically downloads and installs product updates.
Data Collection Guide
104 VMware, Inc.
3 Click the Export tab.
Collector Settings from the Dashboard
This feature also allows you to load balance collectors from the Dashboard by moving systems from one to another collector if needed. After the first data synchronization, collector settings are sent to the Dashboard. For subsequent data synchronizations, configure the collector from the Dashboard and send the settings to the collector. If you are using more than one collector, send the settings to multiple collectors to make sure that the settings are the same across collectors.
Scheduling Data Synchronization JobsThe data synchronization time interval determines how often the outbox is emptied and the contents are sent to the Information Warehouse. The Data Manager includes one predefined job. Deactivate this task if you do not want the data to be sent automatically to the Information Warehouse.
Viewing Your Data on the Web The Dashboard provides a secure Web interface to the data about your customer’s company and is a tool for evaluating the data and providing consolidation recommendations.
To connect to the Dashboard
1 Go to https://optimize.vmware.com.
2 When you purchase the assessment services from VMware, an account is set up in your partner company:
a Enter your user name for that account.
b Enter your password.
c Click OK.
VMware, Inc. 105
11
The following topics are described in this chapter:
“Management Tasks Overview” on page 105
“Setting Up Connection Accounts” on page 105
“About Admin Options” on page 106
“Reports” on page 114
Management Tasks OverviewThis chapter describes many of the management tasks that you perform when you configure the collector. These activities fall into the following main categories:
Connection Accounts — Working with the connection accounts to ensure that you can connect to the domains and systems to collect data from.
Admin Options — Working with the Admin Options dialog box, which is the main user interface tool used to configure the collection modules, jobs, and scheduling, as well as connection to the Dashboard.
Reports — Understanding the content of the reports provided with the Data Manager.
Setting Up Connection AccountsThe Global Connection account is the primary account that the collector uses to connect to target systems for the collection of inventory and performance data. Setting up this account is described in Chapter 5, “Setting Up the Collector,” on page 43.
If the Global Connection account you initially defined in the setup wizard is not sufficient to collect information from a target system, you can identify a specific local connection account for that target system, and the collector uses that account to connect to the system instead of the Global Connection account.
You can define a local connection account for a single target system, or you can define a local connection account to be used for a group of two or more target systems.
To define a local connection account
1 With the World > All Objects > Systems leaf selected in the navigation tree, do one of the following:
a Select a single system in the list under Systems.
b Select one or more systems in the Objects tab of the Details pane, using Ctrl+click to select multiple systems.
2 Right-click to select Set Account.
The account information appears after the Use global connection account field.
3 To specify a different account, select the Use selected account to specify a new local connection account.
Management Tasks 11

Data Collection Guide
106 VMware, Inc.
You can select an existing account from the displayed list or create a new account.
a To select an existing account, click the account name and click OK.
b To create an account, click Add.
The Create New Account dialog box appears.
c Enter the necessary information for the user account that is to be used to connect to the target systems.
All data entry fields in the Create New Account dialog box are required except the Domain specification. Generate a list of known domains from which to select by clicking Browse next to Domain.
d Click OK.
The new account appears highlighted in gray.
4 Click OK.
The connection account (system specific or global) that is used for each active system is listed on the Objects tab of the Details pane when the appropriate leaf is selected in the navigation tree.
To view the system-specific or Global Connection Account for a particular system
1 Select the Systems object in the Navigation pane.
2 Select the Objects tab in the Details pane and scroll to the right to view the Account column.
About Admin OptionsMost of the management and configuration tasks for the Data Collector are performed using the Options dialog box.
General TabThe first tab of the Options dialog box is the General tab. General options specify configurations such as Global Connection account information, data privacy options, and how logging and other information is presented. The options on this tab are discussed in the following sections.
Defining a Global Connection Account
The Global Connection account is the general account the collector uses to connect to target systems when it wants to collect inventory or performance data. The Global Connection account is usually specified when the collector is installed. Additional Global Connection accounts can be defined at any time.
To define a new Global Connection Account
1 Choose Admin > Options.
2 Next to the Account field, click Add.
3 In the Create New Account dialog box, enter the necessary information for the user account that is to be used to connect to the target system.
All data entry fields in the Create New Account dialog box are required, except the domain specification. To specify the domain, generate a list of known domains to select from by clicking the browse icon next to Domain.
4 Click OK.
The new account becomes the global account in place of the account that was defined previously.

VMware, Inc. 107
Chapter 11 Management Tasks
To select a Global Connection Account as the active account for the collector
1 Choose Admin > Options.
On the Global Options tab, the Account field displays the active Global Connection account.
2 Click the down arrow of the Account field to display a drop-down menu of currently defined accounts.
3 Select the account to be activated as the Global Connection account.
If the active Global Connection Account cannot be used to connect to specific target systems, define connection accounts for those systems, as described in “Setting Up Connection Accounts” on page 105.
To modify a Global Connection Account
1 Choose Admin > Options.
1 On the General tab, select the account as the active Global Connection Account.
2 Click Edit .
3 After making the necessary modifications, click OK.
To remove an account from the group of possible Global Connection accounts
1 Choose Admin > Options.
2 In the General tab, select the account as the active Global Connection account.
3 Click Delete.
4 Click Yes.
5 Activate one of the remaining accounts as the Global Connection account for the collector as described in “To select a Global Connection Account as the active account for the collector” on page 107.
Setting Logging Global Options
The Log File Size option on the General tab specifies the maximum size of each log file (in MB). When the current log file is full, it is saved as a backup and a new log file is created. The current log file is named VMwareCP.log. The backup log files are listed sequentially to enable identification of the oldest log. The log files are saved in the main Capacity Planner base installation directory C:\Program Files\VMware\VMware Capacity Planner.
The # of Backup Logs option on the General tab specifies the maximum number of backup log files that are created. By default, up to three backup logs are saved in the main Capacity Planner base installation directory. When you set this option, consider the size of each log file and the amount of available disk space on the collector system. Saving backup log data can be valuable for later assessment of collector activity.
The Log Level option on the General tab determines the amount of detail that the collector logs for the tasks it performs. The collector records exactly what happens while the collector is running at the level specified from a minimum level of no information to a maximum level where every detail is logged. The log provides valuable diagnostic information for tracking activity and analyzing problems.
As you move the slider to the right, the logging level increases. Six levels of logging are available. The current log level is shown just above the slider to the right. As the logging level increases the amount of information logged, the log file fills up more quickly.
Setting Other Global Options
Other global options on the General tab control what you see while you work with the Data Manager.
The Message Window Size option on the General tab refers to the maximum number of messages that are displayed (with scrolling) in the message box pane at the bottom of in the Data Manager main window. The default message window size is 500 lines.

Data Collection Guide
108 VMware, Inc.
By default, the message box pane is not displayed. Choose View>Message Box to display the message box pane. The messages displayed in the message window are saved in the collector’s log files and can be viewed with any text editor.
The Max # Concurrent Jobs option on the General tab defines the maximum number of concurrent jobs that the collector allows. The number of jobs that are needed to complete the task and the maximum number of concurrent jobs that the collector allows affect the performance of the collector and the duration of any task.
The Keep job history for x days option on the General tab determines the length of timethat jobs are listed in the Job History tab of the Details pane in the Data Manager. The default value of 30 days is usually sufficient to track all jobs the collector performs.
At any time, you can right-click one or more jobs listed in the Job History tab and delete the archived job using the pop-up menu. You can also completely clear the list of archived jobs or save the list to a comma-separated value (.csv) file.
The Ping Object before connection check box on the General tab specifies whether the target system is pinged before a connection attempt is made. If the collector first pings a target system before trying to connect to it, it can determine more quickly if the system is available. The Ping Object before connection option is not selected by default.
The purpose for the Ping Object before connection option is to reduce collection times. When the Data Collector tries to collect inventory or performance data from a target system, it needs to connect to the system. If the target system is not available, the connection attempt times out. If this occurs frequently, it can increase the collection times.
Modules TabThe Modules tab of the Options dialog box lists the installed modules of the collector. For each module, the tab shows whether the module is active and which version and build number is installed.
When you select one of the modules and click Settings, you display the Options dialog box for the selected module. Use these options to customize the default behavior of each module. The specified settings are used when you run the manual tasks through by choosing Tasks > Run Manual Tasks. Likewise, when you right-click an object in the Navigation pane and choose a Tasks option, you run a manual task using these option settings.
The Execute Command module allows you to specify a command to run globally.
To specify a command
1 Choose Admin > Options and select the Modules tab.
2 Select the Execute Command module and click Settings.
3 Type the command to execute.
4 Click Apply.
Jobs TabThe Jobs tab on the Options dialog box lets you view all defined jobs and their schedules. The predefined jobs are listed with their schedules. You can modify these or add your own custom jobs. Each job contains at least one task that runs a Capacity Planner module, but it can contain many tasks that each run a Capacity Planner module.
The Modules tab allows you to set default options. These options apply to all manual tasks that are run. Manual tasks run only when you manually execute them. For a valid assessment of your company’s network,
CAUTION For security reasons, some customer networks disable acknowledgement (or receipt of) a ping operation for some or all of their systems. This does not prohibit the collector from connecting to those systems. However, the ping attempt fails, causing the collector to bypass the system. If you are not sure whether all potential target systems can respond to the ping attempt, deselect this option.

VMware, Inc. 109
Chapter 11 Management Tasks
run many of these tasks on a regular cycle over a specified period of time. In addition, you can define a custom task to perform only a certain subset of options for a particular job.
When the collector is installed, scheduled jobs are defined for immediate use. The Jobs tab of the Options dialog box lists these tasks.
By default, the following tasks are scheduled as active:
Data Synchronization: runs every hour of every day
Inventory data collection: runs once a day every day
Performance data collection: runs every hour of every day
The following scheduled jobs are defined but are in an inactive state:
Discovery: runs once a day every day
Manual – Discover Domains
Manual – Discover Systems (to discover only servers and other non-workstation nodes on the network)
Manual – Test Collection
You must run these last jobs manually by using the Tasks > Run Scheduled Jobs or activate them on the Schedules tab to have them run according to a schedule.
The names of these jobs reinforces the intended purpose of running these jobs manually before activating the scheduler and starting the cycle of the other scheduled jobs.
When the Data Collector is installed, the job scheduler is initially suspended so that the predefined scheduled jobs do not start to run before you are ready. Before activating the job scheduler, discover your domains by running the Manual - Discover Domains job manually, and then the Manual - Discover Systems job. See Chapter 7, “Discovery with the Data Collector,” on page 67.
To activate or suspend the job scheduler
1 In the menu bar, choose Admin > Options.
2 Select the Jobs tab.
3 On the Jobs tab, do one of the following:
Deselect Suspend Scheduler to start the Scheduler and run all active scheduled jobs as per their defined schedules.
Select Suspend Scheduler to stop the Scheduler from running any active scheduled jobs.
The check box is selected by default.
Capacity Planner has predefined jobs that are scheduled to run every day at the frequencies described in Table 11-1.
You can view and modify jobs schedule at any time. See “To define a scheduled job or customize a previously defined job” on page 110.
You can run any scheduled job manually, regardless of the state of the job scheduler (active or suspended) or the defined schedule for the job.
Table 11-1. Default Jobs in the Scheduler
Job or Task Frequency per Day
Scheduled - Data Synchronize Every hour
Scheduled - Inventory Once
Scheduled - Performance Every hour
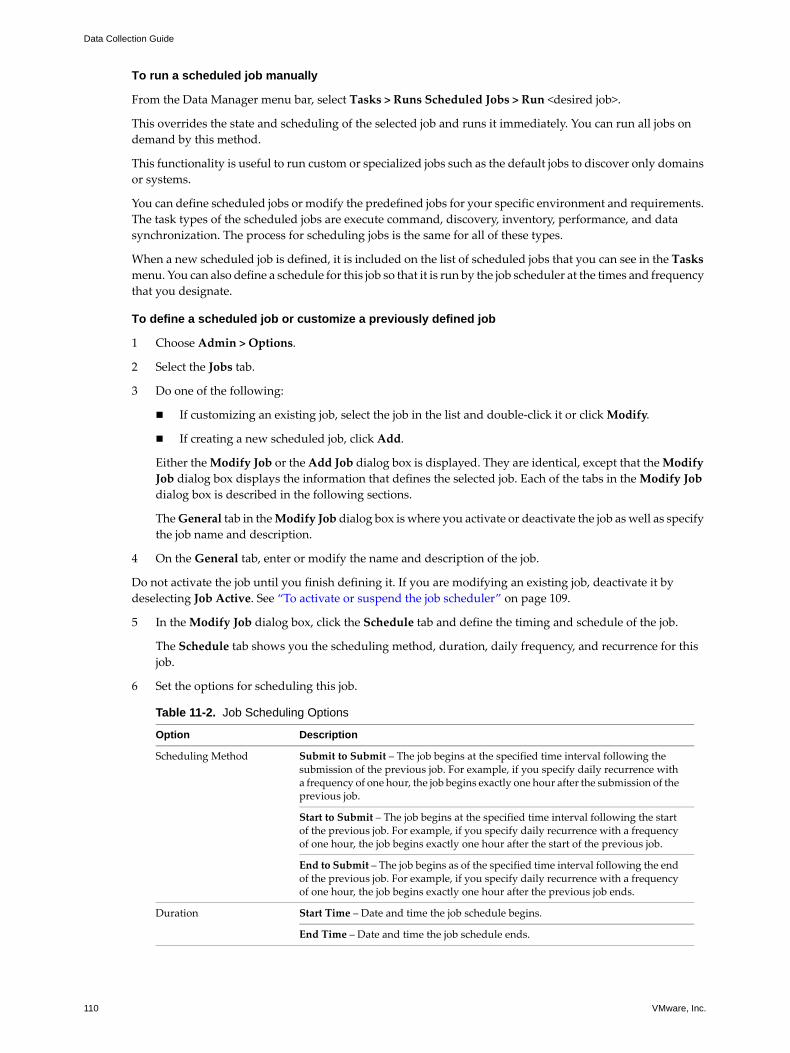
Data Collection Guide
110 VMware, Inc.
To run a scheduled job manually
From the Data Manager menu bar, select Tasks > Runs Scheduled Jobs > Run <desired job>.
This overrides the state and scheduling of the selected job and runs it immediately. You can run all jobs on demand by this method.
This functionality is useful to run custom or specialized jobs such as the default jobs to discover only domains or systems.
You can define scheduled jobs or modify the predefined jobs for your specific environment and requirements. The task types of the scheduled jobs are execute command, discovery, inventory, performance, and data synchronization. The process for scheduling jobs is the same for all of these types.
When a new scheduled job is defined, it is included on the list of scheduled jobs that you can see in the Tasks menu. You can also define a schedule for this job so that it is run by the job scheduler at the times and frequency that you designate.
To define a scheduled job or customize a previously defined job
1 Choose Admin > Options.
2 Select the Jobs tab.
3 Do one of the following:
If customizing an existing job, select the job in the list and double-click it or click Modify.
If creating a new scheduled job, click Add.
Either the Modify Job or the Add Job dialog box is displayed. They are identical, except that the Modify Job dialog box displays the information that defines the selected job. Each of the tabs in the Modify Job dialog box is described in the following sections.
The General tab in the Modify Job dialog box is where you activate or deactivate the job as well as specify the job name and description.
4 On the General tab, enter or modify the name and description of the job.
Do not activate the job until you finish defining it. If you are modifying an existing job, deactivate it by deselecting Job Active. See “To activate or suspend the job scheduler” on page 109.
5 In the Modify Job dialog box, click the Schedule tab and define the timing and schedule of the job.
The Schedule tab shows you the scheduling method, duration, daily frequency, and recurrence for this job.
6 Set the options for scheduling this job.
Table 11-2. Job Scheduling Options
Option Description
Scheduling Method Submit to Submit – The job begins at the specified time interval following the submission of the previous job. For example, if you specify daily recurrence with a frequency of one hour, the job begins exactly one hour after the submission of the previous job.
Start to Submit – The job begins at the specified time interval following the start of the previous job. For example, if you specify daily recurrence with a frequency of one hour, the job begins exactly one hour after the start of the previous job.
End to Submit – The job begins as of the specified time interval following the end of the previous job. For example, if you specify daily recurrence with a frequency of one hour, the job begins exactly one hour after the previous job ends.
Duration Start Time – Date and time the job schedule begins.
End Time – Date and time the job schedule ends.
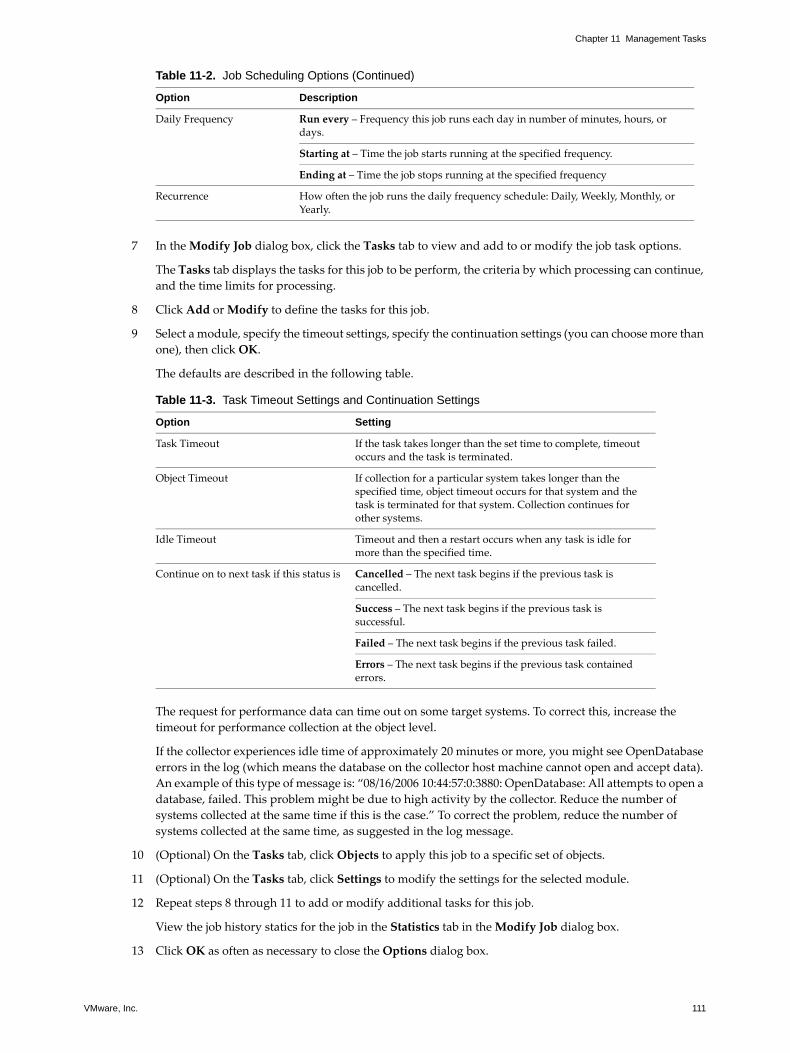
VMware, Inc. 111
Chapter 11 Management Tasks
7 In the Modify Job dialog box, click the Tasks tab to view and add to or modify the job task options.
The Tasks tab displays the tasks for this job to be perform, the criteria by which processing can continue, and the time limits for processing.
8 Click Add or Modify to define the tasks for this job.
9 Select a module, specify the timeout settings, specify the continuation settings (you can choose more than one), then click OK.
The defaults are described in the following table.
The request for performance data can time out on some target systems. To correct this, increase the timeout for performance collection at the object level.
If the collector experiences idle time of approximately 20 minutes or more, you might see OpenDatabase errors in the log (which means the database on the collector host machine cannot open and accept data). An example of this type of message is: “08/16/2006 10:44:57:0:3880: OpenDatabase: All attempts to open a database, failed. This problem might be due to high activity by the collector. Reduce the number of systems collected at the same time if this is the case.” To correct the problem, reduce the number of systems collected at the same time, as suggested in the log message.
10 (Optional) On the Tasks tab, click Objects to apply this job to a specific set of objects.
11 (Optional) On the Tasks tab, click Settings to modify the settings for the selected module.
12 Repeat steps 8 through 11 to add or modify additional tasks for this job.
View the job history statics for the job in the Statistics tab in the Modify Job dialog box.
13 Click OK as often as necessary to close the Options dialog box.
Daily Frequency Run every – Frequency this job runs each day in number of minutes, hours, or days.
Starting at – Time the job starts running at the specified frequency.
Ending at – Time the job stops running at the specified frequency
Recurrence How often the job runs the daily frequency schedule: Daily, Weekly, Monthly, or Yearly.
Table 11-3. Task Timeout Settings and Continuation Settings
Option Setting
Task Timeout If the task takes longer than the set time to complete, timeout occurs and the task is terminated.
Object Timeout If collection for a particular system takes longer than the specified time, object timeout occurs for that system and the task is terminated for that system. Collection continues for other systems.
Idle Timeout Timeout and then a restart occurs when any task is idle for more than the specified time.
Continue on to next task if this status is Cancelled – The next task begins if the previous task is cancelled.
Success – The next task begins if the previous task is successful.
Failed – The next task begins if the previous task failed.
Errors – The next task begins if the previous task contained errors.
Table 11-2. Job Scheduling Options (Continued)
Option Description
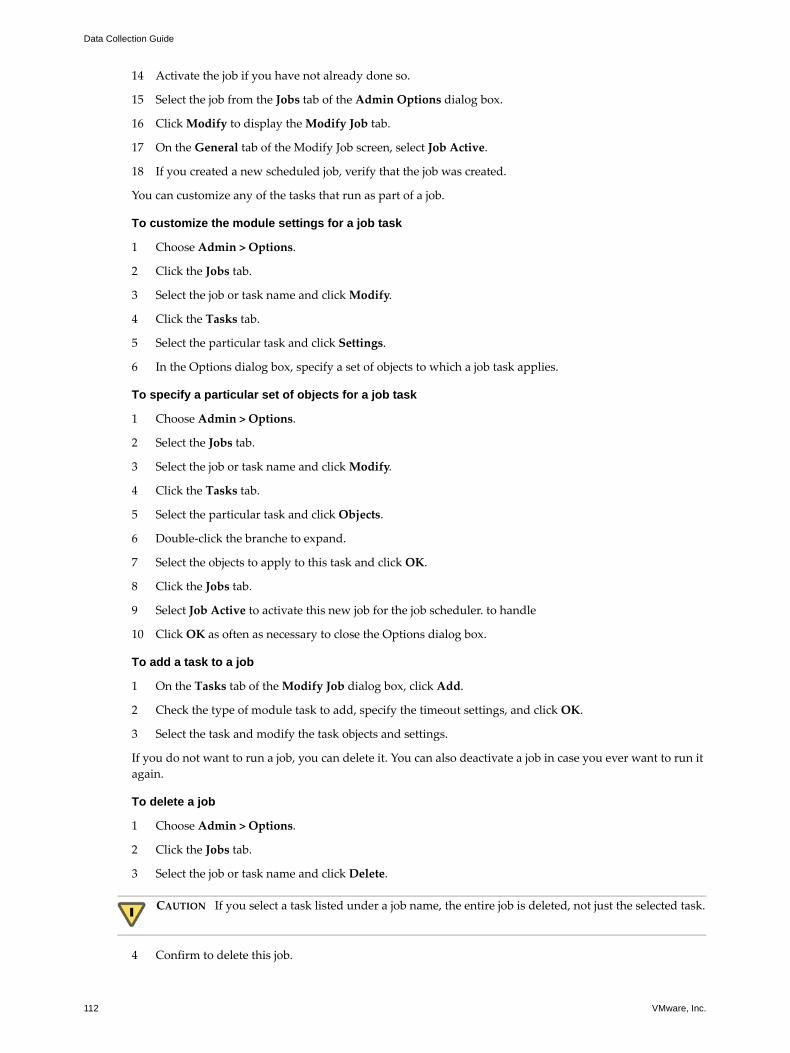
Data Collection Guide
112 VMware, Inc.
14 Activate the job if you have not already done so.
15 Select the job from the Jobs tab of the Admin Options dialog box.
16 Click Modify to display the Modify Job tab.
17 On the General tab of the Modify Job screen, select Job Active.
18 If you created a new scheduled job, verify that the job was created.
You can customize any of the tasks that run as part of a job.
To customize the module settings for a job task
1 Choose Admin > Options.
2 Click the Jobs tab.
3 Select the job or task name and click Modify.
4 Click the Tasks tab.
5 Select the particular task and click Settings.
6 In the Options dialog box, specify a set of objects to which a job task applies.
To specify a particular set of objects for a job task
1 Choose Admin > Options.
2 Select the Jobs tab.
3 Select the job or task name and click Modify.
4 Click the Tasks tab.
5 Select the particular task and click Objects.
6 Double-click the branche to expand.
7 Select the objects to apply to this task and click OK.
8 Click the Jobs tab.
9 Select Job Active to activate this new job for the job scheduler. to handle
10 Click OK as often as necessary to close the Options dialog box.
To add a task to a job
1 On the Tasks tab of the Modify Job dialog box, click Add.
2 Check the type of module task to add, specify the timeout settings, and click OK.
3 Select the task and modify the task objects and settings.
If you do not want to run a job, you can delete it. You can also deactivate a job in case you ever want to run it again.
To delete a job
1 Choose Admin > Options.
2 Click the Jobs tab.
3 Select the job or task name and click Delete.
4 Confirm to delete this job.
CAUTION If you select a task listed under a job name, the entire job is deleted, not just the selected task.

VMware, Inc. 113
Chapter 11 Management Tasks
To delete a task
1 Choose Admin > Options to display the Options dialog box.
2 Select the Jobs tab.
3 Select the job/task name and click Modify.
4 Select the Tasks tab.
5 Select the task that you want to delete, and click Delete.
6 Confirm that you do want to delete this task.
Collection TabIn the Options dialog box, the Collection Settings tab allows you to specify the manner in which UNIX or Linux scripts are run on non-Windows systems.
You can do one of the following:
Run the scripts remotely on the target systems.
The scripts run locally on the collector host and then access the remote target systems. You don’t have to install anything on the target systems. You must have SSH setup enabled and the proper permissions to connect to each target system.
Install your scripts in a specified location on each of the UNIX or Linux target systems.
If you choose to install the scripts, you can set them up for scheduled execution by using the crontab command.
File Paths TabUse the settings on the File Paths tab to specify locations for:
Database file for collected data—A local Microsoft Access database file named AOGCapPlan.mdb in which collected data is stored.
Base installation directory—A directory in which all VMware Capacity Planner directories and files are stored.
Import directory—The directory in which collected data is stored if data is collected from Linux and UNIX target machines by installing collection scripts on each target machine as described in “Collection Tab” on page 113 and “Running Scripts Manually” on page 171.
Outbox directory—A directory in which data that is ready to be uploaded to the Information Warehouse or exported to a .csv file is stored.
Archive directory—You can archive the files on the collector host if you choose Archive files after data processing. The location of the Archive folder appears in the field below Archive.
You can view and modify the default name and location of these file paths.
To view or modify the file paths
1 Choose Admin > Options.
The File Paths section in the File Paths tab displays the current file paths for the database and base installation directory, the import and outbox directories, and the archive directory.
By default, these paths are:
Database path: C:\Program Files\VMware\VMware Capacity Planner\AOGCapPlan.mdb
If you make this change, validate the database that you are redirecting the collector to.
Base Directory: C:\Program Files\VMware\VMware Capacity Planner

Data Collection Guide
114 VMware, Inc.
Import Directory: C:\Program Files\VMware\VMware Capacity Planner\Import
Outbox Directory: C:\Program Files\VMware\VMware Capacity Planner\Outbox
Archive Directory: C:\Program Files\VMware\VMware Capacity Planner\Archive
2 To change the location of these files or directories, click Browse and make a note of the new location.
Connection TabThe Connection tab of the Options dialog box enables the connection to the Information Warehouse by identifying and specifying the URL of the Information Warehouse and the proxy settings, if any, that are needed to establish that connection through your network structure.
ReportsThe Data Manager provides detailed reportsthat show the data the collector gathers. Each report is a table displayed in a new window when the report is requested.
Often many columns are out of view when you first open a report. Scroll to the right to see the hidden columns or adjust the report display window size. Initially, the data is listed in the chronological order in which it was collected. You can sort the data in ascending or descending order by any column by clicking the column header.
Every report that the Data Manager provides can be saved to a file on the collector system by clicking Export at the bottom of the report window. A report is saved as a CSV file and can be imported into Microsoft Excel or other reporting or analysis tools.
The reports are not intended to provide information for assessment of the company’s network and IT environment. They enable you to verify whether this collector is collecting data. For accurate analysis of this information, send the collected data to the Information Warehouse and request analysis reports through the Dashboard.
CAUTION VMware does not recommend that you change these path names unless directed to do so by a VMware Capacity Planner Certified Provider.

VMware, Inc. 115
12
The following topics are described in this chapter:
“Troubleshooting Overview” on page 115
“Discovery Troubleshooting” on page 117
“Data Collection Issues” on page 119
“Useful Troubleshooting Tools” on page 122
“Dashboard Access to the Data” on page 124
“General Collector and Data Manager Issues” on page 125
Troubleshooting OverviewAs you use the VMware Capacity Planner collector, you might encounter problems or errors during the discover, inventory, performance collection, and data synchronization processes. This is norma because of the complex and variable nature of network configurations, system security issues, and more.
The information provided in this chapter will help you identify the cause of the problems you encounter. Suggestions are given to assist you in correcting the problem, or working around it.
In addition to the information presented in this chapter, also consult the VMware Capacity Planner Release Notes accompanying the product.
If you have a problem that is not discussed in this chapter or in the Release Notes, check the VMware Knowledge Base at https://www.vmware.com/support/kb/. If none of these resources answer your problem, report the problem to VMware Capacity Planner Technical Support.
Tracking the Current Status and ActivityYou can view the current status and most recent activity in the Message pane at the bottom of the Data Manager window. Select View > Message Box if this pane is not visible. The level of detail in the messages is determined by the logging level as explained in the next section. The status bar at the bottom of the window shows which job is currently running, if any.
Using Data Collector Log FilesWhen the collector is installed and run on its host system, a log file is created in the installation directory. The collector records the activities that occur during processing in the log file. When the log file fills up, it is archived and a new log file is created. The number and size of the log files is set in the Options dialog box. These log files are crucial tools for troubleshooting.
The amount of information written to the log files is determined by the logging level defined in the Data Manager. As the logging level increases, more detailed information about the activity of the collector is recorded in the log file and displayed in the Message pane.
Troubleshooting Capacity Planner 12

Data Collection Guide
116 VMware, Inc.
The log files are standard text files and can be opened with any text or word processor. When problems are encountered, examine the log files first to determine whether an error message was reported, or if other pertinent information was recorded. If you cannot find enough pertinent information in the log file to help explain the problem, raise the logging level and repeat the procedure or other sequence of events that triggered the problem.
To set the logging level
1 Start the Data Manager and select Admin > Options.
The Log Level is set by the slider in the Options dialog box.
2 Move the slider to the setting you want and click OK.
As you move the slider, the level of logging (such as Follow Progress) appears. The further to the right the setting is, the higher the logging level.
As the logging level increases, so does the amount of detailed information that is recorded in the log file (and also displayed in the Message pane of the Data Manager window).
General Connection IssuesFirewalls or unmanaged systems in the collection environment can cause connectivity issues. These topics are discussed in the following sections.
Firewalls
Firewalls provide security for systems from intruders. They can also prevent access for legitimate administrative users. If several systems are in a location behind a firewall, you might need to install the collector and Data Manager on a host system within the firewall.
Unmanaged Systems
The network environment for a company might include some unmanaged systems that are connected to the network, but not joined into any domain. To connect to an unmanaged system, the collector must use a local administrative account for that system.
This scenario is not uncommon after a company merger or acquisition has occurred. A transition plan might exist for defining the management of these new systems, but until the plan takes effect, many of these systems are connected to the network, but not joined into any domain.
Error Codes In addition to the information presented in this chapter, with the suggested solutions and workarounds, check Appendix A, “Error Codes,” on page 127 for commonly-encountered error codes.
Table 12-1. Levels of Logging
Log Level Description
0 Off - Errors Only
1 Follow Progress
2 Detail Progress (the default)
3 Light Debugging
4 Detail Debugging
5 Trace Mode
CAUTION Prolonged logging at a high level can quickly fill your log file, consume available disk space, and possibly affect performance of the collector. Limit use of detailed logging to troubleshooting a possible problem with the collector.

VMware, Inc. 117
Chapter 12 Troubleshooting Capacity Planner
Discovery Troubleshooting The discovery process relies on the network configuration at the target site, so if there are problems with the discovery of a particular target system (or group of systems), the first step is to identify what is missing and investigate the network configuration.
The collector uses the same APIs to populate the network neighborhood. If certain target domains or systems are expected to be discovered, but are not found during the discovery process, go into the All Objects branch in the Navigation pane of the collector host and verify that the expected domains and systems can be seen.
Possible workarounds to consider when target domains or systems are not discovered are:
If specific domains are missing, manually add the missing domains with the Data Manager. This often results in discovery of systems in the added domains. If a file of missing domains and systems is available, the Data Manager can import those domains and systems from the file.
For domains that are not providing complete server listings, ensure that the collector host has WINS servers listed for those domains.
Create an LMHOSTS file with entries for missing domains and the corresponding primary domain controllers.
If a list of target systems is available but the associated domains are unknown and it is too time-consuming to identify the associated domains, you can create a dummy domain and the import the target systems.
A target system within a Microsoft LAN Manager domain resolves with its short name, and Capacity Planner can collect inventory and performance information without the proper domain name.
This section describes some errors often encountered during discovery.
Bad Path A bad path error is typically caused by the following problems:
Name resolution – The host name cannot be resolved to an IP address.
Connection to the IP address – The returned IP address cannot be reached.
Because these problems can manifest themselves in several ways, numerous possible solutions exist.
Name resolution is easy to detect and is usually straightforward to resolve. To correct this problem, make it possible for the hostname indicated for a target system to be resolved to an IP address. To do this, correct a DNS, WINS, or Active Directory name locator server, or edit the local LMHOST file to fix the problem. Use the nslookup command to verify that the hostname is resolvable.
Change the LMHOST file, and not the HOST file, because Capacity Planner uses some APIs for LAN Manager protocols.
Name resolution problems are not connectivity problems. Name resolution involves getting the correct physical address for a system. Typical reasons for name resolution problems include:
The system no longer exists on the network, and has been gone long enough to be removed from Active Directory, WINS, or browser synchronization.
If system names are imported, either a system name was misspelled or the system name is not resolvable.
The system was moved to another domain and because the collector host uses a fully qualified domain name (FQDN) to contact the system, the name is incorrect.
If a short name is used for the path of a target system instead of the FQDN, the domain of the collector host is appended to the end of that short name by default. If a bad path error is encountered, the collector host might be in a domain that cannot resolve the remote system.
The best tools to verify the path to a target system are the ping and nbtstat commands. See “Useful Troubleshooting Tools” on page 122.

Data Collection Guide
118 VMware, Inc.
Connection to the IP address of a target system might not be accomplished for the following reasons:
The system is temporarily off the network.
A system is not connected to the network and was not removed by the name resolution service. This is common for Active Directory. Active Directory does not remove systems from the database when they go offline.
The system is in a location that prevents connection either by router configuration or a firewall.
This problem can be difficult to diagnose. In many cases, one protocol or port is allowed, but another is not. For example, you might be able to successfully ping a target system by its host name, yet you cannot map a drive on that system.
Make sure that the protocols used by Capacity Planner are successful. Use the Test Connection menu command in the Data Manager.
Unknown User The unknown user error occurs when the user account that the collector is using is not known to a target system. If the collector host is using a local account to connect to a remote system, the account probably does not exist on that system. If the collector host is using a domain account:
The target system might belong to a different domain and might not have a trust relationship with the domain to which the user account belongs.
The target system is part of a workgroup instead of a member of a domain.
The unknown user error might also occur because of a scenario that might be difficult to determine.
If a target system is a member of a domain that is discovered by using both LAN Manager and Active Directory APIs, the credentials might conflict or be invalid during certain tasks when the collector accesses this system. You must use the same account credentials to connect to the system through both of the discovered types: LAN Manager and Active Directory.
This ensures that the collector can connect to the system for inventory and performance data collection because the collector tries either path to reach the system. It always tries to find the quickest error-free path to a target system, regardless of the domain to which it belongs.
Access Denied The collector host can be denied access to a remote system if it is trying to connect with an invalid password. Another consideration is whether the remote system is configured to allow remote access only for specific users accounts or groups or only for specific domains or network paths.
You might receive an access denied message if there is no trust relationship for the domain. It is more likely that an untrusted domain is indicated by an unknown user error.
Administrator PrivilegesIf the collector host is using an account that is not the local administrator account, verify that the account is added to the Administrators group on the remote system.
Some environments default to a guest account if the provided user name and password are incorrect. This gives the false security that the user account or password is correct and connection was successful. This can lead to later problems with inventory and data collection because a guest does not have necessary privileges to access the necessary data on the remote system.
Testing the Access PathsAccess paths that the collector host uses include Remote Registry access, WMI access, and the performance database.Try starting Performance Monitor and adding some counters for the remote system. If the test with the Performance Monitor fails, something with the user account needs to be changed. You can add the account

VMware, Inc. 119
Chapter 12 Troubleshooting Capacity Planner
to a local administrator group, create a trust relationship, or make sure that the local administrators group is part of the domain administrators group.
Logon Server Not Available If the collector host is using a domain user account is being used by the collector host, the logon server not available error can occur if none of the domain controllers (for the user’s domain) can be contacted. If this happens, try the following:
Check whether the domain name was mistyped. If the domain name is incorrect, the remote system cannot resolve any of the domain controllers for that domain.
Log in to the remote system with any account and then ping one of the domain controllers. This helps determine whether the network path from the remote system to the domain is not accessible.
RPC Error A remote procedure call (RPC) error indicates that a connection requested on a specific port was not successful. RPC connection requests occur after name resolutions and IP connections.
The most common cause of an RPC error is that the RPC service is shut down.
To test for an RPC error
1 Determine whether the host name is resolvable by executing the following command:
NBTSTAT –a hostname
2 If you can resolve the host name, try to connect to the system with the command:
net use \\hostname $IPC
If you cannot connect, one of the services—Remote Registry, WMI, or Perfmon—is disabled.
The net use command also confirms that the required ports are available for the collector to run inventory and performance.
Some Domains Not DiscoveredWhen selecting the host machine on which the collector will be installed, select a machine in a domain that has access to the Active Directory server. If, by contrast, you select a machine that is located in a Windows workgroup, the collector cannot discover domains/machines stored in the Active Directory.
Data Collection IssuesThe main problems that affect data collection are:
Network issuesService failuresAuthentication problems
Most issues that affect successful data collection fall into these categories.
You can also expect a certain order of failures. You can usually expect network issues to occur first, followed by service issues, and then authentication issues.
Begin troubleshooting any data collection issue by checking the collector host first:
Verify that the collector service is running.
Confirm that the collector host can connect to the network.

Data Collection Guide
120 VMware, Inc.
Network IssuesIf the collector cannot connect to a remote system, it cannot determine whether a service is running or that a connection account is valid. You must get the network working before trying anything else.
Typical network issues are caused by:
Routers Network bandwidth Firewall Windows XP SP2 Name Services
If you are having trouble reaching a target system for data collection, make sure the name of the system can be resolved to an IP address first. Sometimes this IP address can be the wrong one, because it is an old static IP address. If the name service is providing the wrong IP address or no IP address, you never reach it. Firewalls and routers can also be problematic because they close ports for security and scalability. In general, try to ping the system, or use other network check utility programs like nbtstat and nmap.
Service FailuresA service failure can resemble a network issue because of the error message that is returned. If you are sure that the network is available and other systems are on the same subnet that allow connection, a required service is probably shut down.
Services run on a system and listen on a TCP or UDP port for a request. When a request occurs, the sevice authenticates the request and responds appropriately. If you receive an access denied response, you confirmed that the service is running and you can proceed to troubleshoot the connectivity problem as an authentication failure.
Inventory uses WMI, Net APIs, Registry, Perfmon, and SSH. For each target system, inventory determines what type of system it is: Windows, Linux, or UNIX. With this information, it tries the different protocols to collect information. The tests are WMI, Registry, and SSH. If Registry is selected, Perfmon is used to determine the amount of memory. Verify the list of required services before installation.
Authentication FailuresAuthentication failures are usually indicated by error messages similar to access denied. The types of authentication errors that occur are:
Invalid user ID or password
Domain controller not reachable
Account locked out or needs a password change
Account does not have enough rights
Problems Resulting from Decentralized ManagementA client’s company might be set up with a decentralized management system that allows departments to purchase, install, and manage new systems on the company’s network. Workgroups that own their own systems usually have their own security administrator as well.
The collector host can usually discover these systems, but not access them to collect inventory or performance data. To gain access, the security owners of the systems must be contacted to provide accounts that the collector can use for accessing the necessary data from these systems.

VMware, Inc. 121
Chapter 12 Troubleshooting Capacity Planner
Inventory Collection Using the Registry Only OptionIf you experience problems using the Registry Only option for inventory collection from some target system, the Remote Registry service might be stopped or disabled on that target system. Even if the service is running, it might be necessary to restart it.
To check the status of the Remote Registry service on the target system, choose Start > Control Panel > Administrative Tools > Services.
The service name is Remote Registry.
In addition to checking the status of the service, check for an incorrect login, or a login that does not have administrative rights on the target system. Verify that no firewall is blocking any traffic to or from the target system.
Issues with Inventory Collection from Windows Vista MachinesInventory collection fails when the target machine is a Windows Vista machine. The workaround is to activate the Administrator account on the Vista machine.
1 Choose Start > Setting > Control Panel > Administrative Tools > Computer Management.
2 Expand Local Users and Groups.
3 Click the Users folder.
Icons for all user accounts on this computer appear in the right side of the Computer Management screen.
4 Select the Administrator icon and right-click to select Properties.
5 Deselect Account is Disabled.
6 Set the Administrator password.
7 Reboot the system and log in as the Administrator.
You should be able to collect performance data while the target machine has the administrator logged in.
Before you start collection, if the target machine is behind a firewall, turn off the firewall. Make sure that services are started.
Timeouts During Inventory CollectionThe request for inventory data might time out on some target systems. To correct this, increase the timeout for inventory collection at the task level.
CD-ROM Drives Might Not Appear as Expected After InventoryIf inventory collection is performed through WMI on a Windows target system with CD-ROMs drives, the CD-ROM drives are not listed when you select Hardware > Physical Drives. If inventory collection is performed again on the same system using the Registry method of collection, the CD-ROM drives are detected and reported back by the Inventory task.
The expected result of the Inventory task is that WMI detects the CD-ROM, but classifies them as removable drives. Inventory data collection is only interested in the hard drives on the target system because an important performance statistic is the use of disk space on the system disks. Because the CD-ROMs are reported as removable disks, they are not reported back in the inventory data that WMI collects.
When the Registry method of collection is used, the Registry reports that it detects these disks but doesn’t know that they are CD-ROMs and are considered removable media. The same behavior is seen with Linux and UNIX inventory collection, depending on the target system.
Expected Performance Data Is Not CollectedThis section discusses performance data collection issues.

Data Collection Guide
122 VMware, Inc.
Registry Only Collection
If inventory data collection is performed by the Registry method only, data collection performance might fail, such as RAM or CPU information from a target system. If this occurs, check whether the account that the collector host is using to connect to the system has administrative privileges on that system.
Perfmon Collection
Some performance data—such as, RAM or CPU information—must be collected by Perfmon, and Perfmon can only be accessed by an administrator-level user. If the collector host is connecting to a system with a non-administrator user, some expected performance data is not retrieved from that system.
Issues with Performance Collection from Windows Vista Machines
To collect performance data on a Vista machine, the Windows Vista firewall must be configured to allow inbound remote administration exceptions.
To collect performance data on a Vista machine
1 Select Start > Run.
2 Type gpedit.msc.
3 Choose Computer Configuration > Administrative Templates > Network > Network Connections > Windows Firewall > Domain Profile.
4 Right-click Allow inbound remote administration exceptions and select Properties.
5 Click Enabled.
6 Click OK.
7 Close the Group Policy window.
Limiting Groups of Systems Monitored by the CollectorBy default, the collector scans and gathers information from all Windows systems that it can connect to, and it does not access any UNIX or Linux systems.
You can change this default behavior by defining specific IP ranges or domains for the UNIX, Linux, and Windows systems on your network.
To change the default behavior
1 From the Data Manager menu bar, select Admin > Options.
2 Click the Modules tab.
3 Double-click the Discover module.
4 Click the Group/Domain Discovery tab and select DNS or click the Node Discovery tab and select IP Addresses.
5 Click the System Discovery ta.
6 Select Use SSH connection to determine system type.
7 If you are defining domains, click the DNS Domains tab and add the domains you want the collector host to work on.
8 If you are defining IP ranges, click the IP Subnets tab and add the subnets that you want the collector host to scan.
Useful Troubleshooting Tools The following Windows commands and utilities are helpful in troubleshooting problems that the collector encounters during discovery, inventory, and performance collection.

VMware, Inc. 123
Chapter 12 Troubleshooting Capacity Planner
Unless otherwise noted, detailed information about these commands and utilities is provided in the online Help of your Windows system. These commands are described in relation to their use on the collector host.
ping
The ping command allows you to verify connections to a remote computer (or computers), confirming that the remote system is online and responding.
Ping can be useful in determining whether your system is online, but a successful ping does not guarantee that collection will be successful.
A failed ping can mean that the system or network does not allow Internet Control Message Protocol (ICMP) traffic.
Example The following command tests the ability to connect to abcserver by sending packets to it and waiting for a response from the remote system. The connection is made by resolving the host name of the remote system.
ping abcserver
The results from this command indicate the degree of success of the connection attempt, and the round trip time statistics.
nbtstat
The nbtstat command is a diagnostic command that helps determine how a system name or IP address is resolved. Because it can display current connections using NetBios over TCP/IP (NBT), it is useful for determining if Windows systems are online from a NETBIOS view.
Example The following command lists the name table for abcserver, resolving access to that remote system by its host name:
nbtstat –a abcserver
net view
The net view command is one of a collection of network (net) commands. The net view command allows you to display domains or computers, or shared resources, that can be accessed from the local system.
Example The following command determines which shared resources are available at abcserver.
net view \\abcserver
When used without parameters, net view displays a list of computers in the domain of the local system.
To display a list of computers in another domain, use a command such as:
net view /domain:abcdomain
net use
The net use command is another Windows network command. Its typical use is to connect to or disconnect from a remote computer or shared resource. It can also provide information about existing connections, making it a useful tool to verify that the collector host can connect with this account.
Examples The following command connects to abcserver with user ID abcuser.
net use \\abcserver\ipc$ /USER:abcuser
A variation on the preceding command connects to abcserver for the purpose of remote administration, thus ensuring that the abcuser account has administrator privileges on abcserver:
net use \\abcserver\admin$ /USER:abcuser
Perfmon
The Perfmon utility can help to verify that a remote system can be monitored. In addition, it can also add performance counters from a remote system. However, Perfmon only works locally as a troubleshooting tool.

Data Collection Guide
124 VMware, Inc.
Because Remote Registry and File and Print services use the same ports as Perfmon, you can test access to a target system with those tools. If Perfmon is run locally on a problem system, it allows you to verify that the necessary services are running correctly and that the correct counters are installed for Performance data collection.
tracert
Also called traceroute (or tracepath on some Linux systems), the tracert tool allows you to determine the route IP packets use as they navigate an IP network. The tracert tool shows the route taken to reach a particular destination on the network, and is thus a useful tool for troubleshooting the network.
Computer Management Utility
The Computer Management utility is an administrative tool that allows you to manage your local system and remote systems to which you have access.
It is helpful in determining whether WMI is working on the remote system. You can also verify your access rights on a remote system by navigating through the console tree in different areas and looking for Access Denied or Access is Denied errors.
To start the Computer Management utility, select Control Panel > Administrative Tools > Computer Management.
To manage a remote system, right-click the top level of the navigation tree and select the remote system to connect to.
Registry Editor
The Registry Editor is generally used to view and edit the Registry on your local system. However, it is also a useful tool to test Windows Registry connectivity to a remote system.
Windows provides two forms of the Registry Editor: regedit.exe and regedt32.exe. Microsoft recommends the use of regedit as the preferred utility for general browsing and searching of the Registry.
To start either form of the Registry Editor, select Start > Run and specify the utility name.
The Registry Editor window opens and displays the local Registry. To connect to the Registry of a remote computer, select Connect Network Registry from the File menu.
PuTTY
PuTTY is a third-party shareware Win32 Telnet and SSH client. PuTTY allows you to open a terminal session to remote systems that support SSH. This tool also includes certificate management tools that allow you to assign your private keys. PuTTY and its related binaries are included in the third-party subdirectory of the Capacity Planner installation folder.
Considerations for accessing UNIX and Linux systems, and the role of PuTTY in this process, are provided in:
Chapter 3, “Preinstallation Requirements,” on page 25
Chapter 4, “Installing the Collector,” on page 33
Chapter 8, “Inventory,” on page 87
Dashboard Access to the DataAfter you set up the collector and everything appears to be running fine, you still might have problems seeing the data on the Capacity Planner Dashboard Web site.
CAUTION Be careful when you access a Windows Registry. If any key in the Registry is inadvertently (and incorrectly) modified, operation of that Windows system can be severely affected.

VMware, Inc. 125
Chapter 12 Troubleshooting Capacity Planner
Data Does Not Appear on the Dashboard Web SiteInventory data that was uploaded to the Information Warehouse is typically available through the Dashboard within 24 hours after submittal. However, performance data does not typically appear in the Dashboard until the next business week. This data is summarized and processed at the end of every week, provided that sufficient data was submitted.
To see limited data more quickly, change the Dashboard viewing interval from Weekly to Hourly. See the VMware Capacity Planner Dashboard Users Guide for information about viewing data.
If you do not see any data from your collector host through the Dashboard, verify that the database ID for this collector is properly registered in the Information Warehouse for the correct company.
Collector Does Not Seem to be Sending DataIf your collector is not sending data to the Information Warehouse, try the following troubleshooting steps:
Verify that the database ID for this collector is properly registered in the Information Warehouse for the correct company. (See Chapter 5, “Setting Up the Collector,” on page 43.)
Make sure that your scheduled jobs are set up correctly on the collector host, and that the Scheduler is not suspended. (See Chapter 5, “Setting Up the Collector,” on page 43.)
Make sure that you wait one full business day from setting up the collector host.
Check the Internet connection between the collector host and the Information Warehouse:
You must be able to send traffic through the HTTPS port (443) of your collector host.
Make sure that you can connect to an HTTPS site from the collector host.
Ping the Information Warehouse site from the collector host, to verify connectivity.
If a proxy server is on your network, from the Data Manager’s menu bar, select Admin > Options > Connection and enter the proxy setting.
Select Use Manual Settings and enter the correct proxy setting.
General Collector and Data Manager IssuesThe following section describes potential troubleshooting issues with the collector or Data Manager.
Unsuccessful Database Compaction The collector compacts the database every day, and the Data Manager tries to compact the database whenever the collector starts. The benefit of compacting the database is that it allows the retrieval of available disk space within the database. If the database is not compacted, not only is this available space not retrieved, but overall performance of the Collector can be adversely affected. If the database is not compacted for a very long period, there is also the danger of it reaching the hard file size limit of 2GB. However, compacting the database is not normally required for successful operation of the collector.
Generally, database compaction is performed regularly without any problem. You might notice messages appearing in the Message pane related to compaction, including an occasional message that database compaction was not successful (the extent of this message depends on the logging level that is in effect).
A failed database compaction is not a problem. It usually occurs when the Data Manager or collector tries to compact the database at the same moment that the other has the database locked for access during normal operation.
Although it is not required, you can manually compact the database by selecting Admin > Database > Compact Database.

Data Collection Guide
126 VMware, Inc.
The compaction process does the following:
1 Compacts the current database file, copying it to a temporary file.
2 Deletes any old backups sitting in the base directory.
3 Renames the current (uncompacted) database to the backup database filename.
4 Renames the temporary file (which is the compacted database) to the proper name of the current database.
Purge DatabaseYou can manually purge the database by selecting Admin > Purge Database. If you select this option, you are prompted witha warning.
TimeoutsRequests to some target systems might timeout. To correct this, increase the timeout for one or more modules at the task level. An example for the Inventory task follows.
To set the timeout for the Inventory task
1 From the Data Manager menu bar, select Admin > Options.
2 Click the Jobs tab.
3 Select Scheduled - Inventory and click Modify.
4 Click the Tasks tab.
The Inventory task is listed on the Tasks tab with its Continue On setting and the task time limit, as defined by the task timeout parameter defined for this task.
5 Select the Inventory task and click Modify.
Click Modify to change the necessary parameters for this task. Double-clicking the task name on the Tasks tab does not start the necessary dialog box.
6 Select the Inventory module.
7 Set the task timeout and object timeout periods, then click OK.
Repeat this process for any other module that is timing out.
NOTE The specific messages recording these steps can be seen in the Message Box by setting the Log Level to level 3 (Light Debugging).
CAUTION All of your collected data is purged if you select Yes.
VMware, Inc. 127
A
This appendix documents common errors that you might encounter when running the VMware Capacity Planner collector and Data Manager.
The following topics are described in this chapter:
“Common Errors” on page 127
“Data Collection Errors” on page 127
“Data Synchronization Errors” on page 130
“Miscellaneous Errors” on page 131
Common ErrorsThe majority of errors that are documented here occur during the inventory and performance data gathering processes—it is those two tasks that require successful connection to target systems with permissions that allow various utilities or system services to be run to obtain necessary information. For descriptions of these errors, see “Data Collection Errors” on page 127.
The next most common period in which errors are encountered is that of data synchronization when the collector transmits its collected data to the Information Warehouse. “Data Synchronization Errors” on page 130 describes these errors.
The errors usually appear in the Message pane of the Data Manager window and are logged in the collector’s log files.
A number of the messages have the same message text but different error codes. Compare the error code with the message text when looking up an error in this appendix. The message you are looking for might be in another section. For example, there are five possible Access Denied messages, each with a different error code. The cause of these messages depends on what you are doing at the time.
If you encounter an error that is not documented in this chapter, contact VMware Capacity Planner Technical Support as described in “Technical Support and Education Resources” on page 12.
Data Collection ErrorsInventory data collection is attempted through a variety of methods. Because the primary method used is WMI, the majority of inventory collection errors occur when collection is attempted in this manner.
Collection Through WMIThe error messages are listed alphabetically in Table A-1.
Error Codes A

Data Collection Guide
128 VMware, Inc.
Table A-1. WMI Error Messages
Error Code and Message String Possible Causes Suggested Actions
-214702489Access is Denied Note: Note the “is” in the error message. The number and the message are different than if the user is valid, but does not have enough rights (error -2147217405: Access Denied).
Problems with the connection account on the target system:
Account does not exist.Password is invalid.User needs to change password on first login.Account is disabled.User domain cannot be reached for authentication.
Check the user account, as it is defined for the collector, that no misspellings occurred in the account name or domain. Retype the password in the collector to make sure that it is correct. Note: The connection account might have been defined in the setup options as a global connection for the collector, or as a custom connection account for the specific target system.Log in to the target system with the account to verify that everything is working. Check the user account in the domain or target system to verify that it exists, is not disabled, or does not require a password change on first login. Check that the target system is really in a domain and not in a workgroup with the same name. If the user account is not in the same domain as the target system, ensure that the proper domain trusts exist.
2147024882Inventory error
This error happens on systems running Windows NT when the Network Redirector runs out of buffer space when processing a command and the IRPstack is too small for the command to complete.
2147217400Invalid parameter, WMI error
Problems with a WMI driver Perform inventory collection using the Registry and not WMI.
-2147217405Access Denied Note: Compare to error -214702489: Access is Denied)
Problems with the connection account on the target system:
User does not have enough rights.User not in the local administrator group on the target system.Inherited rights for the user are not sufficient.
Add the connection account to the local administrators group on the target system. If the user is in a domain administrators group, add the domain administrators group to the local administrators group on the target system.
2147217407Failure to collect inventory data
Problems with a WMI driver Perform inventory collection using the Registry and not WMI.
-2147221164Class not registered ==========-2147217394 Error description not found
Target system is one of the following:
NT 4.0 with no WMIWindows 2000 or higher with WMI stopped
The collector handles this scenario and switches to Registry when this happens (with default settings). This is normal behavior for NT 4.0 and there is nothing to do since WMI is not available. For Windows 2000 or later:
If WMI is shut down for security reasons, don’t do anything. If WMI is shut down for testing reasons, restart the service.

VMware, Inc. 129
Appendix A Error Codes
General Data Collection Errors Some data collection errors can occur with either inventory or performance data collection, independently of the manner being used to collect the desired data.
-2147217392Invalid Class =========438Object doesn’t support this property or method
The class of items does not exist.Older hardwareSpecific hardware drivers do not populate WMIPossible language issue with class names
Usually, there is nothing to do in this situation. The collector continues to collect information from objects that it finds. In some cases, the collector intentionally tests for the existence of an object before it goes on.
-2147023174 The RPC Server is unavailable
Target system is offlineThe remote procedure call (RPC) service is stopped on collector host or on target system)Required ports are blocked
Ping the target system and fix any network or service issue.
2147467259Not collecting inventory
The database has been placed in a state that prevents it from being opened or logged
Ensure that the Microsoft Jet Database engine can be opened and logged.
2147481648Unable to run performance in some servers
May need another collector on the domain that has systems failing
If systems that are failing appear to be mostly in one domain, add another collector for that domain. Add an account that gives you access to the systems in the new domain.
Table A-1. WMI Error Messages (Continued)
Error Code and Message String Possible Causes Suggested Actions

Data Collection Guide
130 VMware, Inc.
Data Synchronization Errors
Data synchronization errors can occur when the collector attempts to transmit data files to the Information Warehouse. The error messages are listed alphabetically in Table A-3.
Table A-2. General Data Collection Error Messages
Error Code and Message String Possible Causes Suggested Actions
5Access denied
Usually occurs during inventory data collection:This is probably a registry access failure: The user has the rights to connect, but does not have enough rights to read the necessary keys.
Make sure the connection account has administrative rights on the target system.
An attempt was made to log in, but the network login service was not started
Can occur during either inventory or performance data collection:Net logon service is not running.
Check the Services for the system and make sure that the Net login services are running.
Command = ‘[command name]’ returned Error = [error that occurred]
An example follows:Command = ‘isdev’ returned Error = not found in /bin:/usr/bin:/usr/sbin:/sbin:/usr/contrib/bin
This error occurs during data collection on UNIX or Linux machines (or when data collected from these machines using the collector scripts is imported by data synchronization). The error occurs when scripts used by the collector cannot find tools or commands the script expects to find on the target machine. The error message shown on the left appears in the message box on the collector host.The result is that some data cannot be collected, and a TOOLS block appears in the collected data files. (Data files are typically found in C:\Program Files\VMware\VMware Capacity Planner\Temp until the data is imported into the collector. If the Archive option is selected, the files are copied to C:\Program Files\VMware\VMware Capacity Planner\archive). An example of a TOOLS block follows:<TOOLS>HOSTNAME=cp-linux1FILETYPE=LogDate=Tue Oct 23 16:20:13 PST 2007TIMESTAMP=20070206162013CMD=showmountERR=mount clntudp_create: RPC: Program not registered</TOOLS>
Install the required tools/commands on the target machine indicated after HOSTNAME=. The TOOLS block text provides information to help you troubleshoot and fix the problem.

VMware, Inc. 131
Appendix A Error Codes
Miscellaneous ErrorsThe error messages are listed alphabetically in Table A-4.
Table A-3. Data Synchronization Error Messages
Error Code and Message String Possible Causes Suggested Actions
5 Access denied
A file transfer was attempted and did not successfully complete:
VMware does not allow files to be overwritten and the collector is trying to resend a file with the same name.After the file transfer, the collector is trying to move the file to the archive directory, but the directory is read-only.Somehow the file being sent is marked as read-only and the collector cannot delete it.
Notify VMware of the file causing the error so that the file can be deleted from the upload directory.Check the rights to the archive directory to make sure the collector can write to it.
Can’t send data to VMware
Invalid proxy settings Verify that the Information Warehouse site (https://optimize.vmware.com) is available and you can log in to the Dashboard. Check proxy and port settings in the Data Synchronization job (In the Data Manager, select Admin > Options > Connection).
You might need to set the Service User account for the collector service to an account that has rights to browse the Web outside the company.
Table A-4. Miscellaneous Error Messages
Error Code and Message String Possible Causes Suggested Actions
713 Class not registered
Capacity Planner was installed as a different user than what you are running. Might cause the Data Manager to fail.Some dlls need to be registered for each user.
When you receive the error message dialog box that shows the .dll name, run:regsvr32 full.dllpath
For example:regsvr32 c:\winnt\system32\msstdfmt.dll
In the Data Manager, the navigation tree does not expand to show the objects underneath
MDAC is too old Upgrade to the latest version of MDAC from http://msdn.microsoft.com/data/ref/mdac/downloads/This problem typically does not exist in Capacity Planner version 2.1.0 or later because the installer checks for MDAC and makes sures that it is up-to-date. If it is not, the installer automatically installs the required version.
1726, 1789Failed: unknown.
Usually, an error message and code are converted and available to view on the Properties tab of the Details area for the target system on which the error occurred. If it’s not showing up there, it is probably an error code that Capacity Planner has not encountered before. If this occurs, contact VMware Technical Support as described in “Technical Support and Education Resources” on page 12.To address this problem, Technical Support needs to evaluate a copy of your Capacity Planner log file.

Data Collection Guide
132 VMware, Inc.

VMware, Inc. 133
B
The following topics are described in this chapter:
“Uninstalling a Collector System” on page 133
“Removing Data Files” on page 134
Uninstalling a Collector SystemThis section provides instructions for completely remove a Capacity Planner collector system.
Chapter 4, “Installing the Collector,” on page 33 provides the instructions for installing the collector and Data Manager components of VMware Capacity Planner. It also discusses the considerations that you must make if you are installing Capacity Planner on a system with a previous Capacity Planner installation. (See “Upgrading a Collector Installation” on page 36.)
Uninstalling the Collector Service Optionally, you can begin to uninstall by explicitly uninstalling just the Collector service through the Data Manager.
To uninstall collector service
1 Start the Capacity Planner Data Manager.
2 Select Admin > Collector > Uninstall.
3 Click Yes to continue.
The Data Manager performs the following operations:
Stops any processes that are running.
Stops the service (if it is running).
Deletes the service from the system (and the list of system services).
Returns to the main Data Manager window.
If the Message pane is in view, you’ll see the following messages.
4 To confirm that the collector service is uninstalled, select Admin > Collector menu.
Instead of an Uninstall option, an Install option appears.
Uninstalling the Data Collector B

Data Collection Guide
134 VMware, Inc.
5 Exit the Data Manager window.
6 Proceed with removing the remaining components of the Capacity Planner application.
Removing the Capacity Planner ApplicationUse the following procedure to remove Capacity Planner from your collector host.
To remove the Capacity Planner application
1 In the Windows Control Panel, double-click the Change or Remove Programs icon.
2 Scroll through the list of currently installed programs to find VMware Capacity Planner.
3 Click Change/Remove for the program.
The InstallShield Wizard displays the message that it is preparing itself, then prompts you to confirm that you want to uninstall the Capacity Planner application.
4 In the Confirm Uninstall dialog box, click Next.
If you did not uninstall the collector service from the Data Manager before beginning this removal process, the collector service has to be stopped before you remove it.
5 A progress box appears as the VMware Capacity Planner application is removed.
When the Capacity Planner application is removed, a window appears that indicates that the Installation wizard completed its tasks:.
6 Click Finish.
Removing Data Files When the entire VMware Capacity Planner application is removed from the system, the installation folder still remains, as it contains the old database, one or more backup files, and one or more log files.
To remove all VMware Capacity Planner application data files
1 Start a Windows Explorer window and navigate to the folder in which the Capacity Planner application was installed.
2 Select all files in the installation folder and delete those files.
3 Click Yes to delete the files.
4 (Optional) Remove the empty installation folder and all empty subfolders.

VMware, Inc. 135
C
This appendix provides a list of the inventory data that you can collect from the various operating systems (Linux and UNIX, Registry for MS Windows NT 4.0, and WMI for MS Windows 2000/XP) and tells you if you can view the data in the Data Manager or the Capacity Planner Dashboard.
Inventory Data C
Table C-1. Server Information
Setting
Collected From Viewable In
Linux and UNIX Registry WMI Manager Dashboard
Host Name Yes Yes Yes Yes Yes
BIOS Version Yes Yes Yes Yes No
BIOS Date Yes Yes Yes Yes No
System Partition Yes Yes Yes Yes No
Boot Directory Yes Yes Yes Yes No
PATH Environment Setting Yes Yes Yes Yes No
Auto Logon Setting No Yes No No No
Shutdown with Logon Setting No Yes No No No
Server Type Yes Yes Yes Yes Yes
Operating System Manufacturer Yes Yes Yes Yes Yes
Operating System Type Yes Yes Yes Yes Yes
Operating System Version/Release/Service Pack Yes Yes Yes Yes Yes
Table C-2. Motherboard/Chassis Information
Setting Collected From ViewableIn
Linux and UNIX Registry WMI Manager Dashboard
Chassis Serial Number Some No Yes Yes Yes
Chassis Manufacturer Some No Yes Yes Yes
Chassis Model Some No Yes Yes Yes
Chassis BIOS Make Some Yes Yes Yes Yes
Chassis Maximum Installable RAM Some No Yes Yes Yes
Chassis Number of RAM Slots Some No Yes Yes Yes
Chassis RAM Type Some No Yes Yes Yes
Chassis Maximum Installable CPUs Some No Yes Yes Yes
Chassis CPU Type Some No Yes Yes Yes
Chassis Number of PCI Slots Some Yes Yes Yes Yes

Data Collection Guide
136 VMware, Inc.
Table C-3. Processor Information
Setting Collected From Viewable In
Linux and UNIX Registry WMI Manager Dashboard
CPU Description Yes Yes Yes Yes Yes
CPU Manufacturer Yes Yes Yes Yes Yes
CPU Model Yes Yes Yes Yes No
CPU Current Speed Yes No Yes Yes Yes
CPU Maximum Rated Speed Yes Yes Yes Yes Yes
CPU Front Side Bus Speed Some No Yes Yes Yes
CPU Cache Size Some Yes Yes Yes Yes
CPU Slot Number Yes Yes Yes Yes Yes
CPU Serial Number Some No Yes Yes No
Table C-4. RAM Information
Setting Collected From Viewable In
Linux and UNIX Registry WMI Manager Dashboard
RAM Manufacturer No No Yes Yes Yes
RAM Model No No Yes Yes Yes
RAM Size Yes Yes Yes Yes Yes
RAM Speed No No Yes Yes Yes
RAM Type No No Yes Yes Yes
RAM Form Factor No No Yes Yes Yes
RAM Data Width No No Yes Yes Yes
RAM Total Width No No Yes Yes Yes
RAM Slot Number No No Yes Yes No
RAM Serial Number No No Yes Yes No
Table C-5. Drive Adapter Information
Setting
Collected From Viewable In
Linux and UNIX Registry WMI Manager Dashboard
Drive Adapter Manufacturer Some Yes Yes Yes Yes
Drive Adapter Model Some Yes Yes Yes Yes
Drive Adapter Speed Some No No Yes Yes
Drive Adapter Type Some Yes Yes Yes Yes
Table C-6. Drive Information
Setting
Collected From Viewable In
Linux and UNIX Registry WMI Manager Dashboard
Drive Manufacturer Some Yes Yes Yes Yes
Drive Model Some Yes Yes Yes Yes
Drive Type Some Yes Yes Yes Yes
Drive Space Yes No Yes Yes Yes
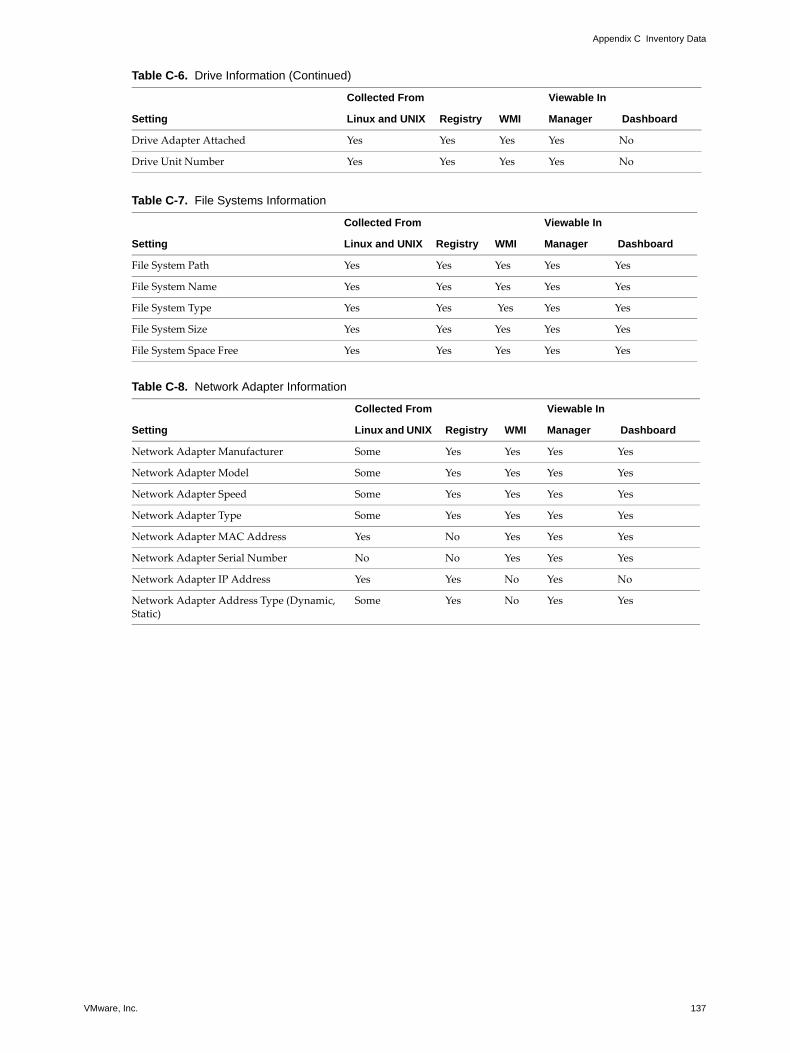
VMware, Inc. 137
Appendix C Inventory Data
Drive Adapter Attached Yes Yes Yes Yes No
Drive Unit Number Yes Yes Yes Yes No
Table C-7. File Systems Information
Setting
Collected From Viewable In
Linux and UNIX Registry WMI Manager Dashboard
File System Path Yes Yes Yes Yes Yes
File System Name Yes Yes Yes Yes Yes
File System Type Yes Yes Yes Yes Yes
File System Size Yes Yes Yes Yes Yes
File System Space Free Yes Yes Yes Yes Yes
Table C-8. Network Adapter Information
Setting
Collected From Viewable In
Linux and UNIX Registry WMI Manager Dashboard
Network Adapter Manufacturer Some Yes Yes Yes Yes
Network Adapter Model Some Yes Yes Yes Yes
Network Adapter Speed Some Yes Yes Yes Yes
Network Adapter Type Some Yes Yes Yes Yes
Network Adapter MAC Address Yes No Yes Yes Yes
Network Adapter Serial Number No No Yes Yes Yes
Network Adapter IP Address Yes Yes No Yes No
Network Adapter Address Type (Dynamic, Static)
Some Yes No Yes Yes
Table C-6. Drive Information (Continued)
Setting
Collected From Viewable In
Linux and UNIX Registry WMI Manager Dashboard

Data Collection Guide
138 VMware, Inc.
Table C-9. Application Information
Setting
Collected From Viewable In
Linux and UNIX Registry WMI Manager Dashboard
Application Manufacturer Yes Yes Yes Yes No
Application Name Yes Yes Yes Yes Yes
Application Type Yes Yes Yes Yes Yes
Application Display Version Yes Yes Yes Yes Yes
Application Major Version Yes Yes Yes Yes No
Application Minor Version Yes Yes Yes Yes No
Application Patch Level Yes Yes Yes Yes Yes
Application Build Number Yes Yes Yes Yes Yes
Application Registered Company No Yes No Yes No
Application Registered Owner No Yes No Yes No
Application Product ID Yes Yes Yes Yes No
Application Installation Date Yes Yes Yes Yes No
Application Installation Location Yes Yes Yes Yes No
Application Installation Source Yes Yes Yes Yes No
Application Estimated Size No Yes No Yes No
Table C-10. Services Information
Setting
Collected From Viewable In
Linux and UNIX Registry WMI Manager Dashboard
Service Name Yes Yes Yes Yes Yes
Service Display Name Yes Yes Yes Yes No
Service Description No Yes Yes Yes No
Service Startup Type No Yes Yes Yes No
Service Status No Yes Yes Yes No
Table C-11. Shares Information
Setting
Collected From Viewable In
Linux and UNIX Registry WMI Manager Dashboard
Share Net Name Yes Yes Yes Yes No
Share Type Yes Yes Yes Yes No
Share Remark Yes Yes Yes Yes No
Share Permissions Yes Yes Yes Yes No
Share Maximum Users No Yes Yes Yes No
Share Path Yes Yes Yes Yes No
Share Current Users No Yes No Yes No

VMware, Inc. 139
D
The following topics are described in this appendix:
“Performance Counters” on page 139
“Derived Performance Counters” on page 160
Performance CountersThis section lists many of the performance counters that the collector can gather. These performance counters appear in the Dashboard performance tables.
The list of performance counters in this section is not an exhaustive list of all counters the Dashboard might display. The performance counters are expected to change over time. Much of this information is from third-party vendors and VMware is not responsible for its accuracy. It is included here as a convenience.
For information about how performance counters are used by VMware Capacity Planner, see Chapter 9, “Collecting Performance Data,” on page 95. The performance counters are grouped alphabetically by the following performance objects:
Capacity Planner Performance Counters D
Active Server Pages MSExchange Internet Protocol Redirector
Browser MSExchangeDS Server
Cache MSExchangeIS Server Work Queue
Citrix IMA Networking MSExchangeIS Private SQL Server Access Methods
Citrix MetaFrame XP MSExchangeIS Public SQL Server:Buffer Manager
Cold Fusion Server MSExchangeMTA SQL Server:Cache Manager
Cold Fusion MX 7 Server Network Interface SQL Server:Databases
Database Objects SQL Server:Locks
DHCP Server Paging File SQL Server:Memory Manager
DNS Physical Disk SQL Server:Replication Merge
IP PowerPlay Server System
Logical Disk Print Queue Terminal Services
Lotus Notes Process Web Service
Memory Processor WINS Server

Data Collection Guide
140 VMware, Inc.
Table D-1. Performance Counters, Grouped by Object
Performance Object Performance Metric Description
Active Server Pages Memory Allocated Amount of memory allocated to this process.
Requests Executing
Requests Queued Number of requests waiting for service from the queue.
Requests/sec Number of requests executed per second.
Script Engines Cached
Sessions Current Current number of sessions being serviced.
Sessions Total
Template Cache Hit Rate
Percent of requests found in template cache.
Templates Cached Number of templates currently cached.
Transactions/sec Transactions started per second.
Browser Announcements Total/sec
Sum of Announcements Server per sec and Announcements Domain per sec.
Enumerations Total/sec Rate at which browse requests were processed by this workstation. This total is the sum of Enumerations Server, Enumerations Domain, and Enumerations Other.
Server List Requests/sec Rate at which this workstation processed requests to retrieve a list of browser servers.
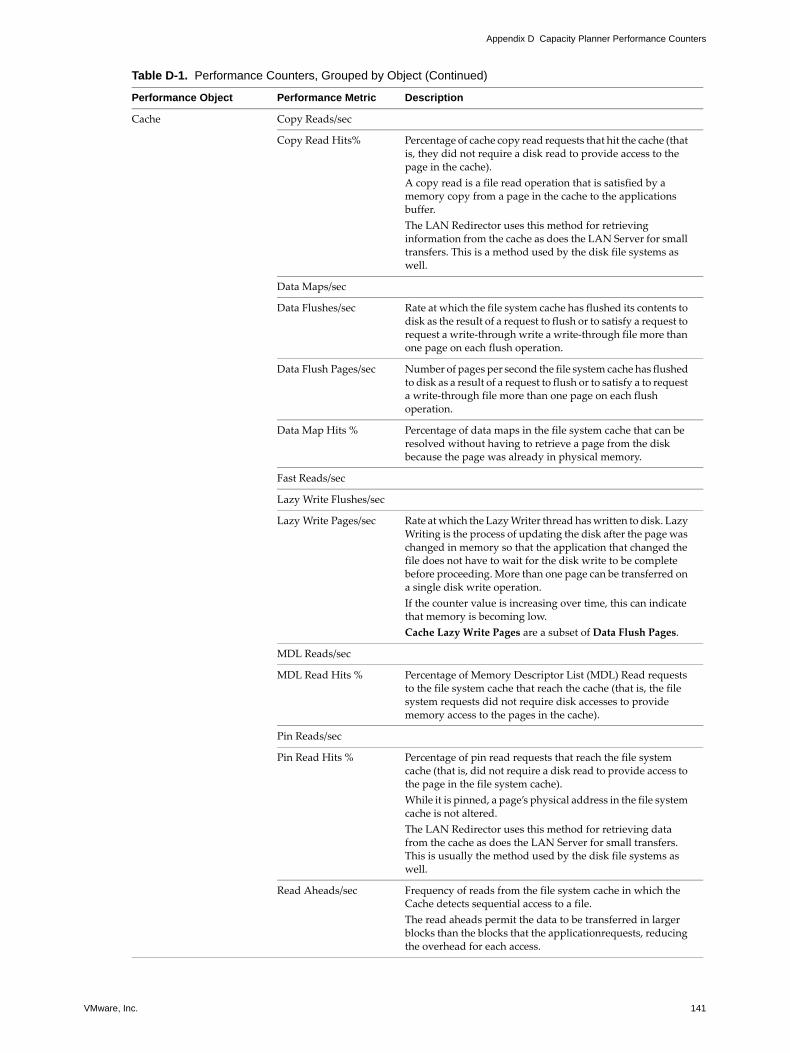
VMware, Inc. 141
Appendix D Capacity Planner Performance Counters
Cache Copy Reads/sec
Copy Read Hits% Percentage of cache copy read requests that hit the cache (that is, they did not require a disk read to provide access to the page in the cache). A copy read is a file read operation that is satisfied by a memory copy from a page in the cache to the applications buffer. The LAN Redirector uses this method for retrieving information from the cache as does the LAN Server for small transfers. This is a method used by the disk file systems as well.
Data Maps/sec
Data Flushes/sec Rate at which the file system cache has flushed its contents to disk as the result of a request to flush or to satisfy a request to request a write-through write a write-through file more than one page on each flush operation.
Data Flush Pages/sec Number of pages per second the file system cache has flushed to disk as a result of a request to flush or to satisfy a to request a write-through file more than one page on each flush operation.
Data Map Hits % Percentage of data maps in the file system cache that can be resolved without having to retrieve a page from the disk because the page was already in physical memory.
Fast Reads/sec
Lazy Write Flushes/sec
Lazy Write Pages/sec Rate at which the Lazy Writer thread has written to disk. Lazy Writing is the process of updating the disk after the page was changed in memory so that the application that changed the file does not have to wait for the disk write to be complete before proceeding. More than one page can be transferred on a single disk write operation.If the counter value is increasing over time, this can indicate that memory is becoming low. Cache Lazy Write Pages are a subset of Data Flush Pages.
MDL Reads/sec
MDL Read Hits % Percentage of Memory Descriptor List (MDL) Read requests to the file system cache that reach the cache (that is, the file system requests did not require disk accesses to provide memory access to the pages in the cache).
Pin Reads/sec
Pin Read Hits % Percentage of pin read requests that reach the file system cache (that is, did not require a disk read to provide access to the page in the file system cache). While it is pinned, a page’s physical address in the file system cache is not altered. The LAN Redirector uses this method for retrieving data from the cache as does the LAN Server for small transfers. This is usually the method used by the disk file systems as well.
Read Aheads/sec Frequency of reads from the file system cache in which the Cache detects sequential access to a file. The read aheads permit the data to be transferred in larger blocks than the blocks that the applicationrequests, reducing the overhead for each access.
Table D-1. Performance Counters, Grouped by Object (Continued)
Performance Object Performance Metric Description

Data Collection Guide
142 VMware, Inc.
Citrix IMA Networking Bytes Received/sec Number of inbound bytes per second.
Bytes Sent/sec Number of outbound bytes per second.
Network Connections Number of active IMA network connections to other IMA servers.
Citrix MetaFrame XP
Application Enumerations/sec
Number of application enumerations per second.
Application Resolution Time (ms)
Time in milliseconds that a resolution took to complete.
Application Resolutions/sec
Number of application resolutions per second.
DataStore bytes read/sec Number of bytes of data store data read per second.
DataStore bytes written/sec
Number of bytes of data store data written per second.
DataStore reads/sec Number of times data was read from the data store per second.
DataStore writes/sec Number of times data was written to the data store per second.
DynamicStore bytes read/sec
Number of bytes of dynamic store data read per second.
DynamicStore bytes written/sec
Number of bytes of dynamic store data written per second.
DynamicStore reads/sec Number of times data was read from the dynamic store per second.
DynamicStore writes/sec
Number of times data was written to the dynamic store per second.
Filtered Application Enumerations/sec
Number of filtered application enumerations per second.
LocalHostCache bytes read/sec
Number of bytes of IMA local host cache data read per second.
LocalHostCache bytes written/sec
Number of bytes of IMA local host cache data written per second.
LocalHostCache reads/sec
Number of times data was read from the IMA local host cache per second.
LocalHostCache writes/sec
Number of times data was written to the IMA local host cache per second.
Zone Elections Number of zone elections that occurred. This value starts at zero each time the IMA service starts and is incremented each time a zone election takes place.
Zone Elections Won Number of times the server won a zone election.
Table D-1. Performance Counters, Grouped by Object (Continued)
Performance Object Performance Metric Description

VMware, Inc. 143
Appendix D Capacity Planner Performance Counters
ColdFusion Server Avg DB Time (msec)
Avg Queue Time (msec)
Avg Req Time (msec)
Bytes In/Sec
Btyes Out/Sec
Cache Pops/Sec
DB Hits/sec
Page hits/Sec
Queued Requests
Running Requests
Time Out Requests
Cold Fusion MX 7 Server Avg DB Time (msec)
Avg Queue Time (msec)
Avg Req Time (msec)
Bytes In/Sec
Btyes Out/Sec
DB Hits/sec
Page hits/Sec
Queued Requests
Running Requests
Time Out Requests
Database Cache % Hit Percentage of Directory pages satisfied from the Directory Cache
Cache % Hit Percentage of Information Store pages satisfied from the Information Store Cache
Table D-1. Performance Counters, Grouped by Object (Continued)
Performance Object Performance Metric Description

Data Collection Guide
144 VMware, Inc.
DHCP Server Acks/sec Rate at which DHCP acknowledgements were sent by the DHCP server.
Active Queue Length Number of packets in the processing queue of the DHCP server.
Conflict Check Queue Length
Number of packets waiting in the DHCP server queue because of conflict detection.
Declines/sec Rate at which the DHCP server received declines.
Discovers/sec Rate at which the DHCP server received discovers.
Duplicates Dropped/sec Rate at which the DHCP server received duplicate packets.
Informs/sec Rate at which the DHCP server received informs.
Nacks/sec Rate at which the DHCP server sent negative acknowledgments (Nacks).
Offers/sec Rate at which the DHCP server sent offers.
Packets Expired/sec Rate at which packets expire in the DHCP server message queue.
Packets Received/sec Rate at which packets are received by the DHCP server.
Releases/sec Rate at which the DHCP server received releases.
Requests/sec Rate at which the DHCP server received requests.
DNS Total Query Received/sec
IP Datagrams Forwarded/sec
Rate, in incidents per second, at which attempts were made to find routes to forward input datagrams to their final destination, because the local server was not the final IP destination. In servers that do not act as IP Gateways, this rate includes only packets that were source routed through this entity, where the source-route option processing was successful.
Datagrams Received Delivered/sec
Rate at which input datagrams are successfully delivered to IP user-protocols (including ICMP).
Datagrams/sec Rate at which IP datagrams are received from or sent to the interfaces including those in error. Any forwarded datagrams are not included in this rate.
Table D-1. Performance Counters, Grouped by Object (Continued)
Performance Object Performance Metric Description
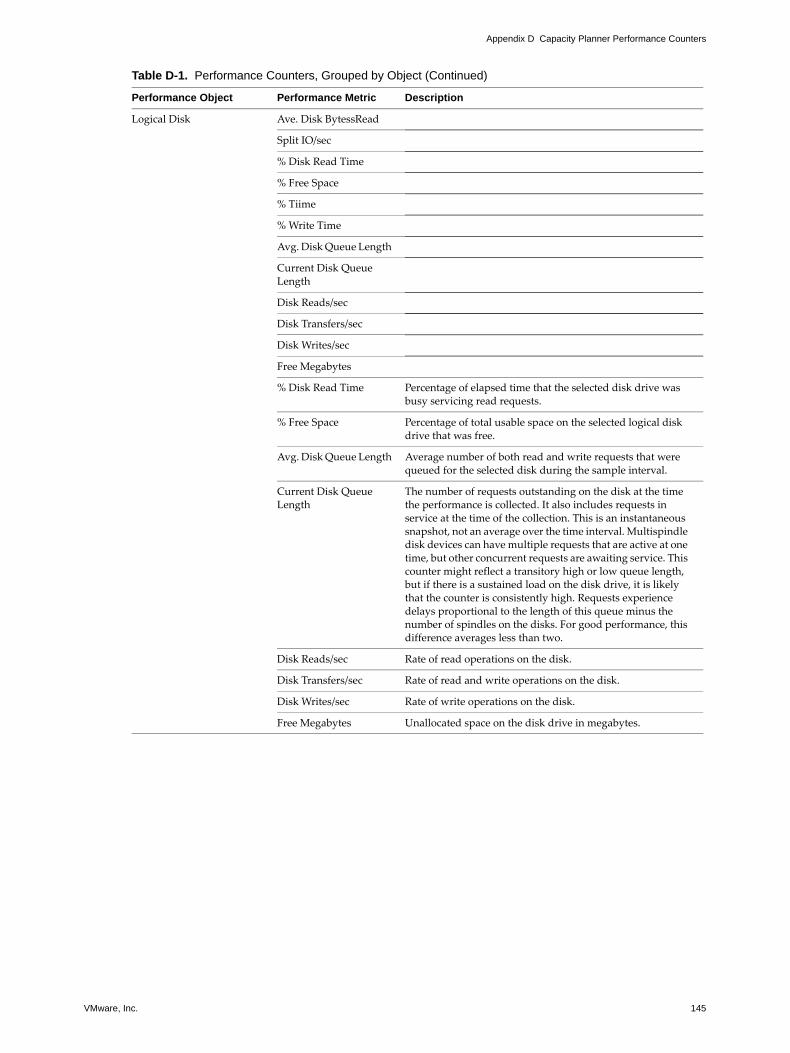
VMware, Inc. 145
Appendix D Capacity Planner Performance Counters
Logical Disk Ave. Disk BytessRead
Split IO/sec
% Disk Read Time
% Free Space
% Tiime
% Write Time
Avg. Disk Queue Length
Current Disk Queue Length
Disk Reads/sec
Disk Transfers/sec
Disk Writes/sec
Free Megabytes
% Disk Read Time Percentage of elapsed time that the selected disk drive was busy servicing read requests.
% Free Space Percentage of total usable space on the selected logical disk drive that was free.
Avg. Disk Queue Length Average number of both read and write requests that were queued for the selected disk during the sample interval.
Current Disk Queue Length
The number of requests outstanding on the disk at the time the performance is collected. It also includes requests in service at the time of the collection. This is an instantaneous snapshot, not an average over the time interval. Multispindle disk devices can have multiple requests that are active at one time, but other concurrent requests are awaiting service. This counter might reflect a transitory high or low queue length, but if there is a sustained load on the disk drive, it is likely that the counter is consistently high. Requests experience delays proportional to the length of this queue minus the number of spindles on the disks. For good performance, this difference averages less than two.
Disk Reads/sec Rate of read operations on the disk.
Disk Transfers/sec Rate of read and write operations on the disk.
Disk Writes/sec Rate of write operations on the disk.
Free Megabytes Unallocated space on the disk drive in megabytes.
Table D-1. Performance Counters, Grouped by Object (Continued)
Performance Object Performance Metric Description

Data Collection Guide
146 VMware, Inc.
Lotus Notes Statistics Database cache - database hit rate
Statistics Database cache - note cache hit rate
Statistics Database cache - session count
Statistics Database cache - user count
Statistics Database command total
Statistics Database config active threads max
Statistics Database buffer pool maximum megabytes
Statistics Database buffer pool percent reads in buffer
Statistics Database Dbcache hits
Statistics Database Dbcache lookups
Statistics Domino requests per 1 hour total
Statistics Domino requests per 1 minute total
Statistics Domino requests per 5 minute total
Statistics Mail average delivery time
Statistics Mail average server hops
Statistics Mail database cache hits
Statistics Mail database cache reads
Statistics Mail peak byte delivery rate
Statistics Mail peak byte transfer rate
Statistics Mail peak message delivery rate
Statistics Mail peak message transfer rate
Statistics Memory allocated
Statistics Memory free
Statistics Server CPU count
Statistics Server mailboxes
Statistics Server Transfers per minute
Statistics Server users 1 minute peak
Memory % Committed Bytes In Use
Ratio of Memory: Committed Bytes to Memory: Commit Limit. Committed memory is physical memory in use for which space is reserved in the paging file in case it needs to be written to disk.The size of the paging file determines the commit limit. If the paging file is enlarged, the commit limit increases and the ratio is reduced. Note: This counter displays the current percentage value only; it is not an average.
Table D-1. Performance Counters, Grouped by Object (Continued)
Performance Object Performance Metric Description
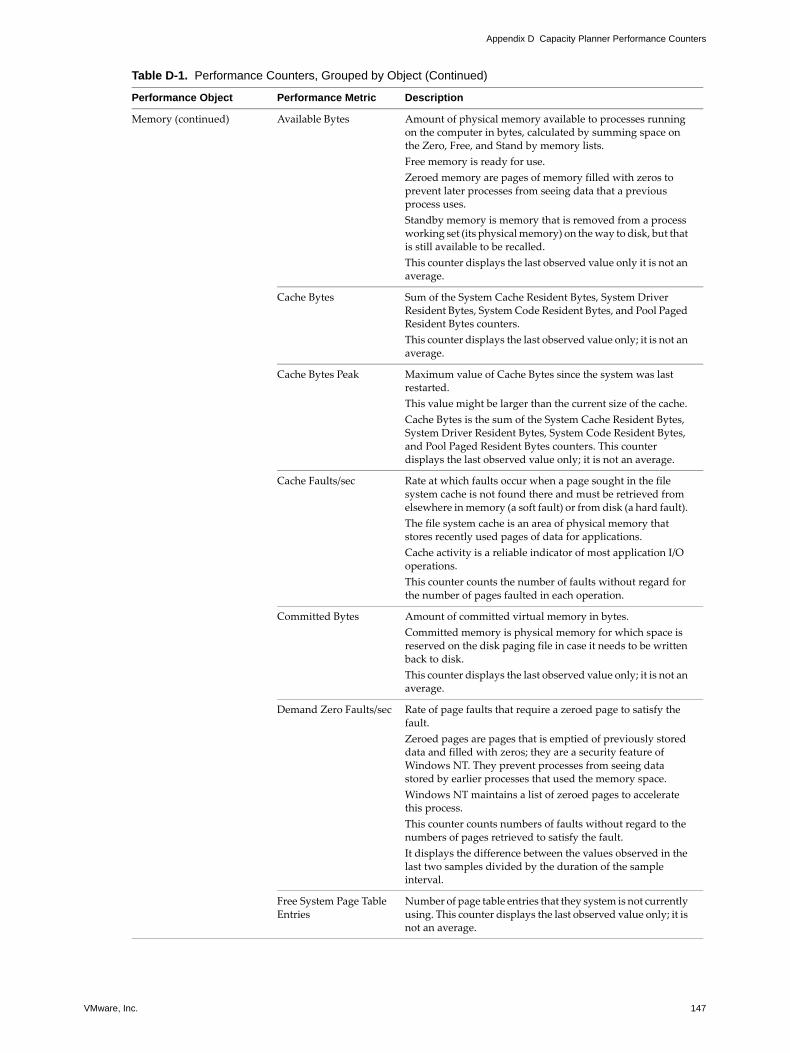
VMware, Inc. 147
Appendix D Capacity Planner Performance Counters
Memory (continued) Available Bytes Amount of physical memory available to processes running on the computer in bytes, calculated by summing space on the Zero, Free, and Stand by memory lists. Free memory is ready for use. Zeroed memory are pages of memory filled with zeros to prevent later processes from seeing data that a previous process uses. Standby memory is memory that is removed from a process working set (its physical memory) on the way to disk, but that is still available to be recalled. This counter displays the last observed value only it is not an average.
Cache Bytes Sum of the System Cache Resident Bytes, System Driver Resident Bytes, System Code Resident Bytes, and Pool Paged Resident Bytes counters. This counter displays the last observed value only; it is not an average.
Cache Bytes Peak Maximum value of Cache Bytes since the system was last restarted. This value might be larger than the current size of the cache. Cache Bytes is the sum of the System Cache Resident Bytes, System Driver Resident Bytes, System Code Resident Bytes, and Pool Paged Resident Bytes counters. This counter displays the last observed value only; it is not an average.
Cache Faults/sec Rate at which faults occur when a page sought in the file system cache is not found there and must be retrieved from elsewhere in memory (a soft fault) or from disk (a hard fault). The file system cache is an area of physical memory that stores recently used pages of data for applications. Cache activity is a reliable indicator of most application I/O operations. This counter counts the number of faults without regard for the number of pages faulted in each operation.
Committed Bytes Amount of committed virtual memory in bytes. Committed memory is physical memory for which space is reserved on the disk paging file in case it needs to be written back to disk. This counter displays the last observed value only; it is not an average.
Demand Zero Faults/sec Rate of page faults that require a zeroed page to satisfy the fault. Zeroed pages are pages that is emptied of previously stored data and filled with zeros; they are a security feature of Windows NT. They prevent processes from seeing data stored by earlier processes that used the memory space. Windows NT maintains a list of zeroed pages to accelerate this process. This counter counts numbers of faults without regard to the numbers of pages retrieved to satisfy the fault. It displays the difference between the values observed in the last two samples divided by the duration of the sample interval.
Free System Page Table Entries
Number of page table entries that they system is not currently using. This counter displays the last observed value only; it is not an average.
Table D-1. Performance Counters, Grouped by Object (Continued)
Performance Object Performance Metric Description

Data Collection Guide
148 VMware, Inc.
Memory (continued) Page Faults/sec Overall rate at which the processor handles faulted pages measured in numbers of pages faulted per second. A page fault occurs when a process requires code or data that is not in its working set (its space in physical memory). This counter:
Includes hard faults (those that require disk access) and soft faults (where the faulted page is found elsewhere in physical memory). Displays the difference between the values observed in the last two samples divided by the duration of the sample interval.
Most processors can handle large numbers of soft faults without consequence. However, hard faults can cause significant delays.
Page Faults/sec Rate at which pages are read from or written to disk to resolve hard page faults. Hard page faults occur when a process requires code or data that is not in its working set or elsewhere in physical memory and must be retrieved from disk.This counter is:
A primary indicator of the kinds of faults that cause system-wide delays. The sum of Memory: Pages Input/sec and Memory: Pages Output/sec. Counted in numbers of pages so it can be compared to other counts of pages such as Memory: Page Faults/sec without conversion. Includes pages retrieved to satisfy faults in the file system cache usually requested by application’s non-cached mapped memory files. Displays the difference between the values observed in the last two samples divided by the duration of the sample interval.
Pages Output/sec
Pool Nonpaged Allocs Number of calls to allocate space in the nonpaged pool. The nonpaged pool is an area of system memory area for objects that cannot be written to disk and must remain in physical memory as long as they are allocated. It is measured in numbers of calls to allocate space regardless of the amount of space allocated in each call. This counter displays the last observed value only; it is not an average.
Pool Nonpaged Bytes Number of bytes in the nonpaged pool an area of system memory (physical memory that the operating system uses) for objects that cannot be written to disk but must remain in physical memory as long as they are allocated. This counter is calculated differently than Process: Pool Nonpaged Bytes, so it might not equal Process: Pool Nonpaged Bytes:_Total. This counter displays the last observed value only; it is not an average.
Table D-1. Performance Counters, Grouped by Object (Continued)
Performance Object Performance Metric Description
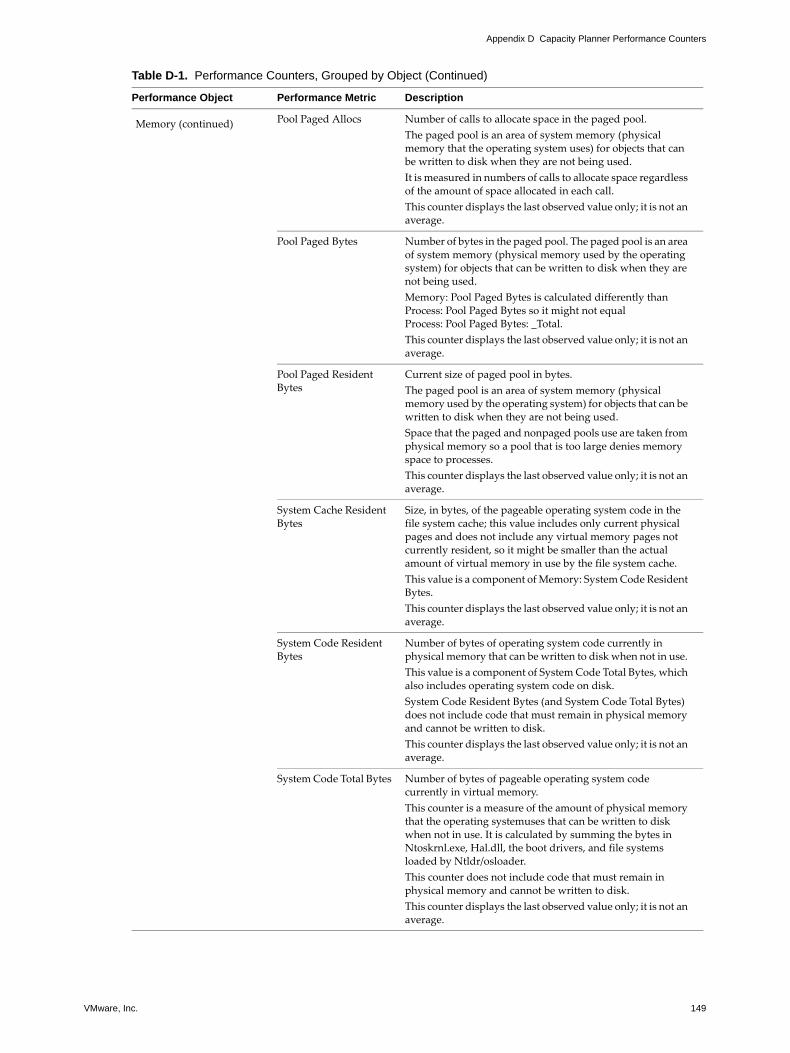
VMware, Inc. 149
Appendix D Capacity Planner Performance Counters
Memory (continued) Pool Paged Allocs Number of calls to allocate space in the paged pool. The paged pool is an area of system memory (physical memory that the operating system uses) for objects that can be written to disk when they are not being used. It is measured in numbers of calls to allocate space regardless of the amount of space allocated in each call. This counter displays the last observed value only; it is not an average.
Pool Paged Bytes Number of bytes in the paged pool. The paged pool is an area of system memory (physical memory used by the operating system) for objects that can be written to disk when they are not being used. Memory: Pool Paged Bytes is calculated differently than Process: Pool Paged Bytes so it might not equal Process: Pool Paged Bytes: _Total. This counter displays the last observed value only; it is not an average.
Pool Paged Resident Bytes
Current size of paged pool in bytes. The paged pool is an area of system memory (physical memory used by the operating system) for objects that can be written to disk when they are not being used. Space that the paged and nonpaged pools use are taken from physical memory so a pool that is too large denies memory space to processes. This counter displays the last observed value only; it is not an average.
System Cache Resident Bytes
Size, in bytes, of the pageable operating system code in the file system cache; this value includes only current physical pages and does not include any virtual memory pages not currently resident, so it might be smaller than the actual amount of virtual memory in use by the file system cache. This value is a component of Memory: System Code Resident Bytes. This counter displays the last observed value only; it is not an average.
System Code Resident Bytes
Number of bytes of operating system code currently in physical memory that can be written to disk when not in use. This value is a component of System Code Total Bytes, which also includes operating system code on disk. System Code Resident Bytes (and System Code Total Bytes) does not include code that must remain in physical memory and cannot be written to disk. This counter displays the last observed value only; it is not an average.
System Code Total Bytes Number of bytes of pageable operating system code currently in virtual memory. This counter is a measure of the amount of physical memory that the operating systemuses that can be written to disk when not in use. It is calculated by summing the bytes in Ntoskrnl.exe, Hal.dll, the boot drivers, and file systems loaded by Ntldr/osloader. This counter does not include code that must remain in physical memory and cannot be written to disk. This counter displays the last observed value only; it is not an average.
Table D-1. Performance Counters, Grouped by Object (Continued)
Performance Object Performance Metric Description

Data Collection Guide
150 VMware, Inc.
Memory (continued) System Driver Resident Bytes
Number of bytes of pageable physical memory being used by device drivers; it is the working set (physical memory area) of the drivers. This value is a component of Memory: System Driver Total Bytes which also includes driver memory that has been written to disk. Neither System Driver Resident Bytes nor System Driver Total Bytes includes memory that cannot be written to disk.
System Driver Total Bytes
Number of bytes of pageable virtual memory currently being used by device drivers. (Pageable memory can be written to disk when it is not being used). It includes physical memory (Memory: System Driver Resident Bytes) and code and data paged to disk. It is a component of Memory: System Code Total Bytes. This counter displays the last observed value only; it is not an average.
Transition Faults/sec Rate at which page faults are resolved by recovering pages that were being used by another process sharing the same page, or were on the modified page list or the standby list, or were being written to disk at the time of the page fault. The pages were recovered without additional disk activity. Transition faults are counted in numbers of faults without regard for the number of pages faulted in each operation. This counter displays the difference between the values observed in the last two samples divided by the duration of the sample interval.
MSExchange Internet Protocol
Bytes Received/sec Number of bytes the server received from the network.
Bytes Sent/sec Rate at which bytes are sent on the interface, including framing characters.
Incoming Queue Length Indicates the length of the Incoming packet queue.
Outgoing Queue Length Indicates the length of the output packet queue.
Peak Connections Maximum number of users connected at one time.
MSExchangeDS AB Reads/sec Rate at which users perform read operations on the Address Book
ExDS Reads/sec Rate at which Extended Directory Service clients (the information store, MTA, system attendant, and Administrator program) perform read operations on the directory.
Incoming Inter-Site Replication Updates/sec
Replication Updates/sec Rate of directory replication activity on this server.
Table D-1. Performance Counters, Grouped by Object (Continued)
Performance Object Performance Metric Description

VMware, Inc. 151
Appendix D Capacity Planner Performance Counters
MSExchangeIS Active Connection Count
Indicates the number of connections to the Exchange store that have shown activity in the last 10 minutes.
Active User Count Indicates the number of user connections that have shown activity in the last 10 minutes.
Database Session Hit Rate
Rate of cache hits for database sessions.
Push Notifications Generated/sec
Rate of Push Notifications to another server.
Read Bytes RPC Clients/sec
Indicates read byte rate of RPC Clients.
RPC Operations/sec Indicates the rate that RPC operations occur. This counter tells you how many RPC requests are outstanding. If Outlook is prompting users it is likely that this counter shows significant spikes.
RPC Packets/sec Indicates the rate of RPC packets are processed.
Write Bytes RPC Clients/sec
Indicates write byte rate of RPC Clients.
MSExchangeIS Private Receive Queue Size Number of messages in the mailbox store's receive queue.
Send Queue Size Number of messages in the mailbox store's send queue.
MSExchangeIS Public Message Recipients Delivered/min
Rate at which recipients are receiving messages.
Messages Delivered/min
Rate at which messages are delivered to mailboxes.
Messages Sent/min Rate of messages sent to store providers.
Receive Queue Size Number of messages in the public store's receive queue.
Replication Messages Received
Number of directory synchronization messages received from other Exchange servers.
Replication Messages Sent
Number of directory synchronization messages sent to other Exchange servers.
Replication Receive Queue Size
Number of replication messages waiting to be processed.
Send Queue Size Number of messages in the public store's send queue.
Total Size of Recoverable Items
Size of the recoverable items for the specified objects.
MSExchangeMTA LAN Receive Bytes/sec Rate at which bytes are received over a LAN from MTAs.
LAN Transmit Bytes/sec Rate at which bytes are transmitted over a LAN to MTAs.
Message Bytes/sec Rate at which message bytes are processed.
Messages/sec Count of messages per second that the MTA is processing inbound and outbound.
Work Queue Length Queue length for the whole of the MTA. It covers both inbound and outbound messages for the Information Store, the Directory and any connectors that route through the MTA.
XAPI Receive Bytes/sec Rate at which bytes are received over a XAPI connection.
XAPI Transmit Bytes/sec Rate at which bytes are transmitted over a XAPI connection.
Network Interface Bytes Received/sec
Bytes Sent/sec
Table D-1. Performance Counters, Grouped by Object (Continued)
Performance Object Performance Metric Description

Data Collection Guide
152 VMware, Inc.
Objects Events
Mutexes
Sections
Semaphores
Processes Number of processes in the computer at the time of data collection. Each process represents the running of a program.This is an instantaneous count, not an average over the time interval.
Threads Number of threads in the computer at the time of data collection. A thread is the basic executable entity that can execute instructions in a processor.This is an instantaneous count, not an average over the time interval.
Paging File % Usage Percentage of the Page File instance in use. See also Process: Page File Bytes.
% Usage Peak Peak usage of the Page File instance. See also Process: Page File Bytes Peak.
Table D-1. Performance Counters, Grouped by Object (Continued)
Performance Object Performance Metric Description
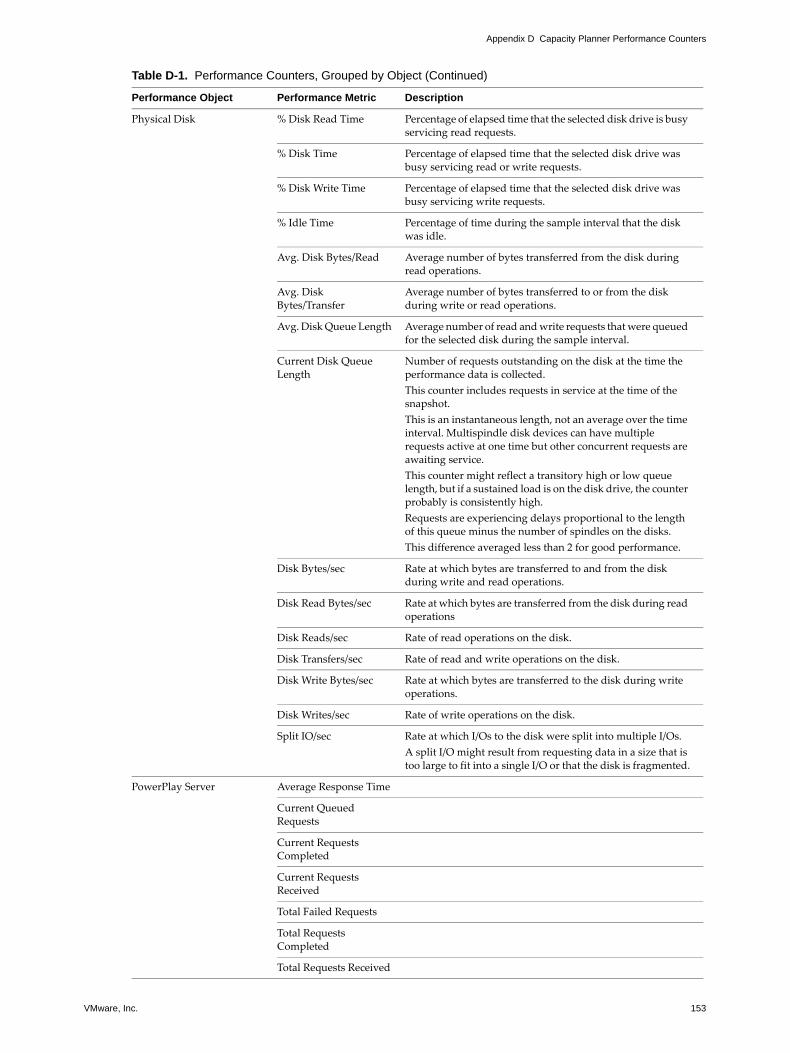
VMware, Inc. 153
Appendix D Capacity Planner Performance Counters
Physical Disk % Disk Read Time Percentage of elapsed time that the selected disk drive is busy servicing read requests.
% Disk Time Percentage of elapsed time that the selected disk drive was busy servicing read or write requests.
% Disk Write Time Percentage of elapsed time that the selected disk drive was busy servicing write requests.
% Idle Time Percentage of time during the sample interval that the disk was idle.
Avg. Disk Bytes/Read Average number of bytes transferred from the disk during read operations.
Avg. Disk Bytes/Transfer
Average number of bytes transferred to or from the disk during write or read operations.
Avg. Disk Queue Length Average number of read and write requests that were queued for the selected disk during the sample interval.
Current Disk Queue Length
Number of requests outstanding on the disk at the time the performance data is collected. This counter includes requests in service at the time of the snapshot. This is an instantaneous length, not an average over the time interval. Multispindle disk devices can have multiple requests active at one time but other concurrent requests are awaiting service. This counter might reflect a transitory high or low queue length, but if a sustained load is on the disk drive, the counter probably is consistently high. Requests are experiencing delays proportional to the length of this queue minus the number of spindles on the disks. This difference averaged less than 2 for good performance.
Disk Bytes/sec Rate at which bytes are transferred to and from the disk during write and read operations.
Disk Read Bytes/sec Rate at which bytes are transferred from the disk during read operations
Disk Reads/sec Rate of read operations on the disk.
Disk Transfers/sec Rate of read and write operations on the disk.
Disk Write Bytes/sec Rate at which bytes are transferred to the disk during write operations.
Disk Writes/sec Rate of write operations on the disk.
Split IO/sec Rate at which I/Os to the disk were split into multiple I/Os. A split I/O might result from requesting data in a size that is too large to fit into a single I/O or that the disk is fragmented.
PowerPlay Server Average Response Time
Current Queued Requests
Current Requests Completed
Current Requests Received
Total Failed Requests
Total Requests Completed
Total Requests Received
Table D-1. Performance Counters, Grouped by Object (Continued)
Performance Object Performance Metric Description
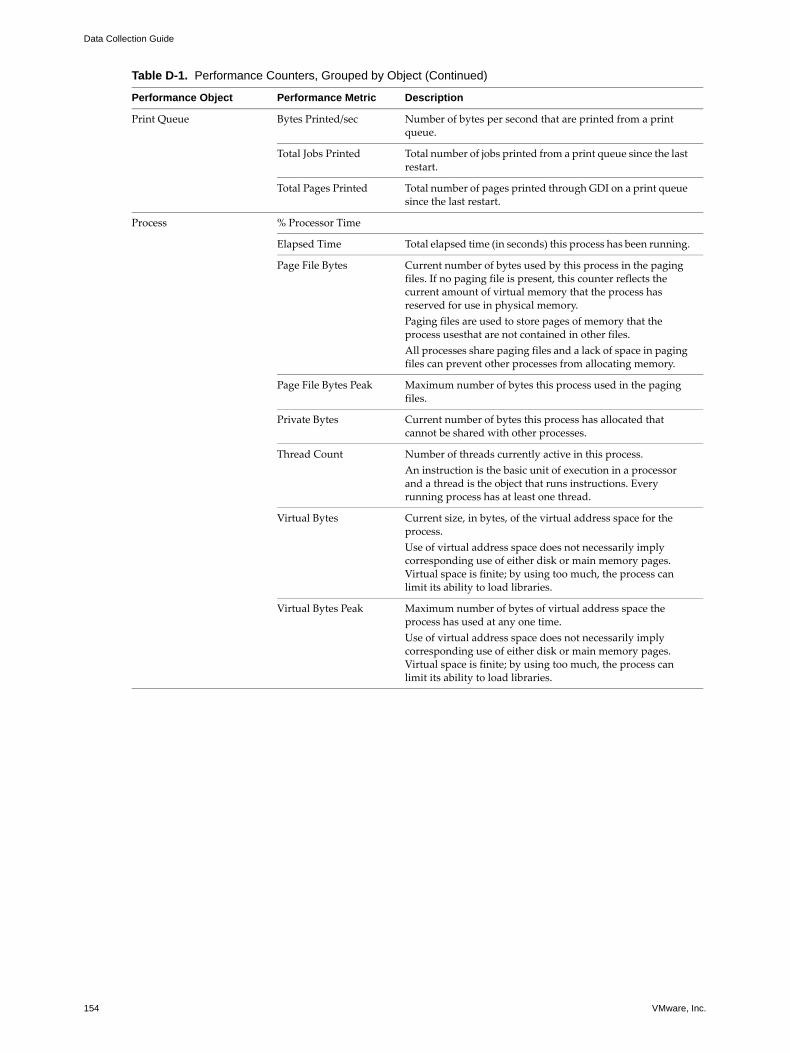
Data Collection Guide
154 VMware, Inc.
Print Queue Bytes Printed/sec Number of bytes per second that are printed from a print queue.
Total Jobs Printed Total number of jobs printed from a print queue since the last restart.
Total Pages Printed Total number of pages printed through GDI on a print queue since the last restart.
Process % Processor Time
Elapsed Time Total elapsed time (in seconds) this process has been running.
Page File Bytes Current number of bytes used by this process in the paging files. If no paging file is present, this counter reflects the current amount of virtual memory that the process has reserved for use in physical memory.Paging files are used to store pages of memory that the process usesthat are not contained in other files. All processes share paging files and a lack of space in paging files can prevent other processes from allocating memory.
Page File Bytes Peak Maximum number of bytes this process used in the paging files.
Private Bytes Current number of bytes this process has allocated that cannot be shared with other processes.
Thread Count Number of threads currently active in this process. An instruction is the basic unit of execution in a processor and a thread is the object that runs instructions. Every running process has at least one thread.
Virtual Bytes Current size, in bytes, of the virtual address space for the process. Use of virtual address space does not necessarily imply corresponding use of either disk or main memory pages. Virtual space is finite; by using too much, the process can limit its ability to load libraries.
Virtual Bytes Peak Maximum number of bytes of virtual address space the process has used at any one time. Use of virtual address space does not necessarily imply corresponding use of either disk or main memory pages. Virtual space is finite; by using too much, the process can limit its ability to load libraries.
Table D-1. Performance Counters, Grouped by Object (Continued)
Performance Object Performance Metric Description

VMware, Inc. 155
Appendix D Capacity Planner Performance Counters
Processor % DPC Time Percentage of time that the processor spent receiving and servicing deferred procedure calls (DPCs) during the sample interval. DPCs are interrupts that run at a lower priority than standard interrupts.% DPC Time is a component of % Privileged Time because DPCs are executed in privileged mode. They are counted separately and are not a component of the interrupt counters. This counter displays the average busy time as a percentage of the sample time.
% Interrupt Time The percentage of time the processor spent receiving and servicing hardware interrupts during the sample interval. This value is an indirect indicator of the activity of devices that generate interrupts such as the system clock, the mouse, disk drivers, data communication lines, network interface cards and other peripheral devices. These devices normally interrupt the processor when they have completed a task or require attention. Normal thread execution is suspended during interrupts. Most system clocks interrupt the processor every 10 ms creating a background of interrupt activity. This counter displays the average busy time as a percentage of the sample time.
% Processor Time Percentage of time that the processor is executing a non-Idle thread. This counter was designed as a primary indicator of processor activity. It is calculated by measuring the time that the processor spends executing the thread of the Idle process in each sample interval and subtracting that value from 100%. Each processor has an Idle thread that consumes cycles when no other threads are ready to run. It can be viewed as the percentage of the sample interval spent doing useful work. This counter displays the average percentage of busy time observed during the sample interval. It is calculated by monitoring the time the service was inactive and subtracting that value from 100%.
Table D-1. Performance Counters, Grouped by Object (Continued)
Performance Object Performance Metric Description

Data Collection Guide
156 VMware, Inc.
Processor %DPC Time
% Interrupt Time
% Priveleged Time
% Processor Time
% User Time
APC Bypasses/sec Rate at which Kernel APC interrupts were avoided. APC Bypasses/sec is the rate at which kernel APC interrupts were short-circuited. This counter displays the difference between the values observed in the last two samples divided by the duration of the sample interval.
DPC Bypasses/sec Rate at which DPCs on all processors were avoided. DPCs are interrupts that run at a lower priority than standard interrupts.This counter displays the difference between the values observed in the last two samples divided by the duration of the sample interval.
DPC Rate Rate at which DPCs are added to the processor's DPC queue between the timer ticks of the processor clock. DPCs are interrupts that run at a lower priority than standard interrupts. Each processor has its own DPC queue. This counter:Measures the rate at which DPCs are added to the queue not the number of DPCs in the queue. Displays the last observed value only; it is not an average.
DPCs Queued/sec Overall rate at which DPCs are added to the processor's DPC queue. DPCs are interrupts that run at a lower priority than standard interrupts. Each processor has its own DPC queue. This counter:Measures the rate at which DPCs are added to the queue not the number of DPCs in the queue. Displays the difference between the values observed in the last two samples divided by the duration of the sample interval.
Interrupts/sec Average number of hardware interrupts the processor is receiving and servicing in each second. It does not include DPCs which are counted separately. This value is an indirect indicator of the activity of devices that generate interrupts such as the system clock, the mouse, disk drivers, data communication lines, network interface cards and other peripheral devices. These devices normally interrupt the processor when they have completed a task or require attention. Normal thread execution is suspended during interrupts. Most system clocks interrupt the processor every 10 ms creating a background of interrupt activity. This counter displays the difference between the values observed in the last two samples divided by the duration of the sample interval.
Table D-1. Performance Counters, Grouped by Object (Continued)
Performance Object Performance Metric Description

VMware, Inc. 157
Appendix D Capacity Planner Performance Counters
Redirector Bytes Total/sec Rate at which the Redirector is processing data bytes. This includes all application and file data in addition to protocol information such as packet headers.
Read Bytes Cache/sec Rate at which applications are accessing the file system cache by using the Redirector. Some of these data requests are satisfied by retrieving the data from the cache. Requests that miss the Cache cause a page fault (see Read Bytes Paging/sec).
Read Bytes Paging/sec Rate at which the Redirector is attempting to read bytes in response to page faults. Page faults are caused by loading modules (such as programs and libraries) by a miss in the Cache (see Read Bytes Cache/sec) or by files directly mapped into the address space of applications (a high-performance feature of Windows NT).
Write Bytes Cache/sec Rate at which applications on your computer are writing to the file system cache by using the Redirector. The data might not leave your computer immediately; it can be retained in the cache for further modification before being written to the network. This saves network traffic. Each write of a byte into the cache is counted here.
Write Bytes Paging/sec Rate at which the Redirector is attempting to write bytes changed in the pages being used by applications. The program data changed by modules (such as programs and libraries) that were loaded over the network are paged out when no longer needed. Other output pages come from the file system cache (see Write Bytes Cache/sec).
Server Bytes Received/sec Number of bytes that the server has sent to and received from the network. This value provides an overall indication of how busy the server is.
Bytes Total/sec Number of bytes that the server has sent to and received from the network. This value provides an overall indication of how busy the server is.
Bytes Transmitted/sec Number of bytes that the server has sent on the network.This value provides an overall indication of how busy the server is.
Pool Nonpaged Failures Number of times that allocations from nonpaged pool have failed. Indicates that the computers physical memory is too small.
Pool Paged Failures Number of times that allocations from paged pool have failed. Indicates that the computers physical memory or paging file are too small.
Server Sessions Number of sessions currently active in the server. Indicates current server activity.
Sessions Errored Out Number of sessions that were closed because unexpected error conditions or sessions that reached the auto-disconnect timeout and were disconnected normally.
Server (continued) Sessions Timed Out Number of sessions that were closed because idle time exceeding the AutoDisconnect parameter for the server. Shows whether the AutoDisconnect setting is helping to conserve resources.
Table D-1. Performance Counters, Grouped by Object (Continued)
Performance Object Performance Metric Description

Data Collection Guide
158 VMware, Inc.
Server Work Queue Queue Length Current length of the server work queue for this CPU. A sustained queue length > 4 might indicate processor congestion. This is an instantaneous count not an average over time.
SQL Server:Access Methods Full Scans/sec Number of unrestricted full scans. These can either be base table or full index scans.
Index Searches/sec Number of index searches. Index searches are used to start range scans, single index record fetches, and to reposition within an index.
Page Splits/sec Number of page splits occurring as the result of index pages overflowing.
Table lock escalations/sec
Number of locks escalated per second
SQL Server:Buffer Manager Buffer Cache Hit Ratio Percentage of pages found in the buffer pool, thus saving a read from disk.
Free Pages Number of pages on all Free Lists.
Procedure Cache Pages Number of pages used to store compiled queries.
Readahead Pages/sec When the SQL Server detects sequential access of data or index pages it reads pages ahead in anticipation of a read request. Instead of reading one 8k page at a time, SQL reads 64k of pages with a single request. This improves the execution time of the process performing the sequential scan. These pages do become resident in the Buffer Cache.
SQL Server:Cache Manager Cache Pages
SQL Server:Databases Data File(s) Size (KB) Cumulative size of all the data files in the database.
Log File(s) Size (KB) Cumulative size of all the data files in the database.
Transactions/sec Number of transactions started for the database.
SQL Server:Locks Average wait time (ms) The average amount of wait time (milliseconds) for each lock request that resulted in a wait.
Number of deadlocks/sec
Number of lock requests that resulted in a deadlock.
SQL Server:Memory Manager
Connection Memory (KB)
Total amount of dynamic memory the server is using for maintaining connections
Granted Workspace Memory (KB)
Total amount of memory granted to executing processes. This memory is used for hash sort and create index operations.
Lock Memory (KB) Total amount of dynamic memory the server is using for locks.
Optimize Memory
SQL Cache memory (KB)
Total amount of dynamic memory the server is using for the dynamic SQL cache.
Target Server Memory (KB)
Total amount of dynamic memory the server is willing to consume.
Total Server Memory (KB)
Total amount of dynamic memory the server is currently consuming
Table D-1. Performance Counters, Grouped by Object (Continued)
Performance Object Performance Metric Description

VMware, Inc. 159
Appendix D Capacity Planner Performance Counters
SQL Server:Replication Merge
Conflicts/sec
Downloaded Changes/sec
Uploaded Changes/sec
System % Total Interrupt Time
% Total Processor Time
Active Session
Context Switches/sec Combined rate at which all processors on the computer are switched from one thread to another.Context switches occur when a running thread voluntarily relinquishes the processor for one of the following reasons:It is preempted by a higher-priority ready thread.It switches between user-mode and privileged (kernel) mode to use an Executive or subsystem service. This counter is the sum of Thread: Context Switches/sec for all threads running on all processors in the computer and is measured in numbers of switches. Context switch counters are on the System and Thread objects. This counter displays the difference between the values observed in the last two samples divided by the duration of the sample interval.
Inactive Session
Processes Number of processes in the computer at the time of data collection. This is an instantaneous count, not an average over the time interval. Each process represents the running of a program.
Processor Queue Length Number of threads in the processor queue. Processor time has a single queue even on computers with multiple processors. Unlike the disk counters, this counter counts ready threads only, not threads that are running. A sustained processor queue of less than 10 threads per processor is normally acceptable. This counter displays the last observed value only; it is not an average.
System Up Time Elapsed time (in seconds) that the computer was running since it was last started. This counter displays the difference between the start time and the current time.
Threads Number of threads in the computer at the time of data collection. A thread is the basic executable entity that can execute instructions in a processor.This is an instantaneous count, not an average over the time interval.
Terminal Services Active Sessions Number of active Terminal Services sessions.
Inactive Sessions Number of inactive Terminal Services sessions.
Table D-1. Performance Counters, Grouped by Object (Continued)
Performance Object Performance Metric Description
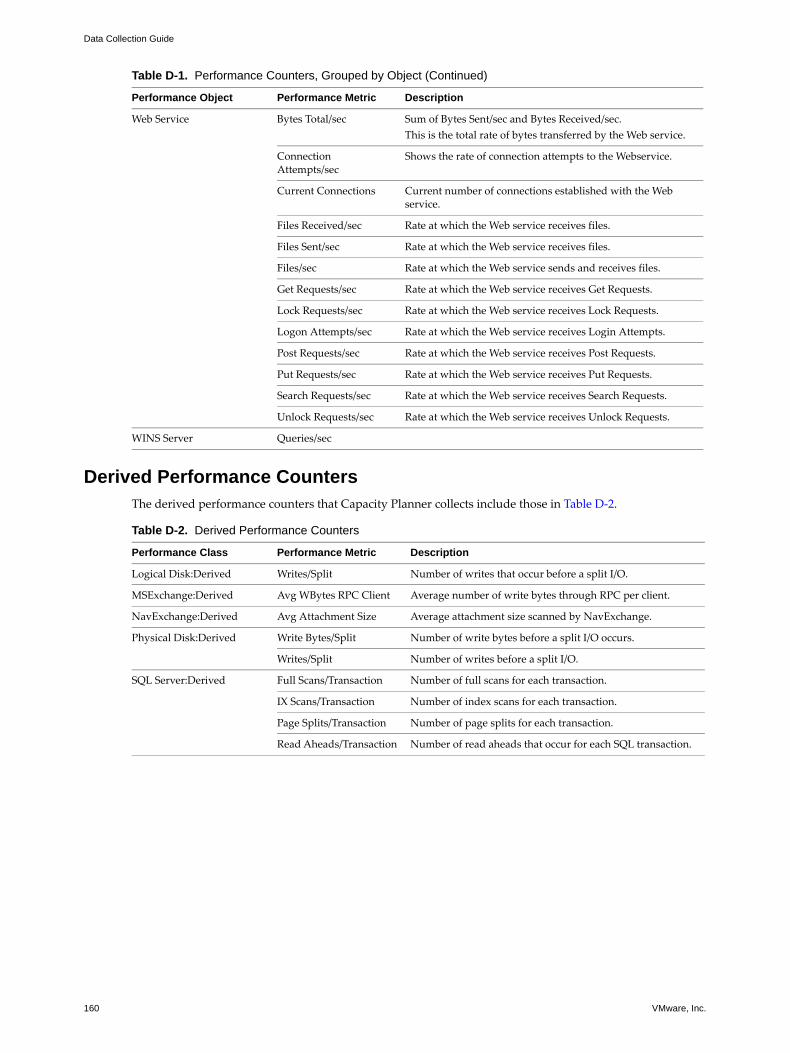
Data Collection Guide
160 VMware, Inc.
Derived Performance CountersThe derived performance counters that Capacity Planner collects include those in Table D-2.
Web Service Bytes Total/sec Sum of Bytes Sent/sec and Bytes Received/sec. This is the total rate of bytes transferred by the Web service.
Connection Attempts/sec
Shows the rate of connection attempts to the Webservice.
Current Connections Current number of connections established with the Web service.
Files Received/sec Rate at which the Web service receives files.
Files Sent/sec Rate at which the Web service receives files.
Files/sec Rate at which the Web service sends and receives files.
Get Requests/sec Rate at which the Web service receives Get Requests.
Lock Requests/sec Rate at which the Web service receives Lock Requests.
Logon Attempts/sec Rate at which the Web service receives Login Attempts.
Post Requests/sec Rate at which the Web service receives Post Requests.
Put Requests/sec Rate at which the Web service receives Put Requests.
Search Requests/sec Rate at which the Web service receives Search Requests.
Unlock Requests/sec Rate at which the Web service receives Unlock Requests.
WINS Server Queries/sec
Table D-1. Performance Counters, Grouped by Object (Continued)
Performance Object Performance Metric Description
Table D-2. Derived Performance Counters
Performance Class Performance Metric Description
Logical Disk:Derived Writes/Split Number of writes that occur before a split I/O.
MSExchange:Derived Avg WBytes RPC Client Average number of write bytes through RPC per client.
NavExchange:Derived Avg Attachment Size Average attachment size scanned by NavExchange.
Physical Disk:Derived Write Bytes/Split Number of write bytes before a split I/O occurs.
Writes/Split Number of writes before a split I/O.
SQL Server:Derived Full Scans/Transaction Number of full scans for each transaction.
IX Scans/Transaction Number of index scans for each transaction.
Page Splits/Transaction Number of page splits for each transaction.
Read Aheads/Transaction Number of read aheads that occur for each SQL transaction.

VMware, Inc. 161
E.
The following topics are described in this appendix:
“Inventory Utilities” on page 161
“Performance Utilities” on page 162
“Commands Used for Linux and UNIX Inventory Collection” on page 163
“Monitoring Tools” on page 163
“Import Classes” on page 165
The list of commands, utilities, and tools in this section is not an exhaustive list of all that might be in use. This information is included as a convenience to assist you in working with Capacity Planner.
Inventory UtilitiesThis section lists many of the utilities the collector uses to collect UNIX and Linux inventory data.
Linux and UNIX Tools and Utilities E
Table E-1. Inventory Utilities Grouped by Information Type
Information Type Operating System Utilities and Files
System HP-UX getconf, cstm, uname, /stand/bootconf, /etc/resolv.conf
Linux, Solaris, VMware uname, /etc/resolv.conf
Application HP-UX, PA-RISC swlist
Linux, VMware rpm
Solaris pkginfo
Chassis HP-UX getconf, ioscan
Linux, VMware dmesg
Solaris prtdiag, psrinfo
CPU HP-UX machinfo, cstm, ioscan, adb, getconf
Linux /proc/cupinfo
Solaris psrinfo, prtpicl, prtdiag
VMware /proc/vmware/sched/ncpus, /proc/cpuinfo
Memory HP-UX getconf
Linux, VMware /proc/meminfo
Solaris prtconf
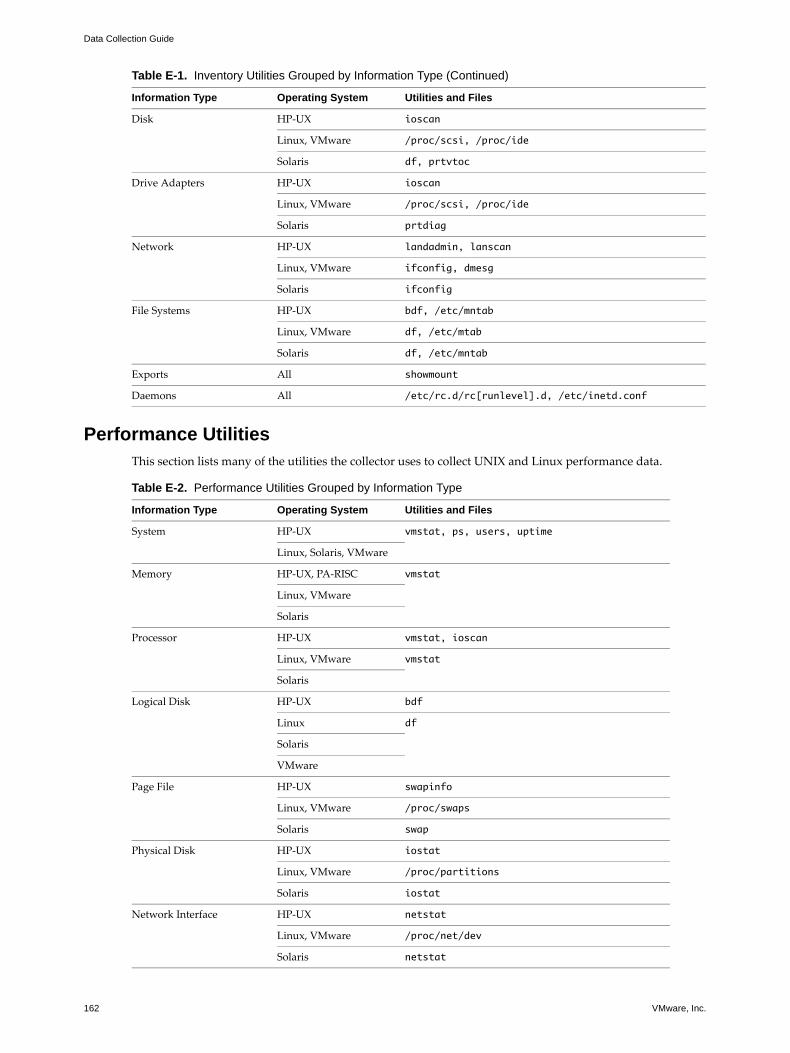
Data Collection Guide
162 VMware, Inc.
Performance UtilitiesThis section lists many of the utilities the collector uses to collect UNIX and Linux performance data.
Disk HP-UX ioscan
Linux, VMware /proc/scsi, /proc/ide
Solaris df, prtvtoc
Drive Adapters HP-UX ioscan
Linux, VMware /proc/scsi, /proc/ide
Solaris prtdiag
Network HP-UX landadmin, lanscan
Linux, VMware ifconfig, dmesg
Solaris ifconfig
File Systems HP-UX bdf, /etc/mntab
Linux, VMware df, /etc/mtab
Solaris df, /etc/mntab
Exports All showmount
Daemons All /etc/rc.d/rc[runlevel].d, /etc/inetd.conf
Table E-1. Inventory Utilities Grouped by Information Type (Continued)
Information Type Operating System Utilities and Files
Table E-2. Performance Utilities Grouped by Information Type
Information Type Operating System Utilities and Files
System HP-UX vmstat, ps, users, uptime
Linux, Solaris, VMware
Memory HP-UX, PA-RISC vmstat
Linux, VMware
Solaris
Processor HP-UX vmstat, ioscan
Linux, VMware vmstat
Solaris
Logical Disk HP-UX bdf
Linux df
Solaris
VMware
Page File HP-UX swapinfo
Linux, VMware /proc/swaps
Solaris swap
Physical Disk HP-UX iostat
Linux, VMware /proc/partitions
Solaris iostat
Network Interface HP-UX netstat
Linux, VMware /proc/net/dev
Solaris netstat

VMware, Inc. 163
Appendix E Linux and UNIX Tools and Utilities
Commands Used for Linux and UNIX Inventory CollectionThis section lists commands used in the scripts for successful collection of UNIX and Linux inventory data. For more information about each of these commands, see the corresponding manpage for the command.
Monitoring ToolsThis section lists tools that are used by the collector for collection of Linux performance data.
vmstat
Process HP-UX ps
Linux, VMware
Solaris
Table E-2. Performance Utilities Grouped by Information Type (Continued)
Information Type Operating System Utilities and Files
Table E-3. Other Commands
Utility Used for Linux? Used for Solaris? Used for HP-UX?
echo Yes Yes Yes
read Yes Yes Yes
let Yes Yes Yes
tr Yes Yes Yes
typeset Yes Yes Yes
wc Yes Yes Yes
sed Yes Yes Yes
grep Yes Yes Yes
set Yes Yes Yes
awk Yes Yes Yes
sort Yes Yes Yes
basename Yes No No
printf Yes No No
egrep Yes No No
cat Yes No No
sleep Yes No No
export Yes Yes Yes
cut Yes No No
bc Yes No No
unmask Yes Yes Yes
Table E-4. vmstat on Linux
Class Metric InstanceUsed for Consolidation
System Processor Queue Length N/A Yes
System Blocked Processes N/A No
System Swapped Runnable Processes N/A No
Memory Virtual Memory Used (DB) N/A No

Data Collection Guide
164 VMware, Inc.
proc/swaps
iostat
Memory Free List N/A No
Memory Available Bytes N/A Yes
Memory Used Buffer Memory (KB) N/A No
Memory Cache Bytes N/A Yes
Physical Disk Disk Blocks In/sec _Total No
Physical Disk Disk Bytes In/sec _Total No
Physical Disk Disk blocks Out/sec _Total No
Physical Disk Disk Bytes/Out sec _Total No
Physical Disk Disk Bytes/sec _Total Yes
Memory Pages N/A Yes
Processor Interrupts/sec _Total No
System Context Switches/sec N/A No
Processor % User Time _Total No
Processor % System Time _Total No
Processor % Idle Time _Total No
Processor % Processor Time _Total Yes
Table E-4. vmstat on Linux (Continued)
Class Metric InstanceUsed for Consolidation
Table E-5. proc/swaps on Linux
Class Metric InstanceUsed for Consolidation
Paging File Size Kbytes _Total No
Paging File Used Kbytes _Total No
Paging File Available Kbytes _Total No
Paging File % Usage _Total Yes
Table E-6. iostat on Linux
Class Metric InstanceUsed for Consolidation
Physical Disk Disk Total Read Sectors “Disk Name” No
Physical Disk Disk Total Write Sectors “Disk Name” No
Physical Disk Disk Total Reads Merges “Disk Name” No
Physical Disk Disk Total Write Merges “Disk Name” No
Physical Disk Disk Transfers/sec _Total Yes

VMware, Inc. 165
Appendix E Linux and UNIX Tools and Utilities
netstat
Import ClassesThis section lists import classes that the collector uses to collect UNIX and Linux performance data.
The import file appears as follows:
Import Class DetailsThe following tables provide details for each import class.
Table E-7. netstat on Linux
Class Metric InstanceUsed for Consolidation
Network Interface Packets Received/sec “NIC Name” No
Network Interface Packets Sent/sec “NIC Name” No
Network Interface Packets Total/sec “NIC Name” No
Network Interface Bytes Received/sec “NIC Name” No
Network Interface Bytes Sent/sec “NIC Name” No
Network Interface Bytes Total/sec “NIC Name” No
Table E-8. Import Classes
Tag Name Description
CONTROL Tells the import engine about the information that follows. It is required and must appear before any other classes of information. Will create a system record if it does not already exist.
APP Describes installed applications on the system.
OS Describes the operating system currently running on the target machine.
SYSTEM Describes how the system is configured. Most of the information can be considered environmental.
MOTHERBOARD Describes the chassis and motherboard that the system is built around.
GROUP Describes the groups of which the system is a member.
RAM Describes the physical memory installed in the system or the virtual memory allocated to a virtual system.
FILESYS Describes the found file systems currently defined on the system.
CPU Describes the processors installed in the system.
DRIVEADPT Describes the drive adapters installed in the system.
DISKINFO Describes the physical drives or RAID arrays installed in the system.
DAEMON Describes the defined init.d, rec.d, or Microsoft Windows services on the system.
NETWORK Describes the physical and virtual network interfaces on the system.
EXPORTS Describes the exported or shared directories on the system.
PERF Contains detailed performance data that was collected during a single collection run.
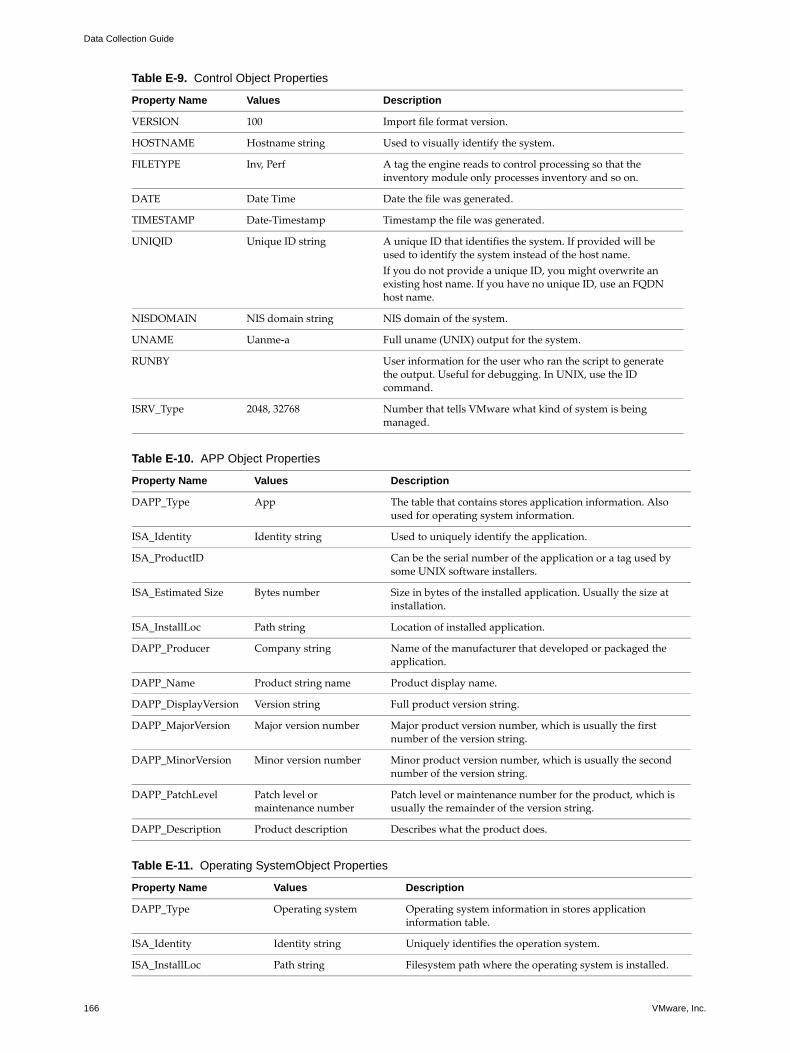
Data Collection Guide
166 VMware, Inc.
Table E-9. Control Object Properties
Property Name Values Description
VERSION 100 Import file format version.
HOSTNAME Hostname string Used to visually identify the system.
FILETYPE Inv, Perf A tag the engine reads to control processing so that the inventory module only processes inventory and so on.
DATE Date Time Date the file was generated.
TIMESTAMP Date-Timestamp Timestamp the file was generated.
UNIQID Unique ID string A unique ID that identifies the system. If provided will be used to identify the system instead of the host name.If you do not provide a unique ID, you might overwrite an existing host name. If you have no unique ID, use an FQDN host name.
NISDOMAIN NIS domain string NIS domain of the system.
UNAME Uanme-a Full uname (UNIX) output for the system.
RUNBY User information for the user who ran the script to generate the output. Useful for debugging. In UNIX, use the ID command.
ISRV_Type 2048, 32768 Number that tells VMware what kind of system is being managed.
Table E-10. APP Object Properties
Property Name Values Description
DAPP_Type App The table that contains stores application information. Also used for operating system information.
ISA_Identity Identity string Used to uniquely identify the application.
ISA_ProductID Can be the serial number of the application or a tag used by some UNIX software installers.
ISA_Estimated Size Bytes number Size in bytes of the installed application. Usually the size at installation.
ISA_InstallLoc Path string Location of installed application.
DAPP_Producer Company string Name of the manufacturer that developed or packaged the application.
DAPP_Name Product string name Product display name.
DAPP_DisplayVersion Version string Full product version string.
DAPP_MajorVersion Major version number Major product version number, which is usually the first number of the version string.
DAPP_MinorVersion Minor version number Minor product version number, which is usually the second number of the version string.
DAPP_PatchLevel Patch level or maintenance number
Patch level or maintenance number for the product, which is usually the remainder of the version string.
DAPP_Description Product description Describes what the product does.
Table E-11. Operating SystemObject Properties
Property Name Values Description
DAPP_Type Operating system Operating system information in stores application information table.
ISA_Identity Identity string Uniquely identifies the operation system.
ISA_InstallLoc Path string Filesystem path where the operating system is installed.

VMware, Inc. 167
Appendix E Linux and UNIX Tools and Utilities
DAPP_Producer Company string Name of the manufacturer that developed or packaged the operating system.
DAPP_Name Product name string Display name of the operating system.
DAPP_DisplayVersion Version string Full operating system version string.
DAPP_MajorVersion Major version number Major operating system version number, which is usually the first number of the version string.
DAPP_MinorVersion Minor version number Minor operating system version number, which is usually the second number of the version string.
DAPP_PatchLevel Patch level or maintenance number
Patch level or maintenance number for the operating system, which is usually the remainder of the version string.
Table E-12. System Object Properties
Property Name Values Description
ISRV_DisplayName Host name string Alternate display name for the system.
ISRV_HostName Host name string Used to visually identify the system. Derived from the actual host name.
ISRV_ComputerName Host name string MS Windows supports having a different computer (NETBIOS) name than the IP host name.
ISRV_ActiveName Host name string MS Windows supports having a different active (NETBIOS) name than the IP host name.
ISRV_InstallLocale Install locale number Locale that was chosen during the installation. Applies more to Window than UNIX. US English is 1033.
ISRV_CurrentLocale Current locale number Locale that was negotiated while collection occurred.
ISRV_Path Path string Complete PATH string for the operating system, which uses it to search for application names when executed.
ISRV_Type 2048, 32768 The kind of system being managed. The number for UNIX, Linux, and Xenix is 2048.
ISRV_DateTime Date time string Date that the file was generated.
Table E-13. Motherboard Object Properties
Property Name Values Description
DCH_CPUTypeList CPU types string Types of CPUs that this motherboard supports.
DCH_Make Manufacturer string Name of the manufacturer of the chassis or motherboard.
DCH_Model Model string Name of the motherboard or chassis model.
Table E-14. Group Object Properties
Property Name Values Description
CG_Name Group name string Name of the domain or group that the system belongs to.
CGT_Name Group type name string Type of group. Has to be one of the valid group types.
Table E-15. RAM Object Properties
Property Name Values Description
ISR_Identity Identity string Types of CPUs this motherboard supports.
ISR_SlotNumber RAM slot number Slot number that holds the RAM module.
DRAM_Size RAM size Size in MB of the RAM module.
Table E-11. Operating SystemObject Properties (Continued)
Property Name Values Description

Data Collection Guide
168 VMware, Inc.
Table E-16. Filesys Object Properties
Property Name Values Description
ISFA_Type RAM slot number Format of the file system.
ISFS_Size Filesystem size number
Disk space in bytes on the the filesystem.
ISFS_SpaceFree Filesystem available space number
Space in bytes available on the filesystem.
ISFS_Path Path string Mount point.
ISFS_Identity Identity string Identity string to uniquely identify the filesystem.
Table E-17. CPU Object Properties
Property Name Values Description
ISC_Identity CPU identity string Unique number that identifies the CPU installed on the system.
ISC_SlotNumber CPU slot number Slot number that holds the CPU.
ISC_CurrCPUSpeed Current CPU speed number
Current speed of the processor.
DCPU_Make Manufacturer string Manufacturer name of the CPU
DCPU_Desc CPU description string Full description of the installed CPU.
DCPU_SecCacheSize Secondary cache size number
Size in KB of the secondary cache.
DCPU_PrimCacheInst Primary instruction cache size number
Size in KB of the primary instruction cache.
DCPU_PrimCacheData Primary data cached size number
Size in KB of the primary data cache.
ISC_SerialNumber Serial number string A serialized string of functionality. In Windows, this number describes the feature set of the CPU.
DCPU_Family CPU family number Family number of the CPU. The Intel Pentium through Pentium III are 6. The Pentium IV is 15.
DCPU_ModelNum CPU model number Model number of the CPU.
DCPU_Stepping CPU stepping number Represents any small change in CPU manufacturing.
DCPU_Model CPU model string The combined string of all the model numbers that describe the processor.
DCPU_Rated Speed CPU rated speed number Designed maximum processor speed.
DCPU_Flags CPU flags string On Linux systems, the serial number in text form.
Table E-18. DriveAdpt Object Properties
Property Name Values Description
ISDA_Identity Drive adapter identity string
Unique numbe that identifies the drive adapter installed on the system.
ISDA_BusNumber Bus number Bus number where the drive adapter is positioned.
DDA_Type SCSI, IDE, SATA Drive adapter type string. Any string can be used, but for consistency, you should try to use one of the specified values.
DDA_Make Drive adapter Manufacturer name of the drive adapter.
DDA_Model Model string Model name of the drive adapter.
DDA_MaxSpeed Maximum speed number Maximum speed in MB/sec of the drive adapter interface.

VMware, Inc. 169
Appendix E Linux and UNIX Tools and Utilities
Table E-19. DiskInfo Object Properties
Property Name Values Description
ISDR_Identity Drive identity string Unique number that identifies the installed drive.
ISDR_Type disk, cdrom
ISDR_ISDA_Identity Drive adapter identity string
Attached drive adapter unique string.
DDR_IntType SCSI, IDE, SATA Drive adapter type string. Any string can be used, but for consistency, you should try to use one of the specified values.
DDR_Make Drive make string Manufacturer name of drive.
DDR_Model Drive model string Model name of drive.
DDR_Space Drive size string Size of drive in GB as seen by the operating system.
DDR_Cache Drive cache size number Size of drive buffer cache in KBs.
DDR_TotalCyl Drive total cylinder number
Total number of cylinders that the drive reports to the operating system.
DDR_TotalHeads Drive total heads number Total number of heads that the drive reports to the operating system.
DDR_TotalSectors Drive total sectors number Total number of sectors that the drive reports to the operating system.
ISDR_CurIntSpeed Drive current interface speed number
Interface speed in MHz that was negotiated between the drive adapter and the drive. Normally the best speed of the slowest component but can be overridden by the operating system to a slower speed.
Table E-20. Daemon Object Properties
Property Name Values Description
ISS_Identity Identity string Unique string that identifies the service or daemon on the system.
ISS_IsActive Active bit (0 or 1) Indicator that the service or daemon is still running. Not always possible on UNIX.
ISS_Status Status string Current status of the service or daemon. On Windows, a service can be in a predefined state: stopped, stopping, started, starting, or paused. On UNIX, the status is a string returned from a status call.
ISS_ExePath Binary path string Full path to the binary that the service or daemon is calling.
DSVC_DisplayName Name string Display name of service or daemon that is displayed in the UI.
DSVC_Name Name string Actual name of the service or daemon that the system references. Usually unique without spaces.
DSVC_Description Description string Description of the service or daemon.
Table E-21. Network Object Properties
Property Name Values Description
ISN_Identity Identity string Identity string to uniquely identify the network adapter.
ISN_IPAddrType Static, dynamic String indicating whether the IP address is static or dynamic.
ISN_IPAddress IP address string Comma-separated string of all of the IP addresses associated with the network adapter.
ISN_MACAddress MAC address string Media access control address for the network adapter.
ISN_CurSpeed NIC current speed number
Bandwidth in bits per second.
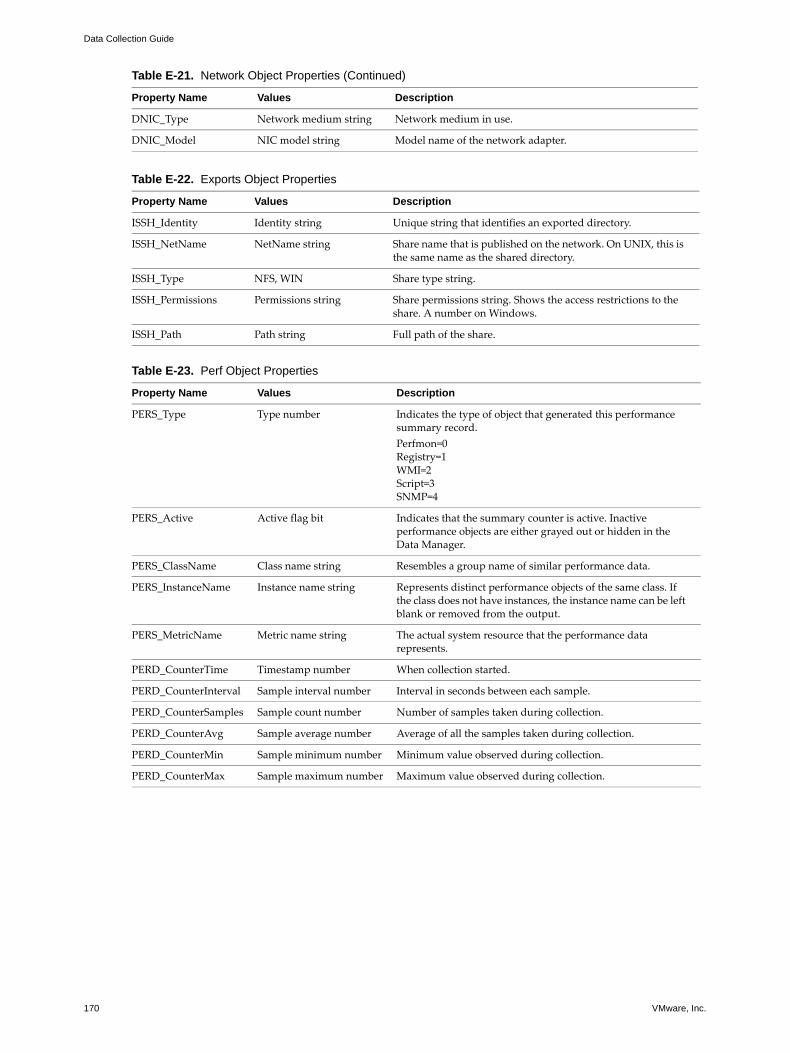
Data Collection Guide
170 VMware, Inc.
DNIC_Type Network medium string Network medium in use.
DNIC_Model NIC model string Model name of the network adapter.
Table E-22. Exports Object Properties
Property Name Values Description
ISSH_Identity Identity string Unique string that identifies an exported directory.
ISSH_NetName NetName string Share name that is published on the network. On UNIX, this is the same name as the shared directory.
ISSH_Type NFS, WIN Share type string.
ISSH_Permissions Permissions string Share permissions string. Shows the access restrictions to the share. A number on Windows.
ISSH_Path Path string Full path of the share.
Table E-23. Perf Object Properties
Property Name Values Description
PERS_Type Type number Indicates the type of object that generated this performance summary record.Perfmon=0Registry=1WMI=2Script=3SNMP=4
PERS_Active Active flag bit Indicates that the summary counter is active. Inactive performance objects are either grayed out or hidden in the Data Manager.
PERS_ClassName Class name string Resembles a group name of similar performance data.
PERS_InstanceName Instance name string Represents distinct performance objects of the same class. If the class does not have instances, the instance name can be left blank or removed from the output.
PERS_MetricName Metric name string The actual system resource that the performance data represents.
PERD_CounterTime Timestamp number When collection started.
PERD_CounterInterval Sample interval number Interval in seconds between each sample.
PERD_CounterSamples Sample count number Number of samples taken during collection.
PERD_CounterAvg Sample average number Average of all the samples taken during collection.
PERD_CounterMin Sample minimum number Minimum value observed during collection.
PERD_CounterMax Sample maximum number Maximum value observed during collection.
Table E-21. Network Object Properties (Continued)
Property Name Values Description
VMware, Inc. 171
F
You have several choices for collecting data from UNIX and Linux target machine:
The collector runs the scripts on the collector host, polling data from the discovered target machines
The collector runs the scripts locally on each target machine
You manually run the scripts on each target machine
Running Scripts ManuallyThis appendix describes how to collect data from UNIX and Linux target machines by running the shell scripts on each target machine rather than running the scripts through the collector host.
To run scripts manually
1 Log in to the target Linux or UNIX machine as root and create a directory under /tmp (or wherever you want to place them) to hold the files. For example:
mkdir /tmp/vmware
2 Using a copy utility such as FTP, RCP, or SCP, copy the script files from C:\Program Files\VMware\VMware Capacity Planner\scripts on the collector host (or an alternative installation directory if you changed the default selection) to the directory on the target machine that you created previously .
3 Change the file mode of aog_setup.sh to allow run privileges. For example:
chmod 755 /tmp/vmware/aog_setup.sh
4 Running the aog_setup.sh installs the scripts and creates the necessary cron entries. The files are:
aog_setup.sh—Creates directories and inserts the cron commands that start the following scripts in the proper sequence
aog_inv.sh—Runs the Linux and UNIX utilities to collect inventory data.
aog_inv_cron.sh—Schedules collection of inventory data.
aog_perf.sh—Runs the Linux and UNIX utilities to collect performance data.
aog_perf_cron.sh—Schedules collection of performance data.
Either add a parameter to the end of the script or run the script without a parameter to use the directory that you copied the scripts to in Step 1. The following are two examples:
/tmp/vmware/aog_setup.sh/tmp/vmware/aog_setup.sh /opt/vmware
Linux and UNIX Scripts F
NOTE The example shows files in the /tmp directory. If you change the location, use the changed directory during the process.
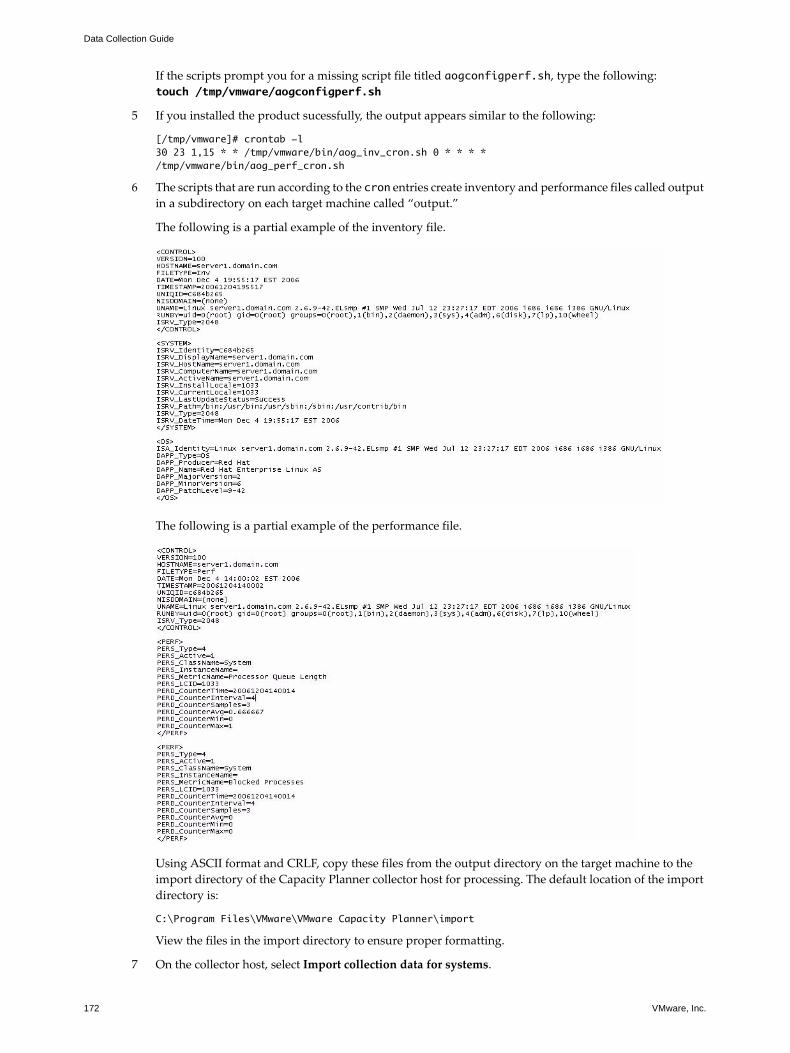
Data Collection Guide
172 VMware, Inc.
If the scripts prompt you for a missing script file titled aogconfigperf.sh, type the following:touch /tmp/vmware/aogconfigperf.sh
5 If you installed the product sucessfully, the output appears similar to the following:
[/tmp/vmware]# crontab -l30 23 1,15 * * /tmp/vmware/bin/aog_inv_cron.sh 0 * * * * /tmp/vmware/bin/aog_perf_cron.sh
6 The scripts that are run according to the cron entries create inventory and performance files called output in a subdirectory on each target machine called “output.”
The following is a partial example of the inventory file.
The following is a partial example of the performance file.
Using ASCII format and CRLF, copy these files from the output directory on the target machine to the import directory of the Capacity Planner collector host for processing. The default location of the import directory is:
C:\Program Files\VMware\VMware Capacity Planner\import
View the files in the import directory to ensure proper formatting.
7 On the collector host, select Import collection data for systems.

VMware, Inc. 173
Appendix F Linux and UNIX Scripts
8 Select Admin>Options and click the Jobs tab.
9 Double-click Scheduled - Data Synchronize.
10 Click the Tasks tab and double-click Data Synchronization.
11 Select Import collection.
During the next scheduled data synchronization job, the data synchronization process looks for files in the Import directory. When files are found, the Data Manager creates CSV output files to be sent to the the Information Warehouse.
The contents of the Import directory are deleted when the data synchronization occurs.
To check for errors
If errors are found in the imported data files, only the section of the file containing an error is rejected. Errors are logged in the collector log file. By default, log files are stored in the following directory on the collector host: C:\Program Files\VMware\VMware Capacity Planner.
To validate data collection
1 Expand the navigation tree in the collector for each target machine to view CPU details.
2 View the information for the same target machine on the Dashboard to make sure that a complete inventory is being sent to the Information Warehouse.
Removing Scripts After Data CollectionAfter you collect data from a target Linux or UNIX machine, remove the scripts.
To remove scripts from the target machine
1 Log into the target Linux or UNIX machine as root.
2 Remove the collection jobs from the cron file by using the following commands:
crontab -l | grep -v '/aog_' > /tmp/vcpcronremovecrontab /tmp/vcpcronremoverm -f /tmp/vcpcronremove
3 Remove the script files and the directories created by them from the installation directory by using the following command:
rm -frd /tmp/vmware
CAUTION For each target machine, after the initial imports are completed, review the log files for any possible errors.

Data Collection Guide
174 VMware, Inc.
VMware, Inc. 175
alertAn email message that indicates either a performance that exceeds vendor-provided thresholds, a potential security risk, a change in the operating conditions of a monitored device, or an error condition.
anomalyIndicates performance that is significantly different from the industry performance averages of like servers that the Information Warehouse provides.
An anomaly is determined when CapacityPlanner detects performance that is more than three standard deviations from the industry average. A performance difference an anomaly indicates can be either good or bad. A good anomaly can provide a comparison to real-world, real-time performance that can be used to configure similar machines, whereas a bad (or, undesirable) anomaly can identify a problem and allow it to be addressed proactively before serious performance issues occur.
available bytesAmount of physical memory available to processes running on a system. This parameter is calculated by summing space on the zeroed, free, and stand-by memory list. Free memory is ready for use. Zeroed memory is memory that is filled with zeros to prevent later processes from seeing data that a previous process used. Standby memory is memory removed from a process working set (its physical memory) on the way to disk, but that is still available to be recalled. This counter displays the last-observed value only; it is not an average.
average CPU MHzCalculated by adding the reported MHz from each actively monitored system, then dividing this number by the number of processors found. The average Server CPU Capacity is determined by dividing the same total of MHz by the number of actively monitored servers.
average disk queue lengthAverage number of read and write requests queued for a selected disk during the sample interval.
business hoursRepresents, by default, the time period from 9:00 a.m. to 6:00 p.m. Also considered prime time.
bytes total per serverNumber of bytes that a server sends to, and receives from, the network. This value provides an overall indication of how busy the server is.
Capacity Planner DashboardWeb-based interface that allows access to the data stored in the Information Warehouse for processing and analysis. The Capacity Planner Dashboard provides standard and custom reports including: inventory, performance monitoring and trending, and expert recommendation. Expert recommendations include anomaly and alert detection, consolidation opportunities, consolidation exceptions, obsolete servers, and
Glossary

Data Collection Guide
176 VMware, Inc.
redeployable servers. In addition, the Capacity Planner Dashboard provides “What if” analysis and phantom server scenario analysis.
Capacity Planner Data AnalyzerPerforms all algorithms and analysis for the Dashboard. Information moves from the collector to the Data Analyzer every 30 minutes. This enables the current data to be transferred to, and stored in, the Information Warehouse, so that the Dashboard is updated on a repetitive and timely basis.
Capacity Planner Data ManagerConfigures the components used to set up and maintain the job schedules, set User ID and Password combinations, manually execute jobs, view job progress, start and stop the collector service, monitor execution messages written out by the collector, and view collected inventory data. The Data Manager runs as a client-side process on a Windows platform (collector host), requiring no special rights to execute.
cache hit percentagePercentage of pages found in the buffer pool when processing a disk read. Each cache hit saves having to incur a read from disk.
Consolidation Exceptions ReportList of unsuccessful consolidations that were attempted, detailing which thresholds were exceeded when the loads of the systems were combined.
Consolidation ReportProvides a list of the successful consolidations that were generated. The report details the source system, target system, and what their combined load looks like.
collectorPerforms discovery, inventory, and performance functions, as well as the Collection, Export, and Send functions of the Performance module. The collector runs as a Windows service. It requires local Windows, Linux, or UNIX administrative rights to collect data specified systems, and collects data by using Microsoft WMI (Windows Management Instrumentation) and Perfmon.
collector hostClient-side Windows-based system on which the collector and Capacity Planner Data Manager are installed for client network analysis.
CPU Balance ReportSee multiprocessor balance.
CPU megahertzReal CPU speed, based on available processing capacity, not rated speed.
CPU queue lengthNumber of threads in the processor queue. Unlike the disk counters, this counter counts ready threads only, not threads that are running. A sustained processor queue of greater then two threads generally indicates processor congestion. Processor time has a single queue, even for systems with multiple processors. This counter displays the last-observed value only; it is not an average.
CPU queue maxProcessor Queue is a per CPU setting.
CPU useNormalized number determined by the megahertz rate times the actual usage rating.
daemonProgram that is not invoked explicitly, but lies dormant waiting for some conditions to occur. The perpetrator of the condition need not be aware that a daemon is lurking.

VMware, Inc. 177
Glossary
discoveryProcess of searching a network for systems (servers or workstations) to be inventoried, which is performed by the collector. The discovery process also discovers domains in the network. See also inventory.
DNS (Domain Name System)General-purpose data query service chiefly used on the Internet for translating host names into IP addresses.
dynamic reportsAllow users to create custom reports. Users can select which type of report to view, and which fields to include in that report. For any selected report, a user can search for particular values, add additional criteria for sorting, and generate resulting reports that can be exported to a CSV file for analysis in Excel or other database.
expert recommendationsBy default, CapacityPlanner recommends the consolidation of two loads only if they are in the same Department, Location, Environment, and Function. In addition, the combination of loads must not exceed any of the specified thresholds.
CapacityPlanner collects many performance metrics and uses ten of these metrics to determine a statistical fit. If the combination of loads exceeds any of these metrics, no consolidation recommendation is made.
CapacityPlanner uses the prime time values when considering consolidation, not the weekly average, and each server has its own load value. You can set different thresholds for different functional groups of servers as well as override any of the set thresholds when you process recommendations.
file system cacheSpeeds up access to the files stored on its disks by caching frequently accessed data.; used by all operating system platforms for improved performance.
firewallServer with special security precautions on it, used to service outside network (especially Internet) connections and dial-in lines.
group byFilter that allows users to view performance based on Department, Environment, Function, and Location groups as well as individual servers.
Internet Control Message Protocol (ICMP)Internet protocol that operating systems of networked computers use to send packets that contain informational messages such as error messages. The ping command uses ICMP to test Internet connections. The Windows tracert program also uses ICMP.
Information WarehouseContains industry performance averages for different types of servers, with information regarding maximum observed values or thresholds on server resources. This intelligence provides benchmarking information for anomaly detection, server consolidation road maps, and other analyses.
inventoryProcess by which the collector collects information from every system (server or workstation) that was identified during the discovery process. The information that the Inventory process can identify differs from system to system, depending on the type of operating system platform, and the profile of the system being inventoried. In addition, the Inventory process can be tailored to only retrieve specific types of information from each system. See also Performance module.
inventory by item by serverShows the inventory breakdown for all servers in a particular category.
Data Collection Guide
178 VMware, Inc.
inventory by item summaryInventory report for each of the following items: applications, processors, disk drives, network interface cards, memory, and services.
IPC$A hidden share used primarily to remotely administer network servers. See also network share.
most recent 12 weeksGraphically shows CPU metrics for performance data collected over the indicated weeks. The information displayed in this graph reflects all servers that were monitored, not just those servers selected for consolidation.
multiprocessor balance Illustrated by the CPU Balance Report; shows CPU usage on multiprocessor systems; identifies servers where CPU processing is not evenly distributed across all processors.
network shareA location on a computer network that allows multiple computer users on the same network to share a central space for storing files. See also IPC$.
number of servers at n% CPU utilizationGraph illustrating the server CPU use for prime time versus peak hour.
obsolete serverServer that does not meet minimum CPU speed requirements, as defined by the Capacity Planner Administrator.
page file Component of an operating system that provides virtual memory for the system. Also called a swap file, it is an area on disk where least recently used pages of memory are moved to, making room in physical memory (RAM) for newer memory pages. The operation of exchanging memory pages between real memory and the page file is called paging, or swapping, and is transparent to applications running on the system platform.
However, the size and organization of the page file are major factors in the performance of the paging operations and, thus, on entire system performance, so it is desirable to monitor the performance of the paging operations with the page file on each server.
page file usePercentage of use of page file for a server. This indicates how much of the page file was used, possibly indicating whether it is beneficial to expand or reduce the size of the page file.
page file use max percentageHighest percentage of use of the page file for a server.
Pages per SecondRate at which memory pages are read from or written to disk in response to hard page faults. Hard page faults occur when a process requires code or data that is not in its working set or elsewhere in physical memory, and must be retrieved from disk. This counter is a primary indicator of the kinds of faults that cause system-wide delays.
percentage CPUDisplays average percentage of busy time observed during the sample interval; calculated by monitoring the time a server is inactive, then subtracting the value from 100%. This counter is a primary indicator of processor activity.
percentage disk timePercentage of elapsed time that a selected disk drive is busy servicing read or write requests.
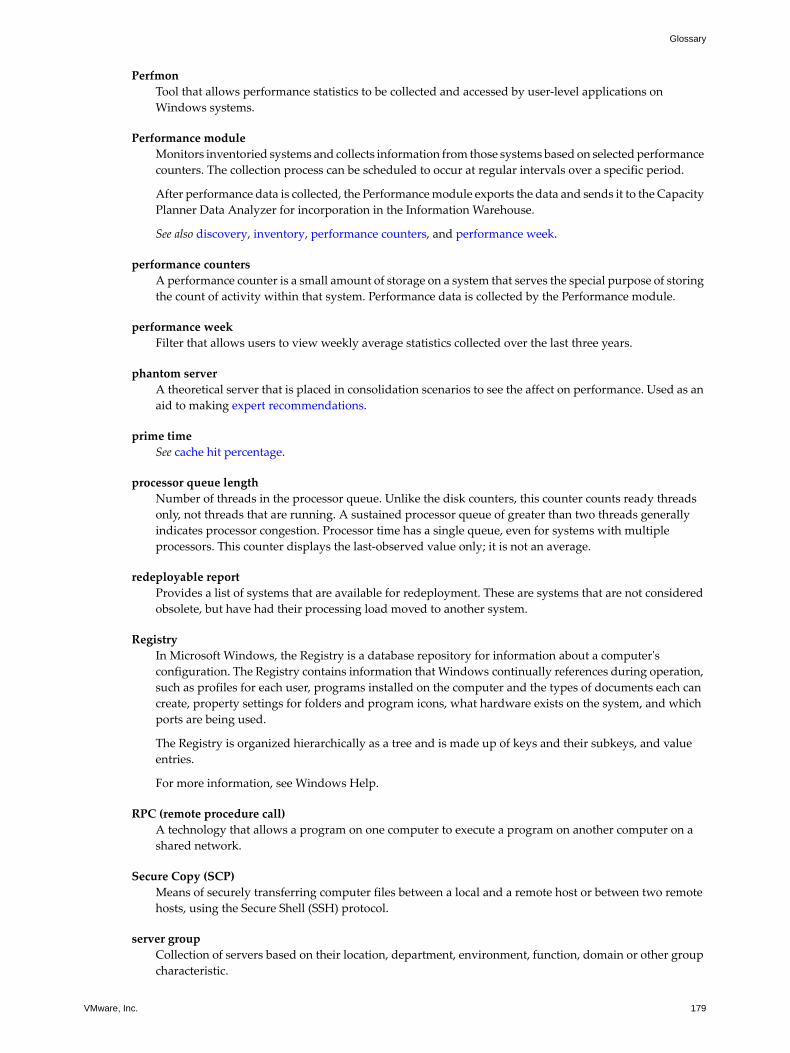
VMware, Inc. 179
Glossary
PerfmonTool that allows performance statistics to be collected and accessed by user-level applications on Windows systems.
Performance moduleMonitors inventoried systems and collects information from those systems based on selected performance counters. The collection process can be scheduled to occur at regular intervals over a specific period.
After performance data is collected, the Performance module exports the data and sends it to the Capacity Planner Data Analyzer for incorporation in the Information Warehouse.
See also discovery, inventory, performance counters, and performance week.
performance countersA performance counter is a small amount of storage on a system that serves the special purpose of storing the count of activity within that system. Performance data is collected by the Performance module.
performance weekFilter that allows users to view weekly average statistics collected over the last three years.
phantom serverA theoretical server that is placed in consolidation scenarios to see the affect on performance. Used as an aid to making expert recommendations.
prime timeSee cache hit percentage.
processor queue lengthNumber of threads in the processor queue. Unlike the disk counters, this counter counts ready threads only, not threads that are running. A sustained processor queue of greater than two threads generally indicates processor congestion. Processor time has a single queue, even for systems with multiple processors. This counter displays the last-observed value only; it is not an average.
redeployable reportProvides a list of systems that are available for redeployment. These are systems that are not considered obsolete, but have had their processing load moved to another system.
RegistryIn Microsoft Windows, the Registry is a database repository for information about a computer's configuration. The Registry contains information that Windows continually references during operation, such as profiles for each user, programs installed on the computer and the types of documents each can create, property settings for folders and program icons, what hardware exists on the system, and which ports are being used.
The Registry is organized hierarchically as a tree and is made up of keys and their subkeys, and value entries.
For more information, see Windows Help.
RPC (remote procedure call)A technology that allows a program on one computer to execute a program on another computer on a shared network.
Secure Copy (SCP)Means of securely transferring computer files between a local and a remote host or between two remote hosts, using the Secure Shell (SSH) protocol.
server groupCollection of servers based on their location, department, environment, function, domain or other group characteristic.
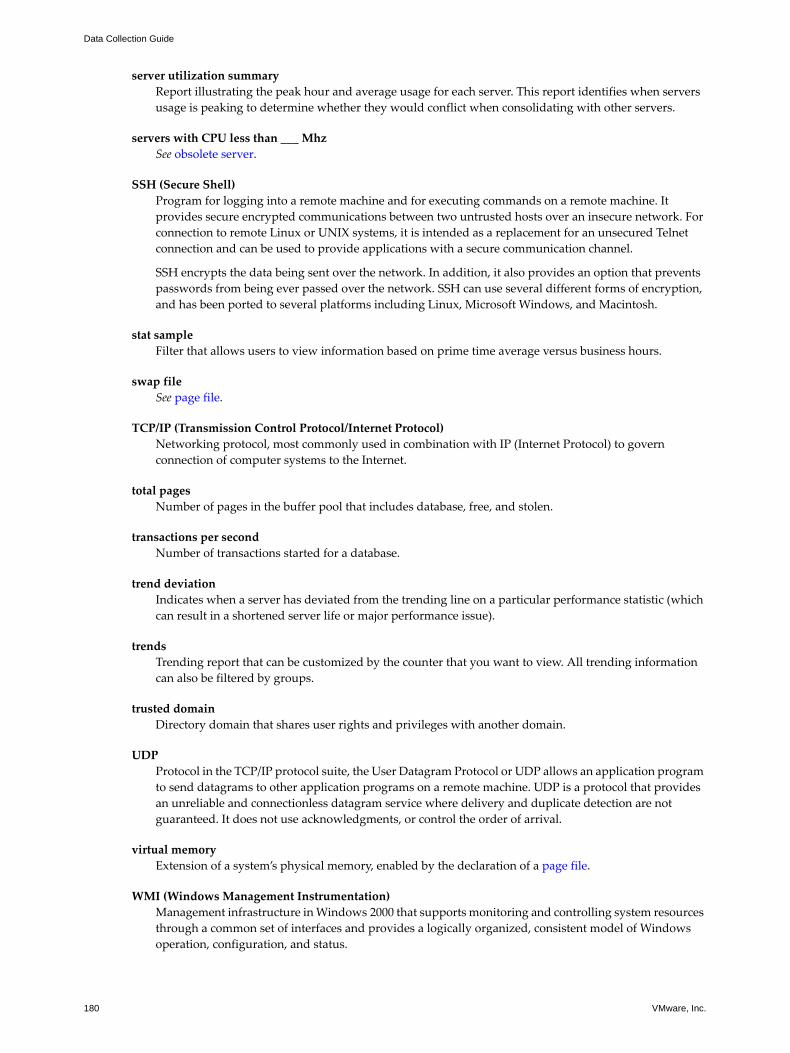
Data Collection Guide
180 VMware, Inc.
server utilization summaryReport illustrating the peak hour and average usage for each server. This report identifies when servers usage is peaking to determine whether they would conflict when consolidating with other servers.
servers with CPU less than ___ MhzSee obsolete server.
SSH (Secure Shell)Program for logging into a remote machine and for executing commands on a remote machine. It provides secure encrypted communications between two untrusted hosts over an insecure network. For connection to remote Linux or UNIX systems, it is intended as a replacement for an unsecured Telnet connection and can be used to provide applications with a secure communication channel.
SSH encrypts the data being sent over the network. In addition, it also provides an option that prevents passwords from being ever passed over the network. SSH can use several different forms of encryption, and has been ported to several platforms including Linux, Microsoft Windows, and Macintosh.
stat sampleFilter that allows users to view information based on prime time average versus business hours.
swap fileSee page file.
TCP/IP (Transmission Control Protocol/Internet Protocol)Networking protocol, most commonly used in combination with IP (Internet Protocol) to govern connection of computer systems to the Internet.
total pagesNumber of pages in the buffer pool that includes database, free, and stolen.
transactions per secondNumber of transactions started for a database.
trend deviationIndicates when a server has deviated from the trending line on a particular performance statistic (which can result in a shortened server life or major performance issue).
trendsTrending report that can be customized by the counter that you want to view. All trending information can also be filtered by groups.
trusted domainDirectory domain that shares user rights and privileges with another domain.
UDPProtocol in the TCP/IP protocol suite, the User Datagram Protocol or UDP allows an application program to send datagrams to other application programs on a remote machine. UDP is a protocol that provides an unreliable and connectionless datagram service where delivery and duplicate detection are not guaranteed. It does not use acknowledgments, or control the order of arrival.
virtual memoryExtension of a system’s physical memory, enabled by the declaration of a page file.
WMI (Windows Management Instrumentation)Management infrastructure in Windows 2000 that supports monitoring and controlling system resources through a common set of interfaces and provides a logically organized, consistent model of Windows operation, configuration, and status.

VMware, Inc. 181
Index
Numerics500 machine limit 99
Aaccess
Dashboard 16ssh keys 49
access account 44access denied error 118, 120access path testing 118access to the download file 27accessing
Performance Options 96, 102scheduled discover tasks 83
accountCollector service 27viewing for a system 106
account privileges 29accounts for installation 37activate jobs 110activating
Global Connection Account 107job scheduler 109jobs 110
Active Directory 68Active Directory tab 84active jobs 109active objects 54Active Server Pages performance counters 140activity 115Add Subnet dialog 74adding
domains 72domains and systems 68systems 75tasks to a job 112
Admin menu 64Admin Options 105
Global Options tab 106Modules tab 108
administrator privileges 118ADSI queries 68AIX systems supported 28Alias Traceroute Results Report 77All Objects branch 53All Statistics performance report 99
AOGCapPlan.mdb file 113API overview 19Applications inventory detail report 92Applications inventory summary report 92architectural overview 14Arithmetic Mean Weight 96assessment
final reporting tasks 24personnel required 22phases 21pre-installation checklist 31role of Capacity Planner 22strategy 21timing 22
assigning systems to groups 71authentication
failures 120requirements 30
Auto Refresh 59automatic database compaction 125averaging performance data 96
Bbackup log files 107bad path error 117bandwidth utilization during collection 30base directory 113
default 113browser performance counters 140
Ccache performance counters 141Capacity Planner
architectural overview 14file location 113product description 13removing 134role in an assessment 22
causes of network issues 120CD-ROM drives 121changing unknown objects 79Chassis inventory detail report 92Chassis inventory summary report 92checklist
assessment team pre-installation 31collector pre-installation 31
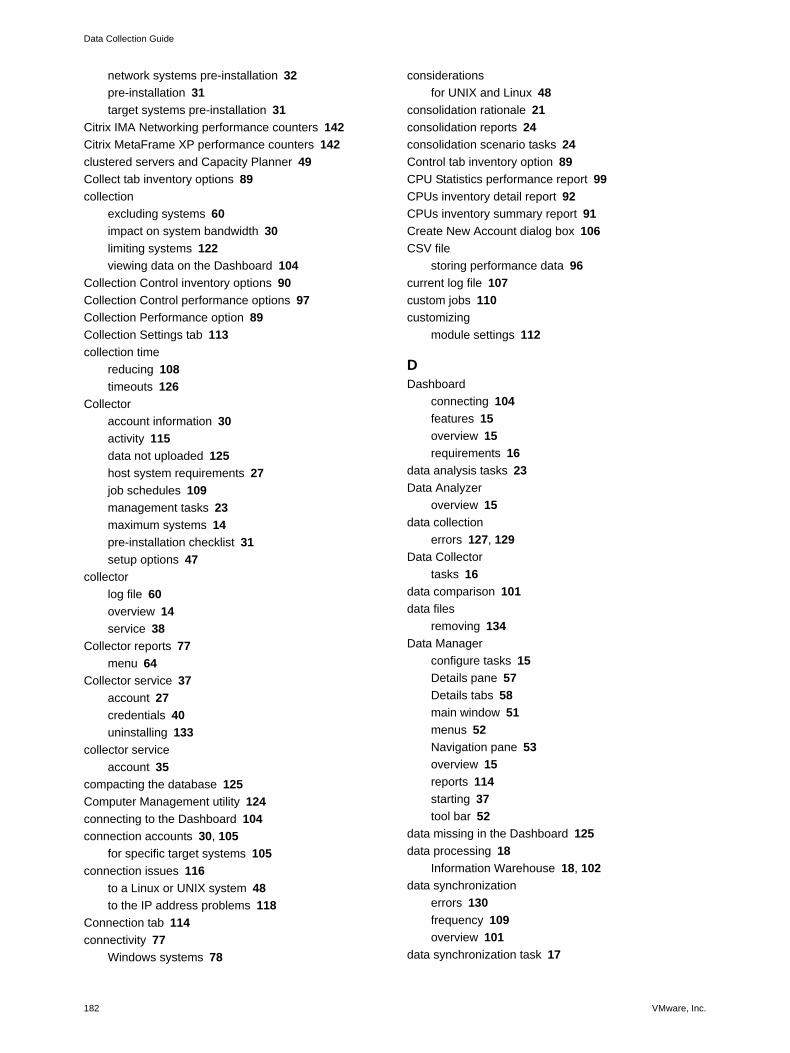
Data Collection Guide
182 VMware, Inc.
network systems pre-installation 32pre-installation 31target systems pre-installation 31
Citrix IMA Networking performance counters 142Citrix MetaFrame XP performance counters 142clustered servers and Capacity Planner 49Collect tab inventory options 89collection
excluding systems 60impact on system bandwidth 30limiting systems 122viewing data on the Dashboard 104
Collection Control inventory options 90Collection Control performance options 97Collection Performance option 89Collection Settings tab 113collection time
reducing 108timeouts 126
Collectoraccount information 30activity 115data not uploaded 125host system requirements 27job schedules 109management tasks 23maximum systems 14pre-installation checklist 31setup options 47
collectorlog file 60overview 14service 38
Collector reports 77menu 64
Collector service 37account 27credentials 40uninstalling 133
collector serviceaccount 35
compacting the database 125Computer Management utility 124connecting to the Dashboard 104connection accounts 30, 105
for specific target systems 105connection issues 116
to a Linux or UNIX system 48to the IP address problems 118
Connection tab 114connectivity 77
Windows systems 78
considerationsfor UNIX and Linux 48
consolidation rationale 21consolidation reports 24consolidation scenario tasks 24Control tab inventory option 89CPU Statistics performance report 99CPUs inventory detail report 92CPUs inventory summary report 91Create New Account dialog box 106CSV file
storing performance data 96current log file 107custom jobs 110customizing
module settings 112
DDashboard
connecting 104features 15overview 15requirements 16
data analysis tasks 23Data Analyzer
overview 15data collection
errors 127, 129Data Collector
tasks 16data comparison 101data files
removing 134Data Manager
configure tasks 15Details pane 57Details tabs 58main window 51menus 52Navigation pane 53overview 15reports 114starting 37tool bar 52
data missing in the Dashboard 125data processing 18
Information Warehouse 18, 102data synchronization
errors 130frequency 109overview 101
data synchronization task 17

VMware, Inc. 183
Index
data uploadInformation Warehouse 18problems 125
data verificationtasks 23
data viewing 102database compaction 125database path default 113Database performance counters 143Database submenu 65days between performance collection 97deactivate jobs 110decentralized environments 120default
active jobs 109Collector job schedules 109domains discovered 71Execute Command 108inactive jobs 109scheduled jobs 109
definingcustom jobs 110Global Connection Account 47, 106local connection accounts 105
deletinga job task 113data files 134Global Connection Account 107jobs 112
derived performance counters 160Descriptions reports menu 63Detailed Inventory reports menu 63Details pane 57Details tabs 58DHCP Server performance counters 144diagnostic tools 122discover
completed job 70domains in IP address range 74domains, procedure for 70name services 67viewing domains 70
Discover Options dialog 83Discover task
timing 17discover task 16discovery
collection methods 67default interval 84identifying target systems 67IP scanning 68
process mechanisms 16troubleshooting 117
disk space 125display of objects 53DNS 68DNS Domains tab 84DNS queries 16domain
name service 68policy for services 37
Domain Naming Service (DNS) 67domains 71
default types 71discovery API 20manually adding 72missing 117viewing 70
domains and systemsinactivating 72, 79
download file access 27Drive Adapters inventory detail report 92Drive Adapters inventory summary report 91Drives inventory detail report 92Drives inventory summary report 91dummy domain 117duplicate errors 127
EEnd-point Mapper 19errors
access denied 118, 120authentication 120bad path 117collection using WMI 127data collection 127data synchronization 130database compaction 125error 1931 40general data collection 129logon server not available 119miscellaneous 131same message text 127service failures 120types 127unknown user 118
excludefrom performance 97systems collection 60
Exclude status inventory option 90excluding modules from export 103
data synchronization 103excluding modules from import 103
data synchronization 103

Data Collection Guide
184 VMware, Inc.
Execute Command 108task 16
executing UNIX and Linux scripts 113Export Rules inventory options 91Export System Identifiable Information 91Export tab
data synchronization options 103inventory option 90
exportingIP addresses 91reports 114
FFile menu 61file path
viewing 113File systems inventory detail report 92finding systems 117firewalls 116
considerations about 30Force Refresh commands 93frequency
of Collector jobs 109
Ggeneral data collection errors 129General tab
data synchronization options 103generated keys 48generating
ssh keys 80Geometric Mean Weight 96Global 48Global Connection Account 35, 44, 88
activating 107defining 47, 106deleting 107information about 106modifying 107viewing for a system 106
global options setup 47Global Options tab 106group types 71Group/Domain Discovery tab 83groups
assigning systems 71
Hhiding inactive objects 73hiding objects 61host name resolution 119host system
account required 29
determining number of 27requirements 27
HP-UX systems supported 28
Iidentifying target systems 67impact of collection 30import domains from a file 71Import tab
data synchronization options 103inventory option 90
inactivating domains and systems 72, 79inactive jobs 109inactive objects 54, 73, 79industry benchmarks 15Information Warehouse
data comparison 101data processing 102data upload 18overview 15
installationproblems 40tasks 23UNIX and Linux target systems 48user credentials 37
internetviewing data 104
intervaldiscovery default 84inventory default 91
inventorycollecting for single system 88collection methods 87default interval 91detailed reports 92excluding systems 60global connection account 88job frequency 109overview 87problem areas 93refreshing data 93running reports 91summary reports 91types of data 17
inventory collectionAPI 20overview of data collection 17performance 89
Inventory Options dialog 88inventory process timing 17inventory reports 91Inventory Reports menu 63Inventory Status Report 77

VMware, Inc. 185
Index
IP addressdomain discovery 74problems with 120security 91
IP performance counters 144IP scanning 16, 68IP Subnets tab 74, 84IPC$ resource 20
Jjob
deleting 112scheduled inventory 91
job historyretention 108
Job History tab 70job scheduler
activating and suspending 109job schedules 109job tasks
deleting 113module settings 112
jobsactivating 110deactivating 110running simultaneously 91, 99
LLAN Manager 67LanMan browser requests 16launching
Data Manager 37LDAP requests 16levels of logging 116light bulb icon 73limit performance collection 97limiting objects in a job 112limiting systems collected 122Linux collection 29Linux installation requirements 48Linux performance data collection 20Linux scripts 113Linux systems 14, 17
connection 48discovery 69network connections 19
LMHOSTS file 117local Capacity Planner database 113local connection account 105
viewing for a system 106log files 60
size of 107working with 116
logging level 60, 107discovery 69setting 116
Logical Disk Derived performance counters 160Logical Disk performance counters 145Logical Disk Size performance report 100logon server not available error 119
Mmanual
discovery 17inventory collection 88, 95, 102inventory task 17performance collection 82performance data collection 17tasks 62
manually addingdomains 72domains and systems 68systems 75
Max number of simultaneous systems 96maximum
systems collected 97Memory inventory detail report 92Memory inventory summary report 91Memory performance counters 146Memory Utilization performance report 99menus 52message pane 59
discover domains 70pop-up 59
message text 59message window size 107messages
inventory progress 17methods
discovery 67inventory collection 87performance collection 95
Microsoft Access database 113Microsoft Active Directory 68Microsoft clustered servers 49Microsoft DCE Locator service 19Microsoft Exchange servers 18Microsoft Jet database 30miscellaneous errors 131missing
CD-ROM drives 121data in the Dashboard 125performance data 122systems 117
Missing Data Report 78Modify Job - General tab 110
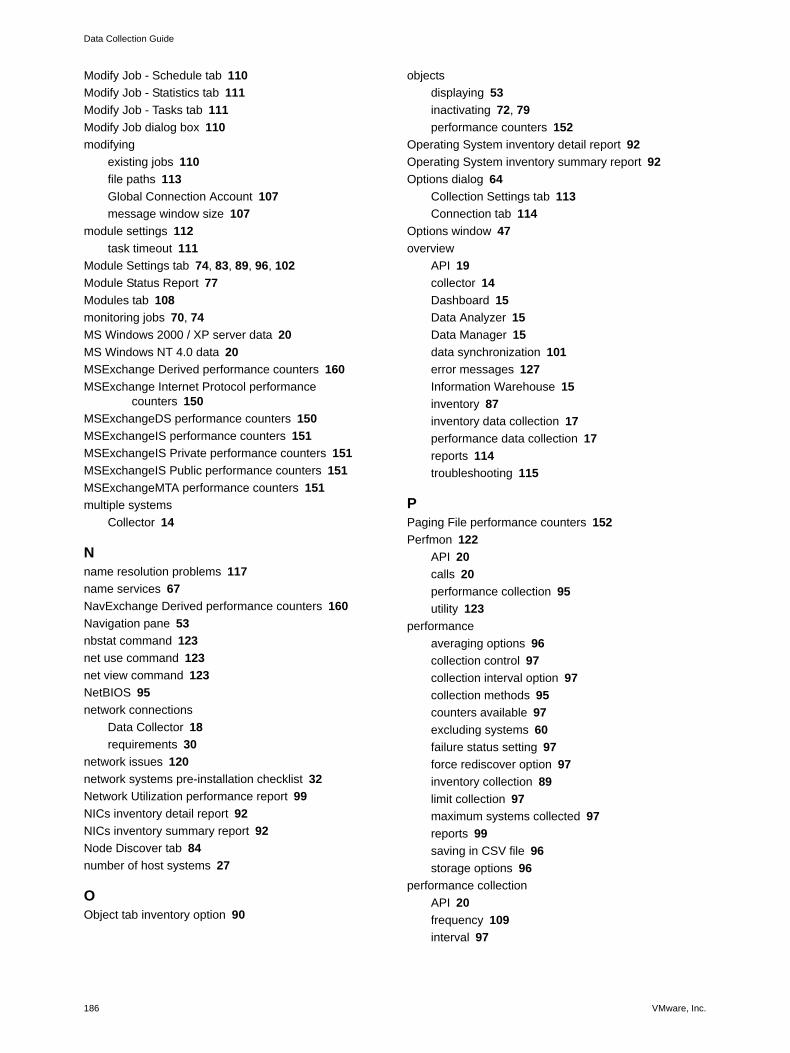
Data Collection Guide
186 VMware, Inc.
Modify Job - Schedule tab 110Modify Job - Statistics tab 111Modify Job - Tasks tab 111Modify Job dialog box 110modifying
existing jobs 110file paths 113Global Connection Account 107message window size 107
module settings 112task timeout 111
Module Settings tab 74, 83, 89, 96, 102Module Status Report 77Modules tab 108monitoring jobs 70, 74MS Windows 2000 / XP server data 20MS Windows NT 4.0 data 20MSExchange Derived performance counters 160MSExchange Internet Protocol performance
counters 150MSExchangeDS performance counters 150MSExchangeIS performance counters 151MSExchangeIS Private performance counters 151MSExchangeIS Public performance counters 151MSExchangeMTA performance counters 151multiple systems
Collector 14
Nname resolution problems 117name services 67NavExchange Derived performance counters 160Navigation pane 53nbstat command 123net use command 123net view command 123NetBIOS 95network connections
Data Collector 18requirements 30
network issues 120network systems pre-installation checklist 32Network Utilization performance report 99NICs inventory detail report 92NICs inventory summary report 92Node Discover tab 84number of host systems 27
OObject tab inventory option 90
objectsdisplaying 53inactivating 72, 79performance counters 152
Operating System inventory detail report 92Operating System inventory summary report 92Options dialog 64
Collection Settings tab 113Connection tab 114
Options window 47overview
API 19collector 14Dashboard 15Data Analyzer 15Data Manager 15data synchronization 101error messages 127Information Warehouse 15inventory 87inventory data collection 17performance data collection 17reports 114troubleshooting 115
PPaging File performance counters 152Perfmon 122
API 20calls 20performance collection 95utility 123
performanceaveraging options 96collection control 97collection interval option 97collection methods 95counters available 97excluding systems 60failure status setting 97force rediscover option 97inventory collection 89limit collection 97maximum systems collected 97reports 99saving in CSV file 96storage options 96
performance collectionAPI 20frequency 109interval 97
VMware, Inc. 187
Index
overview 17Perfmon 95timing 99
performance collection timing 99performance counters
defined 139derived 160removing 99
performance data missing 122Performance reports menu 63performance tuning 18personnel for an assessment 22phases of an assessment 21Physical Disk Derived performance counters 160Physical Disk performance counters 153Physical Disk Utilization performance report 100ping command 123pinging objects 108platforms supported 28pre-assessment tasks 22pre-defined scheduled jobs 109pre-installation checklist 31pre-installation tasks 22Print Queue performance counters 154privileges
Collector accounts 29problems
connecting to the IP address 118name resolution 117with installation 40
procedurediscover domains 70
processassessment 21discovery 16inventory data collection 17
Process performance counters 154Processor performance counters 155Processor Queue Length performance report 99Processor Utilization performance report 99Purge Database command 126purpose for assessment 21PuTTY application 80, 124
documentation 49, 80shareware 48
Rreasons for assessment 21RedHat Linux systems supported 28Redirector performance counters 157rediscover performance option 97reducing collection time 108
refreshinginventory data 93
regedit.exe 124regedt32.exe 124registration
Dashboard 16Registry connection 17Registry Editor 124Registry inventory collection 89Registry Only option problems 121Remote Registry and Perfmon 88Remote Registry service 121removing
data files 134performance counters 99
removing Capacity Planner 134Reports 105Reports menu 62reports overview 114requirements
Collector host system 27Collector serviceDashboard 16host system account 29inventory collection 88Linux and UNIX 29Microsoft Active Directory 68network connection 30network connections 18security and network 29system access account 44UNIX and Linux 48user accounts 27
reset collection 93resolving the host name 119resolving unknown objects 79resources
troubleshooting 115Run Manual Tasks menu 62Run Scheduled Jobs menu 62Run Setup Wizard 65running
Collector service 40scheduled jobs manually 110UNIX and Linux scripts 113
Ssaving
collection time 108log files 107reports 114
scheduleCollector jobs 109

Data Collection Guide
188 VMware, Inc.
scheduled discover tasksaccessing 83
Scheduled inventory collection 88, 95, 102scheduled jobs 62, 109
running manually 110Scheduled performance collection 82scripts for UNIX and Linux 113Secure Shell (ssh) 17, 88security
IP addresses 91security requirements 29Select Counters dialog box 98selecting
objects in a job 112sending data problems 125serial numbers
security 91server
discovery API 20Server performance counters 157Server Work Queue performance counters 158service domain policy 37service failures 120Service Properties dialog 39service setup for Collector 37Services inventory detail report 92Services inventory summary report 92setting
discover options 83job history retention 108log level 107max number backup log files 107timeouts 126
setting global options 47setting the logging level 116setup
Collector service 37shares information
security 91Shares inventory detail report 92showing inactive objects 73single system
collecting inventory data 88SQL Server Access Methods performance counters 158SQL Server Buffer Manager performance counters 158SQL Server Databases performance counters 158SQL Server Derived performance counters 160SQL Server Locks performance counters 158SQL Server Memory Manager performance
counters 158ssh key 80ssh key access 49SSH session 20
ssh sessionlaunching 81
startingthe Data Manager 37
startupCollector service 35
statuscollector service 38Remote Registry service 121
status bar 52storage of performance data 96strategy for assessement 21subset of objects 112summary
inventory data types 17Summary Inventory reports menu 63Sun Solaris systems supported 28supported platforms 28SUSE Linux systems supported 28suspending
job scheduler 109system access
Global Connection Account 44system connection account 105, 106system connections 77system connectivity 77System Data Report 78system details 76System Discovery tab 83System performance counters 159System Status Report 78system types 71system validation
Linux 80UNIX 80
systemsmissing 117
Systems branch 75Systems inventory detail report 92Systems inventory summary report 91systems supported 28
Ttarget systems
identifying 67UNIX and Linux 29
target systems pre-installation checklist 31target systems supported 28tasks
assessment reports 24collector management 23consolidation scenario 24Dashboard 15

VMware, Inc. 189
Index
data analysis 23Data Collector 16Data Manager 15data verification 23installation 23pre-assessment 22pre-installation 22
Tasks menu 62Terminal Services performance counters 159Test 77Test Collection Results Report 77testing access paths 118testing system connections 77time requirements
assessment 22timeout settings for modules 111timeouts
collection 126timing 18
collection 91, 99data synchronization 18data upload 18inventory data upload 18performance collection 99performance data collection 17viewing data in the Dashboard 102
title bar 52tool bar 52Track inventory changes option 90tracking status 115troubleshooting
connection issues 116data upload 125discovery 117performance data 122resources 115
troubleshooting overview 115troubleshooting tools 122trusted domains 29types
group and system 71types of data collected 101
Uuname utility 69undocumented errors 127uninstalling
the Collector service 133UNIX and Linux Inventory Collection 80UNIX and Linux system discovery 69UNIX collection 29UNIX installation requirements 48UNIX performance data collection 20
UNIX scripts 113UNIX system
discovery 69UNIX system connection 48UNIX systems 14, 17
network connections 19unknown objects 78
changing 79unknown user error 118unmanaged systems 116unsuccessful database compaction 125user account requirements 27user credentials for installation 37user interface overview 51utilization of bandwidth 30
Vvalid domains 71valid group and system types 71View import systems template link 61View menu 61viewing
database file paths 113full message text 59message window 107reports 114system connection account 106
viewing data on the Web 104viewing domains 70VMware Capacity Planner
architectural overview 14components 14product description 13
VMware Capacity Planner Service Properties dialog 39VMwareCP.log 107VMwareCP.log file 60
WWeb Service performance counters 160Windows error 1931 40Windows Internet Naming Service (WINS) 68Windows Inventory options 89Windows Management Instrumentation (WMI) 87Windows performance collection 20Windows Services facility 37Windows systems 14
network connections 19testing connectivity 78
WMI collection errors 127WMI inventory collection 89workarounds
discovery 117

Data Collection Guide
190 VMware, Inc.