Embed Size (px)
DESCRIPTION
Overview of different energy storage technologies
Citation preview

1
ARPA-E Grid-Scale Energy Storage Workshop Summary
October 4, 2009Seattle Renaissance Hotel
Seattle, Washington

2
Defining the need for storage
Possible storage solutions
Energy Storage Technologies
Key Findings Summary

3
Energy Storage is required to confer reliability to renewable energy sources and to produce power when the load occurs
Wind generation does not correlate well with load…
Day
Ener
gy D
eliv
ery
(MW
)
Load (MW
)
Load Modeled Wind Energy Production
0
50
100
150
200
250
300
350
400
450
1 2 3 4 5 6 70
500
1,000
1,500
2,000
2,500
3,000
3,500
4,000Erratic windPredictable load, with a
regular weekly pattern
Wind lows during on-peak periods
Wind often spiking during
off-peak periods
Day
Ener
gy D
eliv
ery
(MW
)
Load (MW
)
Load Hybrid Storage and Wind Energy Production
… but shaped wind with storage is a significant asset.
0
50
100
150
200
250
300
350
400
450
1 2 3 4 5 6 70
500
1,000
1,500
2,000
2,500
3,000
3,500
4,000
A portion of deliveries are “baseloaded” to meet round the clock needs
Some of the deliveries are shaped to meet intermediate
and peaking needs
Notes: 400 MW of wind in Texas Panhandle modeled in conjunction w / local storage facility. Grid storage parameters – 400 MW of capacity
Source: Ridge Energy Storage.
Texas Panhandle Example

4
Depending on the technology and application, energy storage can provide a wide variety of benefits
Renewables IntegrationUse of storage to provide capacity value, predictable scheduling, and time shifting of intermittent renewable generation, along with ancillary service requirements
Rate OptimizationUse by customers to reduce demand charges and on peak energy chargesPrice Arbitrage / Peak ShavingPurchase of cheap energy for charging (off peak), and discharging to sell at high prices (on peak)Capacity ValueUse of storage in place of traditional generation to meet capacity reserve requirements
Cycling Cost ManagementProvide a sink for off-peak power to reduce need to cycle mid-merit generation, avoiding startup fuel costs and significant wear and tear on the turbines
Ancillary ServicesUse of storage to provide spinning reserve, load following, regulation, black start, etc.
T&D Network Investment Deferral
Use of storage to defer the need for new transmission or distribution capacity to meet demand growth or power systems requirements
T&D Component Life Extension
Use of storage to reduce maximum loading on the grid segments, thereby extending the life of T&D assets
Transmission Access / Congestion Charge Management
Use of storage to avoid congestion charges when demand for transmission service is high
T&D Asset Utilization
Improve capital returns on capital investment in T&D investments by increasing capacity utilization of T&D resources via storage
Reliability
Use of storage to provide ride-through power or to provide time for an orderly shut down in the case of an unexpected power outage
Power Quality
Use of energy storage to condition power to reduce voltage variations, reduce frequency variations, maintain power factor, and manage harmonics
Supply Delivery

5
Our workshop concerns two broad categories of grid scale energy storage and how to advance related technologies
Energy Storage Benefitsd
Enabling renewable penetration
Reduction of Generation and Delivery Inefficiencies
Distributed Generation
Demand/Peak Load Management
T&D Asset Optimization
Ensuring a Robust/Reliable Grid
Electricity Arbitrage
StorageApplications Description Performance Metrics Technology Examples
Energy Management
(hours/diurnal))
The strategy of adjusting and optimizing energy generation including reducing the large fluctuations that occur in electricity demand by storing excess electricity during periods of low demand for use during periods of high demand.
Discharge Time
System Power Rating
Round Trip Efficiency
Capital Cost
Cycle and Calendar Life
Site Availability
Pumped Hydro Storage
CAES
Bulk Electrochemical Storage
Advanced Batteries
Chemical Storage
Power Applications
(seconds/minutes))
Faults, dynamic operations, or nonlinear loads often cause various types of power quality disturbances such as voltage sags, voltage swells, impulses, notches, flickers, harmonics, etc.
Response Time
System Power Rating
Round Trip Efficiency
Capital Cost
Cycle and Calendar Life
Bulk Electrochemical Storage
Advanced Batteries
Flywheels
Ultracapacitors
SMES
Source: DOE Electric Power Annual 2007, Energy Storage Association, BAH Analysis
US Electric Capacity (GW)
0
200
400
600
800
1,000
1,200
96 97 98 99 0 '01 '02 '03 '04 '05 '06 '07
Capacity CAGR 2.3%
Storage Capacity CAGR 0.3%
GW
‘07 PHS & CAES: 2%
of total
Where can ARPA-E make the greatest
impact?
Where can ARPA-E make the greatest
impact?

6
Defining the need for storage
Possible storage solutions
Energy Storage Technologies
Key Findings Summary

7
Workshop participants from utilities believed that storage is headed toward wide utilization from generation points to individual homes
… each technology has technical challenges, and room for development within ARPA-E.
“Residental generation from renewables has
doubled every year for the last decade”. A. Nourai - AEP
“Residental generation from renewables has
doubled every year for the last decade”. A. Nourai - AEP
Source: A. Nourai, American Electrical Power, Inc. presentation at EESAT 2009, October 4-7, 2009

8
Grid storage will by supplied by a combination of technologies with Varied power and energy storage capacities
• CAES: Compressed Air Energy Storage• EDLC: Double Layer Capacitors• L/A: Lead Acid• Li-Ion: Lithium Ion• Na-S: Sodium Sulfur
• Ni-Cd: Nickel-Cadmium• Ni-MH: Nickel-Metal Hydride• PSH: Pumped Hydro• Vanadium Redox• ZnBr: Zinc-Bromine
Source: Brad Roberts, ESA website, May 2009.

9
Requirements for Grid Scale Energy Storage are becoming more clear and fall into three categories, according to our participants
Power Outputs at Different Points on the Grid
100-1000 MW Units(such as pumped hydro)
10-100 MW Units(such as NaS)
1-10 MW Units(for Community
Storage)
Source: A. Nourai, American Electrical Power, Inc., presentation to EESAT, October 4-7, 2009.

10
Grid storage will by supplied by a combination of technologies at varied stages of development
Grid Storage Stages of Maturity by Technology
Hydro
Flow Batteries CAES
Laboratory Stage Mature Technology
Lead Acid / Lead CarbonNa S
Li-IonNiCd
Advanced CAES
Prototype Stage
The participants would like to see ARPA-E catapult more of these technologies to maturity, in order to:
1) Increase functionality of renewables2) Reduce the need for spinning reserves and thereby3) Cut greenhouse gasses and 4) Reduce the use of fossil fuels
FlywheelsNi-MH
Ultracapacitors

11 11
Workshop participants agreed that ARPA-E and the DOE Office of Electricity have a complementary roles in technology development
• ARPA-E should develop alpha-prototype level stage, • OE should then develop alpha-prototypes to a final stage • ARPA-E should focus on Valley of Death between laboratory
models and alpha prototype
Office of Science
Office of Electricity Delivery and Energy
Reliability
Prototype/
Demos
Tech Gap Commercialization Gaps
ARPA-E Chief Transition Area
ARPA-E Future Programs and Private Venture Capital

12
Defining the need for storage
Possible storage solutions
Energy Storage Technologies
Key Findings Summary

13
Pumped Storage Hydro is the most popular form of grid scale energy management, but offers little potential for innovation
DescriptionDescription
• The pumping process makes the plant a net consumer of energy overall, but pumped storage is the largest-capacity form of grid energy storage commercially available
• Within the US, there are 38 facilities with 22 GW of power capacity
• These power plants are still used to provide ancillary services (such as helping manage grid frequency and providing clean reserve generation)
• The number of environmentally acceptable sites for future pumped hydroelectric facilities is very limited due to the need for significant elevation changes in pumped hydroelectric plan designs
• Pumped storage can be constructed at capacities of 100-1000 of MW and discharge from 4-10 hours with cost in the range of $2200 - $2250/KW
Pumped Storage Hydro (PSH) Technical OverviewTechnology HighlightsTechnology Highlights
PSH uses off peak power to pump water from a reservoir to a higher elevation; during periods of high electrical demand, the stored water is released through turbines to create electricity PSH is technologically mature and reliable compared to other storage options
PSH uses off peak power to pump water from a reservoir to a higher elevation; during periods of high electrical demand, the stored water is released through turbines to create electricity PSH is technologically mature and reliable compared to other storage options
Key PlayersKey Players• Pumped storage plants are in wide use globally• Largest pumped hydro facility globally is in Bath County,
Virginia
• Pumped storage plants are in wide use globally• Largest pumped hydro facility globally is in Bath County,
Virginia
Technology Maturity
R&D CommercialBench-scale
Pilot-scaleDemonstration
Source: DOE, EPRI, ESA.

14
CAES has demonstrated operational improvements in NG plants and potential with renewables, but siting is limiting
DescriptionDescription• A CAES plant with underground storage must be built near a
favorable geological formation • Cost of the underground cavern is a significant contributor to
cost • Above ground compressed air storage in gas pipes or pressure
vessels is practical and cost effective for storage plants with less than about 100 MWh of storage
• Compressed air stored in underground caverns released to power the compression cycle of the gas turbine generator reduces startup time from (20 – 30 minutes to 9 – 11) and also cuts natural gas usage
• Charging Ratio ranges from .82-1.3 (kWh used to store/kWh discharge)
• Newer systems under investigation currently will generate power by air discharge, without natural gas as a required co- generation carburant.
• A CAES plant with underground storage must be built near a favorable geological formation
• Cost of the underground cavern is a significant contributor to cost
• Above ground compressed air storage in gas pipes or pressure vessels is practical and cost effective for storage plants with less than about 100 MWh of storage
• Compressed air stored in underground caverns released to power the compression cycle of the gas turbine generator reduces startup time from (20 – 30 minutes to 9 – 11) and also cuts natural gas usage
• Charging Ratio ranges from .82-1.3 (kWh used to store/kWh discharge)
• Newer systems under investigation currently will generate power by air discharge, without natural gas as a required co- generation carburant.
Compressed Air Energy System (CAES) Technical OverviewTechnology HighlightsTechnology Highlights
In CAES systems, electricity is used to compress air during off-peak hours The compressed air is most economically stored underground in salt caverns, hard rock caverns, or porous rock formations
In CAES systems, electricity is used to compress air during off-peak hours The compressed air is most economically stored underground in salt caverns, hard rock caverns, or porous rock formations
Key PlayersKey Players• Alabama Electric Cooperative Inc (McIntosh, AL)• Alabama Electric Cooperative Inc (McIntosh, AL)
Source: DOE, Press Releases.
Technology Maturity
R&D CommercialBench-scale
Pilot-scaleDemonstration

15
VRB has enormous performance potential at scale but a reduction in system cost is required for deployment
DescriptionDescription
• Two aqueous electrolytes with active vanadium species in different oxidation states pumped through reaction cell halves
• At negative electrode, V3+ is converted to V2+ during battery charging; during discharge, V2+ ions are reconverted back to V3+; at the positive electrode, similar reaction occurs between ionic forms V5+ and V4+
• Electrolyte stored externally, allowing independent power and energy ratings: energy determined by electrolyte stored externally; power determined by size and number of electrodes in cell stack
• Efficiency ~70%• Cost: ~$500/kWh, with cost at $150/kWh possible for 8-hour
storage systems (due to scale up); installation costs currently at $2500/kW; mass market costs are projected at $720/kW and $144/kWh
• Cost of electrolytes for scale up is more than double that for zinc-bromine (another notable flow battery type), but system is more scalable
• Capacity: 275 kW – 3 MW• Lifetime: 10-20 years• Projected doubling of energy density possible (through better
absoption of active materials by electrolyte), up from 25 Wh/kg
Vanadium Redox Flow Battery (VRB) Technical OverviewTechnology HighlightsTechnology Highlights
The VRB exploits the ability of vanadium to exist in solution in 4 different oxidation states; it thus uses only one electroactive element, preventing cross contamination by diffusion of ions across the membrane Also, as a flow battery, VRB’s capacity in only limited by the size of the storage tanks
The VRB exploits the ability of vanadium to exist in solution in 4 different oxidation states; it thus uses only one electroactive element, preventing cross contamination by diffusion of ions across the membraneAlso, as a flow battery, VRB’s capacity in only limited by the size of the storage tanks
Key PlayersKey Players• Current DOE Demo Project: SMUD/Sprint 20 kW in Sacramento• Prudent Energy (China) - recently acquired VRB, which had earlier acquired other VRB
patent holders (such as a Sumitomo division and Pinnacle) • GEFC (China) – focus areas include membrane, electrode, electrolyte and stack• University of New South Wales
• Current DOE Demo Project: SMUD/Sprint 20 kW in Sacramento• Prudent Energy (China) - recently acquired VRB, which had earlier acquired other VRB
patent holders (such as a Sumitomo division and Pinnacle) • GEFC (China) – focus areas include membrane, electrode, electrolyte and stack• University of New South Wales
Source: DOE, EPRI, Press Releases.
Technology Maturity
R&D CommercialBench-scale
Pilot-scaleDemonstration
VRB Schematic

16
Zn-Br batteries have moderate energy density, good power density, better cycling performance and poor scalability
DescriptionDescription
• Construction similar to other Flow batteries, however, rather than all active materials being dissolved in the electrolyte, during charge, zinc is electroplated on the anode and bromine is evolved at the cathode
• On discharge, the bromine is returned to the battery stacks, and zinc is oxidized to zinc ions on the anodes, bromine is reduced to bromide ions on the cathodes
• Efficiency: 65-75%
• Cost: initial system cost comparable to VRB; electrolytes for scale up is much cheaper, but system less scalable; mass market costs projected at $ 720 kW and 144 / kWh
• Capacity, Power Ratings: <1 MW, 0.01 – 5 MWh
• Lifetime: 5-10 years
• Safety enhanced (by polybromide formation during compounding)
Zinc - Bromine Flow Battery Technical OverviewTechnology HighlightsTechnology Highlights
A solution of zinc bromide is stored in 2 tanks (one tank stores electrolyte for positive electrode reactions and the other for the negative)
Zn-Br battery capacity is less scalable than VRB flow batteries since it is not a pure flow battery
A solution of zinc bromide is stored in 2 tanks (one tank stores electrolyte for positive electrode reactions and the other for the negative)
Zn-Br battery capacity is less scalable than VRB flow batteries since it is not a pure flow battery
Key PlayersKey Players• DOE funding 1MWh Demo project in California (2 - 500 kWh
installations) • ZBB Energy Corp. • Premium Power Corporation
• DOE funding 1MWh Demo project in California (2 - 500 kWh installations)
• ZBB Energy Corp. • Premium Power Corporation
Source: DOE, Energy Storage Association.
Technology Maturity
R&D CommercialBench-scale
Pilot-scaleDemonstration
Zinc-Bromine Flow Battery Schematic

17
L/A Batteries have a low production cost but present cycling, weight, toxicity and depth of discharge problems
DescriptionDescription
• Lead-acid is one of the oldest and most developed battery technologies
• Several commercial, large-scale energy management applicatoins have been installed (California, Hawaii, Puerto Rico, and Germany)
• Demonstrated rated energy ranges from 4.5 to 40 MWh • Demonstrated rated power ranges from 3 to 10 MW; however,
amount of energy (kWh or MWh) the battery can deliver is not fixed and depends on rate of discharge
• Cost: installed cost ($/kw) have ranged from $239 to $805 (1995 dollars); cost / kWh have ranged from $201 to $707
• Innovative Lead Carbon batteries under development currently may make this system more attractive for Grid Storage applications
Lead Acid (L/A) Battery Technical OverviewTechnology HighlightsTechnology Highlights
L/A battery has low relative cost and is a popular choice for power quality and uninterrupted power supply application but it is limited due to its short cycle life
L/A battery has low relative cost and is a popular choice for power quality and uninterrupted power supply application but it is limited due to its short cycle life
Key PlayersKey Players• GNB Industrial Power/Exide, Delco, East Penn, Teledyne, Optima
Batteries, JCI Battery Group, Crown Battery, Wildcat, Caterpillar/Firefly Energy.
• GNB Industrial Power/Exide, Delco, East Penn, Teledyne, Optima Batteries, JCI Battery Group, Crown Battery, Wildcat, Caterpillar/Firefly Energy.
Source: Energy Storage Association.
Technology Maturity
R&D CommercialBench-scale
Pilot-scaleDemonstration
An islanded lead acid battery stack in Alaska

18
Na-S batteries are promising for grid-storage, but high operating temperatures (300 to 350 °C) limits its use
DescriptionDescription
• Cylindrical tube composed of negative electrode of liquid sodium in the inner core; positive electrode comprised of a surrounding layer of sulfur; Beta-Alumina Solid Electrolyte (BASE) layer separates the electrodes; BASE electrolyte is a good conductor of sodium ions, but a poor conductor of ions, thereby preventing self-discharge
• During discharge: molten sodium serves as anode; positive sodium ion passes through the BASE (electrolyte) to the sulfur layer to form sodium polysulfide; the sodium level in the inner core drops
• During charging: sodium polysulfides release the positive sodium ions back through the electrolyte to recombine as elemental sodium
• Once running, heat produced by charging and discharging cycles maintains sufficient operating temperature with no external source, however high temperatures of up to 350° C are needed initially
• Efficiency ~89-92%; Lifetime up to 15 years • Capacity / Power: from 50 kW / 400 kWh to 8MW / 64MWh• ESA claims in Japan there are > 190 sites totaling 270 MW
Sodium Sulfur Battery (Na-S) Technical OverviewTechnology HighlightsTechnology Highlights
A Na-S battery has high energy density, high efficiency, and long cycle life, and is fabricated from inexpensive materials A Na-S battery has high energy density, high efficiency, and long cycle life, and is fabricated from inexpensive materials
Key PlayersKey Players• DOE funded Demo Project: Pacific Gas & Electric Sodium Sulfur Battery (allows substation
upgrade deferment). Project on hold • DOE funded Demo Project: a 1 MW, 7.2 MWh, NaS BESS at a major Long Island Bus depot facility
(shifts a compressor peak load to off-peak capacity and provides emergency backup power); uses NAS™ Battery (developed jointly by NGK and Tokyo Elec. Power)
• DOE funded Demo Project: Pacific Gas & Electric Sodium Sulfur Battery (allows substation upgrade deferment). Project on hold
• DOE funded Demo Project: a 1 MW, 7.2 MWh, NaS BESS at a major Long Island Bus depot facility (shifts a compressor peak load to off-peak capacity and provides emergency backup power); uses NAS™ Battery (developed jointly by NGK and Tokyo Elec. Power)
Source: DOE, EPRI, Energy Storage Association, Press Releases.
Technology Maturity
R&D CommercialBench-scale
Pilot-scaleDemonstration
19
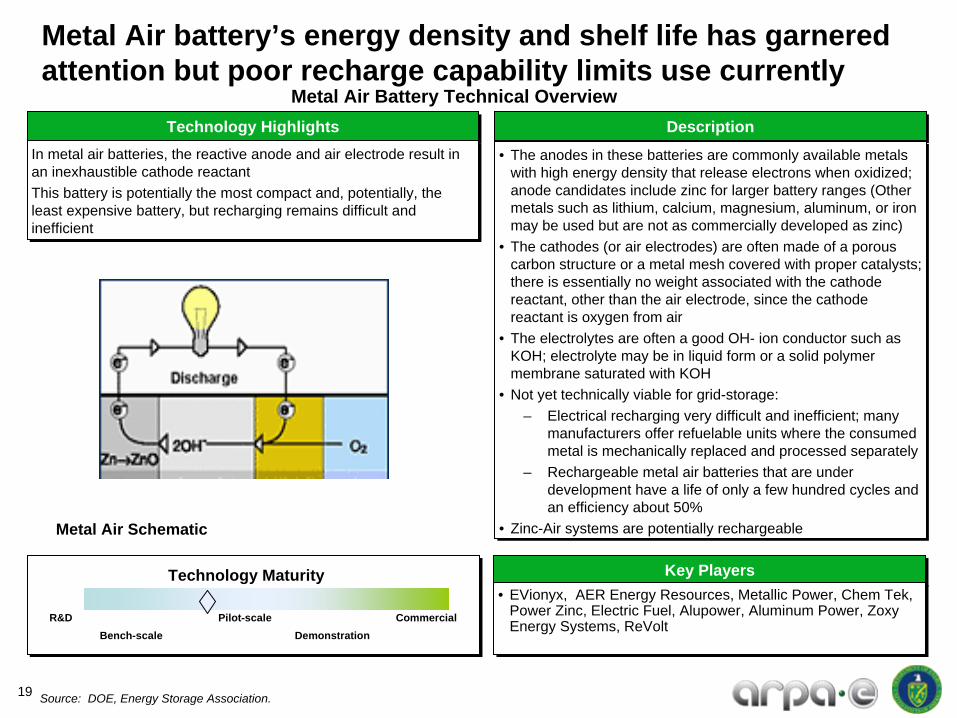
Metal Air battery’s energy density and shelf life has garnered attention but poor recharge capability limits use currently
DescriptionDescription
• The anodes in these batteries are commonly available metals with high energy density that release electrons when oxidized; anode candidates include zinc for larger battery ranges (Other metals such as lithium, calcium, magnesium, aluminum, or iron may be used but are not as commercially developed as zinc)
• The cathodes (or air electrodes) are often made of a porous carbon structure or a metal mesh covered with proper catalysts; there is essentially no weight associated with the cathode reactant, other than the air electrode, since the cathode reactant is oxygen from air
• The electrolytes are often a good OH- ion conductor such as KOH; electrolyte may be in liquid form or a solid polymer membrane saturated with KOH
• Not yet technically viable for grid-storage: – Electrical recharging very difficult and inefficient; many
manufacturers offer refuelable units where the consumed metal is mechanically replaced and processed separately
– Rechargeable metal air batteries that are under development have a life of only a few hundred cycles and an efficiency about 50%
• Zinc-Air systems are potentially rechargeable
Metal Air Battery Technical OverviewTechnology HighlightsTechnology Highlights
In metal air batteries, the reactive anode and air electrode result in an inexhaustible cathode reactant This battery is potentially the most compact and, potentially, the least expensive battery, but recharging remains difficult and inefficient
In metal air batteries, the reactive anode and air electrode result in an inexhaustible cathode reactant This battery is potentially the most compact and, potentially, the least expensive battery, but recharging remains difficult and inefficient
Key PlayersKey Players• EVionyx, AER Energy Resources, Metallic Power, Chem Tek,
Power Zinc, Electric Fuel, Alupower, Aluminum Power, Zoxy Energy Systems, ReVolt
• EVionyx, AER Energy Resources, Metallic Power, Chem Tek, Power Zinc, Electric Fuel, Alupower, Aluminum Power, Zoxy Energy Systems, ReVolt
Source: DOE, Energy Storage Association.
Technology Maturity
R&D CommercialBench-scale
Pilot-scaleDemonstration
Metal Air Schematic

20
Flywheels are used in instances when high power density is required for disruptions lasting seconds to minutes
DescriptionDescription
• A flywheel is a simple form of mechanical (kinetic) energy storage; energy is stored by causing a disk or rotor to spin on its axis; stored energy is proportional to the flywheel’s mass and the square of its rotational speed
• The energy and power characteristics of a flywheel system are more or less independent variables therefore in theory it can be designed for any power and energy combination; in practice, technical limitations such as rotor strength and weight, and resource limitations such as cost limit design characteristics
• In general, flywheels can be classified as low speed with rpm measured in thousands or high speed with rpm measured in the tens of thousands
– Low-speed flywheels are usually made from steel and designed for high-power output
– High-speed flywheels are typically made from carbon or carbon and fiberglass composite materials that will withstand the higher stresses associated with higher rpm
• There are two major avenues of research in flywheel technology at present improved passive magnetic bearings, and improved wheel materials
• Primary cost areas are the rotor materials fabrication and motor generator materials fabrication efficiency
Flywheels Technical OverviewTechnology HighlightsTechnology Highlights
Flywheels are marketed as environmentally safe, reliable, modular, and high-cycle life alternative for uninterruptible power supplies and other power-conditioning equipment designed to improve the quality of power delivered to critical or protected loads
Flywheels are marketed as environmentally safe, reliable, modular, and high-cycle life alternative for uninterruptible power supplies and other power-conditioning equipment designed to improve the quality of power delivered to critical or protected loads
Key PlayersKey Players
• Lawrence Livermore National Laboratories ; Pennsylvania State University; University of Texas
• Beacon Power; Boeing Phantom Works
• Lawrence Livermore National Laboratories ; Pennsylvania State University; University of Texas
• Beacon Power; Boeing Phantom Works
Technology Maturity
R&D CommercialBench-scale
Pilot-scaleDemonstration
Cross-Section Of A Flywheel Module(Courtesy NASA Glenn Research Center)
Source: DOE, EPRI, ESA.

21
Ultracapacitors are an effective way to buffer high power requirements, but still fall short of battery energy levels
DescriptionDescription
• Ultracapacitors’ electric double layer (EDL) is formed between each of the electrodes and the electrolyte ion layers. The distance over which the charge separation occurs is just a few angstroms. The extremely large surface area makes the capacitance and energy density of these devices thousands of times larger than those of conventional electrolytic capacitors
• The electrodes are often made with porous carbon material. • The electrolyte is either aqueous or organic. • Aqueous ultracaps have a lower energy density due to a lower
cell voltage, but are less expensive and work in a wider temperature range.
• Asymmetrical ultracaps use metal for one of the electrodes have a significantly larger energy density than the symmetric ones do and also have a lower leakage current.
• Lower energy density than batteries, but can be cycled 100,000x and are much more powerful than batteries (fast charge and discharge capability).
• Have been used for wind turbine blade-pitch control devices to control the rate at which power increases and decreases with changes in wind velocity.
Ultracapacitors Technical OverviewTechnology HighlightsTechnology Highlights
•Ultracapacitors are two series capacitors with an electric double layer (EDL) of very high surface area. These systems have 100,000x energy density over standard capacitors, beginning to approach lithium ion batteries. Their widespread use is hampered by self discharge and cost issues.
•Ultracapacitors are two series capacitors with an electric double layer (EDL) of very high surface area. These systems have 100,000x energy density over standard capacitors, beginning to approach lithium ion batteries. Their widespread use is hampered by self discharge and cost issues.
Key PlayersKey Players• Maxwell, Kwanwa. • Maxwell, Kwanwa.
Source: ESA.
Technology Maturity
R&D CommercialBench-scale
Pilot-scaleDemonstration
Ultracapacitor Overview Schematic
22
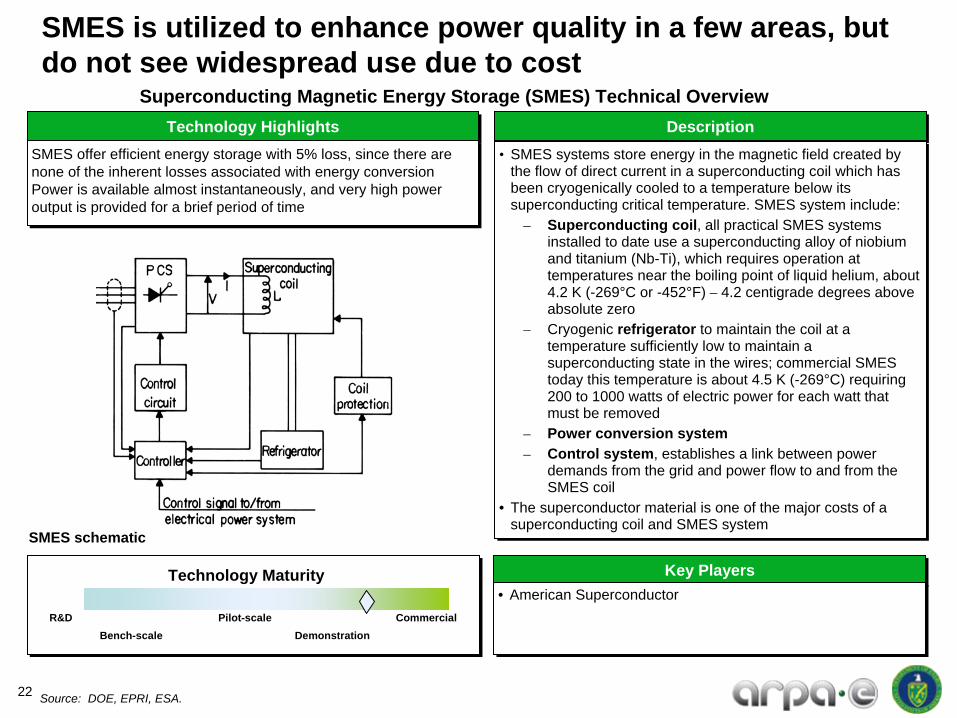
SMES is utilized to enhance power quality in a few areas, but do not see widespread use due to cost
DescriptionDescription
• SMES systems store energy in the magnetic field created by the flow of direct current in a superconducting coil which has been cryogenically cooled to a temperature below its superconducting critical temperature. SMES system include:
– Superconducting coil, all practical SMES systems installed to date use a superconducting alloy of niobium and titanium (Nb-Ti), which requires operation at temperatures near the boiling point of liquid helium, about 4.2 K (-269°C or -452°F) – 4.2 centigrade degrees above absolute zero
– Cryogenic refrigerator to maintain the coil at a temperature sufficiently low to maintain a superconducting state in the wires; commercial SMES today this temperature is about 4.5 K (-269°C) requiring 200 to 1000 watts of electric power for each watt that must be removed
– Power conversion system– Control system, establishes a link between power
demands from the grid and power flow to and from the SMES coil
• The superconductor material is one of the major costs of a superconducting coil and SMES system
Superconducting Magnetic Energy Storage (SMES) Technical OverviewTechnology HighlightsTechnology Highlights
SMES offer efficient energy storage with 5% loss, since there are none of the inherent losses associated with energy conversion Power is available almost instantaneously, and very high power output is provided for a brief period of time
SMES offer efficient energy storage with 5% loss, since there are none of the inherent losses associated with energy conversionPower is available almost instantaneously, and very high power output is provided for a brief period of time
Key PlayersKey Players• American Superconductor• American Superconductor
Source: DOE, EPRI, ESA.
Technology Maturity
R&D CommercialBench-scale
Pilot-scaleDemonstration
SMES schematic

23
Defining the need for storage
Possible storage solutions
Energy Storage Technologies
Key Findings Summary

24
Our first breakout sessions was devoted to large-scale energy management technologies
• Compressed Air Energy Storage (CAES)– Chair: Georgianne Peek, Sandia
• Bulk Electrochemical Storage: Liquid metal/flow batteries/metal air)– Chair: John Boyes, Sandia
• Advanced Batteries: Advanced Li-ion/NiCd/Pb-Acid/beyond Li-Ion)– Chair: Ali Nourai, AEP
• Other Bulk Storage Approaches: Underground Pumped Hydro/Chemical Storage– Chair: Klaus Lackner, Columbia University
• Power Conditioning Systems and Balance of Plant– Chair: Brad Roberts, ESA

25
Whereas our second round of breakout sessions focused on high power applications necessary for seconds-to-minutes management
• Bulk Electrochemical Storage: Liquid metal/flow batteries/metal air)Chair: Ali Nourai, AEP
• Advanced Batteries: Advanced Li-ion/NiCd/Pb-Acid/beyond Li-Ion)– Chair: John Boyes, Sandia
• Ultracapacitors/SMES– Chair: Dan Rastler, EPRI
• Flywheels and Other Power Focused Storage Applications– Chair: Haresh Kamath, EPRI

26
Each breakout session was asked to answer a list of questions about their candidate technologies for discussion with the group
Key questions for each technology breakout session:
• Highest ARPA-E mission impact storage applications and why– Reduction of energy-related emissions, including greenhouse gases– Improvements in efficiency of power generation and delivery– U.S. technological lead
• Required performance and cost for significant deployment in these applications vs state of the art
• Key technical and cost barriers/challenges• Promising emerging technology opportunities/approaches to overcome
barriers• “Holy grails”/grand challenges that if solved would be game changers• Existing funding gaps (government, private investors, corporate R&D)
– Development stage gaps, Technology funding gaps• Ideal roles of ARPA-E vs Office of Electricity @ DOE• Level of development required for private sector hand-off• Required levels of funding for meaningful progress
– Proof of Concept– Meaningful prototype (scale?)– Meaningful small-scale demonstration

27
Workshop participants agreed on the general cost and performance metrics for any future ARPA-E Grid Storage Programs
General Metrics to Evaluate Grid Scale Energy Storage Projects
• Performance Metrics– Multi-hour storage for energy, seconds to minutes for power – High cycle efficiency, – Peak power capability, – Cycle life, – Calendar life, – Operation at temperature ext.
• Cost Metrics– $/kWh cycled (over lifetime)– $/kW*h, capital cost– Total lifecycle cost
• How to measure R&D program successes– Include market pull as requirement in proposals– Build national utility scale testbed- badly needed– Understand storage reduction of GHG if charged with coal

28
For new technologies to be adopted however, the members urged consideration of the whole grid storage development landscape
Technology ChallengesNew Storage
Risks Cost MetricsIndustry Requirements Stakeholders
– Technical– Identification of
Risk Levels– Mitigation
Activities• Prototype• Fabrication• Testing
– Risk Impacts
– Capital Costs– Construction
Costs– Operations– Maintenance– Life Cycle– Schedule
Analysis– Cost Sharing
– Power Quality– Power Storage
Time– Life Cycle– Technical
Parameters– Gov’t/ Industry
Partnership
– Regulators– RTO/ISO– Environment– FERC– DOE– Industry
First-of-a-kind (FOAK) Storage
Demonstration Plant(Usually administered
Through DOE/OE)
Energy Storage
– Performance Metrics– Reliability– Availability
New Drivers– Climate Bill/Law– Executive
Order (Calif.)– National
Security– NIST Standards

29
Many participants concurred with the EPRI goals/opportunities for grid energy storage paradigms
Flow Battery
Li-Ion Battery
NaS Battery
Pumped Hydro
CAES Ultra Capacitors
SMES Flywheels
•Footprint Optimized for Site
•Double Energy Density
•Reduce Permitting Issues
• Reduce Capital Operating and Maintenance Costs over 20 years
• Incorporate Thermal Management into design
• Optimize Electrolyte concentration with Electrode surface area
• Improved Electrolyte
• Improved Anode and Cathodes
• Reduce Content of Cobalt and graphite
• Improve Safety
•Scale-Up
• Lower cost of chrome plating for battery can and/or go from aluminum to steel casing
• Beta Alumina Tube: Improve Characteristi cs
• Improve cell seal: ceramic to metal bond
• Lower investment costs
• Reduced environment al impact
• Machinery- Apply Higher temperature expansion turbines to CAES (go from 2100F to 2500 F)
• Above ground piping
• Demo surface DR CAES Systems
• Reduce cost of piping and potential corrosion of high pressure pipe systems
• Develop nano-carbon materials to increase carbon surface area
• Increase cell voltage (from 2.5 to 3V to twice that)
• Increase Superconduc tor temperature
• Friction Reduction, joint durability
• New materials for reduced friction
• Flywheel tipspeed control
Source: Daniel Rastler, Market Driven Distributed Energy Storage System Requirements for Load Management Applications, EPRI, 2006.
Grid Storage Energy System Requirements

30
Finally, the group applauded the efforts of the AEP Storage Group for their efforts to define residential storage standards
• At current renewable generation growth rates, residential storage is forcasted to see wide deployment within five years
• No standards of performance are currently established/accepted by industry, but will be required for broad adoption
– Standards development for energy storage should be pursued by DOE
Target cost parameters are $1000/kW and $500/kWh
Key Parameters ValuePower 25 kVAEnergy 50kWhVoltage 120/240 VRound Trip Energy Efficiency >85%
Source: American Electric Power, “Functional Specification for Community Energy Storage (CES) Unit.”, available at www.aeptechcenter.com/ces.
AEP Guidelines for Residential Energy Storage
Similar guidelines are needed in other storage sectors

31
The participants also described enabling technologies and high-risk concepts that would greatly advance grid scale energy storage
• Reliable, inexpensive, rechargable metal-air batteries, • Fuel as electrical storage media • Electrochemical conversion to methanol• Thermal storage cycles • Economically viable Ericsson cycles for storage• Storage system scalability• Organic active materials for flow batteries.• Algae farms growing carbon electrodes• Hybrid supercaps to provide hours of energy • Multiple platforms vehicle + grid• Combine thermal + electrical storage• Integrated renewable production (wind + storage + engine)• Seasonal power storage• Better balance of plant electronics• More focus on Molten Salt Systems
A 34-MW, 245-MWh NaS battery installation.
32
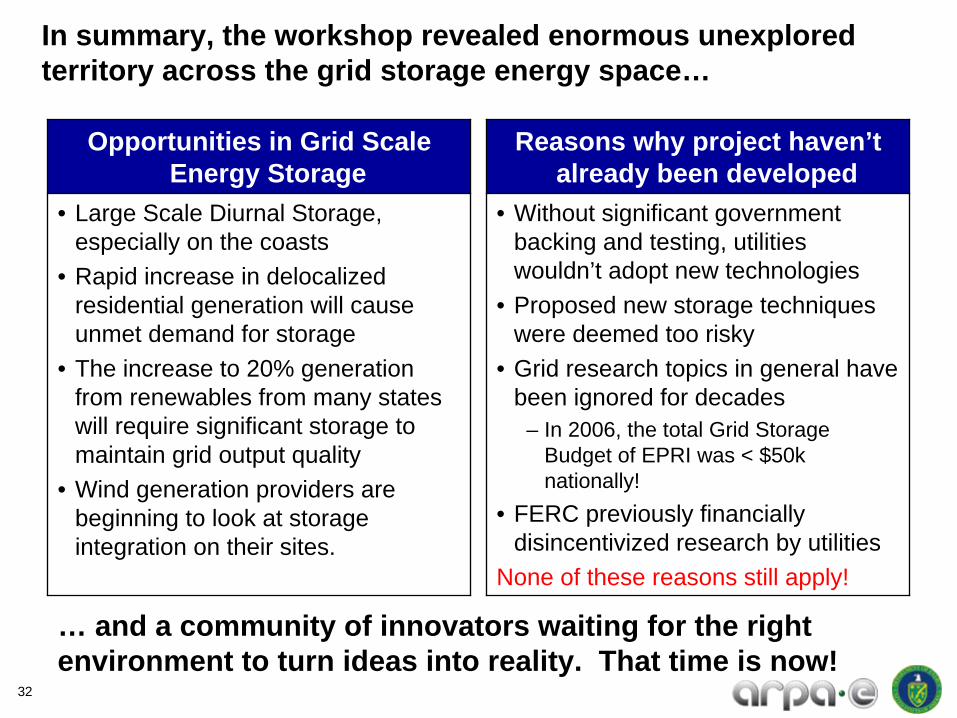
In summary, the workshop revealed enormous unexplored territory across the grid storage energy space…
Opportunities in Grid Scale Energy Storage
• Large Scale Diurnal Storage, especially on the coasts
• Rapid increase in delocalized residential generation will cause unmet demand for storage
• The increase to 20% generation from renewables from many states will require significant storage to maintain grid output quality
• Wind generation providers are beginning to look at storage integration on their sites.
Reasons why project haven’t already been developed
• Without significant government backing and testing, utilities wouldn’t adopt new technologies
• Proposed new storage techniques were deemed too risky
• Grid research topics in general have been ignored for decades
– In 2006, the total Grid Storage Budget of EPRI was < $50k nationally!
• FERC previously financially disincentivized research by utilities
None of these reasons still apply!
… and a community of innovators waiting for the right environment to turn ideas into reality. That time is now!