Embed Size (px)
Citation preview

Techniques and Tools for
A Coherent Discussion About Performance
in Complex Systems

Performance Must MatterFirst it must be made relevant.
Then it must be made important.

If you don’t care about PerformanceYou are in the wrong talk.
@postwait should throw you out.
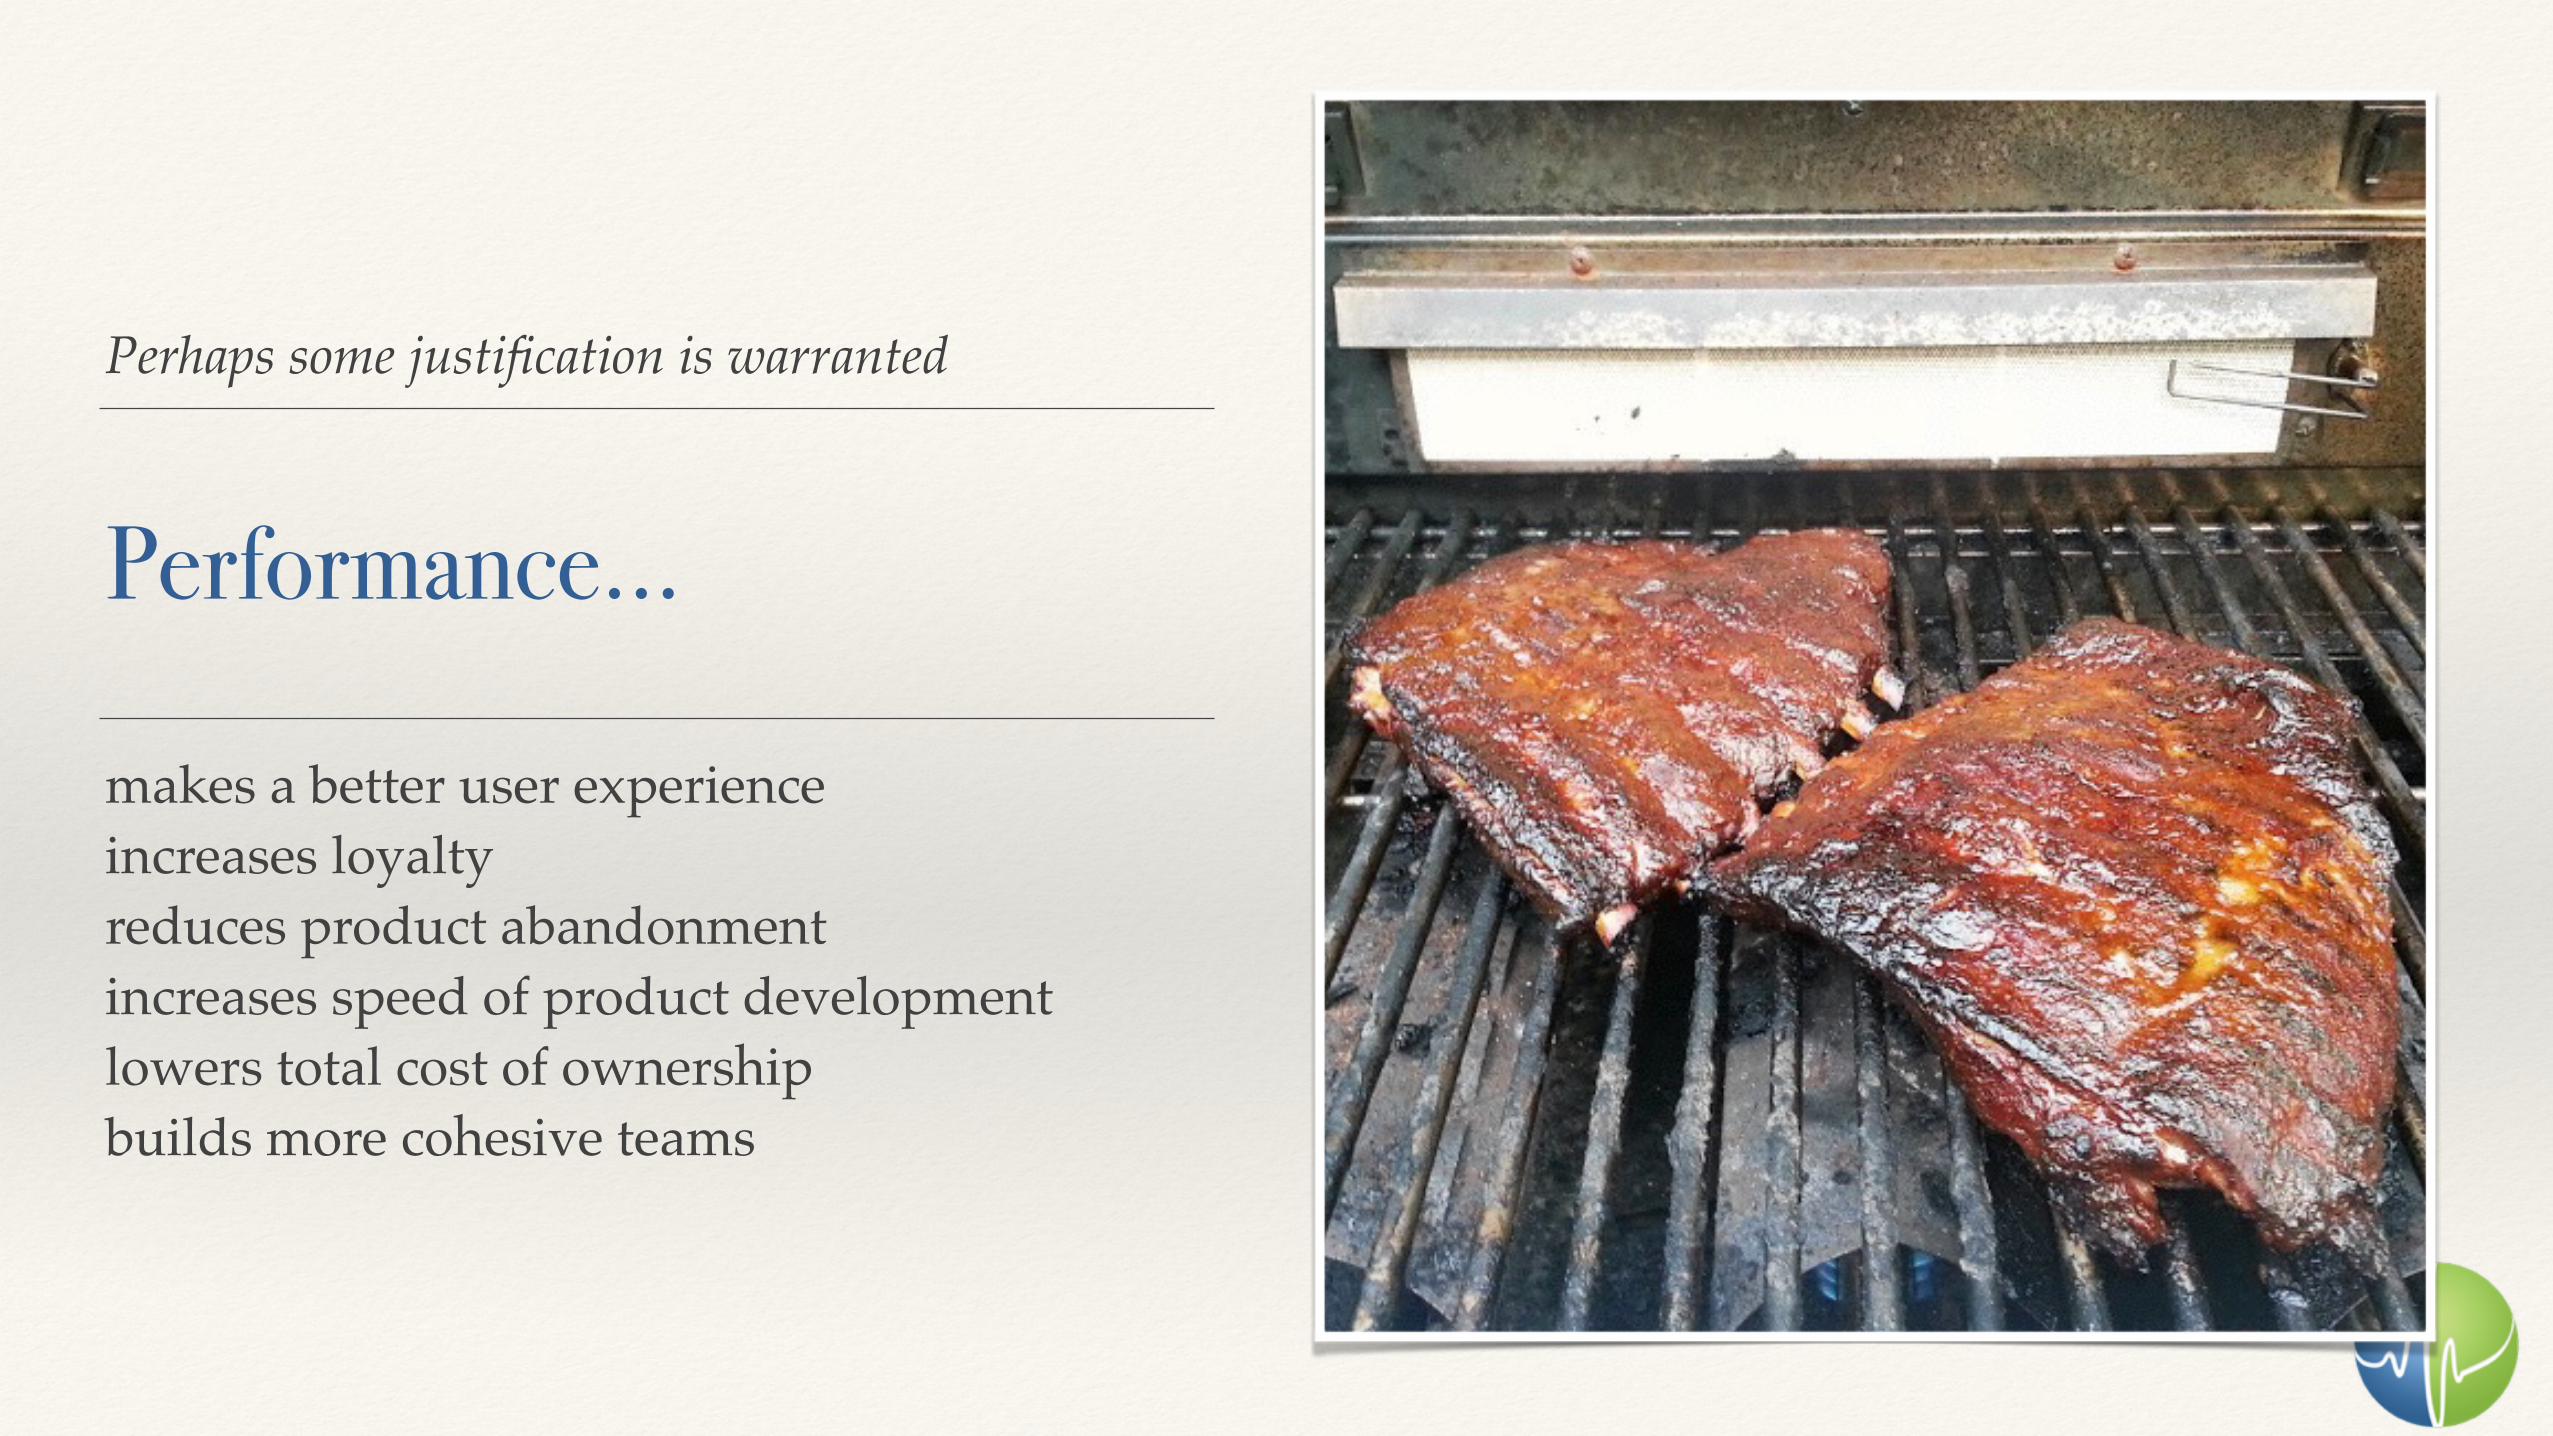
Perhaps some justification is warranted
Performance…
makes a better user experienceincreases loyaltyreduces product abandonmentincreases speed of product developmentlowers total cost of ownershipbuilds more cohesive teams
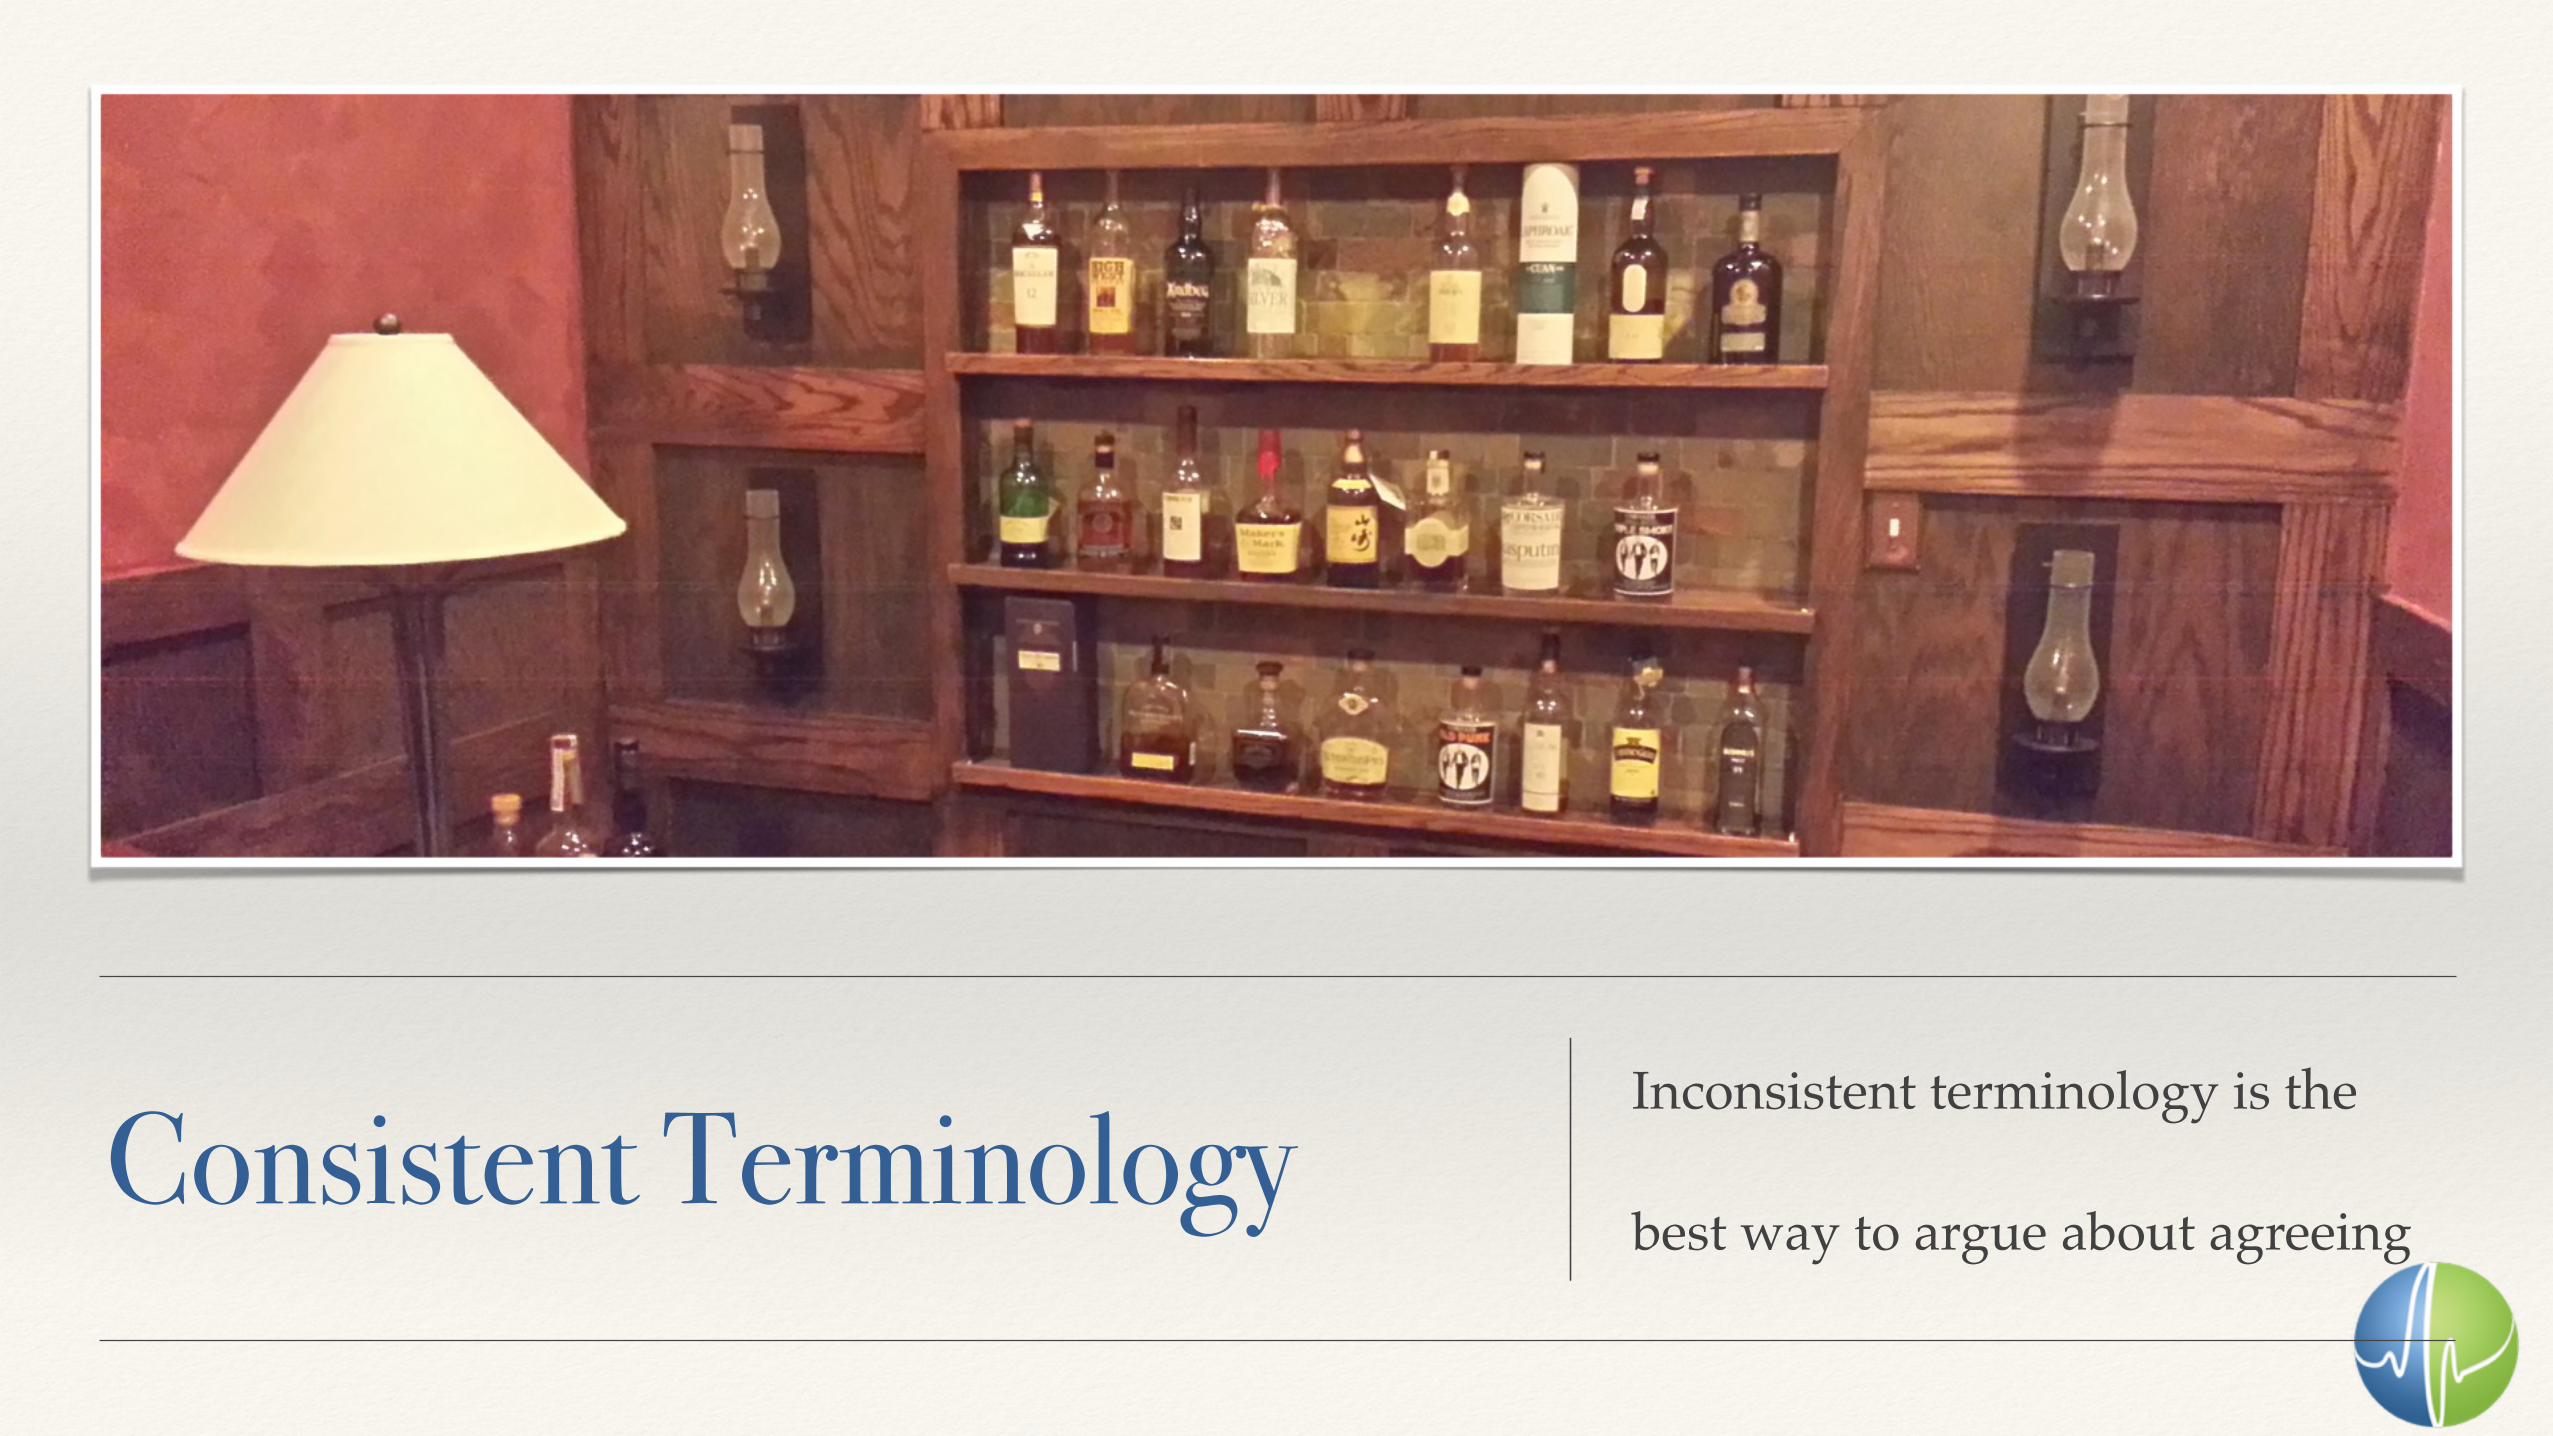
Consistent TerminologyInconsistent terminology is the
best way to argue about agreeing

It’s all about latency…
Throughput vs. Latency
Lower latency often affords increased throughput.
Latency is the focus.
https://www.flickr.com/photos/poeloq/3140100971

Generally, time should be measured in seconds.UX latency should be in milliseconds.
Time
Users can’t observe microseconds.
Users quit over seconds.
Users experience is measured in milliseconds. (with at least microsecond precision)

Music is all about the space between the notes.
Connectedness
Performance is about how quickly you can complete some work.
In a connected service architecture, performance is also about the time spent between the service layers.

Developing a
Performance Culture
It is easy to develop a ratherunhealthy performance culture.

Focus on
Small Individual Wins
https://www.flickr.com/photos/skynoir/8783914886

Report on and celebrate
Large Collective Wins
https://www.flickr.com/photos/tomer_a/1130647512

Transcendant ToolingTooling must transcend the team
and keep consistent conversation
https://www.flickr.com/photos/meanestindian/2260343214

Large-Scale Distributed Systems Tracing Infrastructure
Dapper
Google published a paper:
research.google.com/pubs/pub36356.html
As usual, code never saw the outside.

Large-Scale Distributed Systems Tracing Infrastructure
Dapper
Google published a paper:
research.google.com/pubs/pub36356.html
As usual, code never saw the outside.
web apidata agg
mq
db
data store
cep
alerting

The Basics
❖ Focused on User Interactions (not req.)
❖ Each new request is assigned a “Trace ID”
❖ The service records start/stop/etc. against a “Span ID” (first Span ID == Trace ID)
❖ In the context of a “Span ID”, each remote call get’s a new Span ID, with the Parent Span ID set to the context.

ExampleWeb Request: /do/magic(no X-B3-TraceId header)Creates TraceId T1, SpanId T1
Notes “sr” (server receive)needs to tall to service MSCreates new SpanId T2
Notes “cs” (client send)Request to MS
Notes “cr” (client receive)Notes “ss” (server send)Sends responseAsync publish span(s)
GET /pixie/dustX-B3-TraceId: T1
X-B3-ParentSpanId: T1
X-B3-SpanId: T2
Extracts headersNotes “sr” (server receive)performs actionsNotes “ss” (server send)RespondsAsync publish span(s)
Scribe

Visualization
service1
service2
sr
sr ss crcs
ss
cs? cr?
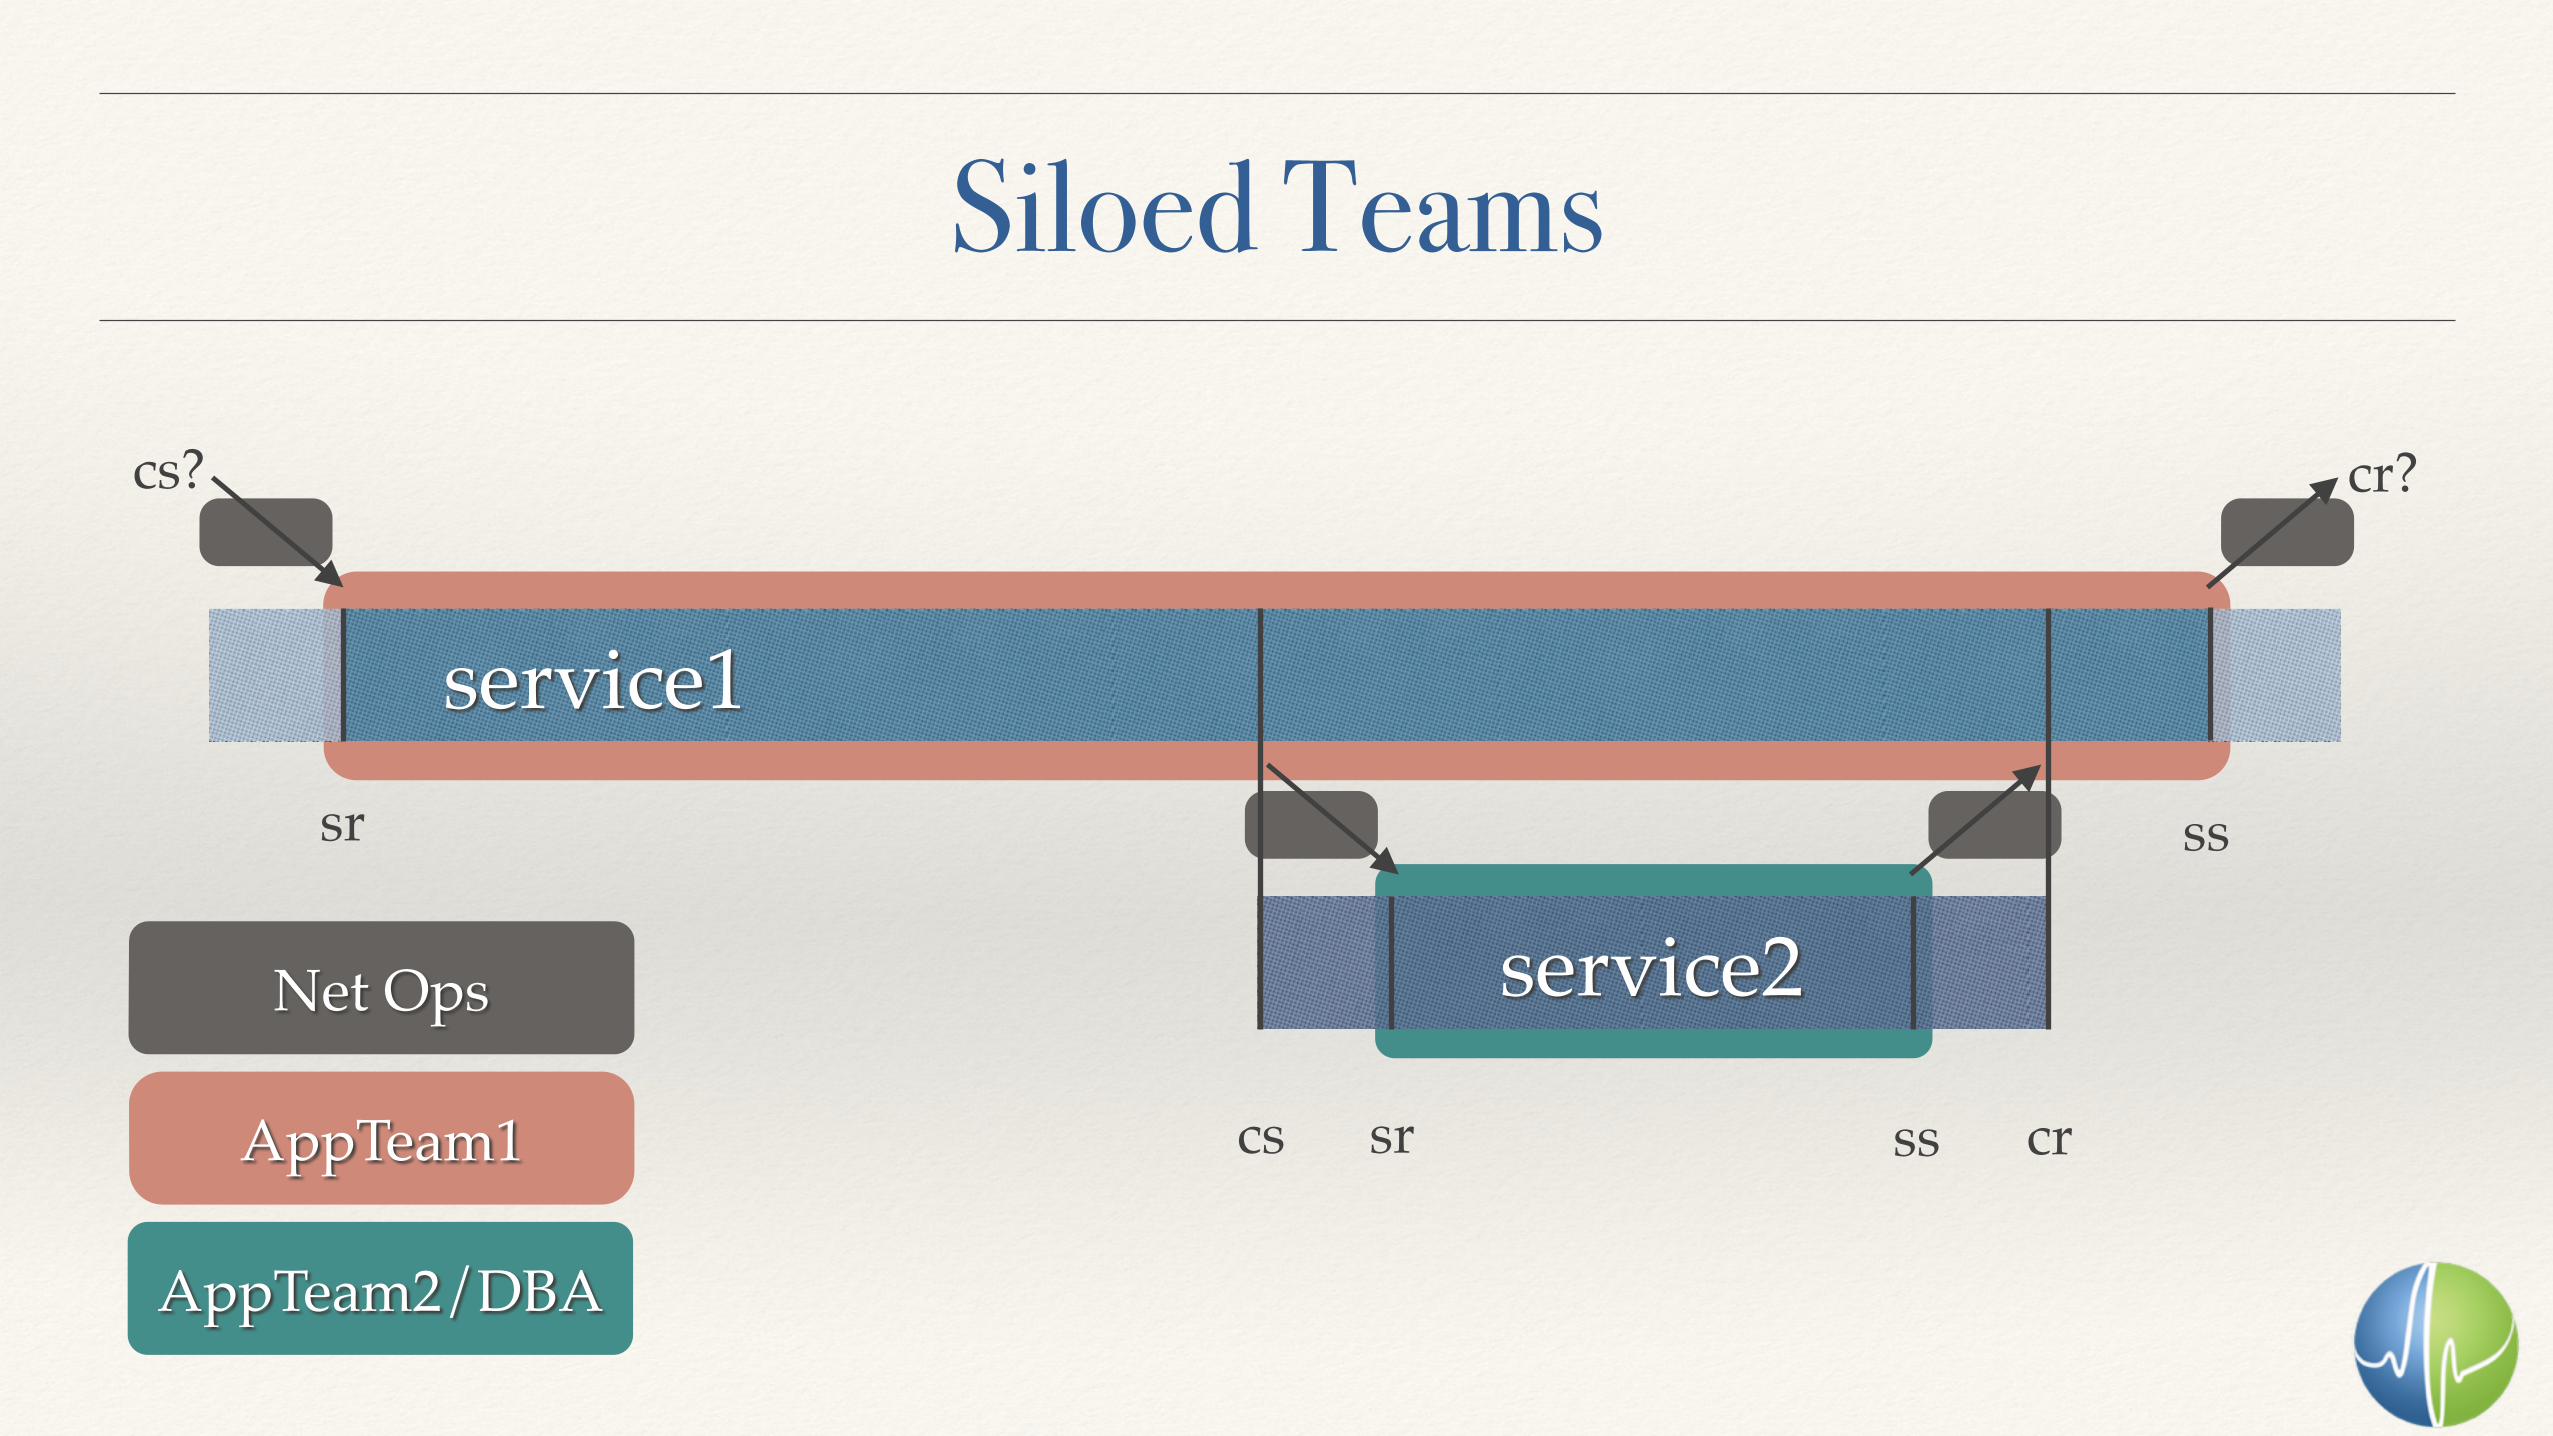
Siloed Teams
service1
service2
sr
sr ss crcs
ss
cs? cr?
Net Ops
AppTeam1
AppTeam2/DBA
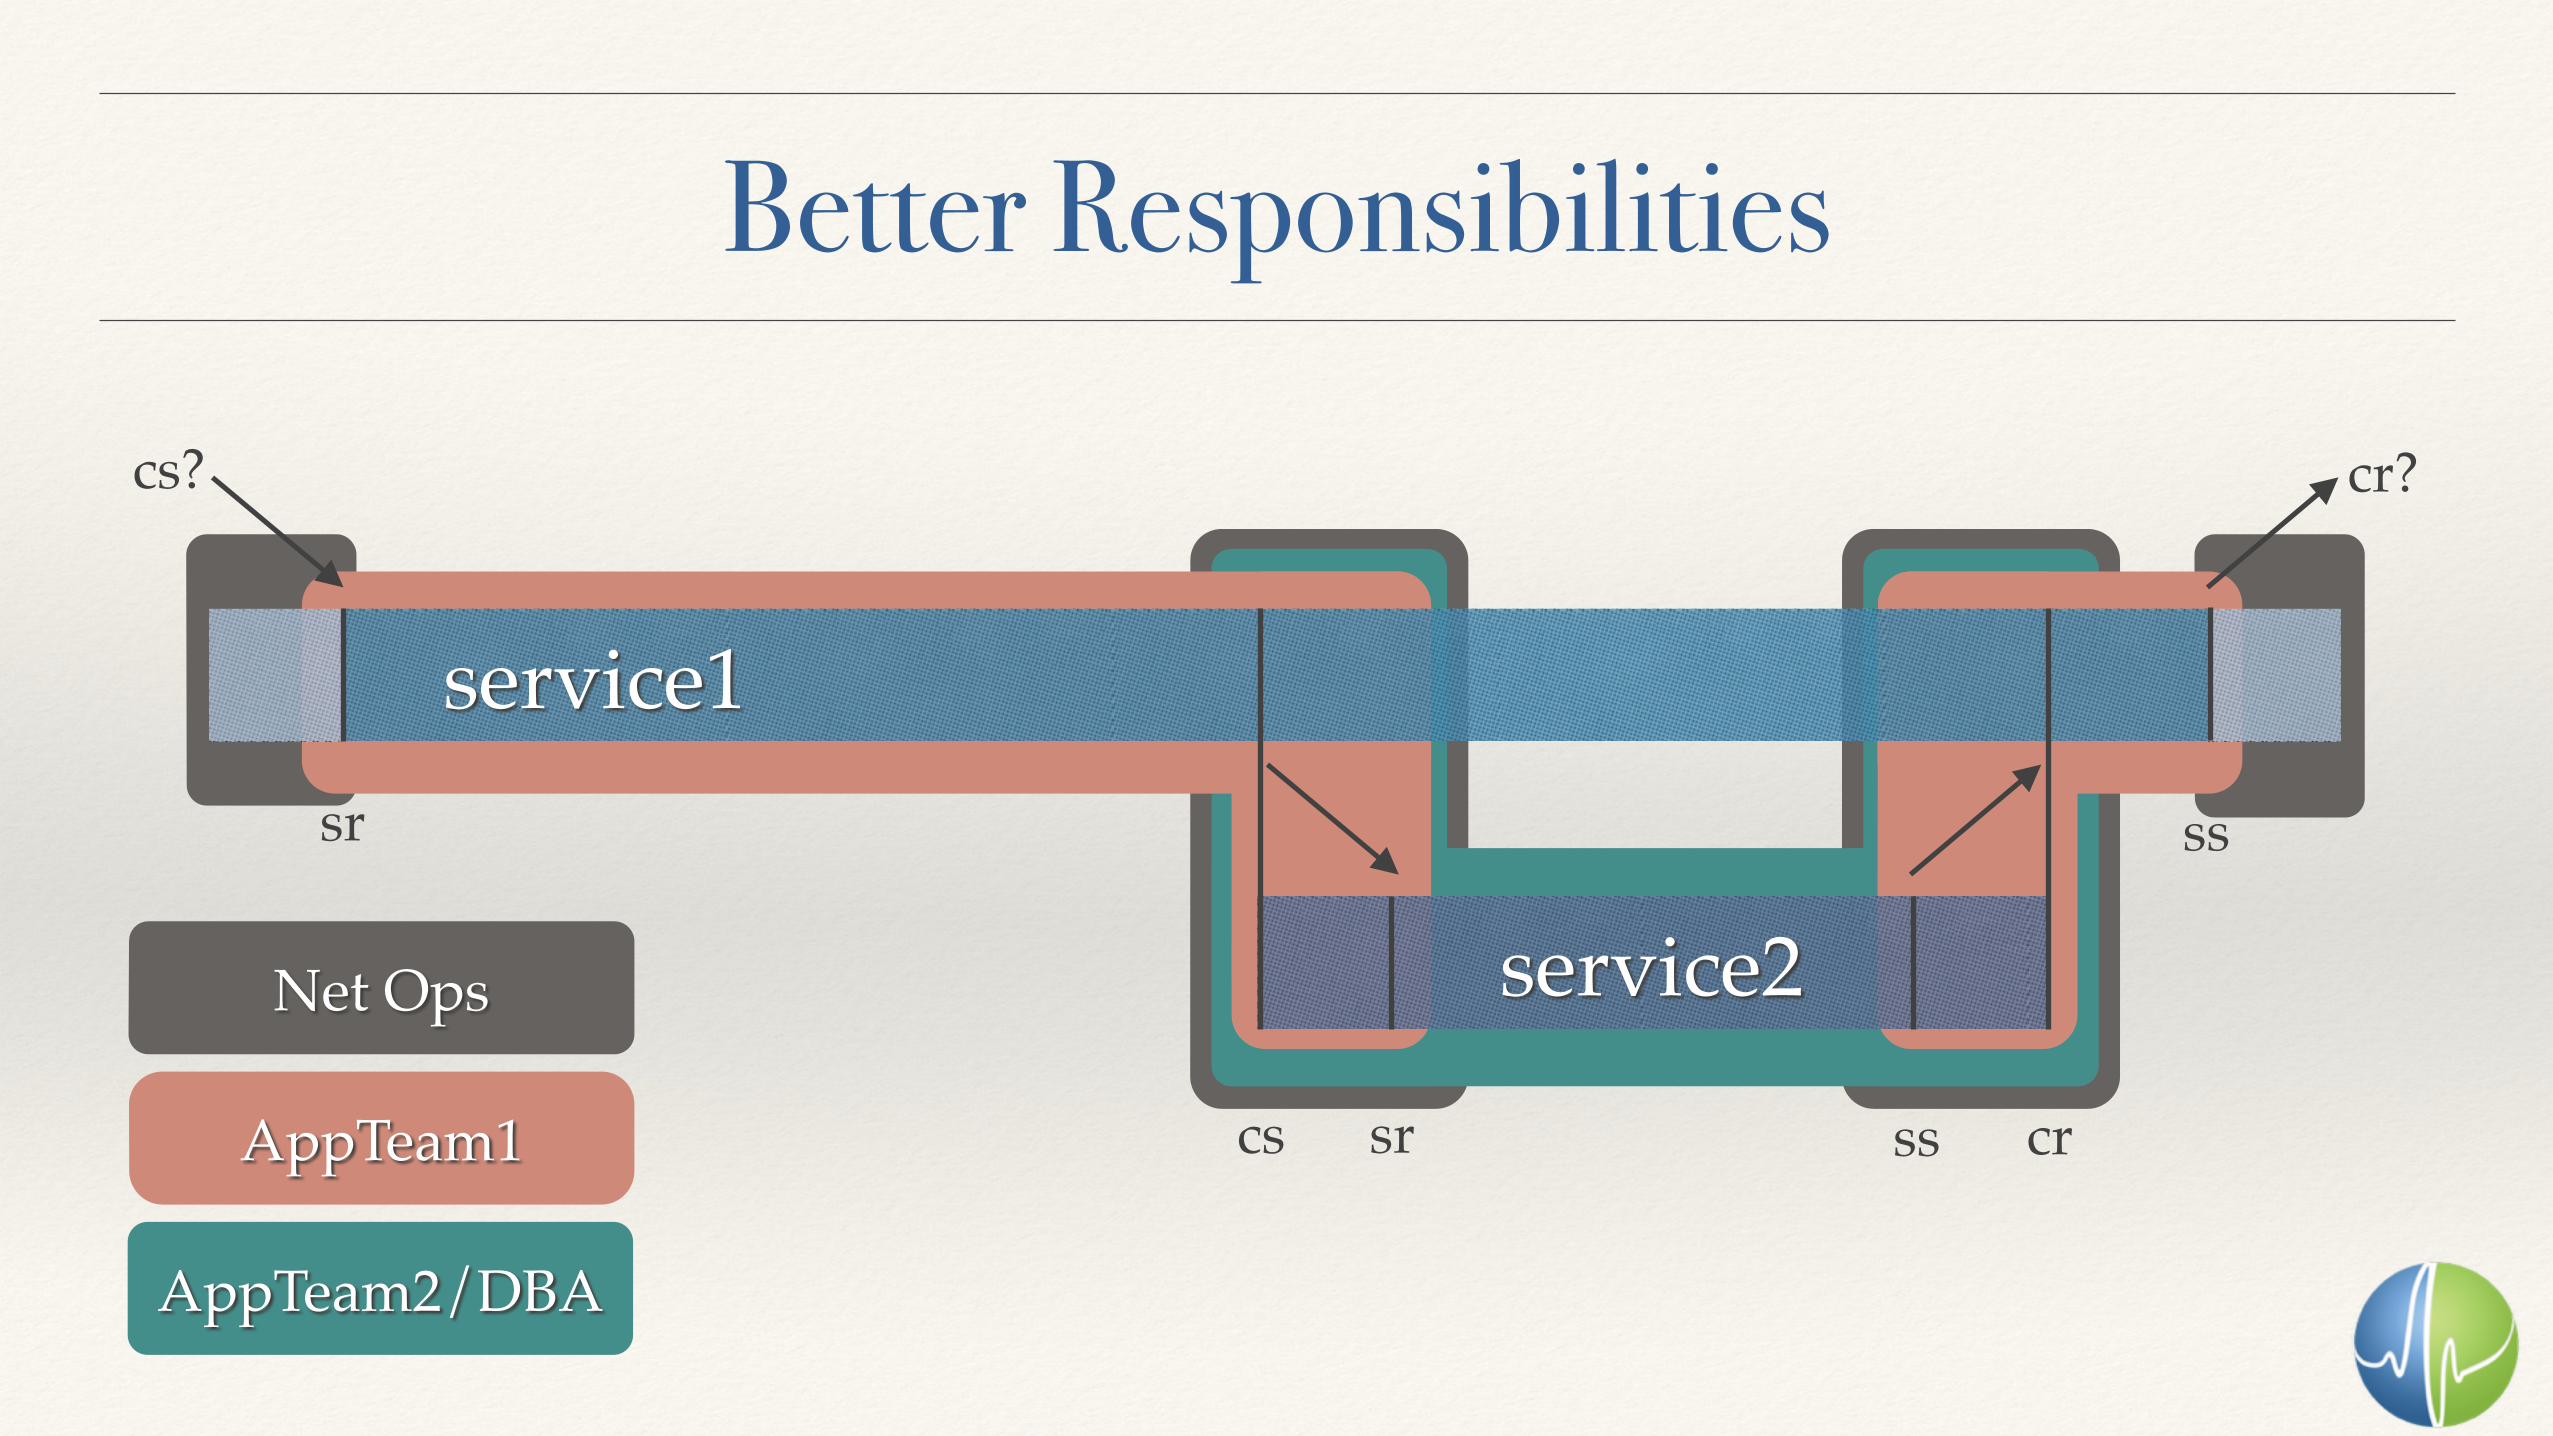
Better Responsibilities
service1
service2
sr
sr ss crcs
ss
cs? cr?
Net Ops
AppTeam1
AppTeam2/DBA

A pseudo-Dapper
Zipkin
Twitter sought to (re)implement Dapper.
Disappointingly few improvements.
Some unfortunate UX issues.
Sound. Simple. Valuable.

Thrift and Scribe should both die.
Scribe is Terrible
Terrible. Terrible Terrible.
Thrift is terrible.
Scribe is “strings” in Thrift.
Performance focused people don’t use strings.


The whole point is to be low overhead
Screw Scribe
We push raw thrift over Fq github.com/circonus-labs/fq
Completely async publishing, lock free if using the C library.
Consolidating Zipkin’s bad decisions:github.com/circonus-labs/fq2scribe

Telling computers what to do.
Zipkin is Java/Scala
Wrote C support:github.com/circonus-labs/libmtev
Wrote Perl support:github.com/circonus-labs/circonus-tracer-perl

Real world
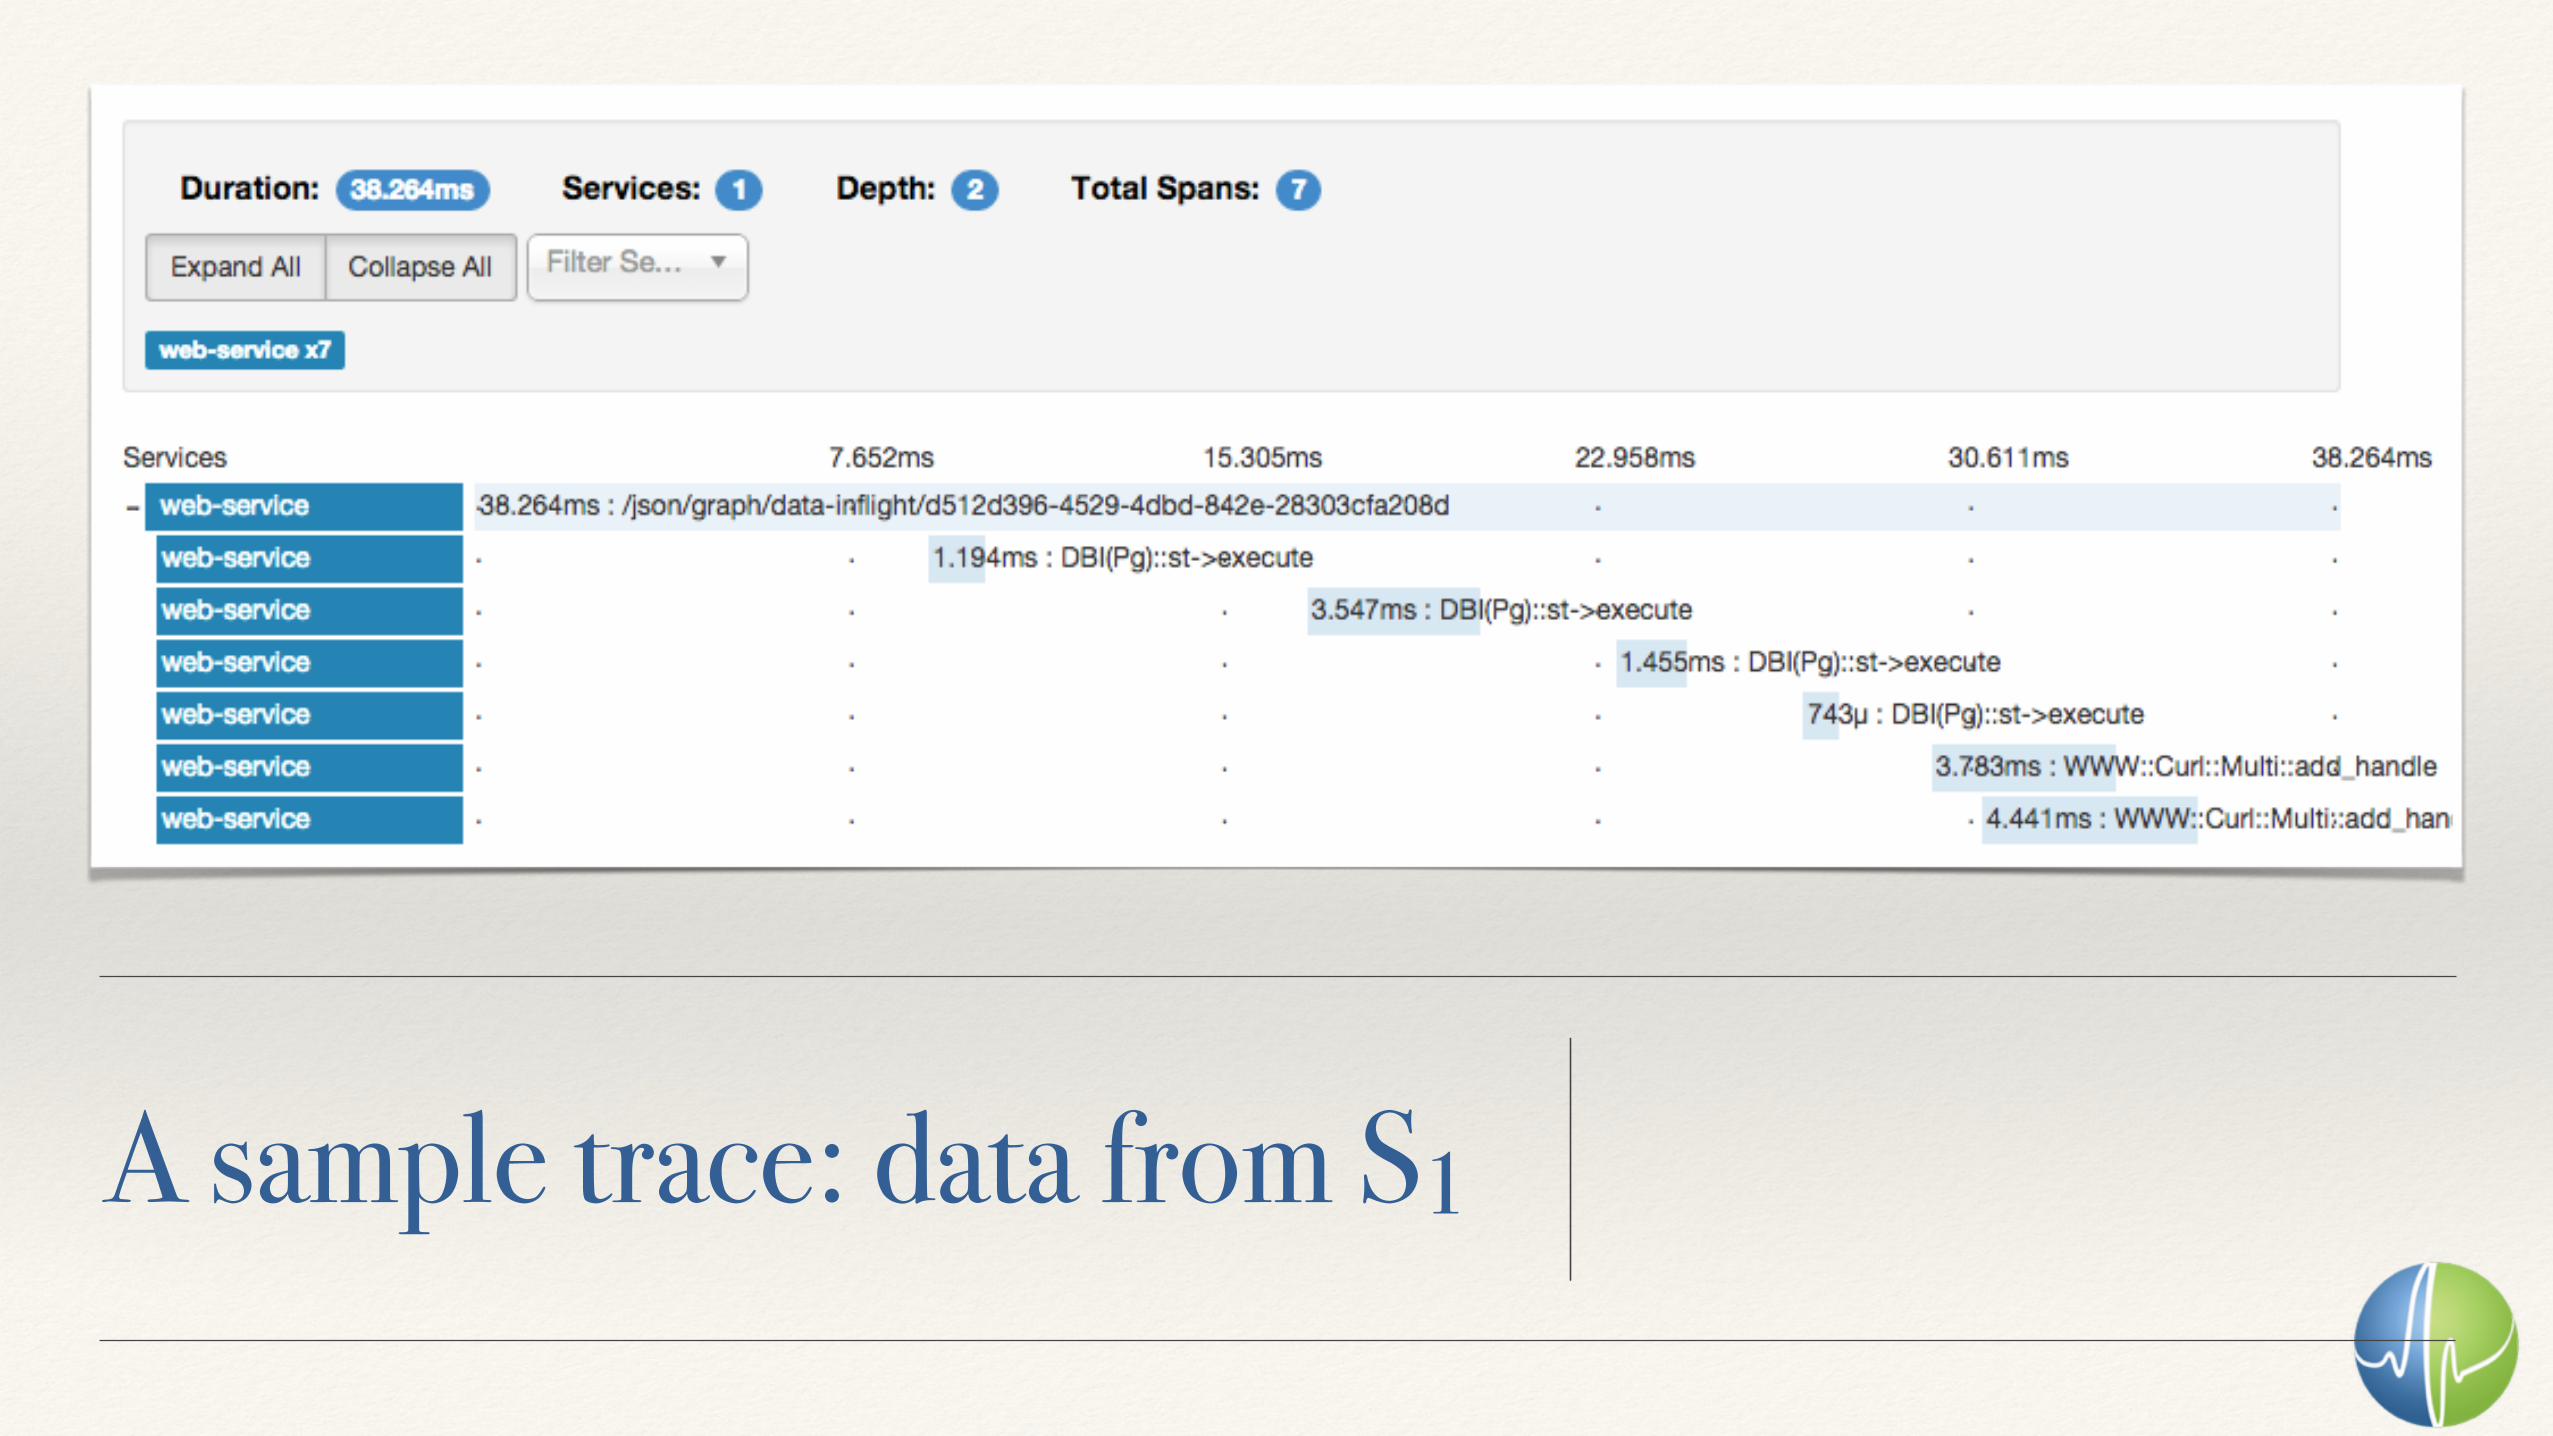
A sample trace: data from S1


A sample trace: data from S2


Celebration
Day 1
Noticed unexpected topology queries.
Found a data location caching issue.
Shaved 350ms off every graph request.

Celebration
Day 4-7
Noticed frequent 150ms stalls in internal REST.
Often: 90%+
Found a libcurl issue (async resolver).
Shaved 150ms*(n*0.9) off ~50% of page loads.

You can do all of this at work.
Go To WorkAnd have a deeply technical cross-team conversation about performance
Future
IPv6 piggy-backing
audit or ld/preload libs
nanosecond granularity
cap-n-proto + UDP reporting
https://www.flickr.com/photos/robin1966/16188457397

Thanks!