Embed Size (px)
Citation preview

October 2016
Data Integrity and Control in Financial Services 2016
Workiva Vendor Highlights
Independent research by
2© Copyright Chartis Research Ltd 2016. All Rights Reserved
About Chartis
Chartis is the leading provider of research and analysis on the global market for risk technology. It is part of Incisive Media which owns market-leading brands such as Risk and Waters Technology. Chartis’s goal is to support enterprises as they drive business performance through better risk management, corporate governance and compliance and to help clients make informed technology and business decisions by providing in-depth analysis and actionable advice on virtually all aspects of risk technology. Areas of expertise include:
• Credit risk
• Operational risk and governance, risk and compliance (GRC)
• Market risk
• Asset and liability management (ALM) and liquidity risk
• Energy and commodity trading risk
• Financial crime including trader surveillance, anti-fraud and anti-money laundering
• Cyber risk management
• Insurance risk
• Regulatory requirements including Basel 2 / 3, Dodd-Frank, EMIR and Solvency II
Chartisissolelyfocusedonriskandcompliancetechnologygivingitsignificantadvantageovergeneric market analysts.
Chartis has brought together a leading team of analysts and advisors from the risk management and financialservicesindustries.Thisteamhashands-onexperienceofimplementinganddevelopingriskmanagement systems and programs for Fortune 500 companies and leading consulting houses.
Visit www.chartis-research.com for more information.
Join our global online community at www.risktech-forum.com.
© Copyright Chartis Research Ltd 2016. All Rights Reserved. Chartis Research is a wholly owned subsidiary of Incisive Media Ltd.
No part of this publication may be reproduced, adapted, stored in a retrieval system or transmitted in any form by any means, electronic, mechanical, photocopying, recording or otherwise, without the prior permission of Chartis Research Ltd.
The facts of this report are believed to be correct at the time of publication but cannot be guaranteed.
Please note that the findings, conclusions and recommendations that Chartis Research delivers will be based on information gathered in good faith, whose accuracy we cannot guarantee. Chartis Research accepts no liability whatever for actions taken based on any information that may subsequently prove to be incorrect or errors in our analysis. See Chartis ‘Terms of Use’ on www.chartis-research.com.
RiskTech100®, RiskTech Quadrant®, FinTech Quadrant™ and The Risk Enabled Enterprise® are Registered Trade Marks of Chartis Research Limited.
Unauthorized use of Chartis’s name and trademarks is strictly prohibited and subject to legal penalties.
3© Copyright Chartis Research Ltd 2016. All Rights Reserved
Table of contents
Executive summary ................................................................................................................................. 5
Workiva: Vendor highlights .................................................................................................................... 6
Context .................................................................................................................................................. 10
Supply-side analysis .............................................................................................................................. 12
Appendix A: FinTech QuadrantTM methodology .................................................................................. 14
How to use research and services from Chartis .................................................................................... 20
Further reading ...................................................................................................................................... 22

4© Copyright Chartis Research Ltd 2016. All Rights Reserved
List of figures & tables
Figure 1: FinTech QuadrantTM for data integrity and control solutions ...................................................7
Figure 2: Chartis FinTech QuadrantTM research process ........................................................................15
Figure 3: Chartis FinTech QuadrantTM ...................................................................................................16
Table 1: Workiva – company information ...............................................................................................6
Table 2: Completeness of offering – Workiva .........................................................................................8
Table 3: Market potential – Workiva .......................................................................................................8

5© Copyright Chartis Research Ltd 2016. All Rights Reserved
Executive summary
This report provides an independent evaluation and description of Workiva’s leading practices and competitive position. Our analysis is based on information in the Chartis report Data Integrity and Control in Financial Services 2016, and our FinTech QuadrantTM for data integrity and control.
We categorize Workiva as a vendor that focuses primarily on data presentation and reporting and end-user monitoring, activity and control (see vendor categories on page 12).
This report also includes brief coverage of:
• The main demand-side trends in this nascent market, with an analysis of the key business and regulatory challenges.
• The supply-side dynamics, with a focus on the vendor landscape for data integrity and control solutions.
Dataintegrityhasnowbecomeacriticalconsiderationinthefinancialservices(FS)sector,asreducedprofitmargins,regulatorypressureandtheexplosionofdatathreatentooverwhelmcurrentapproachestotheissue.Forseveralinternalandexternalreasons,financialinstitutions(FIs)nowneedhigher quality data and better processes to analyze it. Technology budgets are tight, however, and FIs have to get more out of their current infrastructure. Boosted by advances in technology such as low-cost computing, an emerging sector of solutions is starting to address this need.
Largelyasaresultofthesefactors,Chartisnowdefines‘dataintegrityandcontrol’asacategoryoftechnology solutions in its own right. In our view, the data integrity value chain for FIs has six distinct elements:
• Matching
• Quality
• Consistency
• Transformation
• Integrity
• Distribution
Key dynamics in the market and in enterprises are creating demands for new and enhanced capabilities across the data integrity value chain. Vendors will attempt to address these, either directly or through a combination of offerings. This is a fertile market, and one that will experience several important and notable shifts in the coming months and years.

6© Copyright Chartis Research Ltd 2016. All Rights Reserved
Workiva: Vendor highlights
Company information
Table 1 summarizes the key facts about Workiva and its offerings in the market for data integrity and control solutions.
Table 1: Workiva – company information
Company: Workiva Inc.
Headquarters: Ames, Iowa (US)Other offices: Employs1,200peopleatofficesacross16citiesDescription: A provider of enterprise cloud solutions for improving productivity,
accountability and insight in business dataServices / offerings: Workiva offers the Wdeskplatformtoenablefirmstocontrol,
monitor and understand business data with a single source.
Along with banking, Wdesk is utilized by customers in industries including government, insurance, investments and technology.
Over 2,550 customers in 120 countries use Wdesk.
Competitive position
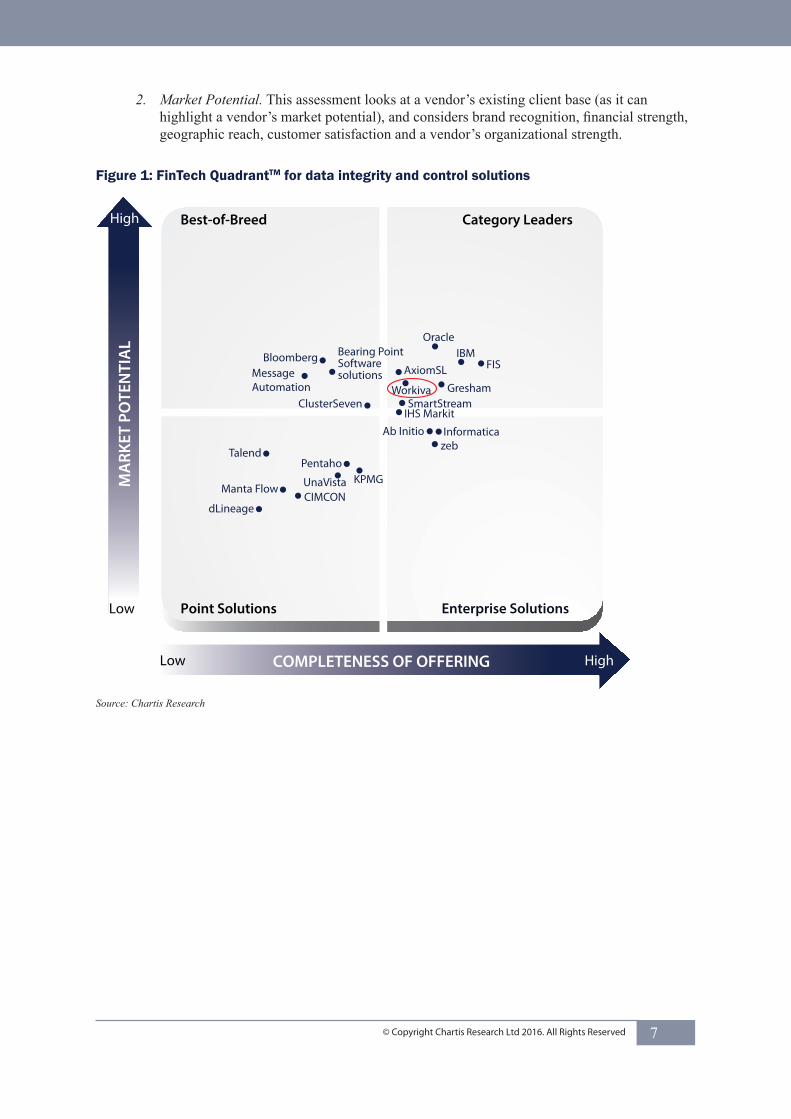
Figure 1 shows Chartis’s view of the vendor landscape for data integrity and control technology solutions. In the FinTech Quadrant™, Workiva is positioned as a Category Leader. Within our ‘CompletenessofOffering’rating(seebelow),itscoreshighlyonanumberofcategoriessuchas governance, discovery and automation.Our‘MarketPotential’ratingincludeshighcustomersatisfaction and enterprise readiness.
TheFinTechQuadrant™isaproprietarymethodologydevelopedspecificallyfortherisktechnologymarketplace. It takes into account vendors’ product and technology capabilities, as well as their organizational capabilities. Appendix A sets out the generic methodology and criteria used for the FinTechQuadrant™.Specifically,wehaveconsideredthefollowingcriteriaasparticularlyimportant:
1. Completeness of Offering. This assessment looks at a number of criteria, including the following:
• The functionality of solutions, focusing primarily on the control of data and metadata in FIs’ business processes.
• How well solutions interrogate the data landscape and identify the location of data integrity gaps.
• The general level of automation, across all Completeness of Offering criteria. This is also a key indicator of the latest data integrity and control solutions.
7© Copyright Chartis Research Ltd 2016. All Rights Reserved
2. Market Potential. This assessment looks at a vendor’s existing client base (as it can highlightavendor’smarketpotential),andconsidersbrandrecognition,financialstrength,geographic reach, customer satisfaction and a vendor’s organizational strength.
Figure 1: FinTech QuadrantTM for data integrity and control solutions
Low
Low
High
High
COMPLETENESS OF OFFERING
MA
RKET
PO
TEN
TIA
L
Enterprise Solutions
Best-of-Breed
Point Solutions
Category Leaders
Enterprise Solutions
Oracle
AxiomSLBloomberg
ClusterSeven
Talend
KPMGManta Flow
dLineage
Pentaho
UnaVistaCIMCON
Bearing PointSoftwaresolutionsMessage
Automation
IBMFIS
IHS MarkitAb Initio Informatica
zeb
GreshamWorkivaSmartStream
Source: Chartis Research

8© Copyright Chartis Research Ltd 2016. All Rights Reserved
Table 2: Completeness of offering – Workiva
Completeness of offering Coverage
Governance – The control of data and metadata (semantic structures, graphs, statistical frameworks) surrounding the controlled process
High
Discovery and reporting – The location and escalation of data integrity gaps / issues
High
Automation HighAudit HighIntegration support MediumDatainsight–Theabilitytodistinguishspecificnaturesortypes of data
Medium
Enterprise readiness – e.g., security and data retention HighData types – The ability to handle structured and unstructured data
Medium
Alertingandworkflow–Thecapabilityoftheworkflowengine and alerts upon the failure of activities
Medium
Semantic integrity, control and reconciliation – The consistencyofdatadefinitionsacrossprocesses
High
Statistical integrity, control and reconciliation – Statistical checks for consistency across processes and over time
Medium
Source: Chartis Research
Table 3: Market potential – Workiva
Market Potential Level
Customer satisfaction HighMarket penetration MediumGrowth strategy HighFinancials MediumBusiness model HighEnterprise readiness HighMulti-sector HighRoadmap High
Source: Chartis Research

9© Copyright Chartis Research Ltd 2016. All Rights Reserved
Leading practices
Workiva’s Wdesk platform controls and monitors business data from a single source. The platform isdesignedtoenableenterprisestohandledatarelationshipsthatareorganicandconstantlyinflux.Over 2,550 customers in 120 countries use Wdesk.
Wdesk is a pure cloud platform with native capabilities to create and combine text documents, workbooks, presentations, dashboards and charts in one environment. Wdesk provides acentralplatformforuserstostoreandsyncdatafromERP,consolidations,FP&A,and non-financialsystems.Itallowsreportingteamstotransformthatdataintofinancial,managementand performance reports as well as regulatory disclosures. Wdesk connects and manages information with linking capabilities, audit trails, permissioning and also administrative / end user personalization.
Wdesk is designed to enable users to:
• Create datasets that are aggregated on the platform and linked throughout documents, spreadsheets, presentations and reports.
• Control accesstodatasets,reports,andworkflowsforthosewithintheorganizationorbeyond.
• Collaborate among thousands of users, working in real time in a cloud-based workspace.
• Present critical data and reports to internal and external constituents.
• Make more informed decision-making based on data and reports.
Avoidance of IT costs occur through these channels:
• Initial hardware and software development expenses.
• Continuous software upgrades and maintenance.
• Ongoing technical support and user training.

10© Copyright Chartis Research Ltd 2016. All Rights Reserved
Context
This section summarizes the demand- and supply-side factors that are shaping the market for data integrity and control solutions. It considers the market environment and dynamics that are driving FIs’ requirements for data integrity and control solutions, and categorizes vendors of these solutions. For more detail on all of these aspects, see Chartis’s report Data Integrity and Control in Financial Services 2016.
Demand-side analysis
Market dynamics
TherearethreemainexternalinfluencesdefiningFIs’needforsolutionstoensuretheintegrityandcontrol of their data.
Reduced profit margins
In a marketplaceofsqueezedmargins,preservingprofitsisessential.Toenhancetheaccuracyandintegrity of their data, companies are moving toward more overarching strategic solutions. The operational costs of manually scrutinizing data are high, and the regulatory demands of new rules such as the Comprehensive Capital Analysis and Review (CCAR) and Dodd-Frank Act Stress Tests (DFAST) will require more manual processes early in the data management process. By employing data integrity and control solutions, FIs can move beyond manual processes and reduce their costs long-term,withasignificantimpactontheirprofitmargins.
The explosive growth in data
The volume of data that FIs have to deal with is huge, and growing exponentially, largely because of increasingly complex business processes and more stringent reporting regulations. Data integrity and controlsolutionswillplayacriticalroleindevelopingtheprocessesneededtodefine,categorizeandmanage this data.
Increased demands from regulators
Inthefinancialservicesindustry,threerelativelyrecentpiecesofregulation–theBaselCommittee’sregulation BCBS 2391, the US Federal Reserve’s Supervisory Guidance on Model Risk Management (SR 11-7)2 and the European Union’s (EU’s) Solvency II legislation3 – have focused attention on data integrity and control. Each of these mandates covers data quality in some detail, and their requirements are helping to shape the market for data integrity and control solutions. In terms of the industries that the regulations cover, the most focused of the three is Solvency II which applies to the insuranceindustry,whileBCBS239hasthebroadestreachwithinthefinancialsector.
1http://www.bis.org/publ/bcbs239.pdf. 2http://www.occ.treas.gov/news-issuances/bulletins/2011/bulletin-2011-12a.pdf. 3http://ec.europa.eu/finance/insurance/solvency/solvency2/index_en.htm.

11© Copyright Chartis Research Ltd 2016. All Rights Reserved
Enterprise dynamics
This section summarizes the main dynamics within FIs themselves that are helping to shape demand forspecificfunctionsindataintegrityandcontrolsolutions,andhowthesesolutionscandelivervaluenow and in future.
Chartis’s data integrity value chain dividesthetypicalenterprisedataflowintosixintegritysteps,fromtheoriginalacquisitionofdatathroughtoitsfinaldistribution.Webelievetheseprocesseswork together to maintain data integrity and control, and by presenting this as an end-to-end process, we can visualize all the elements needed to implement data integrity and control within a business. However, vendors take a far from linear approach to these processes (for more information see the Chartis report Data Integrity and Control in Financial Services 2016).
Value within and across processes
To get the most from their limited time and resources, FIs must balance improvements within individual end-to-end processes with initiatives to improve integration across processes. FIs will also have to strike a balance between rapidly deployed, supplemental solutions that improve data control within their existing infrastructure, and longer-term replacement applications that come with embedded capabilities to improve data quality management. The data integrity value chain is one useful way that FIs can understand their overall environment and plan a way to optimize their investments.

12© Copyright Chartis Research Ltd 2016. All Rights Reserved
Supply-side analysis
Vendor categories
Chartis has divided the supply-side vendors of data integrity and control solutions into seven categories, according to the particular tools they offer. Within all these market segments we will assess the capabilities of tools to analyze both structured and unstructured data.
1. Data reconciliation and control. These tools have a strong matching capability, matching different data sets and generating error and variance reports of variable complexity.
2. Data modeling tools. Tools which manage, organize, transform and control data and metadata models.
3. Master data management. Tools which manage and control data from customers, counterparties, legal entities and securities, and which provide a framework to control transactional metadata.
4. Data presentation and reporting. In essence, these tools provide a structure in which FIs cancreate,developandsubmitpre-specifiedregulatoryormanagementreports.Theymayhave a variety of intermediate integrity checks for transformation and control, along with dataprocessandworkflowmanagementcapabilities.Buttheirmainstructuralfeaturesintegrate these functions to ensure that specific management or delivery reports or data are delivered.
5. Data quality tools. Systems that provide data models, taxonomies, business rules and data management frameworks and tools. These measure, validate and improve data quality from a statistical or semantic perspective.
6. Extraction, Transformation, Loading (ETL). Vendors initially developed these general-purpose data lifecycle management tools to move what was primarily relational data from systems A to B with a variety of well-determined validation and transformation rules. However, they have expanded in scope, and now have far more general capabilities for metadata management, data reconciliation and a variety of other capabilities across the data integrity value chain. Data is subject to evolutions and transformations through different systems, and these tools are pivotal in controlling its quality.
7. End-user monitoring, activity and control. Traditionally, End-User Applications (EUA) have come in the form of spreadsheets and lightweight databases such as MS Access. Cloudcomputing,newandflexiblebusinessintelligencetools,open-sourceapplicationsand languages have all created opportunities for the EUA category to expand (eg,Tableau,Julia,Python,Matlab,R).Thishasgivenrelativelyinexperiencedprogramersconsiderable power to provide end-user activities that were not previously feasible. End-user activities include:
• Creating metadata.
• Changingtheparametersofdatafilters.
• Setting up and changing the parameters of data reconciliation.
13© Copyright Chartis Research Ltd 2016. All Rights Reserved
Some vendors support the full lifecycle of data across the data integrity and control value chain, from checking and controlling the integrity of trade and transactional data (such as reconciliations), all the way through the lifecycle and progress of data elements within the organization. This includes data quality (both rule-based and statistical), semantic control / mapping and management of intermediate data, the lineage of this intermediate data, and sophisticated storage and management; through to providing tools for effective data distribution and access control. Other vendors, meanwhile, focusonaspecificaspectofthedataintegrityandcontrolcycle,suchasreconciliationatthetradeand transaction level, while still others focus on lineage and governance. Some vendors focus on reconciliation, governance and management of complex data types, whereas others focus on relatively simple but high-volume transactions.
14© Copyright Chartis Research Ltd 2016. All Rights Reserved
Appendix A: FinTech QuadrantTM methodology
Independence
Chartisisaresearchandadvisoryfirmthatprovidestechnologyandbusinessadvicetotheglobalriskmanagementandfinancialtechnologyindustry.Chartisprovidesindependentmarketintelligenceregarding market dynamics, regulatory trends, technology trends, best practices, competitive landscapes, market sizes, expenditure priorities, and mergers and acquisitions. Chartis’s FinTech QuadrantTM reports are written by experienced analysts with hands-on experience of selecting, developing, and implementing risk management systems for a variety of international companies in a range of industries including banking, insurance, capital markets, energy, and the public sector.
Chartis’sresearchclientsincludeleadingfinancialservicesfirmsandFortune500companies,leadingconsultingfirms,andrisktechnologyvendors.ThetechnologyvendorsthatareevaluatedintheFinTech QuadrantTMreportscanbeChartisclientsorfirmswithwhomChartishasnorelationship.Chartis evaluates all technology vendors using consistent and objective criteria, regardless of whether or not they are a Chartis client.
Where possible, technology vendors are given the opportunity to correct factual errors prior to publication,butcannotinfluenceChartis’sopinion.Risktechnologyvendorscannotpurchaseorinfluencepositiveexposure.Chartisadherestothehigheststandardsofgovernance,independence,and ethics.
Inclusion in the FinTech QuadrantTM
Chartisseekstoincludetechnologyvendorsthathaveasignificantpresenceinagiventargetmarket.Thesignificancemaybeduetomarketpenetration(e.g.largeclient-base)orinnovativesolutions.Chartis does not give preference to its own clients and does not request compensation for inclusion in a FinTech QuadrantTMreport.Chartisutilizesdetailedanddomain-specific“vendorevaluationforms”andbriefingsessionstocollectinformationabouteachvendor.IfavendorchoosesnottorespondtoaChartis vendor evaluation form, Chartis may still include the vendor in the report. Should this happen, Chartis will base its opinion on direct data collated from risk technology buyers and users, and from publically available sources.
Research process
ThefindingsandanalysesintheFinTechQuadrantTMreportsreflectouranalysts’consideredopinions,along with research into market trends, participants, expenditure patterns, and best practices. The research lifecycle usually takes several months, and the analysis is validated through several phases of independentverification.Figure5,below,describestheresearchprocess.

15© Copyright Chartis Research Ltd 2016. All Rights Reserved
Figure 2: Chartis FinTech QuadrantTM research process
• Market surveys• Client feedback• Regulatory studies• Academic studies• Conferences• 3rd party information sources
• Interviews with industry experts• Interviews with risk technology buyers• Interviews with risk technology vendors• Decision by Chartis Research Advisory Board
• Develop detailed evaluation criteria• Vendor evaluation form• Vendor briefings and demonstrations• Risk technology buyer surveys and interviews
• Demand and supply side analysis• Apply evaluation criteria• Survey data analysis• Check references and validate vendor claims• Follow-up interviews with industry experts
• Publication of report• On-going scan of the marketplace• Continued updating of the report
Identify research topics
Select research topics
Data gathering
Evaluation of vendors and formulation of opinion
Publication and updates
Source: Chartis Research
Chartis typically uses a combination of sources to gather market intelligence. These include (but are not limited to):
• Chartis Vendor Evaluation Forms – A detailed set of questions covering functional and non-functional aspects of vendor solutions, as well as organizational and market factors. Chartis’s vendor evaluation forms are based on practitioner level expertise and input from real-life risk technology projects, implementations, and requirements analysis.
• Risk Technology User Surveys – As part of its on-going research cycle, Chartis systematically surveys risk technology users and buyers, eliciting feedback on various risk technology vendors, satisfaction levels, and preferences.
• Interviews with Subject Matter Experts – Once a research domain has been selected, Chartisundertakescomprehensiveinterviewsandbriefingsessionswithleadingindustryexperts,academics,andconsultantsonthespecificdomaintoprovidedeepinsightintomarket trends, vendor solutions, and evaluation criteria.
16© Copyright Chartis Research Ltd 2016. All Rights Reserved
• Customer Reference Checks – These are telephone and / or email checks with named customers of selected vendors to validate strengths and weaknesses, and to assess post-sales satisfaction levels.
• Vendor Briefing Sessions–Theseareface-to-faceand/orweb-basedbriefingsandproductdemonstrations by risk technology vendors. During these sessions, Chartis experts ask in-depth, challenging questions to establish the real strengths and weaknesses of each vendor.
• Other Third Party Sources – In addition to the above, Chartis uses other third party sources of information such as conferences, academic and regulatory studies, and collaboration withleadingconsultingfirmsandindustryassociations.
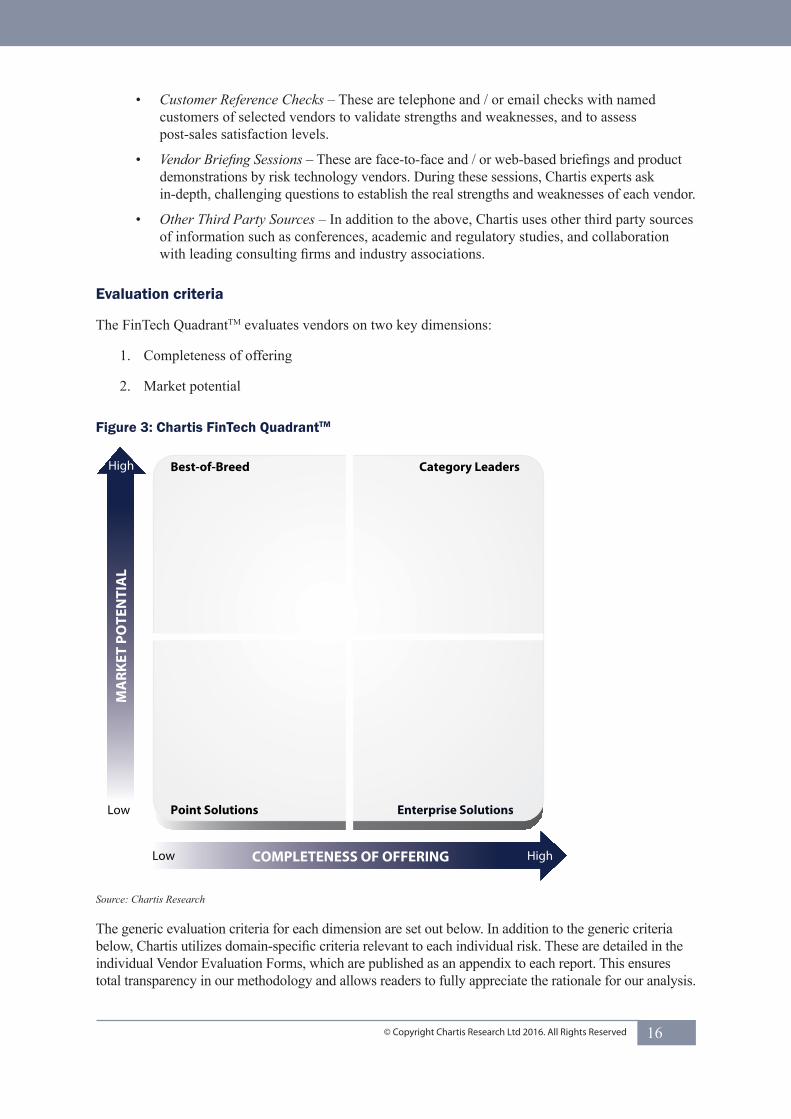
Evaluation criteria
The FinTech QuadrantTM evaluates vendors on two key dimensions:
1. Completeness of offering
2. Market potential
Figure 3: Chartis FinTech QuadrantTM
Low
Low
High
High
COMPLETENESS OF OFFERING
MA
RKET
PO
TEN
TIA
L
Enterprise Solutionss
Best-of-Breed
Point Solutions
Category Leaders
Enterprise Solution
Source: Chartis Research
The generic evaluation criteria for each dimension are set out below. In addition to the generic criteria below,Chartisutilizesdomain-specificcriteriarelevanttoeachindividualrisk.Thesearedetailedintheindividual Vendor Evaluation Forms, which are published as an appendix to each report. This ensures total transparency in our methodology and allows readers to fully appreciate the rationale for our analysis.
17© Copyright Chartis Research Ltd 2016. All Rights Reserved
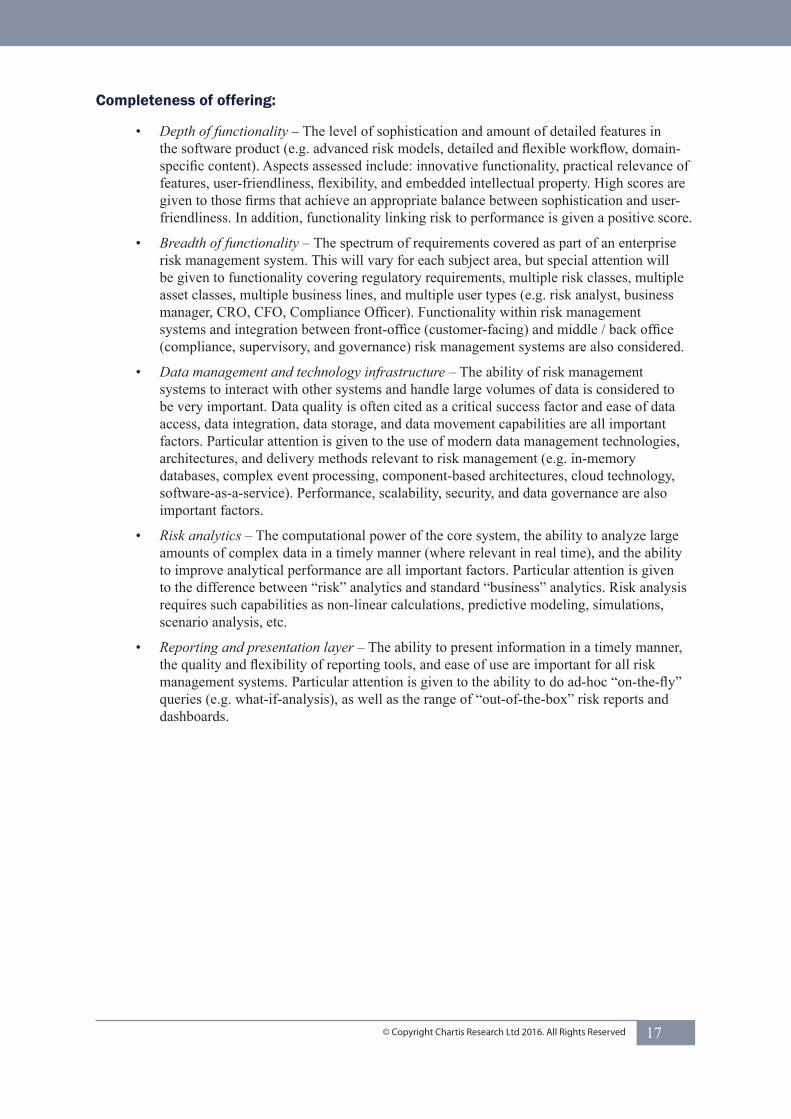
Completeness of offering:
• Depth of functionality – The level of sophistication and amount of detailed features in thesoftwareproduct(e.g.advancedriskmodels,detailedandflexibleworkflow,domain-specificcontent).Aspectsassessedinclude:innovativefunctionality,practicalrelevanceoffeatures,user-friendliness,flexibility,andembeddedintellectualproperty.Highscoresaregiventothosefirmsthatachieveanappropriatebalancebetweensophisticationanduser-friendliness. In addition, functionality linking risk to performance is given a positive score.
• Breadth of functionality – The spectrum of requirements covered as part of an enterprise risk management system. This will vary for each subject area, but special attention will be given to functionality covering regulatory requirements, multiple risk classes, multiple asset classes, multiple business lines, and multiple user types (e.g. risk analyst, business manager,CRO,CFO,ComplianceOfficer).Functionalitywithinriskmanagementsystemsandintegrationbetweenfront-office(customer-facing)andmiddle/backoffice(compliance, supervisory, and governance) risk management systems are also considered.
• Data management and technology infrastructure – The ability of risk management systems to interact with other systems and handle large volumes of data is considered to be very important. Data quality is often cited as a critical success factor and ease of data access, data integration, data storage, and data movement capabilities are all important factors.Particularattentionisgiventotheuseofmoderndatamanagementtechnologies,architectures, and delivery methods relevant to risk management (e.g. in-memory databases, complex event processing, component-based architectures, cloud technology, software-as-a-service).Performance,scalability,security,anddatagovernancearealsoimportant factors.
• Risk analytics – The computational power of the core system, the ability to analyze large amounts of complex data in a timely manner (where relevant in real time), and the ability toimproveanalyticalperformanceareallimportantfactors.Particularattentionisgiventothedifferencebetween“risk”analyticsandstandard“business”analytics.Riskanalysisrequires such capabilities as non-linear calculations, predictive modeling, simulations, scenario analysis, etc.
• Reporting and presentation layer – The ability to present information in a timely manner, thequalityandflexibilityofreportingtools,andeaseofuseareimportantforallriskmanagementsystems.Particularattentionisgiventotheabilitytodoad-hoc“on-the-fly”queries(e.g.what-if-analysis),aswellastherangeof“out-of-the-box”riskreportsanddashboards.

18© Copyright Chartis Research Ltd 2016. All Rights Reserved
Market potential:
• Market penetration – Both volume (i.e. number of customers) and value (i.e. average deal size) are considered important. Also, rates of growth relative to sector growth rates are evaluated.
• Brand – Brand awareness, reputation, and the ability to leverage current market position to expand horizontally (with new offerings) or vertically (into new sectors) are evaluated.
• Momentum – Performanceovertheprevious12monthsisevaluated,includingfinancialperformance, new product releases, quantity and quality of contract wins, and market expansion moves.
• Innovation–Newideas,functionality,andtechnologiestosolvespecificriskmanagementproblemsareevaluated.Developingnewproductsisonlythefirststepingeneratingsuccess. Speed to market, positioning, and translation into incremental revenues are critical success factors for exploitation of the new product. Chartis also evaluates business model or organizational innovation (i.e. not just product innovation).
• Customer satisfaction – Feedback from customers regarding after-sales support and service (e.g. training and ease of implementation), value for money (e.g. price to functionality ratio) and product updates (e.g. speed and process for keeping up to date with regulatory changes) is evaluated.
• Sales execution – The size and quality of sales force, sales distribution channels, global presence, focus on risk management, messaging, and positioning are all important factors.
• Implementation and support – Important factors include size and quality of implementation team,approachtosoftwareimplementation,andpost-salessupportandtraining.Particularattentionisgivento“rapid”implementationmethodologiesand“packaged”servicesofferings.
• Thought-leadership – Business insight and understanding, new thinking, formulation and execution of best practices, and intellectual rigor are considered important by end-users.
• Financial strength and stability–Revenuegrowth,profitability,sustainability,andfinancialbacking(e.g.theratiooflicensetoconsultingrevenues)isconsideredaskeytoscalability of the business model for risk technology vendors.
19© Copyright Chartis Research Ltd 2016. All Rights Reserved
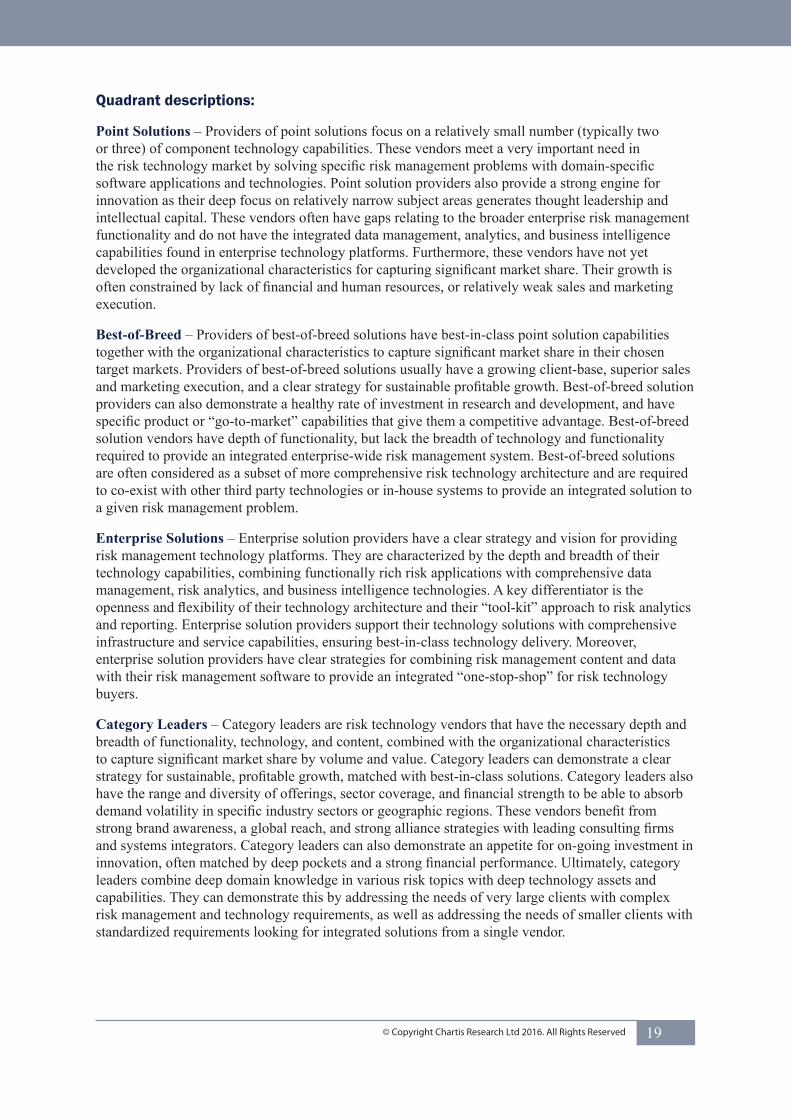
Quadrant descriptions:
Point Solutions –Providersofpointsolutionsfocusonarelativelysmallnumber(typicallytwoor three) of component technology capabilities. These vendors meet a very important need in therisktechnologymarketbysolvingspecificriskmanagementproblemswithdomain-specificsoftwareapplicationsandtechnologies.Pointsolutionprovidersalsoprovideastrongengineforinnovation as their deep focus on relatively narrow subject areas generates thought leadership and intellectual capital. These vendors often have gaps relating to the broader enterprise risk management functionality and do not have the integrated data management, analytics, and business intelligence capabilities found in enterprise technology platforms. Furthermore, these vendors have not yet developedtheorganizationalcharacteristicsforcapturingsignificantmarketshare.Theirgrowthisoftenconstrainedbylackoffinancialandhumanresources,orrelativelyweaksalesandmarketingexecution.
Best-of-Breed –Providersofbest-of-breedsolutionshavebest-in-classpointsolutioncapabilitiestogetherwiththeorganizationalcharacteristicstocapturesignificantmarketshareintheirchosentargetmarkets.Providersofbest-of-breedsolutionsusuallyhaveagrowingclient-base,superiorsalesandmarketingexecution,andaclearstrategyforsustainableprofitablegrowth.Best-of-breedsolutionproviders can also demonstrate a healthy rate of investment in research and development, and have specificproductor“go-to-market”capabilitiesthatgivethemacompetitiveadvantage.Best-of-breedsolution vendors have depth of functionality, but lack the breadth of technology and functionality required to provide an integrated enterprise-wide risk management system. Best-of-breed solutions are often considered as a subset of more comprehensive risk technology architecture and are required to co-exist with other third party technologies or in-house systems to provide an integrated solution to a given risk management problem.
Enterprise Solutions – Enterprise solution providers have a clear strategy and vision for providing risk management technology platforms. They are characterized by the depth and breadth of their technology capabilities, combining functionally rich risk applications with comprehensive data management, risk analytics, and business intelligence technologies. A key differentiator is the opennessandflexibilityoftheirtechnologyarchitectureandtheir“tool-kit”approachtoriskanalyticsand reporting. Enterprise solution providers support their technology solutions with comprehensive infrastructure and service capabilities, ensuring best-in-class technology delivery. Moreover, enterprise solution providers have clear strategies for combining risk management content and data withtheirriskmanagementsoftwaretoprovideanintegrated“one-stop-shop”forrisktechnologybuyers.
Category Leaders – Category leaders are risk technology vendors that have the necessary depth and breadth of functionality, technology, and content, combined with the organizational characteristics tocapturesignificantmarketsharebyvolumeandvalue.Categoryleaderscandemonstrateaclearstrategyforsustainable,profitablegrowth,matchedwithbest-in-classsolutions.Categoryleadersalsohavetherangeanddiversityofofferings,sectorcoverage,andfinancialstrengthtobeabletoabsorbdemandvolatilityinspecificindustrysectorsorgeographicregions.Thesevendorsbenefitfromstrongbrandawareness,aglobalreach,andstrongalliancestrategieswithleadingconsultingfirmsand systems integrators. Category leaders can also demonstrate an appetite for on-going investment in innovation,oftenmatchedbydeeppocketsandastrongfinancialperformance.Ultimately,categoryleaders combine deep domain knowledge in various risk topics with deep technology assets and capabilities. They can demonstrate this by addressing the needs of very large clients with complex risk management and technology requirements, as well as addressing the needs of smaller clients with standardized requirements looking for integrated solutions from a single vendor.

20© Copyright Chartis Research Ltd 2016. All Rights Reserved
How to use research and services from Chartis
Inadditiontoourflagshipindustryreports,Chartisalsoofferscustomizedinformationandconsultingservices. Our in-depth knowledge of the risk technology market and best practice allows us to provide high-quality and cost-effective advice to our clients. If you found this report informative and useful, you may be interested in the following services from Chartis.
For risk technology buyers
If you are purchasing risk management software, Chartis’s vendor selection service is designed to help youfindthemostappropriaterisktechnologysolutionforyourneeds.
We monitor the market to identify the strengths and weaknesses of the different risk technology solutions, and track the post-sales performance of companies selling and implementing these systems. Our market intelligence includes key decision criteria such as TCO (total cost of ownership) comparisons and customer satisfaction ratings.
Our research and advisory services cover a range of risk and compliance management topics such ascreditrisk,marketrisk,operationalrisk,GRC,financialcrime,liquidityrisk,assetandliabilitymanagement, collateral management, regulatory compliance, risk data aggregation, risk analytics and risk BI.
Our vendor selection services include:
• Buy vs. build decision support
• Business and functional requirements gathering
• Identificationofsuitableriskandcomplianceimplementationpartners
• Review of vendor proposals
• Assessment of vendor presentations and demonstrations
• DefinitionandexecutionofProof-of-Concept(PoC)projects
• Due diligence activities.
For risk technology vendors
Strategy
Chartiscanprovidespecificstrategyadviceforrisktechnologyvendorsandinnovators,withaspecialfocusongrowthstrategy,productdirection,go-to-marketplans,andmore.Someofourspecificofferings include:
• Market analysis, including market segmentation, market demands, buyer needs, and competitive forces
• Strategy sessions focused on aligning product and company direction based upon analyst data, research, and market intelligence
• Advice on go-to-market positioning, messaging, and lead generation
• Advice on pricing strategy, alliance strategy, and licensing / pricing models.

21© Copyright Chartis Research Ltd 2016. All Rights Reserved
Thought leadership
Risk technology vendors can also engage Chartis to provide thought leadership on industry trends in the form of in-person speeches and webinars, as well as custom research and thought-leadership reports. Target audiences and objectives range from internal teams to customer and user conferences.
Some recent examples include:
• Participationona‘PanelofExperts’ataglobaluserconferenceforaleadingERM(Enterprise Risk Management) software vendor
• Custom research and thought-leadership paper on Basel 3 and implications for risk technology
• Webinar on Financial Crime Risk Management
• Internal education of sales team on key regulatory and business trends and engaging C-level decision makers.

22© Copyright Chartis Research Ltd 2016. All Rights Reserved
Further reading
• Data Integrity and Control Solutions in Financial Services 2016
• Risk Data Aggregation and Reporting Solutions 2016
• RiskTech100® 2016
For all these reports see: http://www.chartis-research.com