Embed Size (px)
Citation preview

DEVELOPMENT OF AN INTERACTIVE
VISUA LIZA TION TOOL FOR SOCIAL MEDIA INFORMATION IN SUPPORT OF TACTICAL
CRIME ANALYSIS
F I N A L - Y E A R R E S E AR C H P R O J E C T
A N N E L I E S B R A N D S
Towards a Social Media Quick Scan

Contents
Introduction
Background
Method
Identification of needs & establishment of requirements
Design
Evaluation
Discussion
Introduction

Introduction

Introduction

The problem

Information overload
Too much (complex) information (1)
Limited response time (2)
Limited processing capacity (3)

Research questions
How can visualization of social media information support detectives in their work?
How can the results of a quick scan of social media information best be visualized?
How can objective reasoning be supported in the visualization? (tunnel vision prevented)
Following from the previous question: How can the relevance and reliability of User-Generated Content be validated?
How can the visualization(s) be accessible for people with different technical expertise levels?

Background: Social media in police investigations
8 W-questions:
Who, what, where, when, whith what, why, in which way, why can we say this?
Objective reasoning
From data to intelligence
Reliability checks:
1. Provenance: Is this the original piece of content?
2. Source: Who uploaded the content?
3. Date: When was the content created?
4. Location: Where was the content created?

Background: Visualization
Visualization pipeline


“Overview, zoom & filter, details on demand”

Recall
Development of
an interactive visualization tool
for social media information
in support of tactical crime analysis

Method – Interaction Design

Method
Identify needs & requirements 11 interviews (2 female) with:
RTIC employees Detectives Social media investigation experts
Developing alternative designs Mock-ups
Building interactive versions Build interactive prototype of one case (one type of crime)
Evaluation 9 interviews (male) with the same police employees
Semi-structured List of statements

Insight goals
Find factual information on persons
Look into the network of friends
Insight in the online impact of a crime
Create a visual overview of the environment of the crime scene
Show the source and context of the information
View data in a timeline
Select and export relevant information

Establishment of requirements
Quickly access data from multiple sources
Connect data from multiple sources
Collaborate and share relevant information with colleagues
Interact with the data

Use case diagram

Design: characteristics
Web-based
Pinboard
Combining data from multiple sources

Design: prototype
HTML+CSS+Javascript Including several libraries for the visualizations
Data Twitter dataset from Jong&Dückers(2016)
Manually collected data
Design priorities: Focus on overview, calmness and usability
Embed the data when possible
Always show the source and link to the original content

Case: Tarik

Design: prototype
Zie jpgs

Design: prototype

Design: prototype

Design: prototype

Evaluation – interview results
“Clean”, “overview”, “easy”
Positive points: Panels with overview of the sources and the golden Ws
Pin to board and export
Maps
List of friend suggestions
Unclear: ‘Added data’-panel
How to add data from other sources?
Search in table
Filter buttons on Twitter page

Evaluation – interview results
Missing:
Twitter search queries
Filter on retweets
How to work with multiple cases
Suggestions:
Move the chat-panel to a pop-up
Filter buttons for witness terms
Sort the data on number of comments

Evaluation – Statements on insight goals

Evaluation - Usability
Mean SUS score of 80,1
(>68 is above average, 100 max)
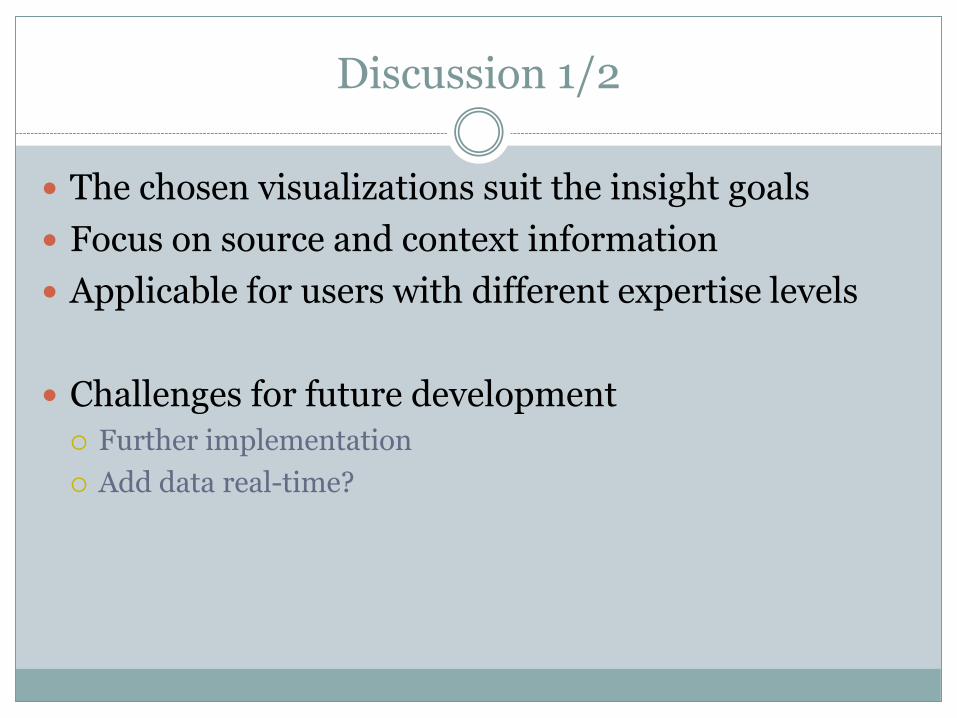
Discussion 1/2
The chosen visualizations suit the insight goals
Focus on source and context information
Applicable for users with different expertise levels
Challenges for future development
Further implementation
Add data real-time?

Discussion 2/2
This project adds to research on developing visualization software
That can integrate multiple sources
And is accessible to users with different technical backgrounds, especially non-programmers
This project added to the knowledge on information overload in the police domain, the use of social media in police investigations and what technology is needed to support this.

Conclusion
The first big steps towards a Social Media Quick Scan
Great potential for supporting detectives in their work
Use social media information earlier on in police investigations

Promofilmpje
https://www.youtube.com/watch?v=Vn9uOuqW8L8