Embed Size (px)
Citation preview

The Fornax Deep Survey with VST. I.
The extended and diffuse stellar halo of NGC 1399 out to 192 kpc.
E. Iodice1, M. Capaccioli2, A. Grado1, L. Limatola1, M. Spavone1, N.R. Napolitano1, M.
Paolillo2,8,9, R. F. Peletier3, M. Cantiello4, T. Lisker5, C. Wittmann5, A. Venhola3,6, M.
Hilker7, R. D’Abrusco2, V. Pota1, P. Schipani1
ABSTRACT
We have started a new deep, multi-imaging survey of the Fornax cluster, dubbed Fornax DeepSurvey (FDS), at the VLT Survey Telescope. In this paper we present the deep photometry insidetwo square degrees around the bright galaxy NGC 1399 in the core of the cluster. We found thatthe core of the Fornax cluster is characterised by a very extended and diffuse envelope surroundingthe luminous galaxy NGC 1399: we map the surface brightness out to 33 arcmin (∼ 192 kpc)from the galaxy center and down to µg ∼ 31 mag arcsec−2 in the g band. The deep photometryallows us to detect a faint stellar bridge in the intracluster region on the west side of NGC 1399and towards NGC 1387. By analyzing the integrated colors of this feature, we argue that itcould be due to the ongoing interaction between the two galaxies, where the outer envelope ofNGC 1387 on its east side is stripped away. By fitting the light profile, we found that exists aphysical break radius in the total light distribution at R = 10 arcmin (∼ 58 kpc) that sets thetransition region between the bright central galaxy and the outer exponential halo, and that thestellar halo contributes for 60% of the total light of the galaxy (Sec. 3.5). We discuss the mainimplications of this work on the build-up of the stellar halo at the center of the Fornax cluster.By comparing with the numerical simulations of the stellar halo formation for the most massiveBCGs (i.e. 13 < logM200/M⊙ < 14), we find that the observed stellar halo mass fraction isconsistent with a halo formed through the multiple accretion of progenitors with stellar mass inthe range 108 − 1011 M⊙. This might suggest that the halo of NGC 1399 has also gone througha major merging event. The absence of a significant number of luminous stellar streams andtidal tails out to 192 kpc suggests that the epoch of this strong interaction goes back to an earlyformation epoch. Therefore, differently from the Virgo cluster, the extended stellar halo aroundNGC 1399 is characterised by a more diffuse and well-mixed component, including the ICL.
Subject headings: galaxies: cD — galaxies: clusters: individual (Fornax) — galaxies: halos — galaxies:photometry
1INAF - Astronomical Observatory of Capodimonte, viaMoiariello 16, Naples, I-80131, Italy
2Dip.di Fisica Ettore Pancini, University of Naples”Federico II”, C.U. Monte SantAngelo, Via Cinthia, 80126,Naples, Italy
3Kapteyn Astronomical Institute, University of Gronin-gen, PO Box 72, 9700 AV Groningen, The Netherlands
4INAF - Astronomical Observatory of Teramo, ViaMaggini, 64100, Teramo, Italy
5Zentrum fuer Astronomie der Universitaet Heidelberg,Germany
6Division of Astronomy, Department of Physics, Uni-
1. Introduction
Deep and large-scale multi-band imaging arecrucial to study the galaxy outskirts, out to hun-
versity of Oulu, Oulu, Finland7European Southern Observatory, Karl-Schwarzschild-
Strasse 2, D-85748 Garching bei Mnchen, Germany8INFN Sezione di Napoli, Via Cintia, I-80126 Napoli,
Italy9Agenzia Spaziale Italiana - Science Data Center, Via
del Politecnico snc, 00133 Roma, Italy
1
dreds of kiloparsecs, where the imprints of themass assembly reside: these are the regions of thestellar halos. Under the hierarchical accretion sce-nario, galaxies at the center of the clusters con-tinue to undergo active mass assembly and theirhalos are still growing in the present epoch: stel-lar halos and the diffuse intracluster light (ICL)results from the stripping of stars off of the clustermembers by minor mergers and dynamical harass-ment (De Lucia & Blaizot 2007; Puchwein et al.2010; Cui et al. 2014).
Observations show that stellar halos can bemade of multiple stellar components, can havecomplex kinematics and host substructures, in theform of shells and tidal tails, which indicate gravi-tational interactions, like merging and/or accre-tion, in the formation history of a galaxy (seeBender et al. 2015; Longobardi et al. 2015, andreferences therein). The light distribution of thestellar halos can appear as a different componentat large radii with respect to the inner light pro-file, showing an exponential decrease (Seigar etal. 2007; Donzelli et al. 2011), or, alternatively,they result as shallower outer region of the wholelight profile, which can be well fitted by a singleSersic law with a high value of the n exponent,n ∼ 7 − 8, (Bender et al. 2015). The relics of theinteractions, such as tails, shells or streams, arealso very faint, with a typical surface brightnessbelow µV ∼ 27 mag arcsec−2. Therefore, their de-tection requires very deep imaging and a carefuldata reduction, able to perform the sky subtrac-tion with an accuracy of a few percent.
In the recent years, a big effort was made todevelop deep photometric surveys aimed to studygalaxy structures up to the faintest levels of sur-face brightness, which reveal such a kind of low lu-minosity structures and trace the stellar halos atvery large distances from the galaxy center (Mi-hos et al. 2005; Janowiecki et al. 2010; Martınez-Delgado et al. 2010; Roediger et al. 2011; Ferrareseet al. 2012; Duc et al. 2015; van Dokkum et al.2014; Munoz et al. 2015; Trujillo & Fliri 2015).Recently, deep images of the Virgo cluster have re-vealed several faint (µV = 26 − 29 mag arcsec−2)streams of ICL among the galaxy members andmade it possible to map the stellar halos of thebright cluster galaxies (BCGs) at very large dis-tances from the center (Janowiecki et al. 2010).In particular, the halo of M87 is traced out to
about 150 kpc (Mihos 2015). A steep color gradi-ent towards bluer colors is measured in the haloregions, suggesting a significant contribution ofmetal-poor stars in its outskirts. In this context,the VEGAS survey, an ongoing multi-band surveyof early-type galaxies in the Southern hemisphere(Capaccioli et al. 2015), is producing competitiveresults. In particular, for the cD galaxy NGC 4472(in the Virgo cluster) genuine new results concernthe detection of an intracluster light tail between5Re ≤ R ≤ 10Re , in the range of surface bright-ness of 26.5 - 27.6 mag/ arcsec2 in the g band.
For galaxies in the local universe (≤ 30 Mpc),the properties of the stellar halos can also beaddressed using discrete tracers such as globularclusters (GCs) and planetary nebulae (PNe). Ob-servations show that the red GCs populations havenumber density profile consistent with that of thestars of the parent galaxy, while the blue GCs arespatially more extended in the intra-cluster spaceand they trace the metal-poor component of thehalo (Forbes et al. 2012; Pota et al. 2013; Dur-rell et al. 2014; Hilker et al. 2015; Cantiello et al.2015). In the Hydra cluster, the location of blueGCs coincides with a group of dwarf galaxies un-der disruption, suggesting a young stellar halo thatis still forming (Arnaboldi et al. 2012; Hilker et al.2015). In this case, this interpretation is furthersupported by kinematic measurements. In M87,the kinematics of PNe, their α-parameter and theshape of the luminosity function, allow to sepa-rate the halo component from the ICL population(Longobardi et al. 2015a). As stressed by Benderet al. (2015), deep photometry alone is not enoughto recognise the structure of the stellar halo, andkinematics measurement are necessary when pos-sible. In particular, the possibility to infer thevariation of the orbital distribution of stars, PNeand GCs (e.g. Gerhard et al. 2001; Romanowskyet al. 2009; Napolitano et al. 2009, 2011, 2014;Pota et al. 2015) in the galaxy haloes is a strongobservational test for galaxy formation scenariosthat can be compared with predictions of hydro-dynamical simulations (e.g. Wu et al. 2014).
From the theoretical side, semi-analytic modelscombined with cosmological N-body simulationshave become very sophisticated, with detailed pre-dictions about the structure of stellar halos, theamount of substructure, the mass profiles, metal-licity gradients, etc. (Cooper et al. 2013; Pillepich
2
et al. 2014, e.g.), in various types of environment.Recent studies have demonstrated that the overallstructure of stellar halos, their stellar populationsand the properties of their dynamical substructuredirectly probe two fundamental aspects of galaxyformation in the ΛCDM model: the hierarchicalassembly of massive galaxies and their dark mat-ter halos, and the balance between in situ starformation and accretion of stars through mergers(Cooper et al. 2013, 2015a,b; Pillepich et al. 2015).
The rich environments, clusters and groups ofgalaxies, are the ideal laboratory to probe thephysical processes leading to the formation of thestellar halos and the ICL. In this framework, weare performing a deep multiband (u,g,r and i)survey of the nearby Fornax cluster, at the VLTSurvey Telescope (VST), situated at the Paranalobservatory of the European Southern Observa-tory. The Fornax Deep Survey (FDS) with VSTaims to cover the whole Fornax cluster out to thevirial radius (Drinkwater et al. 2001), with anarea of about 26 square degrees around the cen-tral galaxy NGC 1399, including the region whereNGC 1316 is located. The FDS will provide an un-precedented view of the structures of the clustermembers, ranging from giant early-type galaxiesto small spheroidal galaxies. The multi-band deepimages will allow us to map the light distributionand colors of cluster galaxies out to 8-10 effectiveradii, in order to study the inner disks and bars,the faint stellar halo, including the diffuse lightcomponent, and the tidal debris as signatures ofrecent cannibalism events. Moreover, FDS willalso give a full characterisation of small stellar sys-tems around galaxies, as globular clusters (GCs)and ultra-compact dwarf galaxies (UCDs).
A detailed description of the FDS observations,data reduction and analyzis, and scientific goalsis the subject of a forthcoming paper. In thiswork, it’s urgent to present the first results ofthe FDS, focused on the bright cluster memberNGC 1399, which is the cD galaxy in the core ofFornax cluster. This galaxy has been studied indetail in a wide wavelength range, from radio toX-ray. NGC 1399 is characterised by a large num-ber of compact stellar systems (GCs and UCDs),for which several studies have provided the num-ber density distribution and stellar population es-timates (Dirsch et al. 2003; Mieske et al. 2004;Bassino et al. 2006; Schuberth et al. 2010; Puzia
et al. 2014; Voggel et al. 2015).
The photometry and kinematics of the innerand brighter regions of the galaxy resemble thosefor a typical elliptical galaxy (Saglia et al. 2000).The 2-dimensional light distribution of the centralbrightest regions of the galaxy appear very reg-ular and round in shape (Ferguson et al. 1989).The most extended light profiles where publishedby Schombert (1986) in the V band and thoseby Caon et al. (1994) in the B band, mappingthe surface brightness out to R ∼ 40 arcmin(∼ 230 kpc) and R ∼ 14 arcmin (∼ 81 kpc), re-spectively. The most extended kinematics of stars(out to ∼ 90 arcsec) was derived by Saglia et al.(2000): it shows a small rotation (∼ 30 km/s)and a high stellar velocity dispersion in the cen-ter (∼ 370 km/s), which decreases at larger radiiand remains constant at 250-270 km/s. At largerradii, out to ∼ 13 arcmin, the kinematics is tracedby GCs and PNe (Schuberth et al. 2010; McNeil etal. 2010). The kinematics of red and blue GCs aredistinct, with red GCs having velocity dispersionconsistent with that of stars, while blue GCs aremore erratic, showing an higher velocity disper-sion, 300 ≤ σ ≤ 400 km/s, (Schuberth et al. 2010).The velocity dispersions of the PNe are consistentwith the values derived by the stars kinematicsand with those for the red GCs (Napolitano et al.2002; McNeil et al. 2010). The X-ray data haveshown the presence of a hot gaseous halo associ-ated to NGC 1399, which extends out to about 90kpc (Paolillo et al. 2002). It appears very asym-metric, consisting of three components which dom-inate at different scales: the central bright part,coincident with the peak of light, the ’galactic’halo that extends out to∼ 7 arcmin, which is offsettoward the west with respect to the optical galaxycentroid, and, on larger scales, the ’cluster’ halothat is elongated in the opposite direction. Thegalactic halo is very inhomogeneous, showing thepresence of several cavities and arc-like features(see Fig.3 and 6 in Paolillo et al. 2002). Differ-ently from the compact stellar systems and X-rayemission, the light distribution and colors in thefaint outskirts of NGC 1399 are still unexplored.As part of the FDS, in this paper we present theanalyzis of the deep photometry performed in theg and i bands inside two square degrees aroundNGC 1399 in order to unveil the stellar halo ofthis galaxy at the largest galactocentric distances
3

and in unexplored range of surface brightnesses.
In the following, we adopt a distance forNGC 1399 of D=19.95 Mpc (Tonry et al. 2001),which yields an image scale of 96.7 parsecs/arcsec.
2. Observations, Data Reduction and Anal-
ysis
The ongoing FDS observations are part of theGuaranteed Time Observation surveys, FOCUS(P.I. R. Peletier) and VEGAS (P.I. M. Capacci-oli, Capaccioli et al. 2015) being performed at theESO VLT Survey Telescope (VST). VST is a 2.6-m wide field optical survey telescope, located atCerro Paranal in Chile (Schipani 2012). VST isequipped with the wide field camera OmegaCam,spanning a 1×1 degree2 field of view, in the opticalwavelength range from 0.3 to 1.0 micron (Kuijken2011). The mean pixel scale is 0.21 arcsec/pixel.
The observations presented in this work werecollected during a visitor mode run from 11 to23 of November 2014 (runID: 094.B-0496[A]). Im-ages are in the u, g, r and i bands. All im-ages were acquired in dark time. They coverfive fields of 1 deg2, one of them centerd on thecore of the Fornax cluster (α = 03h38m29.024s,δ = −35d27′03.18′′). Observations were obtainedby using a step-dither observing sequence, consist-ing of a cycle of short exposures, one centerd onthe core of the Fornax cluster and others on 3 ad-jacent fields all around it (∆ = ±1 degree) onthe SW and NW side. This approach, alreadyadopted in other photometric surveys (Ferrareseet al. 2012), allows a very accurate estimate ofthe sky background around bright and extendedgalaxies.
For each field we have obtained 76 exposures(of 150 sec each) in the u band, 54 in the g andr bands, and 35 in the i band, giving a total ex-posure time of 3.17 hrs in the u band, 2.25 hrsin the g and r bands and and of 1.46 hrs in thei bands. The average seeing during the observingrun ranged between 0.6 and 1.1 arcsec.
The data reduction has been performed withthe VST-Tube imaging pipeline: a detailed de-scription of it, including calibrations and error es-timate, is given by Capaccioli et al. (2015). Theobserving strategy adopted for this data-set allowsto derive an average sky image, from exposurestaken as close as possible in space and time, to
the scientific ones. The average sky frame is de-rived for each observing night, then it is scaled andsubtracted off from each science frame.
The color composite mosaic (from the u, g andi bands) of the central 2 × 1 degrees2 around thecentral cD galaxy NGC 1399 is shown in Fig. 1.In this work we concentrate our analysis on the gand i band images of this region, in order to studythe light distribution of the stellar halo and thediffuse ICL component. In a forthcoming paper,where we will also present the full dataset of theFDS observations, we will show the photometryand structure of all the bright galaxies in the wholemosaic, including the 2-dimensional model of thelight distribution (Iodice et al., in preparation).
2.1. Surface Photometry
One of the goals of the FDS is to map the sur-face brightness and color profiles out to the veryfaint outskirts of the cluster member galaxies (upto about 8-10 effective radii Re). To this aim,the crucial step is to account for all the effectsthat can contribute to the sky brightness with thehighest accuracy. As mentioned in the previoussection, data were acquired in completely darknights. By looking at the 100 micron image avail-able at the NASA/IPAC Infrared Science Archivewe have checked that the region of the Fornax clus-ter is almost devoid of cirrus, thus cirrus do notcontaminate the images. Other possible sourcesthat can contribute to the sky brightness are theextragalactic background light, the zodiacal lightand the terrestrial airglow (Bernstein et al. 2002).The zodiacal light decreases in intensity with dis-tance from the Sun, it is very faint at low eclipticlatitudes (Bernstein et al. 2002). Therefore, con-sidering the ecliptic latitude of the Fornax clusterand the low airmass value during the observations(≤ 1.5), the contribution by the zodiacal light andalso of the terrestrial airglow are very low. Giventhat, the small contribution by the smooth com-ponents listed above to the sky brightness is takeninto account by the sky frame derived for each ob-serving night and then subtracted off from eachscience frame (see Sec. 2). Since each sky frameis taken on a field close in distance to the target,and taken close in time, the average value of allthe smooth sources listed above is estimated inthat way, thus only a possible differential compo-nent could remain in the sky-subtracted science
4

Fig. 1.— Color composite mosaic (from the u, g and i bands) of the central 2× 1 degrees2 in the core of theFornax cluster. The central cD galaxy NGC 1399 is the brightest object on the left side. North is up andEast is on the left.
frame. To estimate any residuals after the sub-traction of the sky frame that can take into ac-count also such a differential effects, we proceededas follows. On the whole sky-subtracted mosaic,in each band, after masking all the bright sources(galaxies and stars) and background objects, weextracted the azimuthally-averaged intensity pro-file with the IRAF task ELLIPSE. The fit is per-formed in elliptical annuli, centerd on NGC 1399,with fixed Position Angle (P.A.) and ellipticity (ǫ),given from the isophotes at R ∼ 1 arcmin, whereP.A. = 6 degrees and ǫ = 0.02. The major axisincreases linearly with a step of 100 pixels out tothe edges of the frame, i.e. out to about 100 ar-cmin, excluding the border that is characterised bya larger noise. This method allows us i) to measureany residual fluctuations1 in the sky-subtracted
1The residual fluctuations in the sky-subtracted images arethe deviations from the the background in the science framewith respect to the average sky frame obtained by theempty fields close to the target. Therefore, by estimat-
images and then take them into account in theerror estimate of the surface brightness, and ii) toestimate the distance from the galaxy center wherethe galaxy’s light blends into the background atzero counts per pixel, on average. This methodwas firstly suggested by Pohlen & Trujillo (2006)to study the light profiles of spiral galaxies andalso adopted by Iodice et al. (2014) on the deepVISTA wide-field images of NGC 253.
From the intensity profiles, we estimated theoutermost radius, from the center of the galaxy,where counts are consistent with those from theaverage background level. Such a value is theresidual by the subtraction of the sky frame, thusit is very close to zero. The radius where thegalaxy’s light blends into this level sets the surfacebrightness limit of the VST light profiles and givesan estimate on the accuracy of the sky subtraction.
ing them, we obtain an estimate on the accuracy of thesky-subtraction step.
5

In the bottom panel of Fig. 2 we show the inten-sity profile in the g band, centerd on NGC 1399and extending out to the edge of the mosaic, as afunction of the semi-major axis. We derived thatfor R ≥ 33 arcmin (∼ 192 kpc) we are measuringthe residual fluctuations of the sky. The error onthe average value is 0.11 counts. The fluctuationsof the background level are less than 0.2 counts.The same approach is adopted in the i band and itgives a limiting radius of R ∼ 27 arcmin, an erroron the average value of 0.2 and fluctuations of thebackground level that are less than 0.4 counts.
The isophotal analysis of NGC 1399 is per-formed by using the ELLIPSE task out to the lim-iting radii estimated above, where the semi-majoraxis length is sampled with a variable bin. Wederived the azimuthally averaged surface bright-ness profiles (see Fig. 2 and Fig. 3), as well as theellipticity and P.A. profiles (see Fig. 4), as func-tion of the semi-major axis. The surface bright-ness profiles extend down to µg = 31 ± 2 magarcsec−2 and µi = 28.6 ± 2 mag arcsec−2, in theg and i bands respectively. According to Capacci-oli et al. (2015) and Seigar et al. (2007), the errorestimates2 on the surface brightness magnitudestake the uncertainties on the photometric calibra-tion (∼ 0.003 − 0.006 mag) and sky subtraction(∼ 0.11 − 0.2 counts) into account. We no-ticed that, for a large area of the mosaic (∼ 50to ∼ 80 arcmin from the galaxy center) the fluctu-ations on the background level are not larger the10% (see bottom panel of Fig. 2). While, on asmaller range of radii, for 30 ≤ R ≤ 40 arcminand for 80 ≤ R ≤ 90 arcmin from the galaxycenter, the deviations from the average zero-levelof the background affect by about the 20% thesurface brightness for µg ≥ 27 mag arcsec−2 andµi ≥ 25 mag arcsec−2. Therefore, to adopt a con-servative approach the error estimate on the skysubtraction takes into account the largest valuesof about 20% in the residuals, even if it is worthstressing that this is an upper limit and that thisvalue is smaller, on average.
2The uncertainty in the surface brightness is cal-culated with the following formula: err =√
(2.5/(adu× ln(10)))2 × ((erradu + errsky)2) + err2zp,
where erradu =√
adu/N − 1, with N is the numberof pixels used in the fit, errsky is the rms on the skybackground and errzp is the error on the photometriccalibration (Capaccioli et al. 2015; Seigar et al. 2007).
Before discussing the light profiles and the 2-dimensional light and color distribution (see nextsection), we present here some tests on the relia-bility of our results.
We noticed that the light profiles show a changein the slope at R = 12 arcmin (∼ 70 kpc) and at26 ≤ µg ≤ 26.5 mag arcsec−2 (see Fig. 3). Ina logarithmic scale this is quite evident. At thisbreak radius the light profiles become steeper. Therelatively high surface brightness level at whichthe change of slope is observed suggests that itshould not be due to wrong estimate of the skylevel. Nevertheless, we have checked this as fol-lows. In the left panel of Fig. 2 we show howmuch the light profile changes by accounting for asky level 10%, 20% and 50% higher or lower theaverage background level. Even if the average skylevel was wrong by 20% the change in the slopewould be still present and only the outer points(at R ≥ 25 arcmin) would be affected. To obtaina shallower profile from R ≥ 20 arcmin, of aboutmore than 2 mag arcsec−2, the sky level wouldhave to be 50% lower. Anyway, also in this case,for 12 ≤ R ≤ 20 arcmin a slope variation in thelight profile is still evident. By looking at the bot-tom panel of the Fig. 2, this large difference canbe excluded since the observed background levelout the edge of the mosaic is clearly higher.
A further check comes by comparing the lightprofiles obtained from the VST data with liter-ature data for NGC 1399. All the light profilesfrom the literature were shifted to the g-band pro-file, by using the transformations from Fukugita etal. (1996). The most extended light profiles pub-lished in the optical bands for NGC 1399 are fromSchombert (1986), Caon et al. (1994) and Dirschet al. (2003) and they are compared with the VSTprofile in the g band in the right panel of Fig. 2.On average, the agreement is quite good. Thelight profile by Caon et al. (1994) extends out to14 arcmin. It was obtained along the major axisof NGC 1399 in the B band and this causes somedifferences, between the two profiles, that are evi-dent for 1 ≤ R ≤ 6 arcmin. A change in the slopeis observed at the same radius (R = 12 arcmin)as the one derived from the VST g-band profile(see right panel of Fig. 2). The light profile pub-lished by Dirsch et al. (2003) (in the R band) isnot an azimuthally average but it is derived bymeasuring the surface brightness around all tar-
6
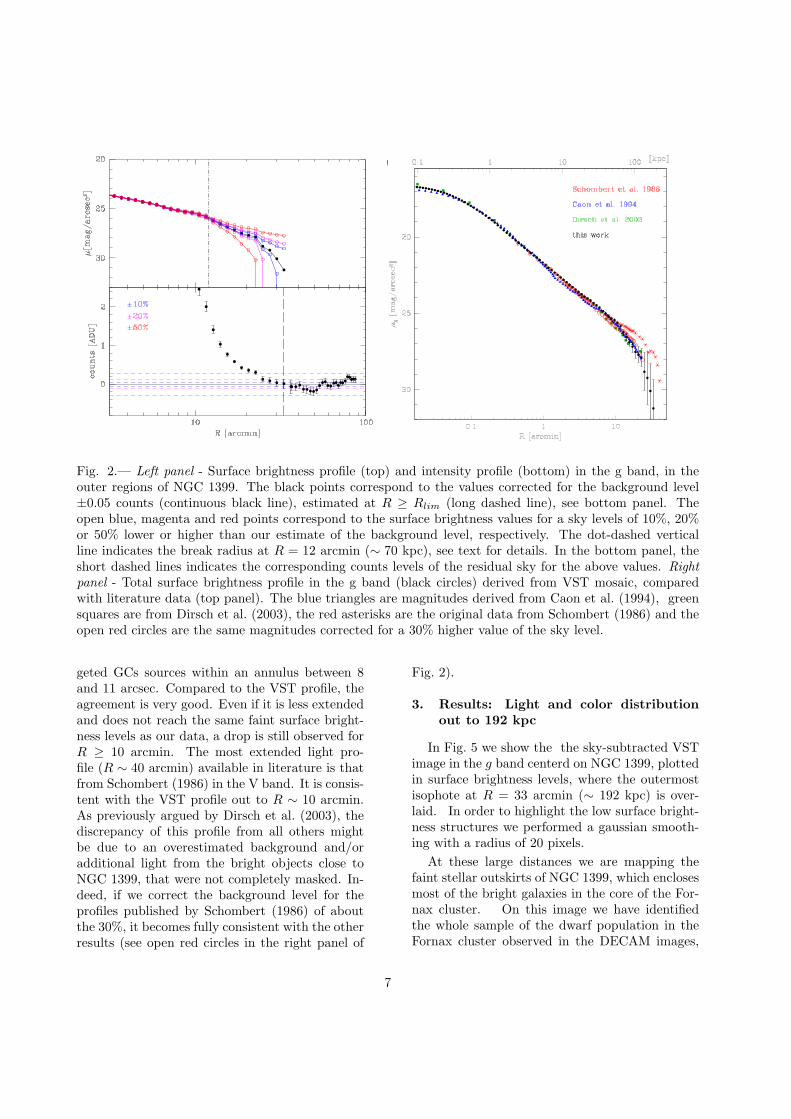
Fig. 2.— Left panel - Surface brightness profile (top) and intensity profile (bottom) in the g band, in theouter regions of NGC 1399. The black points correspond to the values corrected for the background level±0.05 counts (continuous black line), estimated at R ≥ Rlim (long dashed line), see bottom panel. Theopen blue, magenta and red points correspond to the surface brightness values for a sky levels of 10%, 20%or 50% lower or higher than our estimate of the background level, respectively. The dot-dashed verticalline indicates the break radius at R = 12 arcmin (∼ 70 kpc), see text for details. In the bottom panel, theshort dashed lines indicates the corresponding counts levels of the residual sky for the above values. Rightpanel - Total surface brightness profile in the g band (black circles) derived from VST mosaic, comparedwith literature data (top panel). The blue triangles are magnitudes derived from Caon et al. (1994), greensquares are from Dirsch et al. (2003), the red asterisks are the original data from Schombert (1986) and theopen red circles are the same magnitudes corrected for a 30% higher value of the sky level.
geted GCs sources within an annulus between 8and 11 arcsec. Compared to the VST profile, theagreement is very good. Even if it is less extendedand does not reach the same faint surface bright-ness levels as our data, a drop is still observed forR ≥ 10 arcmin. The most extended light pro-file (R ∼ 40 arcmin) available in literature is thatfrom Schombert (1986) in the V band. It is consis-tent with the VST profile out to R ∼ 10 arcmin.As previously argued by Dirsch et al. (2003), thediscrepancy of this profile from all others mightbe due to an overestimated background and/oradditional light from the bright objects close toNGC 1399, that were not completely masked. In-deed, if we correct the background level for theprofiles published by Schombert (1986) of aboutthe 30%, it becomes fully consistent with the otherresults (see open red circles in the right panel of
Fig. 2).
3. Results: Light and color distribution
out to 192 kpc
In Fig. 5 we show the the sky-subtracted VSTimage in the g band centerd on NGC 1399, plottedin surface brightness levels, where the outermostisophote at R = 33 arcmin (∼ 192 kpc) is over-laid. In order to highlight the low surface bright-ness structures we performed a gaussian smooth-ing with a radius of 20 pixels.
At these large distances we are mapping thefaint stellar outskirts of NGC 1399, which enclosesmost of the bright galaxies in the core of the For-nax cluster. On this image we have identifiedthe whole sample of the dwarf population in theFornax cluster observed in the DECAM images,
7
10
30
28
26
24
1 2 3 4 5 6
30
28
26
24
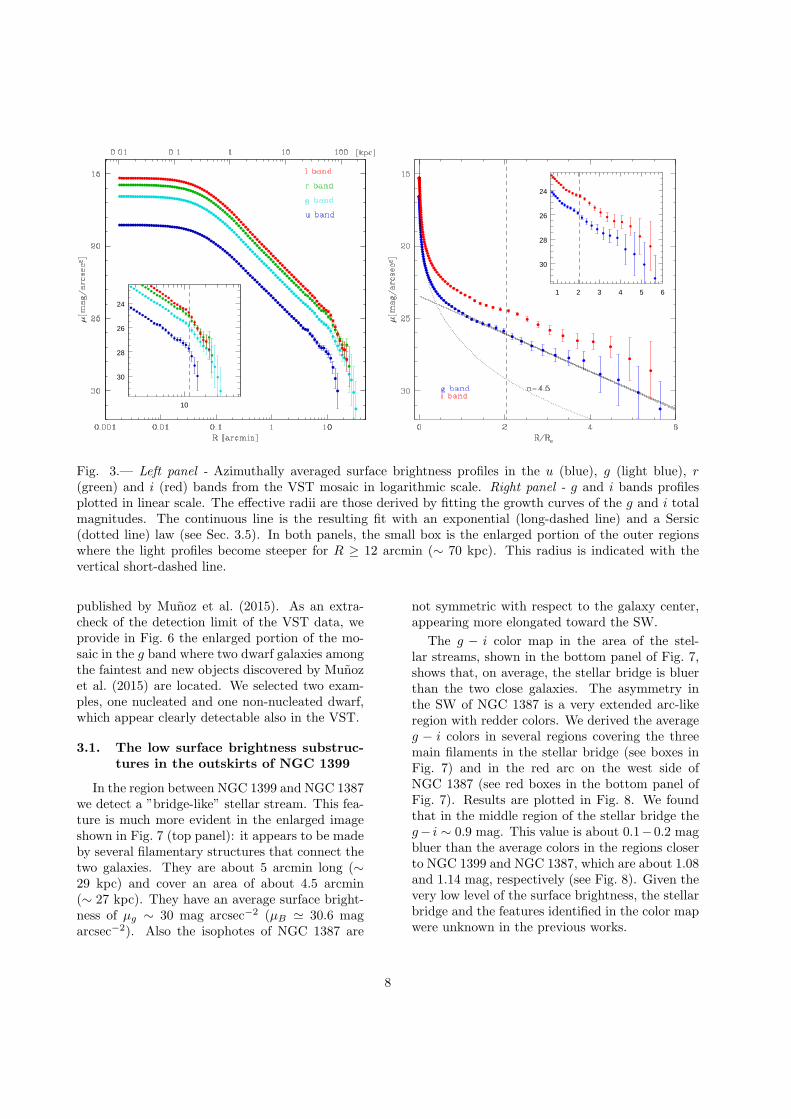
Fig. 3.— Left panel - Azimuthally averaged surface brightness profiles in the u (blue), g (light blue), r(green) and i (red) bands from the VST mosaic in logarithmic scale. Right panel - g and i bands profilesplotted in linear scale. The effective radii are those derived by fitting the growth curves of the g and i totalmagnitudes. The continuous line is the resulting fit with an exponential (long-dashed line) and a Sersic(dotted line) law (see Sec. 3.5). In both panels, the small box is the enlarged portion of the outer regionswhere the light profiles become steeper for R ≥ 12 arcmin (∼ 70 kpc). This radius is indicated with thevertical short-dashed line.
published by Munoz et al. (2015). As an extra-check of the detection limit of the VST data, weprovide in Fig. 6 the enlarged portion of the mo-saic in the g band where two dwarf galaxies amongthe faintest and new objects discovered by Munozet al. (2015) are located. We selected two exam-ples, one nucleated and one non-nucleated dwarf,which appear clearly detectable also in the VST.
3.1. The low surface brightness substruc-
tures in the outskirts of NGC 1399
In the region between NGC 1399 and NGC 1387we detect a ”bridge-like” stellar stream. This fea-ture is much more evident in the enlarged imageshown in Fig. 7 (top panel): it appears to be madeby several filamentary structures that connect thetwo galaxies. They are about 5 arcmin long (∼29 kpc) and cover an area of about 4.5 arcmin(∼ 27 kpc). They have an average surface bright-ness of µg ∼ 30 mag arcsec−2 (µB ≃ 30.6 magarcsec−2). Also the isophotes of NGC 1387 are
not symmetric with respect to the galaxy center,appearing more elongated toward the SW.
The g − i color map in the area of the stel-lar streams, shown in the bottom panel of Fig. 7,shows that, on average, the stellar bridge is bluerthan the two close galaxies. The asymmetry inthe SW of NGC 1387 is a very extended arc-likeregion with redder colors. We derived the averageg − i colors in several regions covering the threemain filaments in the stellar bridge (see boxes inFig. 7) and in the red arc on the west side ofNGC 1387 (see red boxes in the bottom panel ofFig. 7). Results are plotted in Fig. 8. We foundthat in the middle region of the stellar bridge theg− i ∼ 0.9 mag. This value is about 0.1−0.2 magbluer than the average colors in the regions closerto NGC 1399 and NGC 1387, which are about 1.08and 1.14 mag, respectively (see Fig. 8). Given thevery low level of the surface brightness, the stellarbridge and the features identified in the color mapwere unknown in the previous works.
8
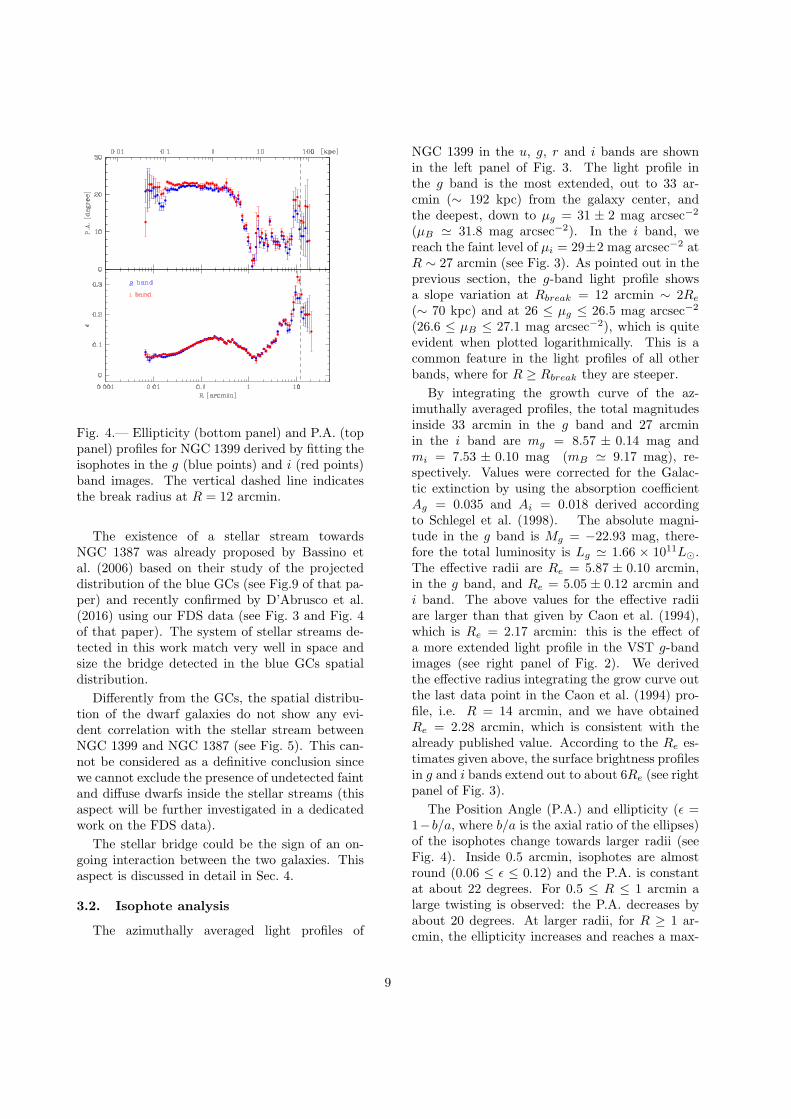
Fig. 4.— Ellipticity (bottom panel) and P.A. (toppanel) profiles for NGC 1399 derived by fitting theisophotes in the g (blue points) and i (red points)band images. The vertical dashed line indicatesthe break radius at R = 12 arcmin.
The existence of a stellar stream towardsNGC 1387 was already proposed by Bassino etal. (2006) based on their study of the projecteddistribution of the blue GCs (see Fig.9 of that pa-per) and recently confirmed by D’Abrusco et al.(2016) using our FDS data (see Fig. 3 and Fig. 4of that paper). The system of stellar streams de-tected in this work match very well in space andsize the bridge detected in the blue GCs spatialdistribution.
Differently from the GCs, the spatial distribu-tion of the dwarf galaxies do not show any evi-dent correlation with the stellar stream betweenNGC 1399 and NGC 1387 (see Fig. 5). This can-not be considered as a definitive conclusion sincewe cannot exclude the presence of undetected faintand diffuse dwarfs inside the stellar streams (thisaspect will be further investigated in a dedicatedwork on the FDS data).
The stellar bridge could be the sign of an on-going interaction between the two galaxies. Thisaspect is discussed in detail in Sec. 4.
3.2. Isophote analysis
The azimuthally averaged light profiles of
NGC 1399 in the u, g, r and i bands are shownin the left panel of Fig. 3. The light profile inthe g band is the most extended, out to 33 ar-cmin (∼ 192 kpc) from the galaxy center, andthe deepest, down to µg = 31 ± 2 mag arcsec−2
(µB ≃ 31.8 mag arcsec−2). In the i band, wereach the faint level of µi = 29±2 mag arcsec−2 atR ∼ 27 arcmin (see Fig. 3). As pointed out in theprevious section, the g-band light profile showsa slope variation at Rbreak = 12 arcmin ∼ 2Re
(∼ 70 kpc) and at 26 ≤ µg ≤ 26.5 mag arcsec−2
(26.6 ≤ µB ≤ 27.1 mag arcsec−2), which is quiteevident when plotted logarithmically. This is acommon feature in the light profiles of all otherbands, where for R ≥ Rbreak they are steeper.
By integrating the growth curve of the az-imuthally averaged profiles, the total magnitudesinside 33 arcmin in the g band and 27 arcminin the i band are mg = 8.57 ± 0.14 mag andmi = 7.53 ± 0.10 mag (mB ≃ 9.17 mag), re-spectively. Values were corrected for the Galac-tic extinction by using the absorption coefficientAg = 0.035 and Ai = 0.018 derived accordingto Schlegel et al. (1998). The absolute magni-tude in the g band is Mg = −22.93 mag, there-fore the total luminosity is Lg ≃ 1.66 × 10¹¹L⊙.The effective radii are Re = 5.87 ± 0.10 arcmin,in the g band, and Re = 5.05 ± 0.12 arcmin andi band. The above values for the effective radiiare larger than that given by Caon et al. (1994),which is Re = 2.17 arcmin: this is the effect ofa more extended light profile in the VST g-bandimages (see right panel of Fig. 2). We derivedthe effective radius integrating the grow curve outthe last data point in the Caon et al. (1994) pro-file, i.e. R = 14 arcmin, and we have obtainedRe = 2.28 arcmin, which is consistent with thealready published value. According to the Re es-timates given above, the surface brightness profilesin g and i bands extend out to about 6Re (see rightpanel of Fig. 3).
The Position Angle (P.A.) and ellipticity (ǫ =1−b/a, where b/a is the axial ratio of the ellipses)of the isophotes change towards larger radii (seeFig. 4). Inside 0.5 arcmin, isophotes are almostround (0.06 ≤ ǫ ≤ 0.12) and the P.A. is constantat about 22 degrees. For 0.5 ≤ R ≤ 1 arcmin alarge twisting is observed: the P.A. decreases byabout 20 degrees. At larger radii, for R ≥ 1 ar-cmin, the ellipticity increases and reaches a max-
9

Fig. 5.— VST image centered on NGC 1399 in the g band, plotted in surface brightness levels. The imagesize is 68.95×51.10 arcmin. The dashed black ellipse is the isophote at the limiting radius Rlim = 33 arcmin(∼ 192 kpc). The surface brightness level contours between 30 ≤ µg ≤ 31.2 mag arcsec−2 are shown in blue.The dashed black lines direction along which we extracted the radial profiles shown in Fig. 9 and we observea light excess. The black circles identify the whole sample of dwarf galaxies in the Fornax cluster observedin the DECAM images published by Munoz et al. (2015).
10
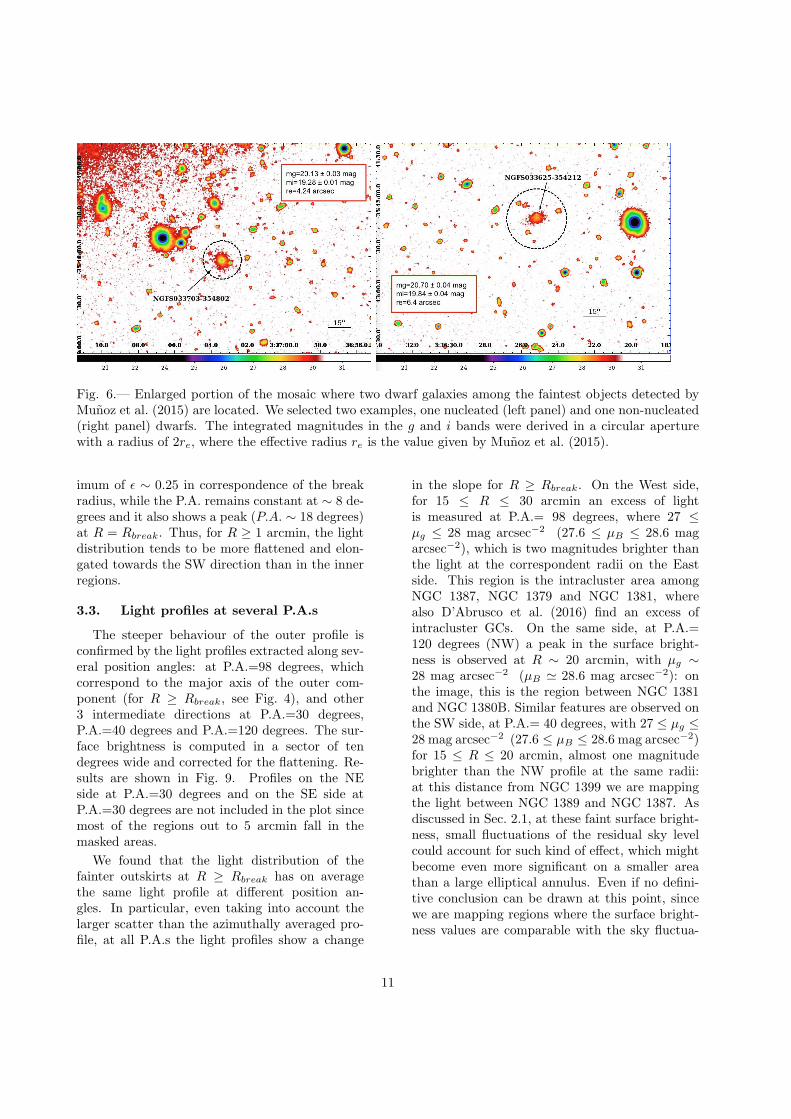
Fig. 6.— Enlarged portion of the mosaic where two dwarf galaxies among the faintest objects detected byMunoz et al. (2015) are located. We selected two examples, one nucleated (left panel) and one non-nucleated(right panel) dwarfs. The integrated magnitudes in the g and i bands were derived in a circular aperturewith a radius of 2re, where the effective radius re is the value given by Munoz et al. (2015).
imum of ǫ ∼ 0.25 in correspondence of the breakradius, while the P.A. remains constant at ∼ 8 de-grees and it also shows a peak (P.A. ∼ 18 degrees)at R = Rbreak. Thus, for R ≥ 1 arcmin, the lightdistribution tends to be more flattened and elon-gated towards the SW direction than in the innerregions.
3.3. Light profiles at several P.A.s
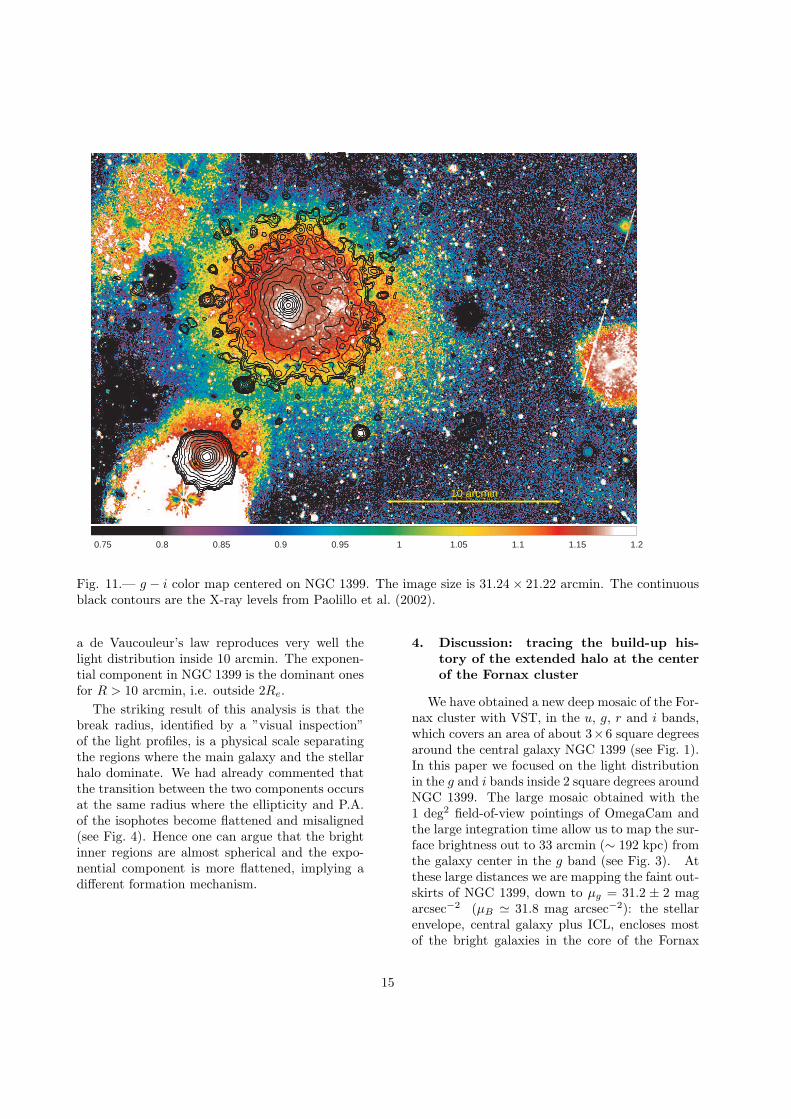
The steeper behaviour of the outer profile isconfirmed by the light profiles extracted along sev-eral position angles: at P.A.=98 degrees, whichcorrespond to the major axis of the outer com-ponent (for R ≥ Rbreak, see Fig. 4), and other3 intermediate directions at P.A.=30 degrees,P.A.=40 degrees and P.A.=120 degrees. The sur-face brightness is computed in a sector of tendegrees wide and corrected for the flattening. Re-sults are shown in Fig. 9. Profiles on the NEside at P.A.=30 degrees and on the SE side atP.A.=30 degrees are not included in the plot sincemost of the regions out to 5 arcmin fall in themasked areas.
We found that the light distribution of thefainter outskirts at R ≥ Rbreak has on averagethe same light profile at different position an-gles. In particular, even taking into account thelarger scatter than the azimuthally averaged pro-file, at all P.A.s the light profiles show a change
in the slope for R ≥ Rbreak. On the West side,for 15 ≤ R ≤ 30 arcmin an excess of lightis measured at P.A.= 98 degrees, where 27 ≤
µg ≤ 28 mag arcsec−2 (27.6 ≤ µB ≤ 28.6 magarcsec−2), which is two magnitudes brighter thanthe light at the correspondent radii on the Eastside. This region is the intracluster area amongNGC 1387, NGC 1379 and NGC 1381, wherealso D’Abrusco et al. (2016) find an excess ofintracluster GCs. On the same side, at P.A.=120 degrees (NW) a peak in the surface bright-ness is observed at R ∼ 20 arcmin, with µg ∼
28 mag arcsec−2 (µB ≃ 28.6 mag arcsec−2): onthe image, this is the region between NGC 1381and NGC 1380B. Similar features are observed onthe SW side, at P.A.= 40 degrees, with 27 ≤ µg ≤
28 mag arcsec−2 (27.6 ≤ µB ≤ 28.6 mag arcsec−2)for 15 ≤ R ≤ 20 arcmin, almost one magnitudebrighter than the NW profile at the same radii:at this distance from NGC 1399 we are mappingthe light between NGC 1389 and NGC 1387. Asdiscussed in Sec. 2.1, at these faint surface bright-ness, small fluctuations of the residual sky levelcould account for such kind of effect, which mightbecome even more significant on a smaller areathan a large elliptical annulus. Even if no defini-tive conclusion can be drawn at this point, sincewe are mapping regions where the surface bright-ness values are comparable with the sky fluctua-
11
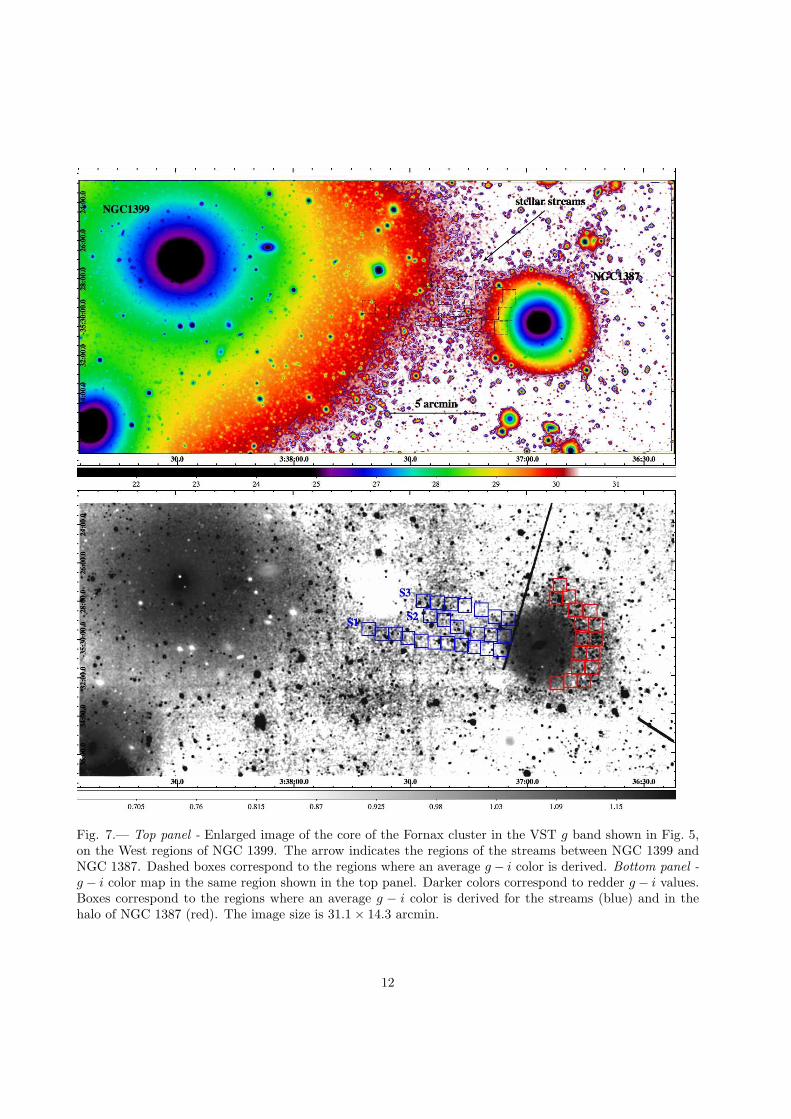
Fig. 7.— Top panel - Enlarged image of the core of the Fornax cluster in the VST g band shown in Fig. 5,on the West regions of NGC 1399. The arrow indicates the regions of the streams between NGC 1399 andNGC 1387. Dashed boxes correspond to the regions where an average g − i color is derived. Bottom panel -g − i color map in the same region shown in the top panel. Darker colors correspond to redder g − i values.Boxes correspond to the regions where an average g − i color is derived for the streams (blue) and in thehalo of NGC 1387 (red). The image size is 31.1× 14.3 arcmin.
12
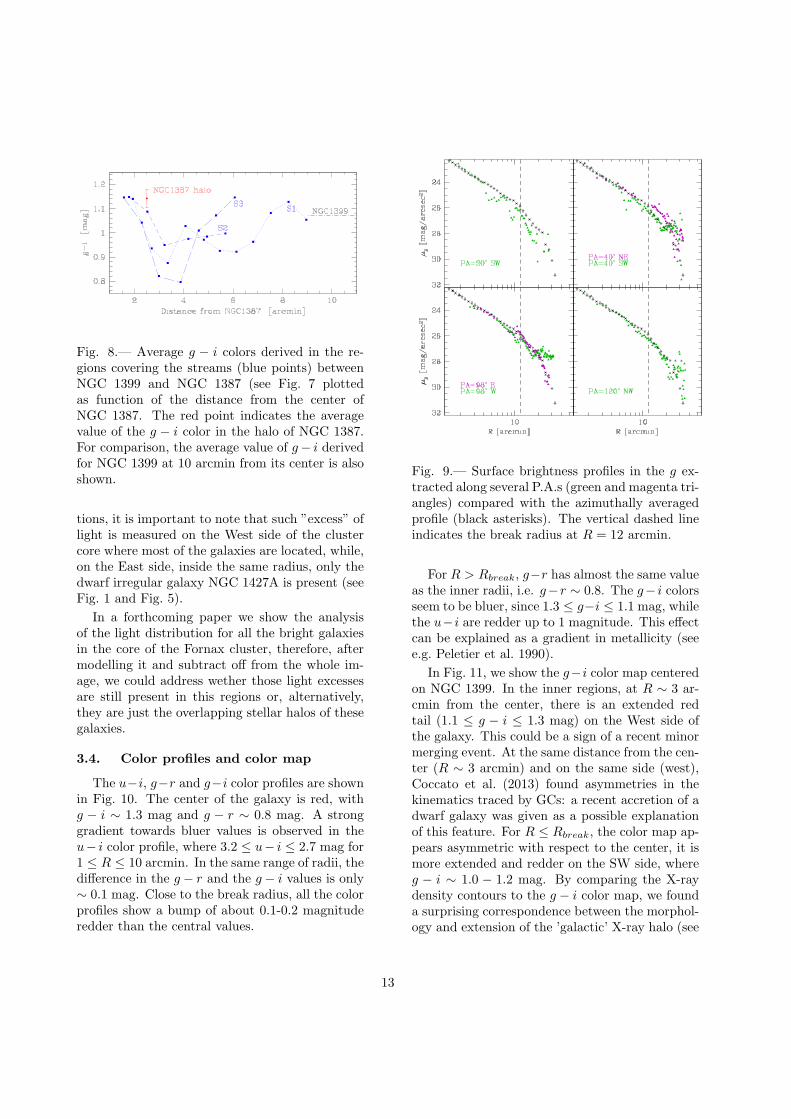
Fig. 8.— Average g − i colors derived in the re-gions covering the streams (blue points) betweenNGC 1399 and NGC 1387 (see Fig. 7 plottedas function of the distance from the center ofNGC 1387. The red point indicates the averagevalue of the g − i color in the halo of NGC 1387.For comparison, the average value of g− i derivedfor NGC 1399 at 10 arcmin from its center is alsoshown.
tions, it is important to note that such ”excess” oflight is measured on the West side of the clustercore where most of the galaxies are located, while,on the East side, inside the same radius, only thedwarf irregular galaxy NGC 1427A is present (seeFig. 1 and Fig. 5).
In a forthcoming paper we show the analysisof the light distribution for all the bright galaxiesin the core of the Fornax cluster, therefore, aftermodelling it and subtract off from the whole im-age, we could address wether those light excessesare still present in this regions or, alternatively,they are just the overlapping stellar halos of thesegalaxies.
3.4. Color profiles and color map
The u−i, g−r and g−i color profiles are shownin Fig. 10. The center of the galaxy is red, withg − i ∼ 1.3 mag and g − r ∼ 0.8 mag. A stronggradient towards bluer values is observed in theu− i color profile, where 3.2 ≤ u− i ≤ 2.7 mag for1 ≤ R ≤ 10 arcmin. In the same range of radii, thedifference in the g − r and the g − i values is only∼ 0.1 mag. Close to the break radius, all the colorprofiles show a bump of about 0.1-0.2 magnituderedder than the central values.
Fig. 9.— Surface brightness profiles in the g ex-tracted along several P.A.s (green and magenta tri-angles) compared with the azimuthally averagedprofile (black asterisks). The vertical dashed lineindicates the break radius at R = 12 arcmin.
For R > Rbreak, g−r has almost the same valueas the inner radii, i.e. g−r ∼ 0.8. The g− i colorsseem to be bluer, since 1.3 ≤ g−i ≤ 1.1 mag, whilethe u− i are redder up to 1 magnitude. This effectcan be explained as a gradient in metallicity (seee.g. Peletier et al. 1990).
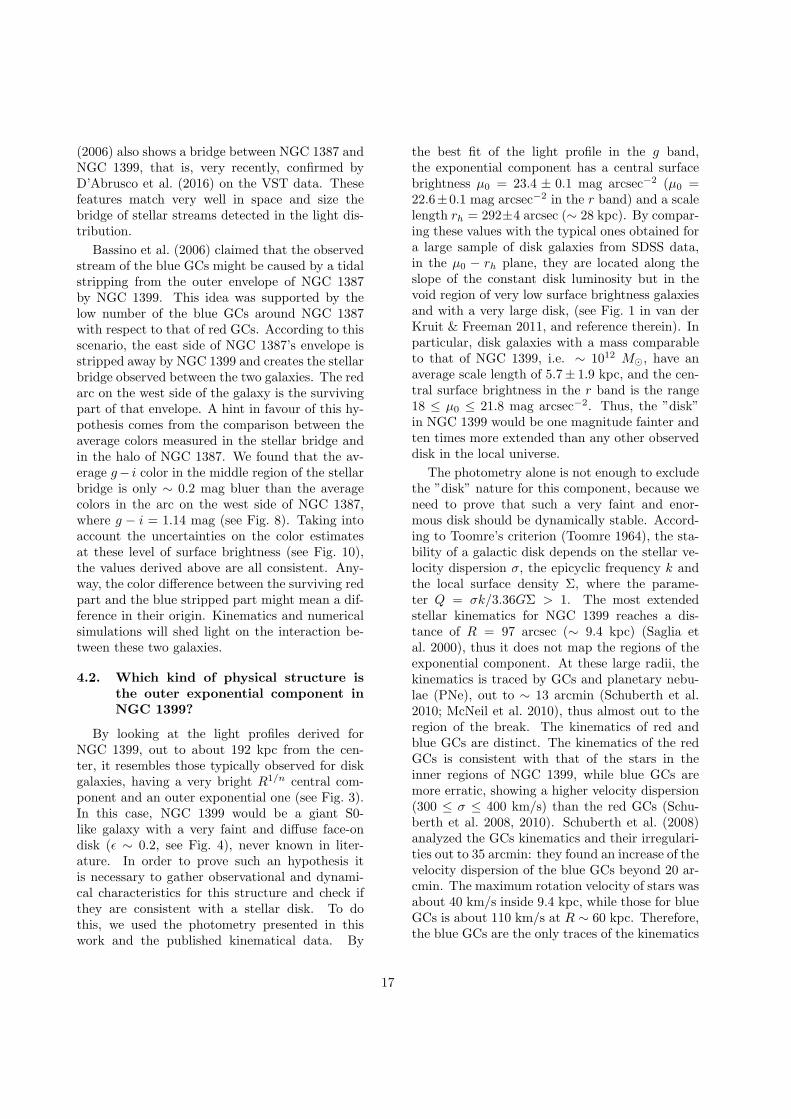
In Fig. 11, we show the g−i color map centeredon NGC 1399. In the inner regions, at R ∼ 3 ar-cmin from the center, there is an extended redtail (1.1 ≤ g − i ≤ 1.3 mag) on the West side ofthe galaxy. This could be a sign of a recent minormerging event. At the same distance from the cen-ter (R ∼ 3 arcmin) and on the same side (west),Coccato et al. (2013) found asymmetries in thekinematics traced by GCs: a recent accretion of adwarf galaxy was given as a possible explanationof this feature. For R ≤ Rbreak, the color map ap-pears asymmetric with respect to the center, it ismore extended and redder on the SW side, whereg − i ∼ 1.0 − 1.2 mag. By comparing the X-raydensity contours to the g − i color map, we founda surprising correspondence between the morphol-ogy and extension of the ’galactic’ X-ray halo (see
13

Fig. 10.— Azimuthally averaged color profile asfunction of the radius. The dashed line indicatesthe break radius R = 12 arcmin (∼ 70 kpc).
Paolillo et al. 2002) on the west side of the galaxyand the color asymmetries observed in the stellarlight. In particular, X-ray contours match withthe shape of the red tail observed in the inner re-gions of the galaxy on the west side.
3.5. Profile fitting: the exponential halo
around NGC 1399
As pointed out in Sec. 1, several recent workshave shown that the light profiles of BCGs arenot uniquely and well fitted by a single Sersic pro-file, where the intensity I(R) ∝ R1/n, but in sev-eral cases a second component is needed to fit theouter stellar halo (Seigar et al. 2007; Donzelli etal. 2011; Arnaboldi et al. 2012). For NGC 1399,Schombert (1986) tried to fit the light profile witha single component, using the de Vaucouleur’s law:the best fit matches very well only the inner andbrighter regions of the galaxy for R ≤ 10 arcmin.As discussed above, the azimuthally averaged lightprofiles of NGC 1399 (in both g and i bands) havean extended steeper behaviour for R ≥ Rbreak (seeright panel of Fig. 3), which clearly requires a fitwith two components. Therefore, we adopted a
Sersic law (Sersic 1963), given by the equation
µ(R) = µe + k(n)
[
(
R
re
)1/n
− 1
]
(1)
which accounts for the inner and most lumi-nous part of the galaxy, plus an outer exponentialfunction given by
µ(R) = µ0 + 1.086×R/rh (2)
In the above formulae R is the galactocentricdistance, re and µe are the effective radius andeffective surface brightness respectively, k(n) =2.17n − 0.355 (see Caon et al. 1993), µ0 and rhare the central surface brightness and scale lengthof the exponential component.
We performed a least-square fit of the az-imuthally averaged surface brightness profile inthe g band, for R ≥ 0.1 arcmin, to exclude thepower-law core of the galaxy. The structural pa-rameters that give the best fit are the following:µe = 21.5 ± 0.3 mag arcsec−2 (µB
e ≃ 22.1 magarcsec−2), re = 49.1 ± 0.7 arcsec (∼ 4.7 kpc),n = 4.5±0.7, µ0 = 23.4±0.1 mag arcsec−2 (µB
0≃
24 mag arcsec−2), rh = 292± 4 arcsec (∼ 28 kpc)and results are shown in the right panel of Fig. 3.The total g-band magnitude of the exponentialcomponent, corrected for the galactic extinction(see Sec. 3), is mhalo
tot = 9.13 mag. Thus, com-pared to the total magnitude of the whole system(see Sec. 3), it contributes about 60% of the totallight, where the ratio is Lexp/Lgal = 0.60± 0.03.
The above parameters are within the range ofvalues derived by Donzelli et al. (2011) for the 205BCGs having double component profiles. In par-ticular, the scale length of the exponential compo-nent measured for NGC 1399 is comparable withthe average value of 25 kpc found for this largesample of galaxies.
From the best fit, we derived the total luminos-ity of the Sersic component and of the exponentialone as function of the radius. In Fig. 12 are plottedthe relative fraction of the two components withrespect to the total light profile: the inner Sersiccomponent dominates the light distribution inside∼ 1 arcmin (≤ 0.3Re), where the contribution tothe total light is about the 90%. At R = 10 ar-cmin, the two components contribute by the 50%to the total light. This is consistent with the pre-vious fit performed by Schombert (1986), where
14
0.75 0.8 0.85 0.9 0.95 1 1.05 1.1 1.15 1.2
10 arcmin
Fig. 11.— g − i color map centered on NGC 1399. The image size is 31.24× 21.22 arcmin. The continuousblack contours are the X-ray levels from Paolillo et al. (2002).
a de Vaucouleur’s law reproduces very well thelight distribution inside 10 arcmin. The exponen-tial component in NGC 1399 is the dominant onesfor R > 10 arcmin, i.e. outside 2Re.
The striking result of this analysis is that thebreak radius, identified by a ”visual inspection”of the light profiles, is a physical scale separatingthe regions where the main galaxy and the stellarhalo dominate. We had already commented thatthe transition between the two components occursat the same radius where the ellipticity and P.A.of the isophotes become flattened and misaligned(see Fig. 4). Hence one can argue that the brightinner regions are almost spherical and the expo-nential component is more flattened, implying adifferent formation mechanism.
4. Discussion: tracing the build-up his-
tory of the extended halo at the center
of the Fornax cluster
We have obtained a new deep mosaic of the For-nax cluster with VST, in the u, g, r and i bands,which covers an area of about 3×6 square degreesaround the central galaxy NGC 1399 (see Fig. 1).In this paper we focused on the light distributionin the g and i bands inside 2 square degrees aroundNGC 1399. The large mosaic obtained with the1 deg2 field-of-view pointings of OmegaCam andthe large integration time allow us to map the sur-face brightness out to 33 arcmin (∼ 192 kpc) fromthe galaxy center in the g band (see Fig. 3). Atthese large distances we are mapping the faint out-skirts of NGC 1399, down to µg = 31.2 ± 2 magarcsec−2 (µB ≃ 31.8 mag arcsec−2): the stellarenvelope, central galaxy plus ICL, encloses mostof the bright galaxies in the core of the Fornax
15

Fig. 12.— Fraction of the Sersic (red line) andexponential (blue line) component with respect tothe total contribution of both of them as functionof the galactocentric radius.
cluster (see Fig. 5).
The main results given by the analysis of thelight distribution down to the above levels of sur-face brightness are the following:
1. we detected a ”bridge-like” stellar streamin the region between NGC 1399 and thenearby early-type galaxy NGC 1387 (seeFig. 7). It is very faint, with 29 ≤ µg ≤
31 mag arcsec−2 (29.6 ≤ µB ≤ 31.6 magarcsec−2), and it is about 5 arcmin wide(∼ 29 kpc). Given the very low level ofthe surface brightness, this structure was un-known in the previous works;
2. the azimuthally averaged light profile in theg band is consistent with the presence of twomain components: the bright central part ofNGC 1399, which contributes about 90% ofthe light inside 1 arcmin (i.e. ≤ 0.3Re) andit is well fitted by a Sersic law with n = 4.5,and an exponential outer component fromR ≥ 10 arcmin, which contributes to about60% to the total galaxy light and extendsout to about 6Re (see Fig. 3). The break
radius at R = 10 arcmin is a physical scaleseparating the regions where the two com-ponents dominate.
In this section we discuss the main implicationsof these results on the build-up history of the cen-ter of the Fornax cluster.
4.1. What about the origin of the bridge-
like stellar stream in the halo region
between NGC 1399 and NGC 1387?
Stellar streams of comparable low surfacebrightness and extension as detected in the out-skirts of NGC 1399 are also observed in the haloof several galaxies. Results by the pilot surveyof tidal streams published by Martınez-Delgadoet al. (2010), as well as those detected aroundgalaxies in the SDSS DR7 archive by Miskolczi etal. (2011) suggest that several morphologies existfor such a faint stellar structures, like great cir-cles, spikes, very long tails or also mixed type ofstreams. The morphology and stellar populationof the stellar streams is strictly related to whichkind of gravitational interaction make them andthe nature of the galaxies involved in it. As dis-cussed by Duc et al. (2015), the material expelledfrom a galaxy, which is interacting with a compan-ion massive enough to perturb it, produces a tidaltail having similar age and metallicity (i.e. colors)to those measured in the parent galaxy. On theother hand, when a low mass galaxy is disruptingin the halo of a massive object it produce a tidalstream, made of material different from that inthe massive galaxy. The system of NGC 2698/99in the ATLAS3D sample is an example of a tidalinteraction producing tails, which also shows a lu-minous bridge of stars between the two galaxies(see Fig. 21 in Duc et al. 2015, paper).
As mentioned in Sec. 3, the stellar bridge-like structure detected between NGC 1399 andNGC 1387 could be the sign of an ongoing inter-action between the two galaxies. The deep imagestaken at VST show that NGC 1387 has asym-metric isophotes at low surface brightness levels(29 . µg . 31 mag arcsec−2), which appear moreelongated towards the west side. These featuresare quite evident in the g − i color map, wherethe galaxy shows a red arc-like structure on thisside (see bottom panel of Fig. 7). The projecteddistribution of the blue GCs by Bassino et al.
16
(2006) also shows a bridge between NGC 1387 andNGC 1399, that is, very recently, confirmed byD’Abrusco et al. (2016) on the VST data. Thesefeatures match very well in space and size thebridge of stellar streams detected in the light dis-tribution.
Bassino et al. (2006) claimed that the observedstream of the blue GCs might be caused by a tidalstripping from the outer envelope of NGC 1387by NGC 1399. This idea was supported by thelow number of the blue GCs around NGC 1387with respect to that of red GCs. According to thisscenario, the east side of NGC 1387’s envelope isstripped away by NGC 1399 and creates the stellarbridge observed between the two galaxies. The redarc on the west side of the galaxy is the survivingpart of that envelope. A hint in favour of this hy-pothesis comes from the comparison between theaverage colors measured in the stellar bridge andin the halo of NGC 1387. We found that the av-erage g− i color in the middle region of the stellarbridge is only ∼ 0.2 mag bluer than the averagecolors in the arc on the west side of NGC 1387,where g − i = 1.14 mag (see Fig. 8). Taking intoaccount the uncertainties on the color estimatesat these level of surface brightness (see Fig. 10),the values derived above are all consistent. Any-way, the color difference between the surviving redpart and the blue stripped part might mean a dif-ference in their origin. Kinematics and numericalsimulations will shed light on the interaction be-tween these two galaxies.
4.2. Which kind of physical structure is
the outer exponential component in
NGC 1399?
By looking at the light profiles derived forNGC 1399, out to about 192 kpc from the cen-ter, it resembles those typically observed for diskgalaxies, having a very bright R1/n central com-ponent and an outer exponential one (see Fig. 3).In this case, NGC 1399 would be a giant S0-like galaxy with a very faint and diffuse face-ondisk (ǫ ∼ 0.2, see Fig. 4), never known in liter-ature. In order to prove such an hypothesis itis necessary to gather observational and dynami-cal characteristics for this structure and check ifthey are consistent with a stellar disk. To dothis, we used the photometry presented in thiswork and the published kinematical data. By
the best fit of the light profile in the g band,the exponential component has a central surfacebrightness µ0 = 23.4 ± 0.1 mag arcsec−2 (µ0 =22.6±0.1 mag arcsec−2 in the r band) and a scalelength rh = 292±4 arcsec (∼ 28 kpc). By compar-ing these values with the typical ones obtained fora large sample of disk galaxies from SDSS data,in the µ0 − rh plane, they are located along theslope of the constant disk luminosity but in thevoid region of very low surface brightness galaxiesand with a very large disk, (see Fig. 1 in van derKruit & Freeman 2011, and reference therein). Inparticular, disk galaxies with a mass comparableto that of NGC 1399, i.e. ∼ 1012 M⊙, have anaverage scale length of 5.7± 1.9 kpc, and the cen-tral surface brightness in the r band is the range18 ≤ µ0 ≤ 21.8 mag arcsec−2. Thus, the ”disk”in NGC 1399 would be one magnitude fainter andten times more extended than any other observeddisk in the local universe.
The photometry alone is not enough to excludethe ”disk” nature for this component, because weneed to prove that such a very faint and enor-mous disk should be dynamically stable. Accord-ing to Toomre’s criterion (Toomre 1964), the sta-bility of a galactic disk depends on the stellar ve-locity dispersion σ, the epicyclic frequency k andthe local surface density Σ, where the parame-ter Q = σk/3.36GΣ > 1. The most extendedstellar kinematics for NGC 1399 reaches a dis-tance of R = 97 arcsec (∼ 9.4 kpc) (Saglia etal. 2000), thus it does not map the regions of theexponential component. At these large radii, thekinematics is traced by GCs and planetary nebu-lae (PNe), out to ∼ 13 arcmin (Schuberth et al.2010; McNeil et al. 2010), thus almost out to theregion of the break. The kinematics of red andblue GCs are distinct. The kinematics of the redGCs is consistent with that of the stars in theinner regions of NGC 1399, while blue GCs aremore erratic, showing a higher velocity dispersion(300 ≤ σ ≤ 400 km/s) than the red GCs (Schu-berth et al. 2008, 2010). Schuberth et al. (2008)analyzed the GCs kinematics and their irregulari-ties out to 35 arcmin: they found an increase of thevelocity dispersion of the blue GCs beyond 20 ar-cmin. The maximum rotation velocity of stars wasabout 40 km/s inside 9.4 kpc, while those for blueGCs is about 110 km/s at R ∼ 60 kpc. Therefore,the blue GCs are the only traces of the kinematics
17

in the region of the exponential component. As-suming as average value of the rotation velocityVrot ∼ 180 km/s (corrected for inclination) and asvelocity dispersion σ ∼ 300 km/s for the blue GCs,we estimate the Q parameter at the break radiusR = 10 arcmin (∼ 58 kpc), where the exponentialcomponent starts to dominate the light, and atthe last measured point in the surface brightnessprofiles R = 33 arcmin (∼ 192 kpc). The localsurface density is derived by the surface bright-ness profile at these radii by using a mass-to-lightratio M/L = 32 M⊙/L⊙ at R = 10 arcmin andM/L = 42 M⊙/L⊙ at R = 33 arcmin. These arederived by using the total mass given by the GCsdynamics (see Fig.19 in Schuberth et al. 2008) andthe total luminosity integrated at the same radiifrom the VST g band profile. Given that, we findQ[R = 10] ∼ 0.85 and Q[R = 33] ∼ 4× 10⁻⁵, thusQ < 1 over the whole extension of the exponentialcomponent. This analysis allows us to concludethat such a faint and large exponential componentcannot be a dynamically-supported disk. There-fore, we associate the light of inner component tothe bright cluster member NGC 1399 and the ex-tended outer component to its stellar halo. Thesystem galaxy plus halo has a total magnitude inthe g band of 8.57 mag (see Sec. 3), therefore it hastotal luminosity L ∼ 2×10¹¹ L⊙. According to theM/L ratio at 192 kpc estimated above, we foundthat this system has a total mass M ∼ 7×10¹² M⊙.
4.3. What is the vision from other dynam-
ical tracers in the halo region?
The large-scale study of the GCs in NGC 1399published by Dirsch et al. (2003) and Bassino et al.(2006) provide the color and spatial distributionup to the projected distance of 52 arcmin. Theyfound that the blue GCs dominate in the outerregions and their radial distribution show a slopechange at R ∼ 7 arcmin, while the red GCs havea single power law profile on the entire range ofradii (see Fig. 13). The radial distribution of thered GCs follows the slope of the surface brightnessout to the break radius, while the blue GCs donot seem to match the steep light profile for R ≥
Rbreak, being shallower.
The X-ray halo of NGC 1399 extends out toabout 90 kpc and it is very asymmetric; Paolilloet al. (2002) noted the presence of several compo-nents: the ’galactic’ halo extends out to ∼ 7 ar-
cmin and is offset toward the west with respect tothe optical galaxy centroid, while on larger scalesthe ’cluster’ halo is elongated in the opposite di-rection. The transition between the ’galactic’ and’cluster’ X-ray density profile occurs at R ∼ 7 ar-cmin, which is consistent with the value where theblue GCs radial distribution starts to dominateover the red GC component, and it is a few arcminutes smaller than the break radius identifiedin the light distribution (see Fig. 13).
As a conclusion of the cross-analysis with dif-ferent tracers we find that there is a ”transition”region (very close in radius) where the light distri-bution, the blue GCs and the X-ray density pro-file show a different slope with respect to the innerregions (see Fig. 13). In correspondence of this re-gion the kinematics of blue GCs is different fromthat of the red GCs, which is consistent with thatof the stars in the inner regions, while the analysisof the X-ray emitting gas supports the presenceof different dynamical components. Moreover, aspointed out in Sec. 3, the 2D density distributionsof stars, blue GCs and X-ray consistently show anasymmetry on the west side, toward the nearbyearly-type galaxy NGC 1387.
The above results confirm those derived byHilker et al. (1999) that adopted a similar ap-proach. By comparing the light distribution inNGC 1399, down to about 24 mag arcsec−2 in theV band, with the surface density of GCs and X-ray, and with the surface brightness of dE/dS0galaxies, they found that the profile slopes of theblue GCs population, X-ray and the cD halo lightare very similar in extension and slope. As sug-gested by Hilker et al. (1999), the agreement in theabove properties might suggest that these compo-nents share a common history.
4.4. What do theoretical studies on the
halo formation predict for the shape
of the light profile?
According to Cooper et al. (2013), the breakradius in the total stellar mass density sets thetransition region in the galaxy halo between thestars formed in situ to those captured from ac-cretion events. The shape of the light profile forR ≥ Rbreak could be indicative of which kind ofaccretion mechanism shaped the galaxy halo in thepast. As discussed by Deason et al. (2013), whenplotted in logarithmic scale, some outer light pro-
18
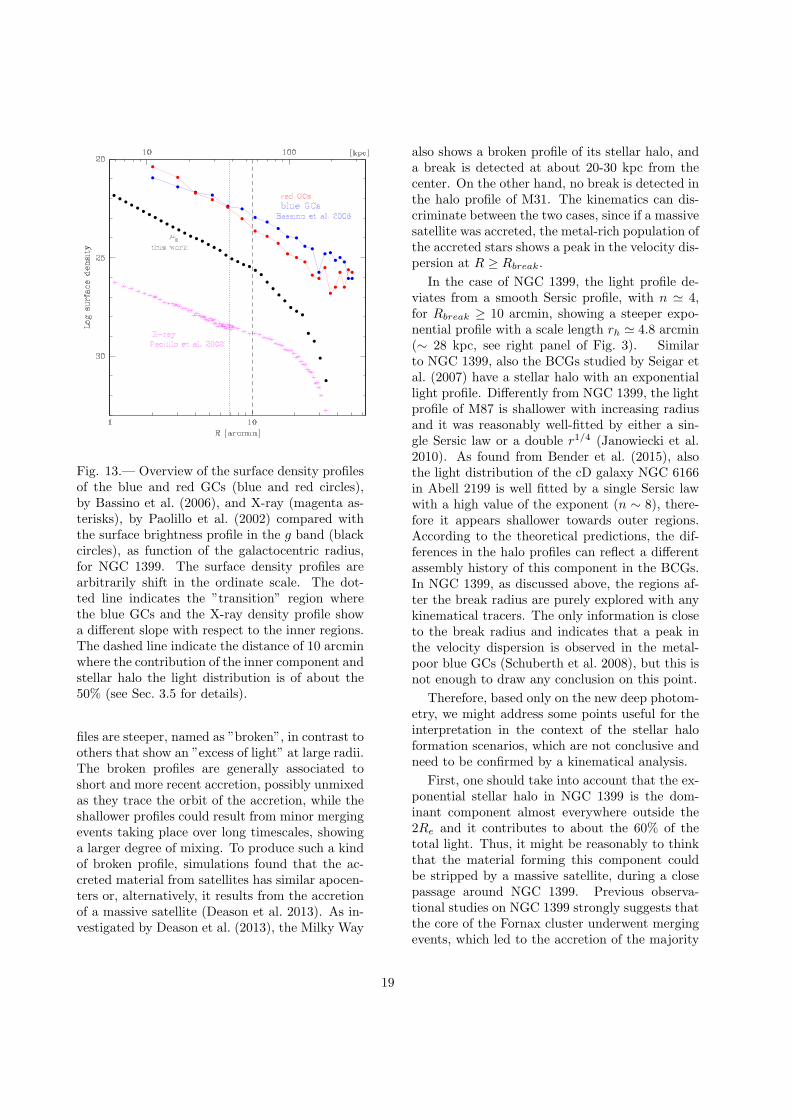
Fig. 13.— Overview of the surface density profilesof the blue and red GCs (blue and red circles),by Bassino et al. (2006), and X-ray (magenta as-terisks), by Paolillo et al. (2002) compared withthe surface brightness profile in the g band (blackcircles), as function of the galactocentric radius,for NGC 1399. The surface density profiles arearbitrarily shift in the ordinate scale. The dot-ted line indicates the ”transition” region wherethe blue GCs and the X-ray density profile showa different slope with respect to the inner regions.The dashed line indicate the distance of 10 arcminwhere the contribution of the inner component andstellar halo the light distribution is of about the50% (see Sec. 3.5 for details).
files are steeper, named as ”broken”, in contrast toothers that show an ”excess of light” at large radii.The broken profiles are generally associated toshort and more recent accretion, possibly unmixedas they trace the orbit of the accretion, while theshallower profiles could result from minor mergingevents taking place over long timescales, showinga larger degree of mixing. To produce such a kindof broken profile, simulations found that the ac-creted material from satellites has similar apocen-ters or, alternatively, it results from the accretionof a massive satellite (Deason et al. 2013). As in-vestigated by Deason et al. (2013), the Milky Way
also shows a broken profile of its stellar halo, anda break is detected at about 20-30 kpc from thecenter. On the other hand, no break is detected inthe halo profile of M31. The kinematics can dis-criminate between the two cases, since if a massivesatellite was accreted, the metal-rich population ofthe accreted stars shows a peak in the velocity dis-persion at R ≥ Rbreak.
In the case of NGC 1399, the light profile de-viates from a smooth Sersic profile, with n ≃ 4,for Rbreak ≥ 10 arcmin, showing a steeper expo-nential profile with a scale length rh ≃ 4.8 arcmin(∼ 28 kpc, see right panel of Fig. 3). Similarto NGC 1399, also the BCGs studied by Seigar etal. (2007) have a stellar halo with an exponentiallight profile. Differently from NGC 1399, the lightprofile of M87 is shallower with increasing radiusand it was reasonably well-fitted by either a sin-gle Sersic law or a double r1/4 (Janowiecki et al.2010). As found from Bender et al. (2015), alsothe light distribution of the cD galaxy NGC 6166in Abell 2199 is well fitted by a single Sersic lawwith a high value of the exponent (n ∼ 8), there-fore it appears shallower towards outer regions.According to the theoretical predictions, the dif-ferences in the halo profiles can reflect a differentassembly history of this component in the BCGs.In NGC 1399, as discussed above, the regions af-ter the break radius are purely explored with anykinematical tracers. The only information is closeto the break radius and indicates that a peak inthe velocity dispersion is observed in the metal-poor blue GCs (Schuberth et al. 2008), but this isnot enough to draw any conclusion on this point.
Therefore, based only on the new deep photom-etry, we might address some points useful for theinterpretation in the context of the stellar haloformation scenarios, which are not conclusive andneed to be confirmed by a kinematical analysis.
First, one should take into account that the ex-ponential stellar halo in NGC 1399 is the dom-inant component almost everywhere outside the2Re and it contributes to about the 60% of thetotal light. Thus, it might be reasonably to thinkthat the material forming this component couldbe stripped by a massive satellite, during a closepassage around NGC 1399. Previous observa-tional studies on NGC 1399 strongly suggests thatthe core of the Fornax cluster underwent mergingevents, which led to the accretion of the majority
19

of blue GCs (Schuberth et al. 2010). If any kindof gravitational interaction happened in a recentepoch, we should found signs of it, in the formof tidal tails or streams, in the light distribution.Therefore, the frequency and the spatial distribu-tions of such a features are strong constraints onthe timescale and orbits of the accretion event, re-spectively.
Differently from the Virgo cluster, the deep im-ages of the core of the Fornax cluster do not revealbright and extended structures of this type, ex-cept for the red tail detected at R ∼ 3 arcmin andthe faint streams towards NGC 1387 (see Sec. 3,Fig. 7). This remains valid even considering thatthe Virgo cluster is about 3 Mpc closer, thus thefaint structure in the light distribution detected inthe Fornax cluster would have an absolute magni-tude of only ∼ 0.3 mag brighter. On the otherhand, at the same faint level of surface brightness,around the giant bright galaxies M49, M86 andM87 several tidal tails are detected, some of themvery extended, up to 100 kpc (Mihos et al. 2005;Rudick et al. 2010; Janowiecki et al. 2010; Lon-gobardi et al. 2015; Capaccioli et al. 2015). Thisobservational fact might suggest that we are trac-ing two different epochs of the halo assembly in thetwo clusters: the Fornax cluster could be in a moredynamically evolved phase (Grillmair et al. 1994;Jordan et al. 2007), where most of the gravita-tional interactions between galaxies have alreadytaken place and streams and tails are already dis-persed into the intracluster medium or/and arebelow the observable surface brightness level.
4.5. Stellar halo mass fraction in NGC 1399:
observations versus theoretical pre-
dictions
By fitting the light profile, we found that existsa physical break radius in the total light distribu-tion at R = 10 arcmin (∼ 58 kpc) that sets thetransition region between the bright central galaxyand the outer exponential halo, and that the stel-lar halo contributes for 60% of the total light ofthe galaxy (Sec. 3.5).
In order to estimate the stellar mass fractionof the halo for NGC 1399, we need to account forthe stellar mass-to-light ratio value for both thecentral galaxy and the halo. The color profilesshown in Fig. 10 suggest that the stellar halo (forR ≥ 10 arcmin) has g − r color similar to those
measured in the central galaxy, thus we can as-sume a similar stellar M/L for both components.According to an average g − r ∼ 0.8, from thestellar population synthesis model (Vazdekis etal. 2012; Ricciardelli et al. 2012), using a KroupaIMF, M/L∼ 4. Therefore, the total stellar massof the whole system, galaxy plus halo, is Mtot ≃
6.6 × 10¹¹ M⊙, while the stellar mass in the halois Mhalo ≃ 4 × 10¹¹ M⊙. The stellar mass frac-tion is the same we found for the light, whichis 0.58 ± 0.03. As shown in Fig. 14, this valueis comparable with those derived for other BCGswith total stellar mass similar to NGC 1399, whichvaries from 0.47 to 0.9 for the galaxies in the sam-ple studied by Seigar et al. (2007), and it is about0.65 for the bright BCG NGC6166 (Bender et al.2015).
The observed halo mass fraction for NGC 1399and for other published data are compared withthe predictions from numerical simulations byCooper et al. (2013), for galaxies with a dark halovirial mass within the range 13 < logM200/M⊙ <14, and from the Illustris hydrodynamic cosmo-logical simulations by Rodriguez et al. (2015).According to the dynamical models performedby Schuberth et al. (2010), the virial mass forNGC 1399 is in the range 5× 10¹² − 7× 10¹³M⊙.On average, taking into account the uncertaintiesin M/L estimate, the stellar mass fraction de-rived for the halo of NGC 1399 fully agrees withthose predicted by the Illustris simulations, whileit is at the lower limits of those by Cooper et al.(2013). The stellar mass fractions of the halosin the less luminous BCGs studied by Seigar etal. (2007) are more consistent with simulations,except for NGC 4874, where deviations could bedue to a wrong estimate of the M/L ratio and/orof the halo stellar mass fraction. On the otherhand, the brightest galaxy of the selected sam-ple, NGC 6166, is far from the theoretical predic-tions: this could be due to an unexplored regionsin the simulations, since Fig.12 in Cooper et al.(2013) shows that there are no values for an halostellar mass larger than 1012 M⊙. We noticedthat the region of the stellar halo mass fractionlarger 0.8 seems devoid of observed stellar halos.The same effect seems to be also present in thesame diagram obtained by Trujillo & Fliri (2015)(see Fig.12 of that paper), where the stellar massfractions derived for less massive galaxies (in the
20
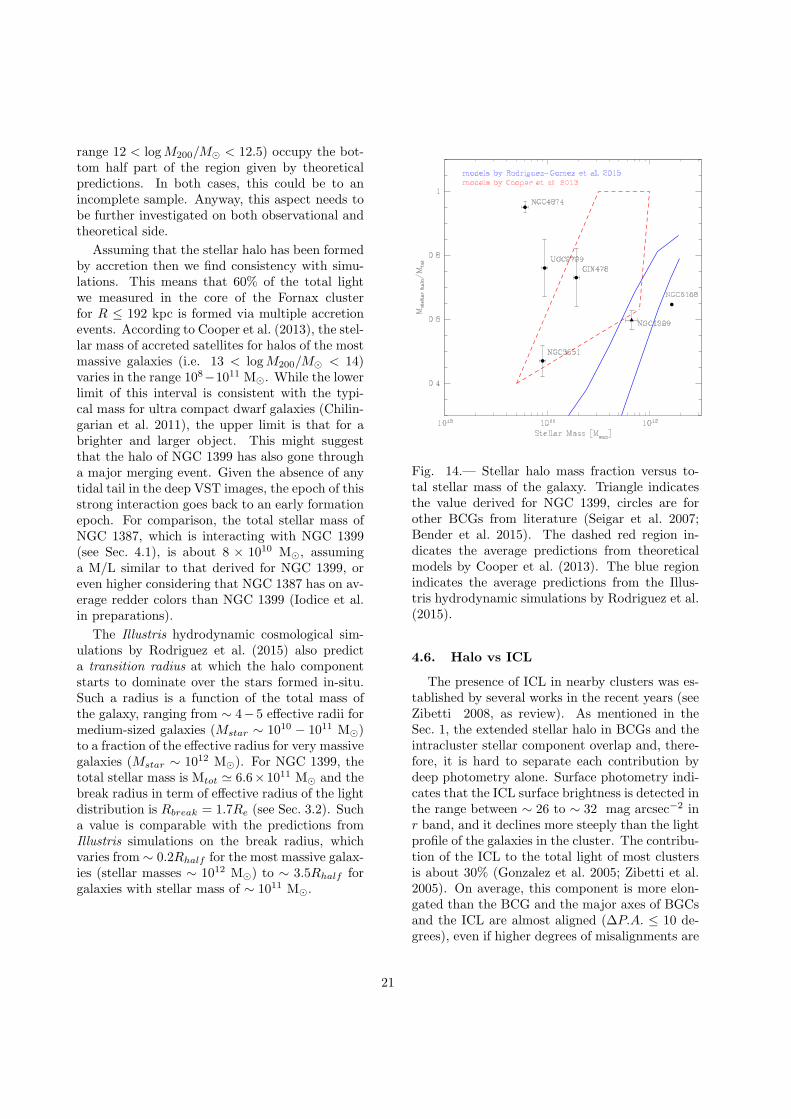
range 12 < logM200/M⊙ < 12.5) occupy the bot-tom half part of the region given by theoreticalpredictions. In both cases, this could be to anincomplete sample. Anyway, this aspect needs tobe further investigated on both observational andtheoretical side.
Assuming that the stellar halo has been formedby accretion then we find consistency with simu-lations. This means that 60% of the total lightwe measured in the core of the Fornax clusterfor R ≤ 192 kpc is formed via multiple accretionevents. According to Cooper et al. (2013), the stel-lar mass of accreted satellites for halos of the mostmassive galaxies (i.e. 13 < logM200/M⊙ < 14)varies in the range 108−1011 M⊙. While the lowerlimit of this interval is consistent with the typi-cal mass for ultra compact dwarf galaxies (Chilin-garian et al. 2011), the upper limit is that for abrighter and larger object. This might suggestthat the halo of NGC 1399 has also gone througha major merging event. Given the absence of anytidal tail in the deep VST images, the epoch of thisstrong interaction goes back to an early formationepoch. For comparison, the total stellar mass ofNGC 1387, which is interacting with NGC 1399(see Sec. 4.1), is about 8 × 10¹⁰ M⊙, assuminga M/L similar to that derived for NGC 1399, oreven higher considering that NGC 1387 has on av-erage redder colors than NGC 1399 (Iodice et al.in preparations).
The Illustris hydrodynamic cosmological sim-ulations by Rodriguez et al. (2015) also predicta transition radius at which the halo componentstarts to dominate over the stars formed in-situ.Such a radius is a function of the total mass ofthe galaxy, ranging from ∼ 4− 5 effective radii formedium-sized galaxies (Mstar ∼ 1010 − 1011 M⊙)to a fraction of the effective radius for very massivegalaxies (Mstar ∼ 1012 M⊙). For NGC 1399, thetotal stellar mass is Mtot ≃ 6.6×10¹¹ M⊙ and thebreak radius in term of effective radius of the lightdistribution is Rbreak = 1.7Re (see Sec. 3.2). Sucha value is comparable with the predictions fromIllustris simulations on the break radius, whichvaries from ∼ 0.2Rhalf for the most massive galax-ies (stellar masses ∼ 1012 M⊙) to ∼ 3.5Rhalf forgalaxies with stellar mass of ∼ 1011 M⊙.
Fig. 14.— Stellar halo mass fraction versus to-tal stellar mass of the galaxy. Triangle indicatesthe value derived for NGC 1399, circles are forother BCGs from literature (Seigar et al. 2007;Bender et al. 2015). The dashed red region in-dicates the average predictions from theoreticalmodels by Cooper et al. (2013). The blue regionindicates the average predictions from the Illus-tris hydrodynamic simulations by Rodriguez et al.(2015).
4.6. Halo vs ICL
The presence of ICL in nearby clusters was es-tablished by several works in the recent years (seeZibetti 2008, as review). As mentioned in theSec. 1, the extended stellar halo in BCGs and theintracluster stellar component overlap and, there-fore, it is hard to separate each contribution bydeep photometry alone. Surface photometry indi-cates that the ICL surface brightness is detected inthe range between ∼ 26 to ∼ 32 mag arcsec−2 inr band, and it declines more steeply than the lightprofile of the galaxies in the cluster. The contribu-tion of the ICL to the total light of most clustersis about 30% (Gonzalez et al. 2005; Zibetti et al.2005). On average, this component is more elon-gated than the BCG and the major axes of BGCsand the ICL are almost aligned (∆P.A. ≤ 10 de-grees), even if higher degrees of misalignments are
21

also measured in some cases. The deep imagingof the Virgo cluster shows that other than the nu-merous thin ICL streams, part of this componentis in a more diffuse form, locked in the extendedhalo around M87, traced up to 150 kpc (Mihos2015).
For NGC 1399, the deep VST photometryallows us to map the surface brightness lev-els typical for the ICL contribution. The az-imuthally averaged surface brightness profile de-rived in this work shows a steeper exponen-tial decline for µg ≥ 26.5 mag arcsec−2 (i.e.µr ≥ 25.65 mag arcsec−2 since g − r ∼ 0.85) andit reaches a µg = 31.2 mag arcsec−2 at ∼ 192 kpcfrom the analyz (see Fig. 3). As discussed in de-tail in the previous sections, this component isthe stellar halo around NGC 1399, which is veryextended and contributes to about 60% of the to-tal light. We may suppose that part of this hugeamount of light comes from the contribution of theICL, which could vary from 10% to 30% as wasestimated in other cluster of galaxies (Gonzalez etal. 2005; Zibetti et al. 2005).
A hint for extra-light is detected from the lightprofiles extracted at several P.A.s, in the regionsbetween galaxies on the west side (see Sec. 3and Fig. 9), in the range of surface brightnesses27 ≤ µg ≤ 28 mag arcsec−2 and for 15 ≤ R ≤
20 arcmin. At fainter level of surface bright-nesses, the stellar bridge between NGC 1399 andNGC 1387 is about 1− 1.5 mag arcsec−2 brighterthan the average value of the diffuse component(µg ∼ 31 mag arcsec−2, see Fig. 8). As found inother BCGs (Gonzalez et al. 2005; Zibetti et al.2005), the ellipticity and P.A. profiles of the stel-lar envelope show that it is flatter with respect tothe inner galaxy light and both are misaligned byabout 10 degrees (see Fig. 4).
However, photometry alone does not allow usto separate the gravitationally bound part of NGC1399’s very extended stellar halo from that of theintracluster light. There is a hint from the kine-matics of the GCs for a higher velocity dispersionof the blue population at large radii of about 20 ar-cmin (Schuberth et al. 2010), but this point needsfurther confirmation with new data. Therefore, atthis stage, no definitive conclusion can be drawnand kinematical studies are crucial to disentanglethe bound and unbound components in the stellarhalo of NGC 1399.
5. Summary
In conclusion, the most important and first re-sults of the Fornax Deep Survey with VST can besummarised as follows:
1. deep photometry allowed us to detect thefaint stellar counterpart of the blue GCsstream in the intracluster region on the westside of NGC 1399 and towards NGC 1387.By analyzing the integrated colors of thisfeature, we claim that it could be explainedby the ongoing interaction between thetwo galaxies, where the outer envelope ofNGC 1387 on its east side is stripped away;
2. in the core of the Fornax cluster a very ex-tended envelope surrounding the luminousgalaxy NGC 1399 is present. This compo-nent, which is well fitted by an exponentiallaw, comprises 60% of the total integratedlight out to 192 kpc, included the ICL frac-tion;
3. The surface brightness profile of NGC 1399shows a physical break radius in the to-tal light distribution at R = 10 arcmin(∼ 58 kpc), i.e. 1.7Re, that sets the transi-tion region between the bright central galaxyand the stellar halo. Such a value is compa-rable with the predictions from Illustris sim-ulations on the break radius for galaxies inthe range of stellar masses 1011 − 1012 M⊙;
4. comparing with the numerical simulations ofstellar halo formation for the most massiveBCGs (i.e. 13 < logM200/M⊙ < 14), wefound that the observed stellar halo massfraction is consistent with a halo formedthrough the multiple accretion of progeni-tors having stellar masses in the range 108−1011 M⊙. This might suggest that the haloof NGC 1399 has also went through a majormerging event.
5. The absence of a significant number of lu-minous stellar streams and tidal tails be-tween the galaxies in the core of the For-nax cluster suggests that the epoch of thisstrong interaction goes back to an early for-mation epoch. Thus, the extended stellarhalo around NGC 1399 is characterised by
22
a more diffuse and well-mixed component,including the ICL, with respect to that ofM87 or M49 in the Virgo cluster (Mihos etal. 2005; Capaccioli et al. 2015). This is anindication that the Fornax cluster could bein a more dynamically evolved phase thanthe Virgo cluster.
This work is based on visitor mode observa-tions taken at the ESO La Silla Paranal Obser-vatory within the VST GTO Program ID 094.B-0496(A). The authors wish to thank the anony-mous referee for his/her comments and sugges-tions that allowed us to greatly improve the pa-per. Authors wish to tank ESO for the finan-cial contribution given for the visitor mode runsat the ESO La Silla Paranal Observatory. En-richetta Iodice wish to thank the ESO staff of theParanal Observatory for the support during theobservations at VST. E.I. is also very grateful toT. de Zeeuw, M. Arnaboldi, O. Gerhard and I.Truijllo for the discussions and suggestions on thepresent work. Michele Cantiello acknowledges fi-nancial support from the project EXCALIBURS(PRIN INAF 2014, PI G. Clementini). Nicola R.Napolitano and M.Paolillo acknowledges the sup-port of PRIN INAF 2014 ”Fornax Cluster Imagingand Spectroscopic Deep Survey”.
REFERENCES
Arnaboldi, M. and Ventimiglia, G. and Iodice, E.et al., 2012, A&A, 545, 37
Bassino, L. P. and Faifer, F. R. and Forte et al.,2006, A&A, 451, 789
Bender, R. and Kormendy, J. and Cornell, M. E.and Fisher, D. B., 2015, ApJ, 807, 56
Bernstein, R. A. and Freedman, W. L. andMadore, B. F., 2002, ApJ, 571, 85
Cantiello, M. and Capaccioli, M. and Napolitano,N. et al. 2015, A&A, 576, 14
Capaccioli, M. and Spavone, M. and Grado, et al.2015, A&A, in press
Caon, N. and Capaccioli, M. and D’Onofrio, M.1993, MNRAS, 265, 1013
Caon, N. and Capaccioli, M. and D’Onofrio, M.1994, A&AS, 106, 199
Chilingarian, I. V. and Mieske, S. and Hilker, M.et al. 2011, MNRAS, 412, 1627
Coccato, L. and Arnaboldi, M. and Gerhard, O.2013, MNRAS, 436, 1322
Cooper, A. P. and D’Souza, R. and Kauffmann etal. 2013, MNRAS, 434, 3348
Cooper, A. P. and Parry, O. H. and Lowing, B. etal. 2015, MNRAS, 454, 3185
Cooper, A. P. and Gao, L. and Guo, Q. et al. 2015,MNRAS, 451, 2703
Cui, W. and Murante, G. and Monaco, P. et al.2014, MNRAS, 437, 816
D’Abrusco, R. and Cantiello, M. and Paolillo etal. 2016, ApJ, submitted
De Lucia, G. and Blaizot, J. 2007, MNRAS, 375,2
Deason, A. J. and Belokurov, V. and Evans et al.2013, ApJ, 763, 113
Dirsch, B. and Richtler, T. and Geisler, et al. 2003,AJ, 125, 1908
Donzelli, C. J. and Muriel, H. and Madrid, J. P.,2011, ApJS, 195, 15
Drinkwater, M. J. and Gregg, M. D. and Colless,M. 2001, ApJ, 548, L139
Duc, P.-A. and Cuillandre, J.-C. and Karabal, E.et al. 2015, MNRAS, 446, 120
Durrell, P. R. and Cote, P. and Peng, E. W. et al.2014, ApJ, 794, 103
Ferguson, H. C. 1989, AJ, 98, 367
Ferrarese, L. and Cote, P. and Cuillandre et al.2012, ApJS, 200, 4
Forbes, D. A. and Ponman, T. and O’Sullivan, E.2012, MNRAS, 425, 66
Fukugita, M. and Ichikawa, T. and Gunn, J. E. etal. 1996, AJ, 111, 1748
Gerhard, O. and Kronawitter, A. and Saglia, R. P.2001, AJ, 121, 1936
23

Gonzalez, A. H. and Zabludoff, A. I. and Zaritsky,D. 2005, ApJ, 618, 195
Grillmair, C. J. and Freeman, K. C. and Bicknell,G. V. et al. 1994, ApJ, 422, L9
Hilker, M. and Infante, L. and Richtler, T. 1999,A&AS, 138, 55
Hilker, M. and Barbosa, C. E. and Richtler, T. etal. 2015, IAU Symposium, 309, 221
Janowiecki, S. and Mihos, J. C. and Harding et al.2010, ApJ, 715, 972
Jordan, A. and Blakeslee, J. P. and Cote, P. et al.2007, ApJS, 169, 213
Kormendy, J. and Fisher, D. B. and Cornell et al.2009, ApJS, 182, 216
Kuijken, K., 2011, The Messenger, vol. 146, pag.8-11
Iodice, E. and Arnaboldi, M. and Rejkuba, et al.2014, A&A, 567, 86
Longobardi, A. and Arnaboldi, M. and Gerhard,O. and Hanuschik, R. 2015, A&A, 579, 135
Longobardi, A. and Arnaboldi, M. and Gerhard etal. 2015, A&A, 579, L3
Martınez-Delgado, D. and Gabany, R. J. andCrawford et al. 2010, AJ, 140, 962
McNeil, E. K. and Arnaboldi, M. and Freeman etal., 2010, A&A, 518, A44
Mihos, J. C. and Harding, P. and Feldmeier et al.2005, ApJ, 631, L41
Mihos, J. C. 2015, arXiv-1510.01929
Miskolczi, A. and Bomans, D. J. and Dettmar, R.-J. 2011, A&A, 536, 66
Mieske, S. and Hilker, M. and Infante, L. 2004,A&A, 418, 445
Munoz, R. P. and Eigenthaler, P. and Puzia, T. H.et al. 2015, ApJ, 813, L15
Napolitano, N. R. and Arnaboldi, M. and Capac-cioli, M. 2002, A&A, 383, 791
Napolitano, N. R. and Romanowsky, A. J. andCoccato, L. et al. 2009, MNRAS, 393, 329
Napolitano, N. R. and Romanowsky, A. J. andCapaccioli, M. et al. 2011, MNRAS, 411, 2035
Napolitano, N. R. and Pota, V. and Romanowsky,A. J. et al. 2014, MNRAS, 439, 659
Paolillo, M. and Fabbiano, G. and Peres, G. andKim, D.-W. 2002, ApJ, 565, 883
Peletier, R. F. and Davies, R. L. and Illingworth,G. D. et al. 1990, AJ, 100, 1091
Pillepich, A. and Madau, P. and Mayer, L. 2015,ApJ, 799, 184
Pillepich, A. and Vogelsberger, M. and Deason, A.et al. 2014, MNRAS, 444, 237
Pohlen, M. and Trujillo, I. 2006, A&A, 454, 759
Pota, V. and Forbes, D. A. and Romanowsky, A. J.et al. 2013, MNRAS, 428, 389
Pota, V. and Romanowsky, A. J. and Brodie, J. P.et al. 2015, MNRAS, 450, 3345
Puchwein, E. and Springel, V. and Sijacki, D. andDolag, K. 2010, MNRAS, 406, 936
Puzia, T. H. and Paolillo, M. and Goudfrooij, P.et al. 2014, ApJ, 786, 78
Ricciardelli, E. and Vazdekis, A. and Cenarro,A. J. et al. 2012, MNRAS, 424, 172
Rodriguez, V. and Pillepich, A. and Sales, L. V. etal. 2015, MNRAS, in press, arXiv-1511.08804
Roediger, J. C. and Courteau, S. and MacArthur,L. A. and McDonald, M. 2011, MNRAS, 416,1996
Romanowsky, A. J. and Strader, J. and Spitler,L. R. et al. 2009, AJ, 137, 4956
Rudick, C. S. and Mihos, J. C. and Harding, P. etal. 2010, ApJ, 720, 569
Saglia, R. P. and Kronawitter, A. and Gerhard,O. and Bender, R. 2000, AJ, 119, 153
Schipani, P. and Noethe, L. and Arcidiacono, C.et al. 2012, Journal of the Optical Society ofAmerica A, Vol.29, p.1359
Schlegel, D. J. and Finkbeiner, D. P. and Davis,M. 1998, ApJ, 500, 525
24
Schombert, J. M. 1986, ApJS, 60, 603
Schuberth, Y. and Richtler, T. and Bassino, L.and Hilker, M. 2008, A&A, 447, 9
Schuberth, Y. and Richtler, T. and Hilker, M. etal. 2010, A&A, 513, 52
Seigar, M. S. and Graham, A. W. and Jerjen, H.2007, MNRAS, 378, 1575
Sersic, J. L. 1963, Boletin de la Asociacion Ar-gentina de Astronomia La Plata Argentina, Vol.6, p.41
Tonry, J. L. and Dressler, A. and Blakeslee, J. P.et al. 2001, ApJ, 546, 681
Toomre, A. 1964, ApJ, 139, 1217
Trujillo, I. and Fliri, J. 2015, arXiv-1510.04696
van der Kruit, P. C. and Freeman, K. C., 2011,ARA&A, 49, 301
van Dokkum, P. G. and Abraham, R. and Merritt,A. 2014, ApJ, 782, L24
Vazdekis, A. and Ricciardelli, E. and Cenarro,A. J. et al. 2012, MNRAS, 424,157
Voggel, K. and Hilker, M. and Richtler, T. 2015,A&A, in press, arXiv-1510.05010
Wu, X. and Gerhard, O. and Naab, T. et al. 2014,MNRAS, 438, 2701
Zibetti, S. and White, S. D. M. and Schneider,D. P. et al. 2005, MNRAS, 358, 949
Zibetti, S. 2008, IAU Symposium Vol.244, p.176,arXiv-0709.0659
This 2-column preprint was prepared with the AAS LATEXmacros v5.2.
25