Embed Size (px)
Citation preview

Work supported in part by Department of Energy contract DE-AC02-76SF00515
The DART imaging and CaT survey of the Fornax DwarfSpheroidal Galaxy
G. Battaglia1, E. Tolstoy1, A. Helmi1, M.J. Irwin2, B. Letarte1, P. Jablonka3, V. Hill 4, K.A. Venn5, M.D. Shetrone6,N. Arimoto7, F. Primas8, A. Kaufer9, P. Francois4, T. Szeifert9, T. Abel10, and K. Sadakane11
1 Kapteyn Institute, University of Groningen, Postbus 800, 9700AV Groningen, the Netherlands2 Institute of Astronomy, University of Cambridge, Madingley Road, Cambridge CB3 0HA, UK3 Observatoire de Geneve, EPFL CH-1290, Sauverny, Switzerland4 Observatoire de Paris-Meudon, 92195 Meudon Cedex, France5 Department of Physics and Astronomy, University of Victoria, 3800 Finnerty Road, Victoria, BC, V8P 1A1, Canada6 University of Texas, McDonald Observatory, USA7 National Astronomical Observatory, 2-21-1 Osawa, Mitaka,Tokyo 181-8588, Japan8 European Southern Observatory, Karl-Schwarzschild str 2,D-85748 Garching bei Munchen, Germany9 European Southern Observatory, Alonso de Cordova 3107, Vitacura, Casilla 19001, Santiago, Chile
10 Kavli Institute for Particle Astrophysics and Cosmology, Department of Physics and Stanford Linear Accelerator Center, Stanford University,2575 Sand Hill Road, Menlo Park, CA 94044, USA
11 Astronomical Institute, Osaka Kyoiku University, Kashiwara-shi, Osaka 581-8582, Japan.
Received/ Accepted
ABSTRACT
Aims. As part of the DART project we have used the ESO/2.2m Wide Field Imager in conjunction with the VLT/FLAMES⋆ GIRAFFE spec-trograph to study the detailed properties of the resolved stellar population of the Fornax dwarf spheroidal galaxy out to and beyond its tidalradius. Fornax dSph has had a complicated evolution and contains significant numbers of young, intermediate age and old stars. We investigatethe relation between these different components by studying their photometric, kinematicand abundance distributions.Methods. We re-derived the structural parameters of the Fornax dwarfspheroidal using our wide field imaging covering the galaxy out to itstidal radius, and analysed the spatial distribution of the Fornax stars of different ages as selected from Colour-Magnitude Diagram analysis. Wehave obtained accurate velocities and metallicities from spectra in the Ca II triplet wavelength region for 562 Red Giant Branch stars whichhave velocities consistent with membership in Fornax dwarfspheroidal.Results. We have found evidence for the presence of at least three distinct stellar components: a young population (few 100 Myr old) con-centrated in the centre of the galaxy, visible as a Main Sequence in the Colour-Magnitude Diagram; an intermediate age population (2-8 Gyrold); and an ancient population (> 10Gyr), which are distinguishable from each other kinematically, from the metallicity distribution and in thespatial distribution of stars found in the Colour-Magnitude Diagram.Conclusions. From our spectroscopic analysis we find that the “metal rich”stars ([Fe/H]> −1.3) show a less extended and more concentratedspatial distribution, and display a colder kinematics thanthe “metal poor” stars ([Fe/H< −1.3). There is tentative evidence that the ancient stel-lar population in the centre of Fornax does not exhibit equilibrium kinematics. This could be a sign of a relatively recent accretion of externalmaterial, such as the merger of another galaxy or other meansof gas accretion at some point in the fairly recent past, consistent with otherrecent evidence of substructure (Coleman et al. 2004, 2005).
Key words. Galaxies: dwarf – Galaxies: individual: Fornax dSph – Galaxies: kinematics and dynamics – Galaxies: structure – Galaxies: LocalGroup – Stars: abundances
1. Introduction
The Fornax Dwarf Spheroidal galaxy (dSph) is a relativelydistant companion of the Milky Way at high galactic latitude(b = −65.7o). It is located at a distance of 138±8 kpc (e.g.Mateo 1998; Bersier 2000), with an heliocentric velocity vhel =
⋆ Based on FLAMES observations collected at the EuropeanSouthern Observatory, proposal 171.B-0588
53±2 km/s (Mateo et al. 1991), a luminosityMV = −13.0±0.3,and a central surface brightnessΣ0,V = 14.4± 0.3 mag/arcmin2
(Irwin & Hatzidimitriou 1995). The Fornax dSph is one of themost massive and luminous of the dwarf galaxy satellites ofour Galaxy, second only to Sagittarius, with a total (dynami-cal) mass in the range 108-109 M⊙ (Mateo et al. 1991; Łokas2002; Walker et al. 2006; Battaglia et al. 2006a).
SLAC-PUB-12082
astro-ph/0608370
August 2006
Submitted to Astron.Astrophys.

2 G.Battaglia et al.: DART Survey of Fornax dSph
Similarly to Sagittarius, Fornax has its own globular clus-ter population, but contrary to Sagittarius all of the Fornaxglobular clusters appear to be metal poor (e.g. Strader et al.2003; Letarte et al. 2006a). Fornax is known to contain alarge number of carbon stars with a wide range of bolomet-ric luminosities indicating significant mass (and hence age)dispersion at intermediate ages (e.g. Demers & Kunkel 1979;Aaronson & Mould 1980; Stetson et al. 1998; Azzopardi et al.1999). This is supported by a well populated intermediate agesub-giant branch and red clump. Fornax also contains a siz-able population of RR Lyrae variable stars with an averagemetallicity of [Fe/H]RR ∼ −1.6± 0.2 (Bersier & Wood 2002).From detailed Colour-Magnitude Diagram (CMD) analysis(e.g. Stetson et al. 1998; Buonanno et al. 1999; Saviane et al.2000; Pont et al. 2004) it is clear that, unlike most dSphs inthe Local Group, Fornax has had a long history of star forma-tion, which has only ceased few hundreds Myr ago. However,in common with most dSph galaxies, Fornax does not appearto have any HI gas at present (e.g. Young 1999). It is difficult tounderstand how Fornax lost all it gas. It is possible that, ascon-sequence of the recent star formation, the gas is fully ionized,however detections of ionized gas are difficult.
A recent proper motion estimate suggests that Fornaxhas a low eccentricity polar orbit, that crossed the path ofthe Magellanic Stream about 190 Myr ago (Dinescu et al.2004), and that the excess of small scale structure in theMagellanic stream, tracing back along the proposed orbit ofFornax comes from gas lost by Fornax during this encounter.The authors propose this encounter as a viable mechanism tomake Fornax lose its gas and stop forming stars. However, pre-vious proper motion measurements do not suggest such an en-counter (Piatek et al. 2002).
Fornax has been the centre of some attention recentlyfor the discovery, in photometric surveys, of stellar over-densities in and around the system (Coleman et al. 2004, 2005;Olszewski et al. 2006). These over-densities have been inter-preted by Coleman et al. asshell structures caused by the recentcapture of a small galaxy by Fornax.
There have been previous spectroscopic studies of individ-ual stars in Fornax. Studies of kinematic properties indicateda (moderate) central mass-to-light ratioM/L & 5(M/LV)⊙,possibly as high as 26 (e.g. Mateo et al. 1991), and a globalM/LV ∼ 10-40 larger than theM/LV of the luminous com-ponent (Walker et al. 2006). This is much higher than is typi-cal for globular clusters, which have mass-to-light ratiosin therange 1-3 (e.g. McLaughlin & van der Marel 2005), but con-siderably lower than that found for many other dSphs such asDraco and Ursa Minor (M/L > 100 (M/LV)⊙, e.g. Kleyna et al.2003; Wilkinson et al. 2004).
There have been two previous Ca II triplet (CaT) stud-ies of Red Giant Branch (RGB) stars in the central region ofFornax (33 stars, Tolstoy et al. 2001; 117 stars, Pont et al.2004), both using VLT/FORS1. There are also detailed abun-dance studies of 3 field stars (Shetrone et al. 2003) and 9 glob-ular cluster stars (Letarte et al. 2006a) made with VLT/UVES.This is about to be extended dramatically by VLT/FLAMES(∼ 100 stars, Letarte et al. 2006b). These spectroscopic studiesconclude that the bulk of the stellar population is more metal
rich than could be inferred from the position of the Red GiantBranch (RGB) in the CMD, with a peak at [Fe/H] ∼ −0.9, ametal poor tail extending out to [Fe/H] = −2 and a metal richtail extending beyond [Fe/H] = −0.4 with more than half thestars on the RGB having ages< 4 Gyr.
Here we present the first results of a study of the FornaxdSph from the DART (Dwarf Abundances and Radial veloc-ities Team) large programme at ESO. The aim of DART isto analyse the chemical and kinematic behaviour of individualstars in a representative sample of dSphs in the Local Group,in order to derive their star formation and chemical enrichmenthistories, and explore the kinematic status of these objects andtheir mass distribution. Our targets are Sculptor (Tolstoyet al.2004), Fornax and Sextans dSphs. From our large program atESO we obtained for each of these galaxies: extended WFIimaging; intermediate resolution VLT/FLAMES spectra in theCaT region to derive metallicity and velocity measurementsfora large sample of RGB stars covering an extented area; andVLT /FLAMES high resolution spectra in the central regions,which give detailed abundances over a large range of elementsfor ∼ 100 RGB stars.
In this work we present our results for both wide field imag-ing and intermediate resolution FLAMES spectroscopy for 562RGB kinematic members of Fornax out to the tidal radius. Therelatively high signal-to-noise (S/N ≈ 10-20 per Å) of our datahas enabled us to derive both accurate metallicities (≈ 0.1 dexfrom internal errors) and radial velocities (to≈ ±2 km/s). Wecan thus study the different stellar populations in Fornax andhow their metallicities and kinematic properties vary spatiallywith a dramatically larger sample than any previous study. Ourstudy differs from Walker et al. (2006) in that we have bothabundance and kinematics and this has been shown to be a cru-cial piece of information for disentangling surprisingly compli-cated galaxy properties (Tolstoy et al. 2004).
In future works we will present our CaT calibration(Battaglia et al. 2006b), detailed kinematic modelling ofFornax dSph (Battaglia et al. 2006a) and accurate star for-mation history from our VLT/FLAMES high resolution abun-dances of Fornax (Letarte et al. 2006b).
2. Observations and Data reduction
2.1. Photometry
Our ESO Wide Field Imager (WFI) observations were col-lected between 2003-2005 and initally included some earlierarchival data from the central regions. Table 1 shows the jour-nal of WFI observations taken in service mode early in 2005that were used to generate the final overall photometric andastrometric catalogues. Although the earlier WFI observationswere used for target selection for some of the spectroscopicfol-lowup, all of the analysis and results presented in this paper arebased on the 2005 service mode data. This was taken in pho-tometric conditions, with generally good seeing (<1 arcsec),unlike most of the earlier photometry.
Image reduction and analysis was based on the pipelineprocessing software developed by the Cambridge AstronomicalSurvey Unit for dealing with imaging data from mosaic cam-
G.Battaglia et al.: DART Survey of Fornax dSph 3
eras. Details of the pipeline processing can be found in Irwin(1985), Irwin & Lewis (2001) and Irwin et al. (2004). In broadoutline, each set of frames for a particular field is processedindividually to remove gross instrumental artefacts (ie. bias-corrected, trimmed, flatfielded, and defringed as necessary). Anobject catalogue is then constructed and used to derive accurateastrometric transformations to enable stacking of multiple im-ages for each field in a common coordinate system. The stackedimages, produced from a sequence of 3 dithered exposures, arethen used to generate the final object catalogues, and the astro-metric information is updated.
The astrometric solutions are based on a general ZenithalPolynomial projection (e.g. Greisen & Calabretta 2002), whichfor the ESO WFI is particularly simple since the radial dis-tortion is effectively zero. Astrometric standard stars were se-lected automatically from APM scans of UKST photographicsurvey plates (http://www.ast.cam.ac.uk/casu) which in turn arecalibrated with respect to TYCHO 2. Each of the 8 detectorsmaking up the mosaic is solved for independently using a 6constant linear solution linking detector x,y to projectedce-lestial coordinates. Residuals in the fit per star are typically≈ 200mas, which is almost entirely due to the random er-ror in the photographic astrometry. Even in the outer parts ofFornax there are more than 100 plate-based standards per de-tector which means that any systematic errors in the solutionare completely negligible (<100 mas).
Objects are morphologically classified on each stackedframe as either noise artefacts, galaxies, or stars, primarily ac-cording to the properties of the curve-of-growth light distribu-tion using a series of aperture fluxes. At the same time aperturecorrections for stellar profiles are derived at the detectorlevelto enable accurate (≈1%) conversion to total fluxes.
The internal gain correction, applied at the flatfieldingstage, ensures a common photometric system across the mo-saic (to≈1%) and hence photometric calibration simplifies tofinding a single magnitude zero-point for each science obser-vation. A correction for scattered light, which affects the flat-fielding in addition to the science images for WFI data, wasalso made. This was directly derived from the standard star ob-servations assuming a radially symmetric effect. This is a well-known problem with the WFI (Manfroid & Selman 2001) andthe correction was made prior to the photometric calibration.
The first-pass photometric calibration is based on obser-vations of photometric standard fields taken during the samenights as the target observations. Since these observations wereundertaken in service mode in mainly photometric conditionswe used the default La Silla extinction for these passbands toderive an airmass correction (the range in airmass and numberof the standard star observations precluded any other option).The colour equations to correct to the Johnson-Cousins systemwere taken from the ESO web pages. Each photometric stan-dard field observed contains between≈10-50 suitable standardsand provides a single zero-point with better than≈1% ran-dom error; assorted systematic errors (e.g. aperture corrections,flatfielding gradients, scattered light correction) contribute atabout the same level.
The zero-point trend over all the service observing is con-sistent within the errors±1− 2% with photometric conditions
on all nights apart from the standard star observation for thenight of 2005 Jan 31st. Since no science target frames weretaken during this night this data point was ignored and a con-stant zero-point adopted for both the V- and I-band images.(Note that this was also the night with the very poor seeing.)
As a final check on the overall calibration the overlap(≈ 5%) between adjacent fields was used to check the inter-nal consistency of the magnitude system and small≈ ±2% ad-justments were made to bring all the observations to a com-mon scale. This latter step ensures the whole system is on thesame photometric zero-point, which is essential for analysis oflarge scale structure. The final sensitivity of all the images isthe same within 0.1 magnitude.
The final step was to merge all the object catalogues in theV- and I-band to produce a unique set of object detections forthe whole area studied. In the case of multiple measurementsfor a given object the one with the smallest error estimates wereused. This catalogue forms the basis for all subsequent photo-metric analysis, and spectroscopic analysis.
2.2. Spectroscopy
We selected targets classified as stellar in our ESO/WFI pho-tometry and with a position on the CMD consistent with anRGB star, but with a wide colour range to avoid biasing oursample in age or in metallicity. We used VLT/FLAMES feedingthe GIRAFFE spectrograph in Medusa mode, that allows the si-multaneous allocation of 132 fibres (including sky fibres) overa 25’ diameter field of view (Pasquini et al. 2002). We used theGIRAFFE low resolution grating (LR8, resolving power R∼6500), covering the wavelength range from 8206 Å to 9400 Å,to obtain spectra for 7 different fields in Fornax dSph. Thesedata have been reduced using the GIRAFFE pipeline (GenevaObservatory; Blecha et al. 2003). The sky-subtraction and ex-traction of the velocities and equivalent widths of CaII tripletlines have been carried out using our own software developedby M.Irwin (for the details see Battaglia et al. 2006b). Out to atotal of 800 targets, 69 have double measurements due to over-lapping fields. We find that a S/N per Å> 10 is the minimumfor accurate determination of velocity and equivalent width,thus we exclude from our analysis the stars with S/N per Ålower than 10. The typical error in velocity was found to be.2 km s−1 . We excluded from our analysis all the stars with anerror in velocity larger than 5 km s−1 . The r.m.s. velocities andequivalenth widths from the 35 stars with repeated measure-ments that passed our selection criteria are 2.2 km s−1 and 0.34Å respectively. The latter corresponds to an error in metallic-ity of 0.14 dex (see Sect. 4). For 27 out of 35 stars with dou-ble measurements we find agreement within the velocity errors.Only 2 out of 35 have velocities that differ by more than 2σ,however both are within 3σ.
The final sample was carefully checked to weed out anyspurious objects (e.g. broken fibres, background galaxies,fore-ground stars, etc.). We removed 6 objects because they wereinadvertantly assigned to fibres which were not available dur-ing our observing runs; we found no background galaxies andremoved 12 objects because the continuum shape or the pres-

4 G.Battaglia et al.: DART Survey of Fornax dSph
ence of very broad absorption line was not consistent with whatexpected for RGB stars spectra. Excluding the objects that didnot meet our S/N and velocity error criteria, our final sample ofacceptable measurements consists of 641 stars.
3. Results: Photometry
In this section we present the results of our wide field,ESO/WFI photometry of Fornax, out to its nominal tidal ra-dius (see Fig.1), and going down toV = 23 andI = 22 (MI =
1.2).
3.1. The structure of Fornax
Previous studies have revealed the spatial structure of Fornax tobe far from regular. Hodge (1961), using photographic plates,found that the ellipticity (defined ase = 1 − b/a, wherebanda are respectively the semi-minor and major axes of thegalaxy) increases with radius, from a value of 0.21 in the cen-tral regions to 0.36 in the outer parts. Irwin & Hatzidimitriou(1995) noticed that in the inner regions the isopleths showeddepartures from elliptical symmetry and that they were moreclosely spaced on the east side of the major axis than in thewest, as already noticed by Hodge (1961). The asymmetry wasfound to be centred close to cluster 4 (ξ ∼ 0.05, η ∼ −0.1 inFig. 1). The ellipticity was again found to increase with radius.Coleman et al. (2005), using only RGB stars, found that the po-sition of the centre shifts 3′ towards west within a radius of 20′
and 4′ towards south at all radii. For radii larger than 35′ theyfind an opposite trend for the ellipticity, i.e. the outer contoursbecome more circular.
Due to the variety of previous estimates, sometimes differ-ing significantly from each other, we decided to re-derive thestructural parameters of Fornax dSph. We divided the 2D spa-tial distribution of the stellar objects in our photometry (Fig. 1)into a grid with a “pixel” width of 0.02 deg and associated toeach pixel the number of stars it contained. We then used theIRAF task ELLIPSE to derive the variation with radius of thecentral position, ellipticity and position angle (Fig. 2),by fit-ting ellipses at radii between 15′ and 60′ with a ∼ 5′ spac-ing. We find that the centre is at (αJ2000, δJ2000) = (2h39m52s,−34◦30′49′′), west (−1.5′ ± 0.3′) and south (−3.8′ ± 0.2′) withrespect to the values listed in Mateo (1998). The centre nowappears to be located very close to cluster 4. With this newanalysis the ellipticity, average value 0.30±0.01, does not showany trend with radius. The position angle (P.A.) appears to belarger in the inner 15′ and then to become approximately con-stant with radius. A larger position angle for the inner regioncould be caused, for example, by the presence of cluster 4 or,more likely, by the presence of young stars with a markedlydifferent distribution (see Sect. 3.3). In our subsequent analysiswe adopt the average value of the P.A. to be 46.8◦±1.6◦, consis-tent with previous estimates. Our re-derived structural parame-ters are listed in Table 2. With the exception of the positionofthe centre of the galaxy, all the derived parameters are consis-tent with the values listed by Mateo (1998).
We also rederived the surface density profile for Fornaxin bins of 3′ out to a radius of 83′ (see Fig. 3). The contam-
ination by field star density, from a weighted average of thepoints beyond 68′, is 0.78±0.02 stars arcmin−2. From previ-ous estimates of the tidal radius (e.g. Irwin & Hatzidimitriou1995) we know that it is unlikely that our data extend out to apure background region thus our determination of the Galacticcontamination is of necessity an overestimate due to our lim-ited spatial coverage. We compared this Galactic contaminationsubtracted profile to several surface brightness models using aleast-square fit to the data. We used an empirical King pro-file (King 1962), an exponential profile, a Sersic profile (Sersic1968) and a Plummer model (Plummer 1911).
The King model has been extensively used to describe thesurface density profile of dSphs.
IK(R) = I0,K
1√
1+(
Rrc
)2−
1√
1+(
rtrc
)2
2
(1)
It is defined by 3 parameters: a characteristic surface density,I0,K , core radius,rc and tidal radius,rt. The last parameter isdefined as the distance, along the line connecting the galaxycentre and the centre of the host galaxy, where at the perigalac-ticon passage a star is pulled neither in nor out. This radiusis set by the tidal field of the host galaxy. Thus, an excess ofstars in the outer parts of dSphs with respect to King mod-els have been interpreted as tidally stripped stars, assumingthat the King profile is the correct representation of the data.Excess stars beyond the King tidal radius have been found inFornax (e.g. Coleman et al. 2005) and in a number of otherLocal Group dSphs, e.g. Carina (Majewski et al. 2005), Draco(Wilkinson et al. 2004; Munoz et al. 2005).
Another possibility to explain the excess of stars in theouter parts of dSphs is that the King model does not providethe best representation of the data at large radii. The Sersicprofile is known to provide a good empirical formula to fitthe projected light distribution of elliptical galaxies and thebulges of spiral galaxies (e.g. Caon et al. 1993; Caldwell 1999;Graham & Guzman 2003; Trujillo et al. 2004):
IS(R) = I0,S exp
−
(
RRS
)1/m
(2)
where I0,S is the central surface density,RS is a scale radiusandm is the surface density profile shape parameter. The deVaucouleurs law and exponential are recovered withm = 4 andm = 1, respectively; form < 1 the profile is steeper than anexponential;m = 1/2 gives a Gaussian. The light profile ofsome dSphs in the Local Group are found to be best-fitted withm < 1 (e.g. Caldwell 1999). Physical justifications for this lawhave been proposed (see for instance Graham & Guzman 2003,and references therein), however none is widely accepted.
In our analysis King and Sersic profiles reproduce the datamuch better than a Plummer or an exponential profile. Our bestfit is a Sersic profile with Sersic radius,RS = 17.3± 0.2 arcmin,andm = 0.71, thus steeper than an exponential (Fig. 3).
For the best-fitting King model we find a core radiusrc =
17.5±0.2 arcmin and a tidal radiusrt = 69.4±0.4 arcmin. Thecore radius determined here is 4′ larger than previous estimateswhilst the tidal radius is in agreement with the value of 71±4

G.Battaglia et al.: DART Survey of Fornax dSph 5
arcmin from IH95. The slightly smaller value we obtain for thetidal radius is likely due to our overestimated field star density.
Figure 3 shows that in our determination of the density pro-file there is an excess of stars with respect to the King profile(solid line) for radii larger than 1 deg. At this distance theSersicprofile (dashed) best follows the data. Both exponential andPlummer profiles (dotted and dash-dot) over-predict the sur-face density atr < 0.1 deg and at radii larger than∼ 0.8 deg,and under-predict it at intermediate distances. A summary ofthe best-fitting parameters is given in Table 3.
3.2. The Colour-Magnitude Diagram
It is well estabilished that the Fornax dSph has had avery complex star formation history (e.g. Stetson et al. 1998;Buonanno et al. 1999; Saviane et al. 2000). Stetson et al.(1998), in a photometric study covering a field of 1/3 deg2
near the centre of Fornax, found that the majority of stars fallinto three distinct stellar populations: an old one representedby HB and RR Lyrae stars; an intermediate age population ofHe-core-burning clump stars (Red Clump, RC); and a youngpopulation, indicated by the presence of main sequence stars.Fornax displays a broad RGB, classically interpreted as duetoa large spread in metallicity.
Figure 4a shows our WFI Colour-Magnitude diagram forFornax within the tidal radius (∼ 2◦ × 2◦); it contains 73700stars, including a quantity of foreground stars, which lie in afairly constant density sheet redwards ofV − I = 0.6. We no-tice the following features (highlighted in Fig. 4b, and directlyvisible in the Hess diagram in Fig. 5):
3.2.1. Ancient stars (> 10 Gyr):
These stars are to be found in:
– A red horizontal branch (RHB), extending fromV ∼21.2to V ∼21.6 and fromV − I ∼0.5 to V − I ∼0.7. Hints ofa blue horizontal branch (BHB) fromV ∼21.2 toV ∼21.6and fromV − I ∼0.05 toV − I ∼0.35. Between the BHBand RHB we can see the instability strip where RR Lyraevariable stars are to be found.
– A broad Red Giant Branch (RGB) with distinct blue (B-RGB) and red (R-RGB) components. The RGB branchcontain stars with ages> 10 Gyr, as well as intermediateage stars (2-8 Gyr), as will be discussed in Sect.4.2. Thereis a hint of bifurcation below the tip of the RGB.
3.2.2. Intermediate age stars (2-8 Gyr):
These stars are to be found in:
– An “AGB bump”, from V ∼ 20.05 toV ∼ 20.6 and fromV − I ∼0.9 toV − I ∼1.15. A similar feature was detectedby Gallart (1998) in the LMC and called an “AGB bump”,and assumed to occur at the beginning of the AGB phase.
– A red clump (RC), that hosts the bulk of detected stars(∼ 30%) in our WFI CMD. It extends fromV ∼ 20.9 toV ∼ 21.6 and fromV − I ∼0.7 toV − I ∼1.1. From theoreti-cal modelling of RC stars, Caputo et al. (1995) found that it
is possible to estimate the age of the dominant stellar com-ponent from the extension in luminosity of the RC. Theyfound that the larger the spread in luminosity the younger isthe RC population. The predictions in Caputo et al. (1995)are made using models of metallicity Z=0.0001 and 0.0004,which is lower than the bulk of Fornax population (Z∼0.002). Assuming a distance to Fornax of 138 kpc, an ex-tinction in V band of 0.062 (Schlegel et al. 1998) and acolour excess E(V−I)≃0.026 the upper and lowerMV of theRC are 0.14 and 0.84. Using the above mentioned models,this translates into an age of 3-4 Gyr for the dominant stellarpopulation, assuming no strong variation due to metallicity.We also derive the age of the dominant RC stellar popula-tion by overlaying to the observed CMD Padua isochrones(Girardi et al. 2000), which have a mass grid fine enoughto resolve the red clump structure. Even though isochronespredictions for colour and magnitude of the red clump fea-ture are valid for single stellar populations, they will pro-vide a reasonably accurate estimate of the mean age of acomposite stellar population such as Fornax. We find thatthe observed mean magnitude of the RC feature (V = 21.2,see Fig. 5) is reproduced assuming a dominant stellar pop-ulation of 2-4 Gyr old and metallicity Z in the range 0.001-0.004.
3.2.3. Young stars (< 1 Gyr):
These stars are found in:
– A plume of young Blue Loop (BL) stars fromV ∼ 19.4 toV ∼ 20.8 and fromV − I ∼0.78 toV − I ∼ 0.9. Blue Loopstars are produced during the He-core burning phase forstars with mass& 2-3 M⊙ and ages from few million yearsto 1 Gyr. The position (colour) of this feature is stronglydependent on metallicity (e.g. Girardi et al. 2000) .
– A main sequence extending fromV ∼ 20 toV ∼ 23 atV−I∼0, showing that very recent star formation (less than 1 Gyrago) has occurred in Fornax. The maximum luminosity ofthis feature indicates that there are stars as young as 200-300 Myr in Fornax.
3.3. The spatial distribution of different stellarpopulations
The spatial distribution of different stellar components in agalaxy gives an indication of how and where the star formationtook place at different times and how long the gas was retainedas a function of radius.
Previous studies of dSphs in the Local Group (e.g.Hurley-Keller et al. 1999; Majewski et al. 1999; Harbeck et al.2001; Tolstoy et al. 2004) have shown that HB properties varyas a function of the distance from the centre in several dSphs: ingeneral the RHB is more centrally concentrated than the BHB.This indicates the dominance of old and/or metal poor stars inthe outer regions and younger and/or more metal rich stars inthe inner regions.
Fornax contains both old (e.g. HB), intermediate (e.g. RC),and young stellar components (MS and Blue Loop stars).

6 G.Battaglia et al.: DART Survey of Fornax dSph
Previous photometric studies of individual stars, which havebeen limited to the central regions of Fornax dSph, have foundindications that the intermediate age stars have a more concen-trated distribution than the ancient stars (Stetson et al. 1998;Saviane et al. 2000). Stetson et al. (1998) found that the MSstars displayed a centrally concentrated asymmetric distribu-tion, with a major axis tilted∼ 30◦ with respect to the mainbody of Fornax.
Our WFI data, covering the entire extent of Fornax, allowus to analyse the spatial distribution of the resolved stellar pop-ulation of Fornax out to its nominal tidal radius. We plot aCMD for 3 different spatial samples, i.e. for stars found at ellip-tical radiusr < 0.4 deg, 0.4 deg< r < 0.7 deg, andr > 0.7 deg(Fig.6). Clear differences are visible between the inner and theouter regions: the main sequence and Blue Loop stars (young)are absent in the outer regions. The extent inMV of the RC de-creases with the distance to Fornax centre; this means that theage of the dominant stellar component in this feature is olderin the outer parts (Caputo et al. 1995). We also notice that theBHB, which is almost hidden by the main sequence in the in-ner region, becomes more clearly visible the further out we go,because the MS disappears. Finally, we can see that the RGBchanges: the red side, generally younger and more metal richthan the blue side, becomes less evident in the outer regions.
Below we analyse the spatial distribution of the differentcomponents, through their location in the field of view and thetrend of the cumulative fraction with radius.
3.3.1. Ancient populations
In Fornax the BHB stars overlap the MS in the inner regions,thus we reduce the selection box of BHB stars to V−I∼0.15- V−I∼0.35. In Fig. 7a-b we plot the spatial distribution ofthe BHB and RHB components, and in Fig. 8a the location ofB-RGB stars. Figure 9 shows the Galactic contamination sub-tracted density profile for the ancient populations (top) and thefraction of stars within a radiusr, f (< r), in bins of 0.1 deg(bottom). The ancient stellar components clearly all have thesame distribution, the only exception being the trend atr <0.3deg for the BHB population, which suffers from small numberstatistics. It is also likely that the BHB behaviour is altered bythe presence in the selection box of MS stars (see Fig. 4b). Aχ2 two-sample test applied to the percentage of stars within aradiusr out to the estimated Fornax tidal radius gives a proba-bility of 99.99% that the ancient stellar populations are drawnfrom the same distribution.
Taking as reference the RHB cumulative distribution, wecan see that 95% of the ancient population is found withinr .0.9 deg. The dominant, intermediate age, stellar population inFornax, i.e. RC stars, shows a distinctly different distribution,with 95% of its stars distributed withinr . 0.7 deg. Clearly,the ancient populations display a more extended spatial distri-bution then the intermediate age stars. The sameχ2 test appliedto the RHB and RC stars gives a low probability, 5%, that thesetwo populations are drawn from the same parent population,confirming the fact that intermediate and ancient stars showvery different spatial distributions.
There is evidence for small scale spatial substructure inpart of the ancient stellar component of Fornax. In Fig. 8a (B-RGB) there is a clear overdensity of stars atξ ∼ −0.15 andη ∼ −0.25 (α ∼ 2h39m8s, δ ∼ −34◦45
′
51“ ); this also appears tobe present, though less pronounced, in the spatial distributionof RHB stars at similar position, however in contrast the dis-tributions of BHB and RRLyrae stars appear to be smooth. Wefind the number of B-RGB within 4′ of the above feature signif-icantly larger (within 2σ) with respect to the number within 3control fields, of the same dimensions and at the same ellipticalradius; the overdensity of RHB is instead not statisticallysig-nificant. A CMD centred on this overdensity shows a slightlybluer colour for the RGB in the over-density than in 3 controlfields.
There is no evidence that the nearby cluster 2 (ξ ∼ −0.23,η ∼ −0.30 in Fig. 1) is related to this over-density, because thestars in the over-density do not match the cluster 2 CMD (e.g.Buonanno et al. 1998).
Similar overdensities in the stellar distribution have beenfound in previous works both in other dSphs as well as inFornax dSph (e.g. Coleman et al. 2004).
3.3.2. Intermediate age populations
The spatial distribution of the intermediate age populations (2-8 Gyr old) is represented by RC, AGB bump and R-RGB starsdistribution. Figure 7c shows the location on the field of view ofthe selected RC stars. As already mentioned, the RC stars formthe dominant stellar population in Fornax. Thus, to allow amore meaningful comparison between the spatial distributionsof intermediate age and ancient stars, we normalised the RCpopulation to the number of stars present in the RHB. Visualcomparison of these two distributions shows that RC stars havea less extended and more concentrated spatial distributionthanRHB stars. The distribution of R-RGB stars (Fig. 8b) is simi-lar to the RC stars, indicating a similar origin and thus similarage/metallicity properties for the stars found in the red part ofthe RGB in Fornax and in the RC. Figure 10 shows the Galacticcontamination subtracted density profile (top) and the cumu-lative fraction (bottom) of RC, AGB bump and R-RGB: theyclearly have the same spatial distribution; aχ2 test applied tothe percentage of stars within a radiusr out to the estimatedFornax tidal radius gives a probability of 99.99% that the inter-mediate age stellar populations are drawn from the same distri-bution. Thus, it appears likely that all the stars with ages of 2-8Gyr formed from the same gas distribution.
3.3.3. Young populations
We have already seen from the CMDs in Fig. 6 that young MS(< 1 Gyr old) and BL stars are only present withinr < 0.4 deg,in the central region of Fornax. Figure 11 shows the spatialdistribution of MS and Blue Loop stars (panel a,b). The mainsequence stars are centrally concentrated and show a different,asymmetric distribution with respect to the older stars. Theypredominantly form a structure extended in the E-W direction,with a major axis tilted at∼ 40◦ with respect to the bulk of

G.Battaglia et al.: DART Survey of Fornax dSph 7
the stellar population (as already noted by Stetson et al. 1998).The overall spatial distribution of BL stars is also asymmetric,although not as pronounced as the MS. It is difficult to removethe effects of the foreground contamination (Fig. 11c) but itappears that the blue loop stars have a more relaxed distributionthan the MS.
As mentioned in Sect. 3.2.3 the colour of the BL featureis strongly dependent on metallicity. Overlaying Padua stel-lar isochrones (Girardi et al. 2000) on the CMD (Fig. 12), wefind that the Blue Loop stars are consistent with ages between400 and 700 Myr and metallicity Z=0.004. Isochrones of lowermetallicities (Z=0.001) predict the presence of a plume of BlueLoop giants much closer to the MS than observed, and the pre-dicted average colour of the BL feature for higher metallicities(Z=0.008) is significantly redder than observed1.
Figure 12 also shows that the Girardi et al. (2000) Paduaisochrones suggest that the MS contains stars as young as 200-300 Myr, and as old as 1 Gyr, which is different with respectto the BL stars age range. Thus, to compare the spatial dis-tribution of MS and BL stars, we must separate the MS starsin two groups, those predominantly younger and those olderthan 400 Myr. This is achieved by splitting the MS in colour:the “young” and “old” MS stars are approximately bluer andredder, respectively, thanV − I =0. In this case we find thatthe spatial distribution of “old” MS stars is consistent withthe BL spatial distribution, whilst “young” MS stars display amore asymmetric and centrally concentrated distribution.Thus,it seems that the “young” MS stars are found closer to the loca-tion where they were formed, whilst “old” MS and BL starshave diffused to larger radii. To estimate the diffusion time,we use the dynamical time (Binney & Tremaine 1987), whichranges between 350- 800 Myr, assuming a mass within the tidalradius between 108-1.55×10⁷ M⊙ . This is consistent with theage of the “old” MS stars. Thus the elongated structure of theMS is formed predominantly by the younger MS stars, and ispresumably the remaining signature of the collapsed gas fromwhich the stars were formed.
3.3.4. A quantitative comparison between stellarpopulations
We have shown that the younger the stellar population the moreconcentrated and less extended is its spatial distributionover allthe observed populations. We have also shown that stars in thesame age range (but different stellar evolutionary phases) dis-play very similar spatial distributions, and that the blue and redside of the RGB are linked to the ancient and intermediate agepopulations, respectively. Aχ2 test is applied to the percentageof stars within a radiusr out to the estimated Fornax tidal radiusfor the several stellar components (Figs. 9, 10) gives a proba-bility of 99.99% that RC, AGB and R-RGB stars are drawnfrom the same distribution, and again 99.99% for the differentancient stellar populations, whilst when comparing the distri-
1 Using different sets of isochrones, e.g. Geneva(Lejeune & Schaerer 2001) or Yonsei-Yale (Yi et al. 2001; Kimet al.2002), would bring to slightly different results, however qualitativelyin agreement.
bution of an ancient population, e.g. RHB, to one of the in-termediate age population, e.g. RC, we obtain a probabilityof5% that they are drawn from the same spatial distribution. Thisshows that we can consider stars found at different stages ofstellar evolution but with similar ages as belonging to the samepopulation.
We derived density profiles, from which Galactic contami-nation has been subtracted, for these two components and com-pared them to the models used in Sec. 3.1.The best-fitting pro-file for the old population is given by the King model, that fol-lows more closely the data beyond 1 deg with respect to theSersic profile. However, the density profile of the intermedi-ate age stars is better represented by a Sersic profile, sincetheKing model declines too steeply. In both cases the exponen-tial and Plummer models overpredict the density forr . 0.2deg andr & 0.9 deg, and underpredict it at intermediate radii.Independently from the adopted model, the results of the fit(see Table 3) show that intermediate age stars are more cen-trally concentrated and less extended than old stars.
The spatial distribution of different stellar populations is apowerful way to identify stellar populations of different ages ina dwarf galaxy.
3.4. Shells
The discovery of two shell-like features was recently reportedin Fornax from photometric studies (Coleman et al. 2004,2005). The first of these features was identified outside the coreradius atα = 2h40m28.5s andδ = −34◦42′33′′ (correspond-ing to ξ ∼0.12,η ∼ −0.20 and elliptical radius of 0.33 deg inFig. 1) as a small over-density of stars in data down toI ∼21(Coleman et al. 2004). Adding deeper data from Stetson et al.(1998) to their sample the authors found the shell to be consis-tent with being dominated by young, 2 Gyr old, ZAMS stars.The authors proposed that this might be analogous to the shellsfound in elliptical galaxies and suggested that Fornax mighthave accreted a smaller gas-rich galaxy around 2 Gyr ago.
A second “shell” was found in the RGB distribution out-side the tidal radius, around 1.3◦ northwest from the centre(Coleman et al. 2005) and, similarly to the inner shell, locatedalong the minor axis and elongated along the major axis.
Olszewski et al. (2006) carried out much deeper imagingof this over-density, down toR ∼ 26 and refined the age ofthe “feature” and suggested that the excess of stars in the shellmight be the result of a burst of star formation which occurred1.4 Gyr ago with a metallicity Z=0.004 ([Fe/H]= −0.7), favour-ing a scenario in which the gas from which these stars formedwas pre-enriched within Fornax itself.
Our photometry covers the region of the inner shell, and wedo not detect such a feature, but comparing our sample with theadditional data-set from Stetson et al. (1998), we find signsofthe shell when we include the stars we had discarded from ouranalysis because they were detected inV but not in theI band.This makes it clear that the feature is just at the detection limitof our data. We also note that the MS stars are asymmetricallydistributed, and this could cause the presence of local overden-sities with respect to other regions in Fornax, at the same el-
8 G.Battaglia et al.: DART Survey of Fornax dSph
liptical radius, where young stars might be under-represented.Deeper photometry covering the entire region atr <0.4-0.5 degwould make it possible to resolve this issue.
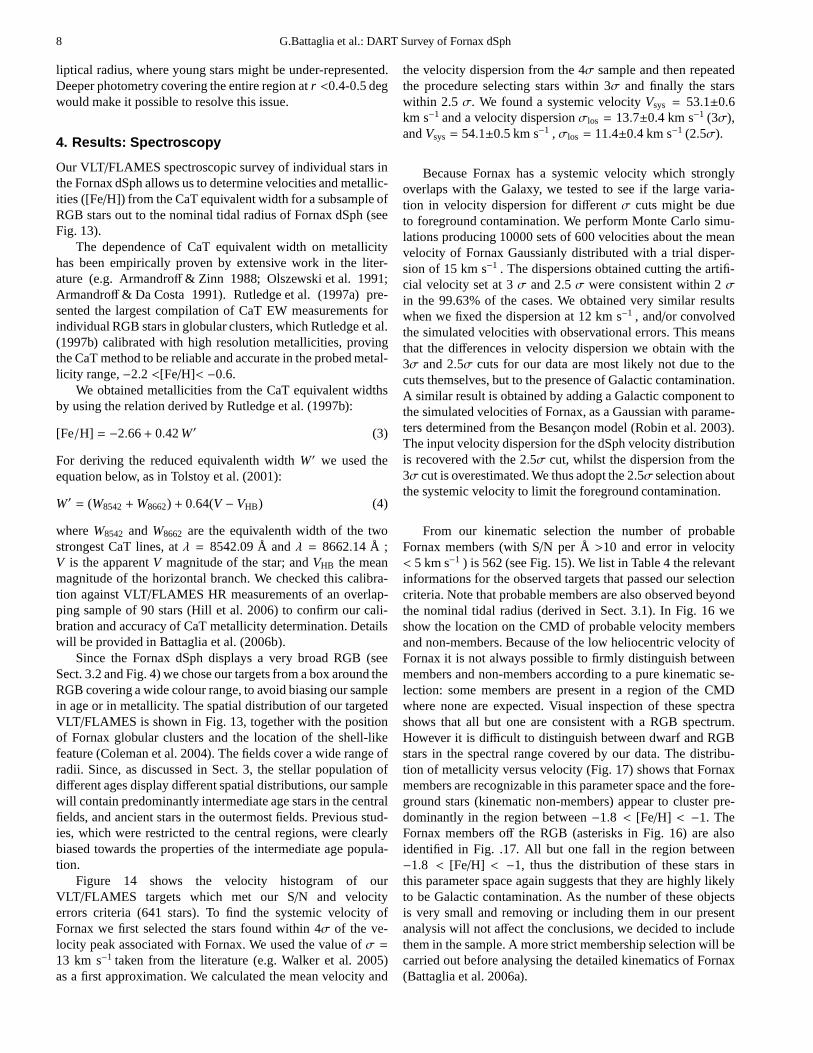
4. Results: Spectroscopy
Our VLT/FLAMES spectroscopic survey of individual stars inthe Fornax dSph allows us to determine velocities and metallic-ities ([Fe/H]) from the CaT equivalent width for a subsample ofRGB stars out to the nominal tidal radius of Fornax dSph (seeFig. 13).
The dependence of CaT equivalent width on metallicityhas been empirically proven by extensive work in the liter-ature (e.g. Armandroff & Zinn 1988; Olszewski et al. 1991;Armandroff & Da Costa 1991). Rutledge et al. (1997a) pre-sented the largest compilation of CaT EW measurements forindividual RGB stars in globular clusters, which Rutledge et al.(1997b) calibrated with high resolution metallicities, provingthe CaT method to be reliable and accurate in the probed metal-licity range,−2.2 <[Fe/H]< −0.6.
We obtained metallicities from the CaT equivalent widthsby using the relation derived by Rutledge et al. (1997b):
[Fe/H] = −2.66+ 0.42W′ (3)
For deriving the reduced equivalenth widthW′ we used theequation below, as in Tolstoy et al. (2001):
W′ = (W8542+W8662) + 0.64(V − VHB) (4)
whereW8542 andW8662 are the equivalenth width of the twostrongest CaT lines, atλ = 8542.09 Å andλ = 8662.14 Å ;V is the apparentV magnitude of the star; andVHB the meanmagnitude of the horizontal branch. We checked this calibra-tion against VLT/FLAMES HR measurements of an overlap-ping sample of 90 stars (Hill et al. 2006) to confirm our cali-bration and accuracy of CaT metallicity determination. Detailswill be provided in Battaglia et al. (2006b).
Since the Fornax dSph displays a very broad RGB (seeSect. 3.2 and Fig. 4) we chose our targets from a box around theRGB covering a wide colour range, to avoid biasing our samplein age or in metallicity. The spatial distribution of our targetedVLT /FLAMES is shown in Fig. 13, together with the positionof Fornax globular clusters and the location of the shell-likefeature (Coleman et al. 2004). The fields cover a wide range ofradii. Since, as discussed in Sect. 3, the stellar population ofdifferent ages display different spatial distributions, our samplewill contain predominantly intermediate age stars in the centralfields, and ancient stars in the outermost fields. Previous stud-ies, which were restricted to the central regions, were clearlybiased towards the properties of the intermediate age popula-tion.
Figure 14 shows the velocity histogram of ourVLT /FLAMES targets which met our S/N and velocityerrors criteria (641 stars). To find the systemic velocity ofFornax we first selected the stars found within 4σ of the ve-locity peak associated with Fornax. We used the value ofσ =
13 km s−1 taken from the literature (e.g. Walker et al. 2005)as a first approximation. We calculated the mean velocity and
the velocity dispersion from the 4σ sample and then repeatedthe procedure selecting stars within 3σ and finally the starswithin 2.5σ. We found a systemic velocityVsys = 53.1±0.6km s−1 and a velocity dispersionσlos = 13.7±0.4 km s−1 (3σ),andVsys= 54.1±0.5 km s−1 , σlos = 11.4±0.4 km s−1 (2.5σ).
Because Fornax has a systemic velocity which stronglyoverlaps with the Galaxy, we tested to see if the large varia-tion in velocity dispersion for differentσ cuts might be dueto foreground contamination. We perform Monte Carlo simu-lations producing 10000 sets of 600 velocities about the meanvelocity of Fornax Gaussianly distributed with a trial disper-sion of 15 km s−1 . The dispersions obtained cutting the artifi-cial velocity set at 3σ and 2.5σ were consistent within 2σin the 99.63% of the cases. We obtained very similar resultswhen we fixed the dispersion at 12 km s−1 , and/or convolvedthe simulated velocities with observational errors. This meansthat the differences in velocity dispersion we obtain with the3σ and 2.5σ cuts for our data are most likely not due to thecuts themselves, but to the presence of Galactic contamination.A similar result is obtained by adding a Galactic component tothe simulated velocities of Fornax, as a Gaussian with parame-ters determined from the Besancon model (Robin et al. 2003).The input velocity dispersion for the dSph velocity distributionis recovered with the 2.5σ cut, whilst the dispersion from the3σ cut is overestimated. We thus adopt the 2.5σ selection aboutthe systemic velocity to limit the foreground contamination.
From our kinematic selection the number of probableFornax members (with S/N per Å >10 and error in velocity< 5 km s−1 ) is 562 (see Fig. 15). We list in Table 4 the relevantinformations for the observed targets that passed our selectioncriteria. Note that probable members are also observed beyondthe nominal tidal radius (derived in Sect. 3.1). In Fig. 16 weshow the location on the CMD of probable velocity membersand non-members. Because of the low heliocentric velocity ofFornax it is not always possible to firmly distinguish betweenmembers and non-members according to a pure kinematic se-lection: some members are present in a region of the CMDwhere none are expected. Visual inspection of these spectrashows that all but one are consistent with a RGB spectrum.However it is difficult to distinguish between dwarf and RGBstars in the spectral range covered by our data. The distribu-tion of metallicity versus velocity (Fig. 17) shows that Fornaxmembers are recognizable in this parameter space and the fore-ground stars (kinematic non-members) appear to cluster pre-dominantly in the region between−1.8 < [Fe/H] < −1. TheFornax members off the RGB (asterisks in Fig. 16) are alsoidentified in Fig. .17. All but one fall in the region between−1.8 < [Fe/H] < −1, thus the distribution of these stars inthis parameter space again suggests that they are highly likelyto be Galactic contamination. As the number of these objectsis very small and removing or including them in our presentanalysis will not affect the conclusions, we decided to includethem in the sample. A more strict membership selection will becarried out before analysing the detailed kinematics of Fornax(Battaglia et al. 2006a).

G.Battaglia et al.: DART Survey of Fornax dSph 9
4.1. Chemo-dynamics
Several spectroscopic studies of individual stars in the FornaxdSph galaxy have shown that it is the most metal rich of theMilky Way dSph satellites (except for Sagittarius), with a peakmetallicity at [Fe/H]∼ −1.0 and a large metallicity spread(Tolstoy et al. 2001; Pont et al. 2004). The extent of the metalpoor and metal rich tail has changed depending mainly on thesize and the spatial location of the observations. The most re-cent study, consisting of CaII triplet measurements of 117 RGBstars (Pont et al. 2004), showed that Fornax contains stars asmetal poor as [Fe/H]∼ −2.0 and as metal rich as−0.4 with apeak at [Fe/H]= −0.9.
Figure 18 shows the metallicity distribution with ellipti-cal radius for the Fornax members kinematically selected fromour VLT/FLAMES data. A variation of metallicity with ellip-tical radius is clearly visible: a metal poor population (−2.8 <[Fe/H] < −1.2) is seen throughout the galaxy; a more metal richpopulation ([Fe/H]peak ∼ −0.9) is present out to 0.7 deg fromthe centre; and an even more metal rich tail, extending out to[Fe/H]= −0.1, is present mainly in the inner 0.3-0.4 deg. Thisis quantified as an histogram in Fig. 19, where the sample isdivided into 3 spatial bins (innerr <0.4, middle 0.4 < r < 0.7,and outerr >0.7 ) and we can see that the metal poor com-ponent, centred at [Fe/H]∼ −1.7, is present in each bin and isthus spread throughout the galaxy; another component, centredat [Fe/H]= −1, with width at half peak of about 0.3, is presentin the middle and inner regions; and only the innermost regioncontains the most metal rich component.
Such a large sample of velocity and metallicity measure-ments, covering a much larger area than previous studies, givesus the possibility to explore the relationship between the kine-matics and metallicity in this galaxy. We divided the metallic-ity distribution into two parts: stars more metal rich (MR) andmore metal poor (MP) than [Fe/H]= −1.3. This value of themetallicity was chosen to try and minimise the overlap betweenthe two metallicity components. However a slightly differentcut (e.g. [Fe/H]−1.2 or−1.4) does not significantly change theconclusions of our analysis.
Figure 20 shows the velocity distributions for the twometallicity components in 3 different spatial bins (innerr < 0.4deg, middle 0.4< r < 0.7 deg, outerr > 0.7 deg). The metalpoor population exhibits a larger velocity dispersion thanthemetal rich population2 (see Table 5); furthermore, in the firstbin the velocity distribution of the metal poor stars is far frombeing Gaussian: it is flat or even double peaked (with peaks be-tween 37-42 km s−1 and 67-72 km s−1 ). Changing the binningin the histogram leaves the main features of the velocity distri-bution unchanged. Figure 21 shows the cumulative function ofthe MP stars atr < 0.4 deg compared to the cumulative dis-
2 The velocity dispersion values we list are from the weightedstan-dard deviation and do not include the broadening due to measurementerrors. The true dispersionσtrue is approximatelyσ2
true = σ2obs− σ
2meas,
whereσobs is the observed velocity dispersion andσmeasis the averagemeasured error in velocity. For our FLAMES data the average error invelocity is∼ 2 km s−1 ; the resulting values of the velocity dispersionare thus only marginally inflated, for example ifσobs= 10 km s−1 thenσtrue = 9.8 km s−1 .
tribution for a Gaussian with the same mean velocity and dis-persion as the metal rich component in the same distance bin.The two cumulative functions are very different, and this alsoshows that the cumulative function of the MP stars is similartowhat is expected for a uniform distribution, with two peaks at∼ 40 km s−1 and∼ 70 km s−1 .
An issue is if the velocity distribution of MP stars in thefirst bin is artificially biased by our choice of the metallicitycut, namely if by assigning metal poor stars to the metal richcomponent we could cause the small observed number of MPstars with velocity close to the systemic in the inner bin. Thiscan be explored by changing the cut in metallicity, e.g. using[Fe/H] < −1.6 for the metal poor component, and [Fe/H] >−1.1 for the metal rich one. We find the same features for theMP distribution atr < 0.4 deg as in the case with a metallicitydivision at [Fe/H]= −1.3, showing that the choice of a differentmetallicity cut does not alter our conclusions and accentuatesthe differences between the velocity distributions for metal richand metal poor stars.
We tested to see if the differences in velocity distributionbetween the metal poor and the metal rich components are sta-tistically significant: can the metal poor population in theinnerbin be drawn from the metal rich and how significant wouldthis be? A two-sided KS-test applied to the velocity distribu-tions gives a probability of 0.7%, 0.4% and 16% that the MPstars in the first bin might be drawn from the same distributionas respectively: the MR stars in the inner bin; the MR stars inthe middle bin; the MP stars in the middle bin. Thus the dif-ferences in the velocity distribution of MR and MP stars areunlikely to be an artifact of the observed number of stars, andinstead point to significantly different kinematic behaviour ofdifferent metallicity components.
We also tested to see if the differences between the veloc-ity distribution of MP stars in the inner and middle bins, re-flected in the relatively low value of the K-S test, are due tothe peculiarities of the velocity distribution of the MP stars atr < 0.4 deg, or are intrinsic. Thus, we artificially “removed”the two velocity peaks by considering as the “expected” num-ber of stars at the velocities of the peaks as the average of thenumber of stars in the adjacent bins. We then randomly re-moved the stars in “excess” from the velocity peaks (5.5±2.3for the peak at∼ 40 km s−1 and 14±4 at∼ 70 km s−1 ). The ve-locity distribution of the remaining stars is compatible with aGaussian distribution with velocity dispersionσ = 13.4± 1.74km s−1 (probability of 99.85% from a KS-test). In this case MPstars in the inner and middle distance bins have a 93.7% prob-ability to have been drawn from the same velocity distribution.
Thus Fornax dSph shows clear differences in the kinemat-ics of its MR and MP component. Contrary to expectations,part of the metal poor component, arguably the oldest com-ponent, displays non-equilibrium kinematic behaviour atr <0.4 deg. A possible explanation for this is that Fornax recentlycaptured external material which is disturbing the underlyingdistribution. Since we detect signs of disturbance only in theMP component, we argue that part of the object accreted byFornax must have been dominated by stars more metal poorthan [Fe/H]< −1.3.

10 G.Battaglia et al.: DART Survey of Fornax dSph
4.2. Age determination
It is well known that the main uncertainty in deriving the ab-solute ages of stars in a CMD of a complex stellar population(ie. a galaxy) is that the position of a star changes dependingdegenerately upon both age and metallicity. We can break thisdegeneracy using metallicities derived from spectroscopy. InFornax we can use our spectroscopic metallicities of 562 RGBstars to determine which isochrone set to use to determine theages of these stars, and thus produce an age-metallicity rela-tion for the galaxy over the age range covered by RGB stars(>1Gyr). The ages we determine in this way remain uncertainin absolute terms due to the limitations in the stellar modelsused to create the isochrones, but in relative terms the agesareaccurate. Given the low systemic velocity of Fornax there willbe foreground stars contaminating our samples.
We chose to use the Yonsei-Yale isochrones (Yi et al. 2001;Kim et al. 2002) because they cover the range of ages andmetallicities we require in a uniform way, and they allow fora variation in [α/Fe]. They also provide a useful interpolationprogramme which allows us to efficiently calculate the exact setof isochrones to compare with each spectroscopic metallicity.These isochrones did have the problem that they did not alwaysextend up to the tip of the RGB for young metal rich stars, butcomparison with the Padua isochrones (Girardi et al. 2000) ofthe same metallicity suggested that we could extrapolate theseY-Y isochrones to the tip of the RGB which allowed us to de-termine ages of the young metal rich stars in our sample.
In Fig. 22a we plot the CMD of the 39 stars in our spectro-scopic sample with [Fe/H]= −1.7± 0.1 and over-plot the Y-Yisochrones of the same metallicity for two different ages: themajority of metal poor stars fall on the blue side of the RGBand are consistent with old ages (>10Gyr old), and thus canbe associated with the ancient component from the photomet-ric analysis in Sect. 3. The stars found outside the range ofthe isochrones to the red (V − I & 1.4) may be Galactic con-tamination. There are also several quite blue stars (atV − I ∼1.1; V ∼ 18.3) which are consistent with having young ages(2 Gyr), and these are most likely to be foreground contamina-tion. The more metal rich stars for which we have spectroscopy,with [Fe/H]= −1± 0.1 (119 stars), are shown in Fig. 22b. Theyare generally consistent with young, 2-5Gyr old, isochronesand match the dominant intermediate age component found inthe photometric analysis. Fornax members at higher metallicity([Fe/H]= −0.7 ± 0.1) are better represented by ages of 1.5 -2Gyr (Fig. 22c).
In Fig. 23 we show the age-metallicity relation obtained forFornax from fitting Y-Y isochrones to our entire spectroscopicsample. We used [α/Fe]= 0, in agreement with the averagevalue from preliminary HR measurements of RGB stars in thecentre of the Fornax dSph (Letarte et al. 2006b). We derivedthe errors in the age determination from the errors in magni-tude and colour of the photometry, and assuming a metallicityerror of 0.1 dex for each star. This figure contains 466 stars(out of the total sample of 562 stars), among which 103 wereyoung stars which were too bright for the young isochrones(but fainter than the tip of the RGB); 97 stars fell completely
outside the age range of the isochrones and therefore had to beexcluded.
If we change the [α/Fe] assumed, and repeat our age de-termination for [α/Fe]= 0.3; and for a variation inα with[Fe/H] ([α/Fe]= 0.2 for [Fe/H] < −1.7 and decreasing to[α/Fe]= 0 between [Fe/H] = −1.7& − 1.0 and then remain-ing constant), as found in HR studies of the central region ofFornax (Letarte et al. 2006b) we obtain slightly different re-sults as shown by the relations plotted in Fig. 23. The differenttrend is enhanced by the fact that previously excluded groupsof low metallicity stars when using [α/Fe]> 0 isochrones couldnow be included. Thus theα-element abundance of a star hasan impact on deriving accurate ages, and it would clearly bedesirable to be able to correct for this effect for each star.Unfortunately [α/Fe] determination requires HR spectroscopyand for the large sample here this is a daunting task. Howeverwe can make use of the HR study of the central region anduse the general trends found there. HR studies (Letarte et al.2006b) find that [α/Fe]< 0 for [Fe/H]& −1.0, however as thereare no currently available sets of isochrones for [α/Fe]< 0, itis not clear how this will affect our age estimates. Assumingthe interpolation between [α/Fe]= 0.3 and 0. continues to−0.3this would go in the direction of reconciling the discrepanciesbetween the observations and the isochrones at high metallici-ties.
5. Discussion
5.1. Age & Metallicity Gradients
One of the main results of our imaging and spectroscopic sur-vey of the Fornax dwarf spheroidal galaxy is the presence of apopulation gradient. The stellar population shows a clear vari-ation in age and metallicity as a function of radius (e.g. Figs. 6,14 and 19). We can associate most of the more metal poor com-ponent with an ancient population (> 10Gyr), and most of themore metal rich component with an intermediate age popula-tion (2-8 Gyr) with overlapping metallicity distributions.
Population gradients have been detected in several otherdwarf spheroidal galaxies in the Local Group from imaging(e.g., Harbeck et al. 2001), and spectroscopy (e.g., Tolstoy et al.2004). This must point to some common process in the forma-tion of stars in these small systems, as this variation most likelyreflects the original spatial distribution of gas from whichthedifferent stellar populations were formed. It is unlikely that thespatial distribution of one stellar component can have changedsignificantly with respect to another over time. Although weakencounters could diffuse an older component, it is unlikely tobe an important effect because the relaxation time (Binney &Tremaine 1987) of Fornax is> 1.5×10¹⁰ years, i.e. longer thanthe age of the ancient population. Therefore, the present spa-tial distribution of stars of different ages gives us an indicationof how the gas from which they were formed was distributed,and requires an explanation for how gas has apparently beenprogressively “removed” from the outer regions, and more re-cently, apparently, completely from the system.
Star formation is likely to have a dramatic impact on theinterstellar medium of these small galaxies. It is possiblethat

G.Battaglia et al.: DART Survey of Fornax dSph 11
gas is frequently blown away as the result of supernovae typeII explosions of massive stars (e.g. Mac Low & Ferrara 1999;Mori et al. 2002). This expelled gas should be able to fall backonto the galaxy, if the galaxy has a large enough potential, andon its return the gas will sink deeper into the central regions,where further generations of star formation can occur, withpo-tentially different spatial, kinematic, metallicity and age char-acteristics. This next generation stellar population willlikely bea more centrally concentrated, younger, more metal rich com-ponent. In this case we should expect a direct correlation be-tween the mass of the galaxy and the fraction of gas retainedby the system, as the deeper potential well of the most mas-sive dSphs is more capable of retaining more of the originalgas (e.g., Ferrara & Tolstoy 2000). Consistent with this picture,Fornax differs from the less massive Sculptor dSph in having amuch more extended star formation history.
However this correlation is not a straight forward predic-tion of the properties of all the dwarf galaxies in the LocalGroup. This is because it is not only the mass of galaxies thatdetermines their ability to retain an interstellar medium;dSphtypically live in a fairly active environment with competing ef-fects of the tidal field of our much larger Milky Way and sev-eral fairly large interacting companions (e.g., the MagellanicClouds), and the debris left around by these interactions (e.g.,the Magellanic Stream). N-body simulations indicate that tidalstripping combined with ram pressure stripping is a feasiblecombination to explain the lack of gas at the present timein dSphs (Mayer 2005). The importance of these effects de-pends strongly on the orbital parameters of the satellite, theapocenter-to-pericenter ratio, and the time at which the satel-lite enters the Milky Way potential. Whilst the satellite isor-biting the Galaxy, part of its gas may be ionized by the MilkyWay corona, perhaps in combination with the cosmic UV back-ground. The gas can be then removed over time, with vary-ing degrees of efficiency, if the apocenter-to-pericenter ratio islarge enough.
Recent proper motion measurements for Fornax suggest apericentric distance of the order of the present Galactocentricdistance (Piatek et al. 2002; Dinescu et al. 2004), and an almostcircular orbit with an orbital period of∼ 4-5 Gyr (Dinescu et al.2004). Even though proper motion measurements are rather un-certain, this would suggest that we can exclude strong interac-tion with the Milky Way. Thus, as suggested by Mayer (2005),an object like Fornax may not be completely stripped of itsgas, but would be able to retain it in its central regions and thusmaintain an extended star formation history.
N-body models that predict dIrr to be the progenitors ofdSphs, transformed into spheroids by tidal stirring from theMilky Way (Mayer et al. 2001a,b), predict an increase in thestar formation activity of a satellite after pericentric passage.The pericentric passage can also provoke the formation of abar that funnels gas into the central region, making the gas dis-tribution more centrally concentrated. These models are highlydependent upon the starting conditions for the satellite. It isfound that an apocentre-to-pericentre ratio of∼ 5 and a peri-centre distance of∼ 50 kpc would be required to transform adIrr into a dSph. Fornax has never been specifically modeled,however, as it is now thought to be close to its pericentre and
the previous passage probably occurred around 4-5 Gyr ago,this would correspond well to the time frame of the last periodof intense star formation. This scenario could explain boththevariation in the spatial distribution of the Fornax stellarpopu-lation and the large fraction of intermediate age stars. Specificsimulations, emulating the orbital parameters of Fornax, are re-quired for a more detailed comparison between these observa-tions and N-body simulations.
5.2. Peculiar Kinematics
In addition to the different spatial distribution of ancient, inter-mediate age and young stars, we also find a different kinematicbehaviour of metal rich and metal poor stars. This behaviourappears similar to what is seen, for example, in our MilkyWay. The stellar bulge of our Galaxy is much less extendedand kinematically colder than the stellar halo. This distinctionmay merely reflect the different spatial distribution required bya star moving with a larger velocity to reach larger distances orit may be telling us something more fundamental about the dif-ferent conditions of the formation of these two different com-ponents. To test this we can use the Jeans equation to derivethe line of sight velocity dispersion predicted for stars follow-ing the different density profiles of old and intermediate agestars (Binney & Tremaine 1987). This calculation shows thatitis difficult to interpret the observed differences in velocity dis-persion of MR and MP stars as being only due to their differentspatial distribution (Battaglia et al. 2006a), and the sameresultis found in N-body simulations (e.g Kawata et al. 2006). In afuture paper we will present detailed kinematic modelling ofthese distinct stellar populations, taking into account the pos-sibility of different orbital properties for the two populations(Battaglia et al. 2006a).
Another aspect that deserves further investigation is the ap-parentlynon-equilibrium kinematics of the metal poor, presum-ably the oldest, stellar population in the center of Fornax.Apossible interpretation of this is that we are seeing a remnant ofaccreted material. Given the presence of 5 globular clusters inFornax, it would not be surprising for this to be a disruptedglobular cluster. In this case we would expect the metallic-ity distribution of the stars forming the velocity feature to beextremely narrow, however the metallicity of the stars in thedouble peak ranges from−2 .[Fe/H]. −1.4, showing a muchlarger spread than can be accounted for by a globular cluster.
An alternative explanation, as proposed by Coleman et al.(2004, 2005), is that Fornax accreted a smaller galaxy at somepoint in the recent past. These authors propose the accretion ofa gas-rich dwarf∼ 2 Gyr ago. In this case the MP stars withunrelaxed kinematics could be the remnant of the disrupted oldstellar component of this accreted galaxy, and the asymmetricspatial distribution of the young stars (BL and MS) could bea result of the gas which subsequently formed stars as a con-sequence of the accretion process. Measuring the metallicitiesof the young stars in Fornax could help to answer this ques-tion by determining whether or not they are consistent with thebulk of the older stellar population in Fornax. Unfortunatelywe do not have spectroscopic metallicities of these stars, but
12 G.Battaglia et al.: DART Survey of Fornax dSph
the indications from the colour of the Blue Loops in the CMD(see section 3.3.3) suggest that these stars have a metallic-ity of [Fe/H]∼ −0.85± 0.15, consistent with the mean of theyoungest RGB stars (age>1-2 Gyr) in our VLT/FLAMES sam-ple. However, our FLAMES sample also contains a significantnumber of stars with higher metallicity, up to [Fe/H]∼ −0.1.Assuming we can directly compare metallicities derived withthese two different methods, this could be an indication thatFornax has recently (<1-2 Gyr ago) been polluted with externalgas of lower metallicity than the gas in Fornax at that time. Thiswould also explain the peculiar kinematics of the MP stars inthe centre of Fornax. However, this conclusion requires furtherconfirmation, such as high resolution follow-up of the metalrich RGB stars in the central region (Letarte et al. 2006b), spec-troscopic analysis of the Blue Loop and/or main sequence stars,and detailed dynamical modelling.
6. Summary
We have presented results from accurate ESO/WFI photome-try of resolved stars in the Fornax dSph galaxy covering theentire extent out to its nominal tidal radius, and also velocityand metallicity measurements from our VLT/FLAMES spec-troscopy of 562 RGB stars also out to the nominal tidal radius.
Using our ESO/WFI photometry we re-derive basic struc-tural parameters of Fornax such as central position, ellipticityand position angle. In common with previous imaging studieswe show that the Fornax dwarf spheroidal galaxy contains 3stellar components: an ancient component, with ages between10-15 Gyr old, which is spatially extended; an intermediateagecomponent, with ages 2-8 Gyr old, that contains the bulk ofthe stellar population (∼ 40%), which is more centrally con-centrated and less extended with respect to the older compo-nent; a young population, with stars younger than∼ 1 Gyrold. The youngest component (<1 Gyr old) is the most cen-trally concentrated and is completely absent beyond a radius of0.4 deg from the centre, and it shows an asymmetric, disc-like(or bar-like) distribution. Within this component, the 200-300Myr old stars show the most asymmetric and centrally con-centrated distribution. The colour of the plume formed in theCMD by Blue Loop stars indicates that this young populationhas a metallicity [Fe/H] between−0.7 and−1.0. Spatial anal-ysis shows that substructures might be present in the ancientstellar population represented by the B-RGB.
The VLT/FLAMES spectroscopy in the CaT wavelengthregion for a sample of 562 Fornax RGB velocity membersshows that the mean metallicity of the stellar populationchanges with radius with the central regions more metal richthan the outer regions. No stars more metal poor than [Fe/H].−2.7 are found anywhere in the galaxy, but we can distinguisha metal poor component, with a mean of [Fe/H]∼ −1.7 andextending from−2.5 .[Fe/H]. −1, that is found through-out the galaxy; a more metal rich component, with a mean of[Fe/H]∼ −1 and extending from−1.5 .[Fe/H]. −0.5, presentmainly within 0.7 deg from the centre and is thus more spa-tially concentrated than the metal poor stars; a metal rich tail,[Fe/H]. −0.1, is found at radii less than 0.4 deg from thecentre. “Metal rich” and “metal poor” populations (stars with
[Fe/H]> −1.3 and< −1.3, respectively) show different kine-matics: metal rich stars have a colder velocity dispersion thanmetal poor stars, and these differences are not dependent onthe metallicity cut. The metal poor component shows signs ofnon-equilibrium kinematics in the inner regions (r < 0.4 deg),arguably due to the accretion of external material. A more com-plete modelling of chemo-dynamics of Fornax is the subject ofa future paper (Battaglia et al. 2006a).
Acknowledgements. GB would like to thank Andrew Cole for use-ful suggestions. ET gratefully acknowledges support from afellow-ship of the Royal Netherlands Academy of Arts and Sciences AHac-knowledges financial support from the Netherlands Organization forScientific Research (NWO). MDS would like to thank the NSF forpartial support under AST-0306884. KAV would like to thank the NSFfor support through a CAREER award, AST 99-84073, as well as theUniversity of Victoria for additional research funds.
References
Aaronson, M. & Mould, J. 1980, ApJ, 240, 804Armandroff, T. E. & Da Costa, G. S. 1991, AJ, 101, 1329Armandroff, T. E. & Zinn, R. 1988, AJ, 96, 92Azzopardi, M., Muratorio, G., Breysacher, J., & Westerlund,
B. E. 1999, in IAU Symposium, Vol. 192, 144Battaglia, G., Tolstoy, E., Helmi, A., Irwin, M., & et al. 2006a,
in preparationBattaglia, G., Tolstoy, E., Helmi, A., Irwin, M., & et al. 2006b,
in preparationBersier, D. 2000, ApJ, 543, L23Bersier, D. & Wood, P. R. 2002, AJ, 123, 840Binney, J. & Tremaine, S. 1987, Galactic dynamics (Princeton,
NJ, Princeton University Press, 1987, 747 p.)Blecha, A., North, P., Royer, F., & Simond, G. 2003, VLT-SPE-
OGL-13730-0040Buonanno, R., Corsi, C. E., Castellani, M., et al. 1999, AJ, 118,
1671Buonanno, R., Corsi, C. E., Zinn, R., et al. 1998, ApJ, 501,
L33+Caldwell, N. 1999, AJ, 118, 1230Caon, N., Capaccioli, M., & D’Onofrio, M. 1993, MNRAS,
265, 1013Caputo, F., Castellani, V., & degl’Innocenti, S. 1995, A&A,
304, 365Coleman, M., Da Costa, G. S., Bland-Hawthorn, J., et al. 2004,
AJ, 127, 832Coleman, M. G., Da Costa, G. S., Bland-Hawthorn, J., &
Freeman, K. C. 2005, AJ, 129, 1443Demers, S. & Kunkel, W. E. 1979, PASP, 91, 761Dinescu, D. I., Keeney, B. A., Majewski, S. R., & Girard, T. M.
2004, AJ, 128, 687Gallart, C. 1998, ApJ, 495, L43+Girardi, L., Bressan, A., Bertelli, G., & Chiosi, C. 2000,
A&AS, 141, 371Graham, A. W. & Guzman, R. 2003, AJ, 125, 2936Harbeck, D., Grebel, E. K., Holtzman, J., et al. 2001, AJ, 122,
3092Hurley-Keller, D., Mateo, M., & Grebel, E. K. 1999, ApJ, 523,
L25

G.Battaglia et al.: DART Survey of Fornax dSph 13
Irwin, M. & Hatzidimitriou, D. 1995, MNRAS, 277, 1354Irwin, M. & Lewis, J. 2001, New Astronomy Review, 45, 105Irwin, M. J. 1985, MNRAS, 214, 575Irwin, M. J., Lewis, J., Hodgkin, S., et al. 2004, in Ground-
based Telescopes. Edited by Oschmann, Jacobus M., Jr.Proceedings of the SPIE, Volume 5493, pp. 411-422 (2004).,411–422
Kawata, D., Arimoto, N., Cen, R., & Gibson, B. K. 2006, ApJ,641, 785
Kim, Y.-C., Demarque, P., Yi, S. K., & Alexander, D. R. 2002,ApJS, 143, 499
King, I. 1962, AJ, 67, 471Kleyna, J. T., Wilkinson, M. I., Gilmore, G., & Evans, N. W.
2003, ApJ, 588, L21Lejeune, T. & Schaerer, D. 2001, A&A, 366, 538Letarte, B., Hill, V., Jablonka, P., et al. 2006a, astro-
ph/0603315, accepted for publication in A&ALetarte, B., Hill, V., Jablonka, P., & Tolstoy, E. e. a. 2006b, in
preparationŁokas, E. L. 2002, MNRAS, 333, 697Mac Low, M.-M. & Ferrara, A. 1999, ApJ, 513, 142Majewski, S. R., Frinchaboy, P. M., Kunkel, W. E., et al. 2005,
AJ, 130, 2677Majewski, S. R., Siegel, M. H., Patterson, R. J., & Rood, R. T.
1999, ApJ, 520, L33Manfroid, J. & Selman, F. 2001, The Messenger, 104, 16Mateo, M., Olszewski, E., Welch, D. L., Fischer, P., & Kunkel,
W. 1991, AJ, 102, 914Mateo, M. L. 1998, ARA&A, 36, 435Mayer, L. 2005, in IAU Colloq. 198: Near-fields cosmology
with dwarf elliptical galaxies, 220–228Mayer, L., Governato, F., Colpi, M., et al. 2001a, ApJ, 559, 754Mayer, L., Governato, F., Colpi, M., et al. 2001b, ApJ, 547,
L123McLaughlin, D. E. & van der Marel, R. P. 2005, ApJS, 161,
304Mori, M., Ferrara, A., & Madau, P. 2002, ApJ, 571, 40Munoz, R. R., Frinchaboy, P. M., Majewski, S. R., et al. 2005,
ApJ, 631, L137Olszewski, E. W., Mateo, M., Harris, J., et al. 2006, AJ, 131,
912Olszewski, E. W., Schommer, R. A., Suntzeff, N. B., & Harris,
H. C. 1991, AJ, 101, 515Pasquini, L., Avila, G., Blecha, A., et al. 2002, The Messenger,
110, 1Piatek, S., Pryor, C., Olszewski, E. W., et al. 2002, AJ, 124,
3198Plummer, H. C. 1911, MNRAS, 71, 460Pont, F., Zinn, R., Gallart, C., Hardy, E., & Winnick, R. 2004,
AJ, 127, 840Robin, A. C., Reyle, C., Derriere, S., & Picaud, S. 2003, A&A,
409, 523Rutledge, G. A., Hesser, J. E., & Stetson, P. B. 1997a, PASP,
109, 907Rutledge, G. A., Hesser, J. E., Stetson, P. B., et al. 1997b, PASP,
109, 883Saviane, I., Held, E. V., & Bertelli, G. 2000, A&A, 355, 56Schlegel, D. J., Finkbeiner, D. P., & Davis, M. 1998, ApJ, 500,
525Sersic, J. L. 1968, Atlas de galaxias australes (Cordoba,
Argentina: Observatorio Astronomico, 1968)Shetrone, M., Venn, K. A., Tolstoy, E., et al. 2003, AJ, 125,
684Stetson, P. B., Hesser, J. E., & Smecker-Hane, T. A. 1998,
PASP, 110, 533Strader, J., Brodie, J. P., Forbes, D. A., Beasley, M. A., &
Huchra, J. P. 2003, AJ, 125, 1291Tolstoy, E., Irwin, M. J., Cole, A. A., et al. 2001, MNRAS, 327,
918Tolstoy, E., Irwin, M. J., Helmi, A., et al. 2004, ApJ, 617, L119Trujillo, I., Erwin, P., Asensio Ramos, A., & Graham, A. W.
2004, AJ, 127, 1917Walker, M. G., Mateo, M., Olszewski, E. W., et al. 2006, AJ,
131, 2114Wilkinson, M. I., Kleyna, J. T., Evans, N. W., et al. 2004, ApJ,
611, L21Yi, S., Demarque, P., Kim, Y.-C., et al. 2001, ApJS, 136, 417Young, L. M. 1999, AJ, 117, 1758

14 G.Battaglia et al.: DART Survey of Fornax dSph
Table 1.Table of Fornax ESO/WFI observations. The seeing is the average stellar FWHM from the final image.
Name Filter UT of observation airmass exptime seeing (arcsec)FNX-1 V 07-Jan-2005 02:13 1.1 3x300s 0.87
I 1.1 3x300s 0.89FNX-2 V 07-Jan-2005 02:55 1.2 3x300s 0.90
I 1.2 3x300s 0.80FNX-3 V 07-Jan-2005 03:39 1.3 3x300s 0.93
I 1.3 3x300s 0.93FNX-4 V 07-Jan-2005 04:22 1.5 3x300s 1.13
I 1.6 3x300s 0.87FNX-13 V 08-Jan-2005 02:19 1.1 3x300s 0.75
I 1.1 3x300s 1.19FNX-5 V 08-Jan-2005 02:55 1.2 3x300s 0.82
I 1.2 3x300s 1.12FNX-6 V 08-Jan-2005 03:26 1.3 3x300s 1.03
I 1.3 3x300s 1.00FNX-8 V 01-Feb-2005 01:54 1.3 3x300s 0.98
I 1.3 3x300s 0.94FNX-9 V 01-Feb-2005 02:18 1.4 3x300s 1.09
I 1.5 3x300s 0.97FNX-14 V 01-Feb-2005 02:54 1.6 3x300s 1.01
I 1.7 3x300s 0.93FNX-16 V 02-Feb-2005 01:35 1.2 3x300s 1.09
I 1.3 3x300s 1.21FNX-7 V 01-Feb-2005 01:16 1.2 3x300s 1.02
I 1.2 3x300s 0.97FNX-21 V 03-Feb-2005 02:10 1.4 3x300s 1.02
I 1.5 3x300s 1.09SA98 V 06-Jan-2005 05:08 1.2 10s,30s 0.92,0.95
I 05:19 1.2 10s,30s 0.93,0.94SA95 V 07-Jan-2005 01:32 1.2 10s,30s 1.06,1.03
I 01:44 1.2 10s,30s 1.06,0.80RU-149 V 07-Jan-2005 05:02 1.2 5s,30s 0.89,0.95
I 05:12 1.2 10s,30s 1.66,1.16SA95 I 09-Jan-2005 02:48 1.2 10s,30s 1.16,1.26RU-149 V 31-Jan-2005 00:46 1.0 5s,30s 3.55,3.61
I 01:00 1.0 10s,30s 2.70,2.56SA98 V 01-Feb-2005 00:30 1.4 10s,30s 0.98,0.93
I 00:42 1.3 10s,30s 1.14,1.24SA95 V 02-Feb-2005 00:44 1.2 10s,30s 1.24,1.22
I 00:58 1.2 10s,30s 1.05,1.02SA101 V 02-Feb-2005 08:33 1.5 10s,30s 0.94,1.15
I 08:41 1.5 10s,30s 1.30,1.22PG1323-086 V 02-Feb-2005 09:10 1.1 5s,30s 0.86,0.91
I 09:22 1.1 10s,30s 1.20,1.07SA95 V 03-Feb-2005 01:37 1.3 10s,30s 0.95,0.87
I 01:48 1.3 10s,30s 0.91,0.80SA107 V 03-Feb-2005 09:17 1.4 10s,30s 0.79,0.88
I 09:28 1.3 10s,30s 0.69,0.74SA98 V 04-Feb-2005 01:02 1.2 10s,30s 1.16,1.23
I 01:13 1.2 10s,30s 0.63,0.74

G.Battaglia et al.: DART Survey of Fornax dSph 15
Table 2. Table of Fornax parameters. 1. This work. 2. Mateo et al. (1998). The position angle is defined as the angle betweenNorth and the major-axis of the galaxy measured counter-clockwise; the ellipticity ise = 1− b/a.
α2000 2h39m52s 1δ2000 −34◦30′49′′ 1Position angle 46.8◦ ± 1.6◦ 1Ellipticity 0.30± 0.01 1LV 1.55× 10⁷L⊙ 2Distance 138± 8 kpc 2Vh 54.1± 0.5 km s−1 1[Fe/H]mean −1.15 1
Table 3.Parameters of best-fitting King model (core radius,rc, tidal radius,rt), Sersic model (Sersic radius,RS, shape parameter,m), exponential model (scale radius,rs) and Plummer model (scale radius,b) for all stellar populations, intermediate age andold stellar components in Fornax dSph. For each model we alsocompute the half-number radius,rh; for the Plummer model thiscoincides withb. The errors in the parameters are formal errors from the fitting procedure.
King Sersic Exponential Plummerrc[′] rt[′] rK,h[′] RS[′] m rS,h[′] rs[′] rEx,h[′] b[′]
All 17.6±0.2 69.1±0.4 19.1 17.3±0.2 0.71± 0.01 18.6 11.0±0.1 18.5 19.6±0.1Intermediate 15.7±0.2 68.5±0.4 18.1 16.7±0.2 0.69± 0.01 17.5 10.0±0.1 16.7 17.1±0.1Old 26.8±1.1 77.2±1.6 23.7 24.6±0.8 0.62± 0.02 23.5 13.7±0.2 23.0 24.6±0.4
Table 4. Data for the observed VLT/FLAMES targets in Fornax dSph. Column (1) ID; (2)αJ2000; (3) δJ2000; (4) V magnitude;(5) σV ; (6) I magnitude; (7)σI ; (8) signal-to-noise ratio per Å ; (9) [Fe/H]; (10) σ[Fe/H] ; (11) membership ID (Y= kinematicmember; N= kinematic non-member). The errors in metallicity are basedon S/N computations and adjusted to agree withrepeated measurements.
ID αJ2000 δJ2000 V σV I σI S/N per Å [Fe/H] σ[Fe/H] Member
Table 5. Number of stars, weighted mean heliocentric velocity, and line of sight velocity dispersion for Fornax members (allmem), metal rich (MR) and metal poor (MP) stars at every elliptical radius (allr), and in 3 distance bins (r < 0.4, 0.4 < r < 0.7,r > 0.7 deg).
all r r < 0.4◦ 0.4◦ < r < 0.7◦ r > 0.7◦
all mem MR MP MR MP MR MP MR MPnumber 562 377 185 232 53 122 68 23 64< V > 54.1± 0.5 53.9±0.6 54.5±1.0 53.3± 0.8 57.7± 1.9 54.5± 0.9 53.1± 1.5 54.8± 1.9 53.0± 1.7σ 11.4± 0.4 10.6±0.4 13.0±0.7 11.3± 0.5 13.6± 1.4 9.9± 0.7 12.3± 1.1 8.6± 1.4 13.1± 1.2

16 G.Battaglia et al.: DART Survey of Fornax dSph
Fig. 1.ESO/WFI coverage for Fornax dSph. The inner shell-like feature detected by Coleman et al. (2004) is located atξ ∼0.12,η ∼ −0.20 and elliptical radius of 0.33 deg. The circles indicatethe location of Fornax globular clusters and the ellipse showsFornax tidal radius (ellipse parameters derived in this work, see Table 2). The North is at the top, the East on the left-hand side.The physical scale at the distance of the Fornax dSph is 1 deg= 2.4 kpc.

G.Battaglia et al.: DART Survey of Fornax dSph 17
Fig. 2. The variation with radius of the central position (x andy coordinate, a) and b) respectively), c) ellipticity and d) positionangle for the entire stellar population of Fornax, from ESO/WFI imaging data. The variation of the central position is with respectto the value listed in Mateo (1998). We find that the centre is at α = 2h39m52s andδ = −34◦30′49′′, west (−1.5′±0.3′) and south(−3.8′ ± 0.2′) with respect to the values listed in Mateo (1998).

18 G.Battaglia et al.: DART Survey of Fornax dSph
Fig. 3.The surface density profile for Fornax dSph galaxy with overlaid best-fitting King, Sersic, exponential and Plummer mod-els (solid, dashed, dotted, dash-dot lines, respectively). The Galactic stellar contamination, 0.78±0.02 stars arcmin−2 calculatedfrom a weighted average of the points beyond 1.13 deg (68′), has been subtracted from each point. The error bars are obtained bysumming in quadrature the errors from Poisson statistics and the error in Galactic stellar contamination. Our best fit tothe datais a Sersic profile with Sersic radius,RS = 17.3± 0.2 arcmin andm = 0.71. The best-fitting parameters for the different modelsare summarized in Table 3.

G.Battaglia et al.: DART Survey of Fornax dSph 19
Fig. 4. CMD for objects classified as stellar from our ESO/WFI imaging covering the whole extent of the Fornax dSph. Theboxes in panel b) indicate the regions we used to select different stellar populations (MS: main sequence; BL: Blue Loop; FOR:foreground; BHB: Blue Horizontal Branch; RRLy: RRLyrae; RHB: Red Horizontal Branch; B-RGB: Blue-Red Giant Branch;R-RGB: Red-Red Giant Branch; AGBb: AGB bump; RC: Red Clump).

20 G.Battaglia et al.: DART Survey of Fornax dSph
Fig. 5. Here we show the Hess diagram for Fornax dSph CMD from ESO/WFI imaging, where the structures, and their relativeintensity, in the different regions of the CMD are visible. Each cell is∆(V − I) × ∆V = 0.01× 0.05. A darker tone representsan higher density of stars; zero-density is set to white. This allows us to see the structure in the Red Clump and Red HorizontalBranch.

G.Battaglia et al.: DART Survey of Fornax dSph 21
Fig. 6. ESO/WFI CMDs for the Fornax dSph at radiir < 0.4 (a), 0.4< r < 0.7 (b),r > 0.7 deg (c). We have normalized thenumber of stars in the 3 panels to allow a more meaningful comparison. Note the change in stellar population as function ofradius: the young population (main sequence and Blue Loop stars) is absent beyondr > 0.4 deg, whilst the ancient populationbecomes more dominant, as can be seen for example from the more visible BHB atr > 0.4 deg, the bluer average colour of theRGB, and the less extended RC inV magnitude.
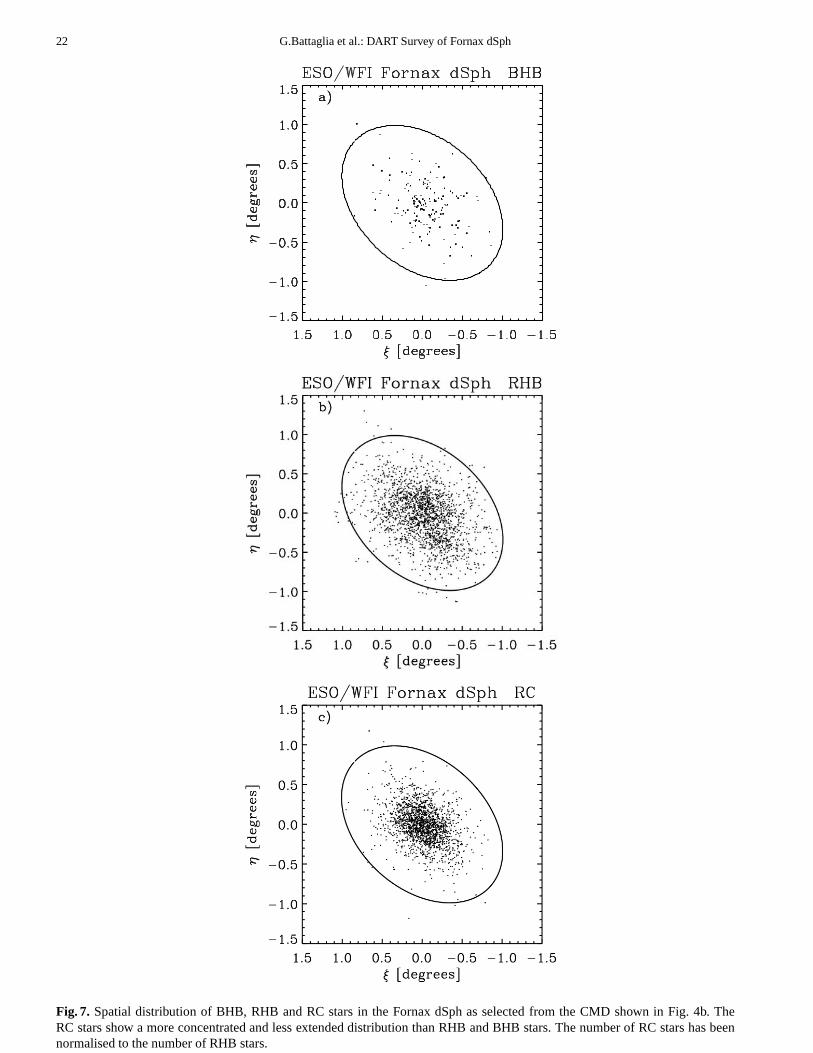
22 G.Battaglia et al.: DART Survey of Fornax dSph
Fig. 7. Spatial distribution of BHB, RHB and RC stars in the Fornax dSph as selected from the CMD shown in Fig. 4b. TheRC stars show a more concentrated and less extended distribution than RHB and BHB stars. The number of RC stars has beennormalised to the number of RHB stars.

G.Battaglia et al.: DART Survey of Fornax dSph 23
Fig. 8.Spatial distribution of Blue RGB and Red RGB stars in the Fornax dSph (as selected from the CMD shown in Fig. 4b).

24 G.Battaglia et al.: DART Survey of Fornax dSph
Fig. 9. Surface number density (top) and fraction of stars within elliptical radiusr (bottom) ofancient stellar populations inthe Fornax dSph (solid line: RHB stars; dotted line: BHB stars; dash-dot-dot line: RRLyrae stars; dashed line: B-RGB stars).The surface number density has been Galactic stellar contamination subtracted. Note that all the ancient stars, even iffound atdifferent stages of stellar evolution, display a similar spatial trend with radius. In the bottom panel we show for comparison thefraction of stars within elliptical radiusr for RC stars (long dashed line), representative of intermediate age stars: note the moreextended and less concentrated spatial distribution of ancient stars with respect to intermediate age stars.
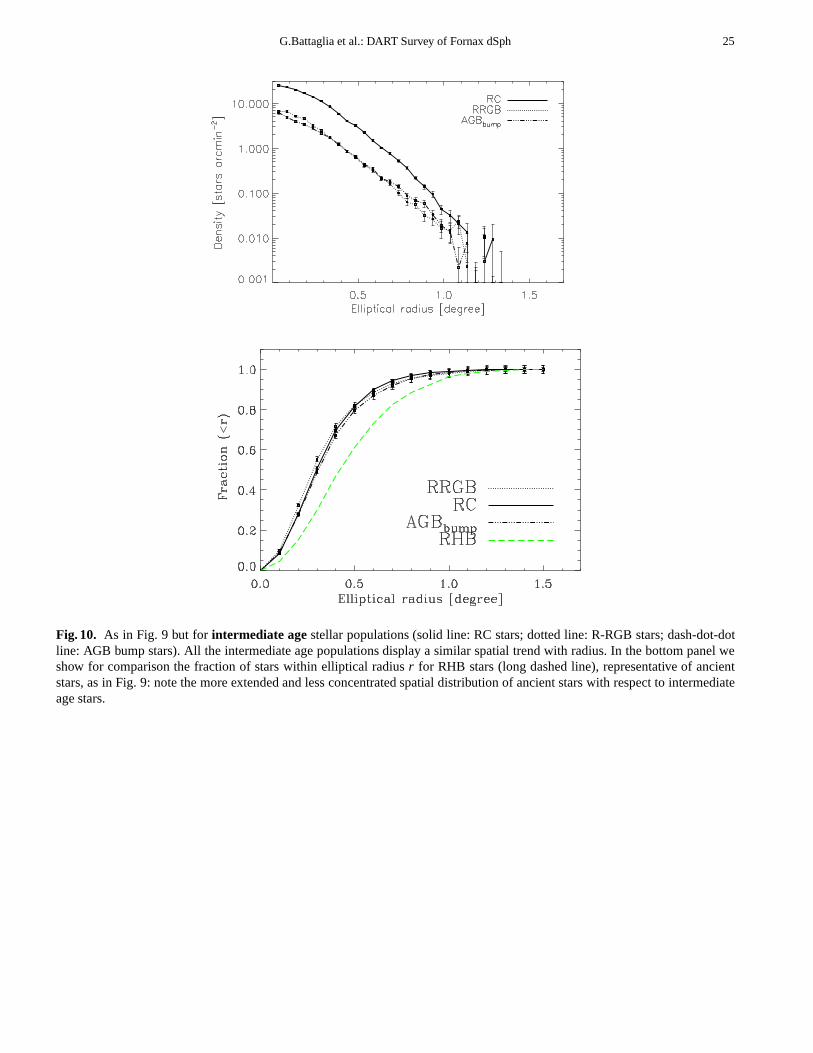
G.Battaglia et al.: DART Survey of Fornax dSph 25
Fig. 10. As in Fig. 9 but forintermediate agestellar populations (solid line: RC stars; dotted line: R-RGB stars; dash-dot-dotline: AGB bump stars). All the intermediate age populationsdisplay a similar spatial trend with radius. In the bottom panel weshow for comparison the fraction of stars within ellipticalradiusr for RHB stars (long dashed line), representative of ancientstars, as in Fig. 9: note the more extended and less concentrated spatial distribution of ancient stars with respect to intermediateage stars.

26 G.Battaglia et al.: DART Survey of Fornax dSph
Fig. 11.Spatial distribution of main sequence (a) and Blue Loop (b) stars in the Fornax dSph (as selected from the CMD shownin Fig. 4b) and c) the foreground contamination in the Blue Loop distribution as from a CMD-selected sample of foregroundstars to match the Blue Loop contamination density. Note theasymmetric distribution of MS stars in a), elongated in the E-Wdirection and tilted by∼ 40◦ with respect to the main body of Fornax dSph. The inner shell-like feature detected by Coleman etal. (2004) is located atξ ∼0.12,η ∼ −0.20 and elliptical radius of 0.33. This is also the positionof one of the two fields observedby Olszewski et al. (2006).

G.Battaglia et al.: DART Survey of Fornax dSph 27
Fig. 12.CMD for stars within 0.4 degree of the centre of the Fornax dSph; the box shows the selection region for the Blue Loopstars. The colours and magnitudes of the Blue Loop stars are consistent with theoretical Padua isochrones (Girardi et al. 2000)of metallicity Z=0.004 ([Fe/H]∼ −0.7) and age 0.4,0.5,0.6, 0.7 Gyr (from top to bottom). The stars forming the BL feature havemass in the range 2.3- 2.8M⊙ .

28 G.Battaglia et al.: DART Survey of Fornax dSph
Fig. 13. Location of the observed FLAMES fields and targets (with S/N per Å > 10 and error in velocity< 5 km s−1 ) in theFornax dSph (squares: probable members; crosses: probablenon-members). The black filled circles show the location of Fornaxglobular clusters, the black small ellipse shows the location of the “shell-like” feature detected by Coleman et al. 2004, and thedashed circles indicate the observed FLAMES fields. The tidal radius is from this work.
Fig. 14.Histogram of velocities for the observed VLT/FLAMES targets in the Fornax dSph which passed our S/N and velocityerror criteria (641 stars).

G.Battaglia et al.: DART Survey of Fornax dSph 29
Fig. 15.Heliocentric velocity with elliptical radius from VLT/FLAMES spectroscopic observations of individual RGB starsinthe Fornax dSph. We plotted all the stars which satisfy our selection criteria (S/N per Å > 10 and velocity error< 5 km s−1 ).The dashed line is the systemic velocity,Vsys = 54.1 km s−1 , and the dotted lines encompass the 2.5σ region of our kinematicselection. The squares show Fornax velocity members (filled: metal rich members, [Fe/H]> −1.3; open: metal poor members,[Fe/H]> −1.3), and the crosses foreground contamination.
Fig. 16.Location on the CMD of the observed FLAMES targets for FornaxdSph (squares: probable members; crosses: probablenon-members). The boundaries of our target selection region closely follow the location of the targets. The asterisks indicatesstars selected as velocity members falling in unusual position in the CMD; they are likely to be Galactic foreground contamination(see Fig. 17).

30 G.Battaglia et al.: DART Survey of Fornax dSph
Fig. 17.Metallicity versus heliocentric velocity for the observedFLAMES targets with S/N per Å> 10, and error in velocity<5 km s−1 . The dotted lines show the region of our kinematic selection. Note that Galactic contaminants predominantly clusterbetween−1.8 <[Fe/H]< −1.0 (horizontal lines). The asterisks show the Fornax velocity members present in unusual position inthe CMD (see Fig. 16).
Fig. 18.Metallicity distribution with elliptical radius for the Fornax dSph. Note the trend of decreasing metallicity with radiusand the absence of very metal poor stars (dotted line indicates [Fe/H]. −2.8).

G.Battaglia et al.: DART Survey of Fornax dSph 31
Fig. 19.Histogram of metallicity measurements for individual RGB stars in the Fornax dSph (solid line: all velocity members;dotted line: velocity members withinr < 0.4 deg from the centre; dashed line: velocity members between 0.4< r <0.7 deg fromthe centre; dashed-dotted line: velocity members atr >0.7 deg from the centre).
Fig. 20.Velocity histograms for 3 different distance bins for metal rich (dashed) and metal poor (dotted) stars in the Fornax dSph.The “metal rich” stars display a colder kinematics than the “metal poor” stars (see Table 3). Note the flat/double-peaked velocitydistribution of MP stars in the inner bin.

32 G.Battaglia et al.: DART Survey of Fornax dSph
Fig. 21.The squares with errorbars show the cumulative velocity distribution for MP stars ([Fe/H]< −1.3) in the inner distance binin the Fornax dSph (see Fig. 19). The dotted line is the cumulative distribution of a Gaussian with mean velocity and dispersionas measured for MR stars in the inner distance bin and the samenumber of stars as in the MP component withinr < 0.4 deg(solid line with errorbars). A KS-test gives a probability of 0.7% for MP and MR stars in the inner bin to be drawn from the samedistribution.

G.Battaglia et al.: DART Survey of Fornax dSph 33
Fig. 22. The comparison between measured metallicities and coloursof Fornax stars (asterisks) with the theoretical isochrones(lines) for the metallicity of the stars. a) Stars with [Fe/H]= −1.7±0.1 and two YY isochrones of [Fe/H]= −1.7 and age 2 and 13Gyr (from left to right). b) Stars with [Fe/H]= −1± 0.1 and two YY isochrones of [Fe/H]= −1 and age 2 and 5 Gyr (from left toright). c) Stars with [Fe/H]= −0.7±0.1 and two YY isochrones of [Fe/H]= −0.7 and age 1 and 2 Gyr (from left to right).
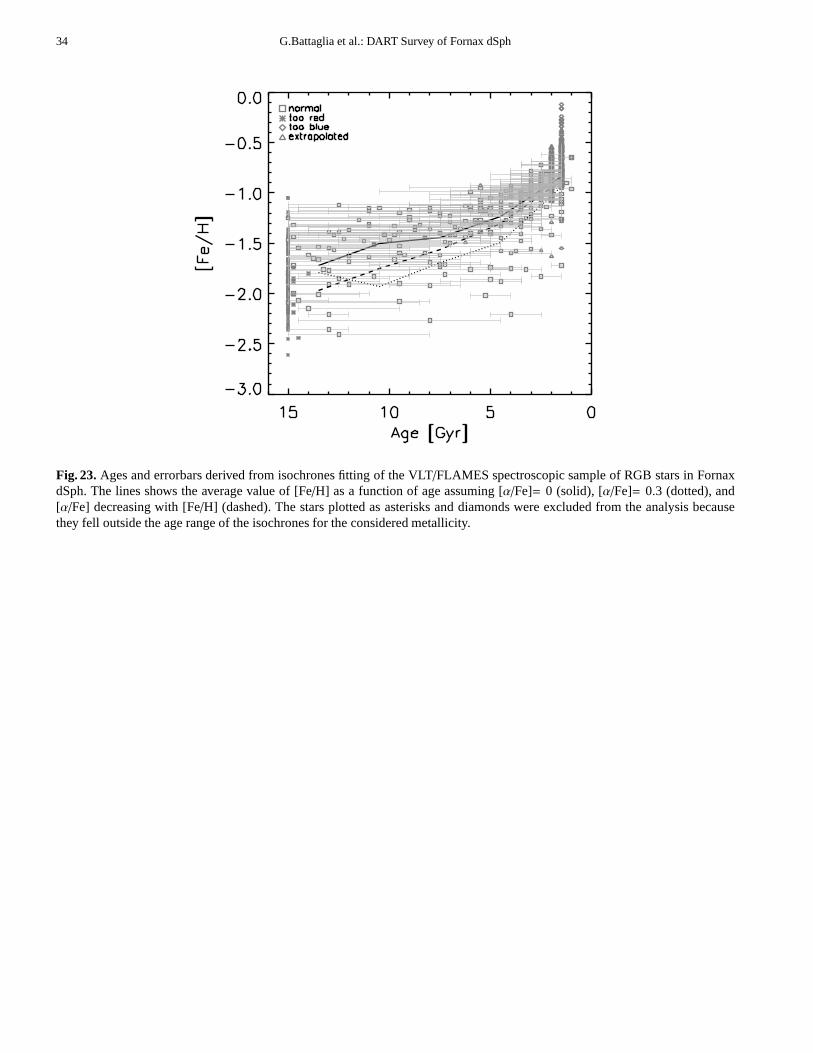
34 G.Battaglia et al.: DART Survey of Fornax dSph
Fig. 23.Ages and errorbars derived from isochrones fitting of the VLT/FLAMES spectroscopic sample of RGB stars in FornaxdSph. The lines shows the average value of [Fe/H] as a function of age assuming [α/Fe]= 0 (solid), [α/Fe]= 0.3 (dotted), and[α/Fe] decreasing with [Fe/H] (dashed). The stars plotted as asterisks and diamonds were excluded from the analysis becausethey fell outside the age range of the isochrones for the considered metallicity.


![HUBBLE SPACE TELESCOPE PHOTOMETRY OF THE FORNAX …ganymede.nmsu.edu/holtz/talks/lgpapers/wget/1999AJ... · 1999. 10. 19. · Fornax and this wide range in [Fe/H], BEA85 noted that](https://img.dokumen.tips/doc/110x75/60cd7cb0ae2fce3aa44074d5/hubble-space-telescope-photometry-of-the-fornax-1999-10-19-fornax-and-this.jpg)