Embed Size (px)
Citation preview
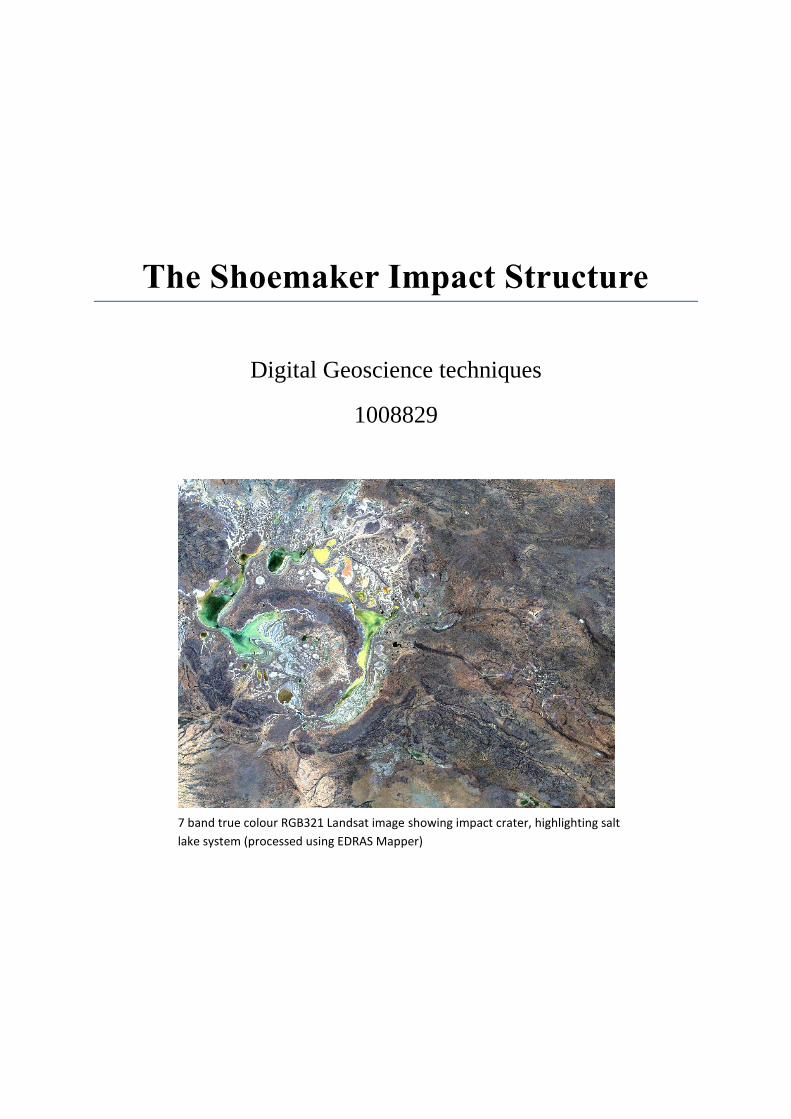
The Shoemaker Impact Structure
Digital Geoscience techniques
1008829
7 band true colour RGB321 Landsat image showing impact crater, highlighting salt
lake system (processed using EDRAS Mapper)

Contents
1. Background
2. Geological and structural overview
3. Digital Elevation Models (DEM)
4. Multispectral Landsat TM RGB images
5. Economic significance
6. Summary
1. Background
The aim of this report is to demonstrate the usefulness and viability of using digital image processing
techniques to emphasise and describe the geological, structural and topographical features captured
from satellite imagery. A variety of satellite images were retrieved and processed using EDRAS
Mapper, ArcGIS and ArcScene software programs. A number of Landsat images using different
combinations of bands (RGB321 etc.) are presented here and discussed, as well as a display of
digitally processed Digital Elevation Models (DEMs). The report is based on a piece of existing
literature which primarily focuses on describing the geological, structural, geochemical and
geophysical characteristics of the Shoemaker impact structure in Western Australia.
The reviewed article is called ‘Shoemaker impact structure, Western Australia’ (Pirajno et al, 2003).
This will be continually referred to throughout the report.
25 50'80.06"S120 53'43.41"E
º º
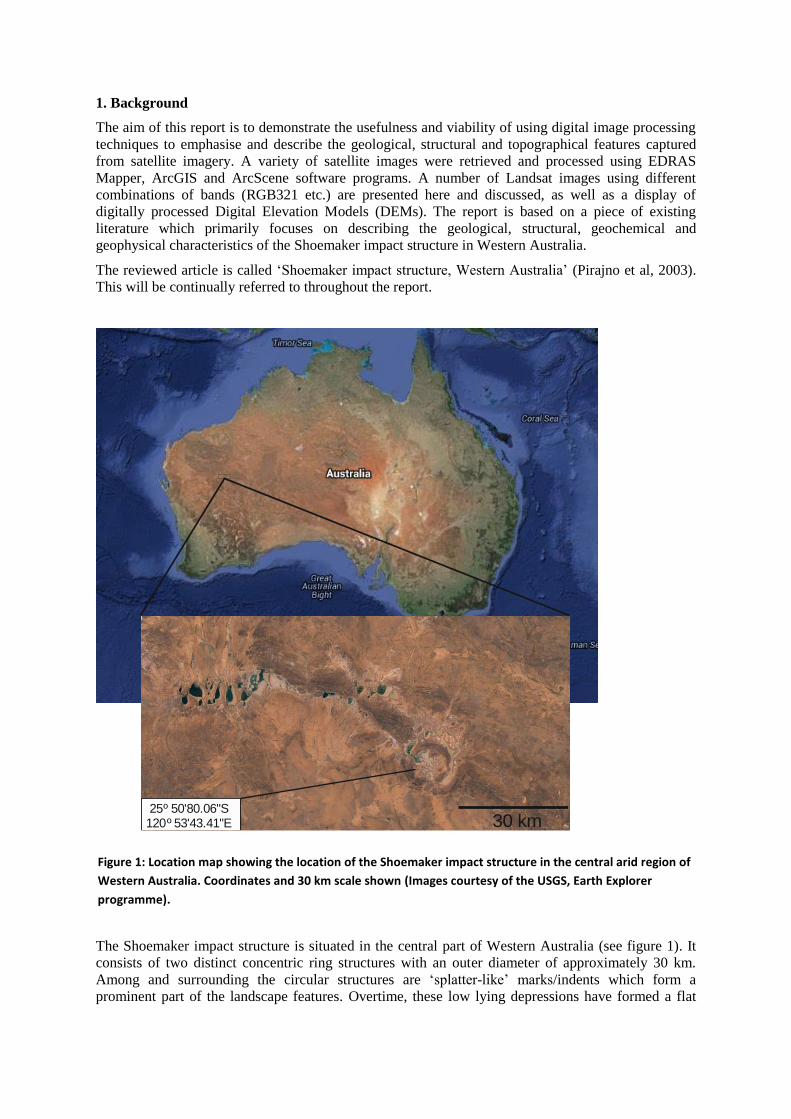
The Shoemaker impact structure is situated in the central part of Western Australia (see figure 1). It
consists of two distinct concentric ring structures with an outer diameter of approximately 30 km.
Among and surrounding the circular structures are ‘splatter-like’ marks/indents which form a
prominent part of the landscape features. Overtime, these low lying depressions have formed a flat
Figure 1: Location map showing the location of the Shoemaker impact structure in the central arid region of
Western Australia. Coordinates and 30 km scale shown (Images courtesy of the USGS, Earth Explorer
programme).
30 km

playa lake system consisting of highly saline waters encrusting evaporate salt deposits. These low
relief seasonal and dry lakes are common in arid/semi-arid regions (e.g. deserts).
There is strong evidence to suggest that this is an impact crater which resulted from a meteorite
impact, as confirmed by a recent study by Shoemaker and Shoemaker, 1996. However previous
research (Bates and Jackson, 1987; Nicolaysen and Ferguson, 1990) has suggested an igneous origin,
with the occurrence a volcanic explosion linked to pressure build up beneath the surface. Yet limited
direct evidence has been provided to support the structures direct association with volcanism. The
precise age of the structure is uncertain, although it is estimated to be between 600-1000 million years
old with no reliable age constraints evident from the literature.
A vast expanse of the area is characterised by low lying gentle topography with a few prominent sharp
features - including areas of basement uplift exhibiting ridge like features, fragmented material and
the main radial ring structures (surrounding elevated core).
2. Geological and structural overview
As discussed by Pirajno et al (2003), the impact structure is situated on the margin (boundary) of a
Palaeoproterozoic sedimentary basin (Earaheedy Basin) and an Archaean basement (Yilgarn craton).
It is composed of an inner ring syncline (most prominent) and outer ring anticline (partially eroded)
surrounding the central core, showing overall basement uplift. These ring folds take on a bowl shape
which is common amongst meteorite impacts (cratering impact effect). The inner impact crater rim
(syncline) is predominantly composed of Proterozoic ironstone which has experienced little erosion.
The rim is surrounded by mainly low lying alluvium, lacustrine deposits, calcrete, and gypsum. A
small number of Archaean granite outcrops (Teague granite) are also present on and adjacent to the
inner rim. It is discussed that the inner uplifted core (dome-shape) is composed of the Teague granite).
The outer ring is generally poorly exposed, particularly in the east. Small outcrops occurring in the
south indicate it is too made up of Proterozoic ironstone deposits where it forms a raised ridge shape
above the low relief salt lakes.
A number a minor normal and thrust faults exist within the structure – a few shear the limbs of the
two concentric folds, thus giving the crater a more complex structure. No distinct trend is evident in
the faults seen on the simplified geology map by Pirajno et al (2003) – however a number of them
appear to have mafic dykes and sills emplaced.
Hydrothermal systems were activated by the impact event and have since formed economic mineral
deposits. Shock metamorphic features such as shatter cones occur in the uplifted Proterozoic
ironstones, this is significant as it indicates that a shock pressure must have occurred, causing the
development of these structures. Evidence supporting hydrothermal alteration is visible in various
locations throughout the Teague granite. It is altered, fractured and silicified with many metamorphic
minerals present within the cracks and microfractures, some of these include tremolite and garnet.

3. Digital Elevation Models (DEMs)
The practicality of using satellite Digital Elevation Models (DEMs) is assessed in this section. They
are found to provide high amounts of information on topography, contour lines, landscape features
and elevation values. In addition to this, the manipulation of topographic features allows a clear
visualisation of the landscape to be made.
It is observed that the crater is located on a relatively low lying/flat land surface with gentle hills both
north and south of the ring structure (figure 3). The flat lying green area shows various detailed
depressions in the landscape which resemble splatter marks possibly associated with the impact (salt
lakes). This image was downloaded from USGS EarthExplorer programme and processed in
ARCMAP. It has been modified to show hillshade patterns, with standard deviation (2.5) and using
three colour classes to represent different elevations (red, yellow and green)
The model shows a fault running through the south west corner of the concentric ring structures
(bottom right of figure 3), cutting both the syncline and anticline fold limbs – see low green gap
between concentric raised walls. A number of minor faults are also visible within the inner radial ring
(west side) – the DEM shows breaks in the raised (yellow coloured) walls
Figure 3: Digital Elevation Model (DEM) showing varying elevations at and around the impact
structure. Green colours representing topographic lows and reds indicating higher elevations.
Three colour classes used (green, yellow and red).
25 km
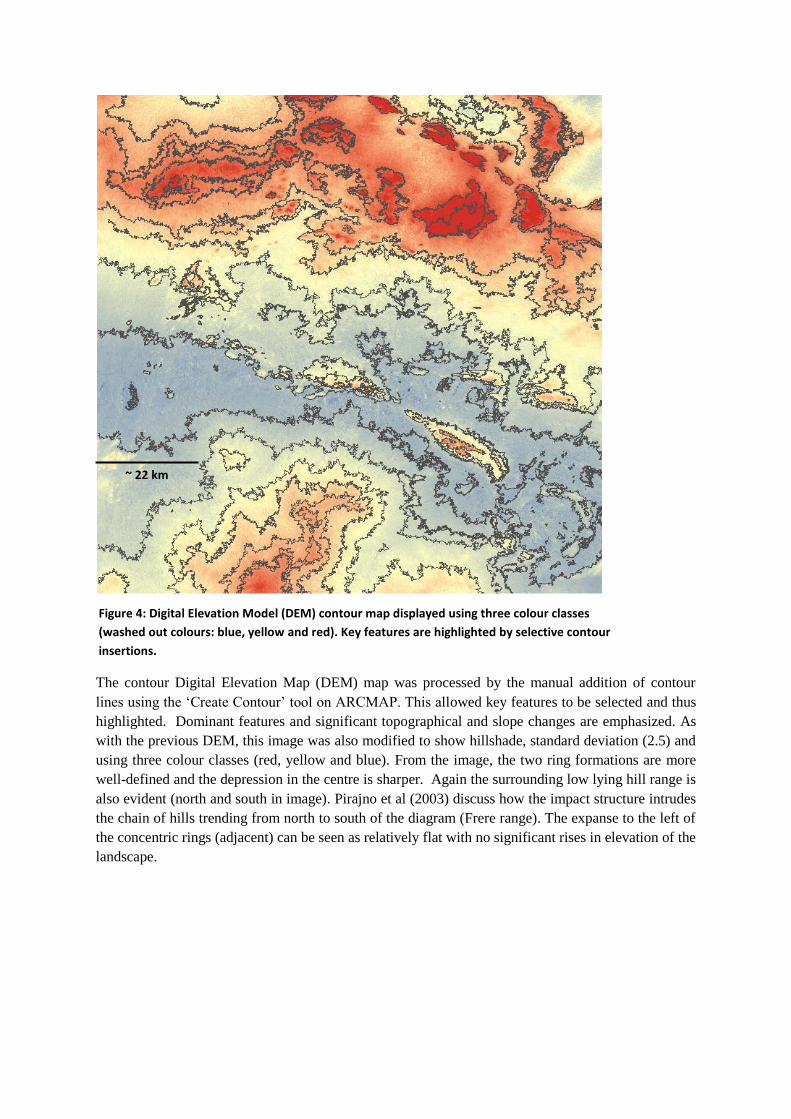
The contour Digital Elevation Map (DEM) map was processed by the manual addition of contour
lines using the ‘Create Contour’ tool on ARCMAP. This allowed key features to be selected and thus
highlighted. Dominant features and significant topographical and slope changes are emphasized. As
with the previous DEM, this image was also modified to show hillshade, standard deviation (2.5) and
using three colour classes (red, yellow and blue). From the image, the two ring formations are more
well-defined and the depression in the centre is sharper. Again the surrounding low lying hill range is
also evident (north and south in image). Pirajno et al (2003) discuss how the impact structure intrudes
the chain of hills trending from north to south of the diagram (Frere range). The expanse to the left of
the concentric rings (adjacent) can be seen as relatively flat with no significant rises in elevation of the
landscape.
Figure 4: Digital Elevation Model (DEM) contour map displayed using three colour classes
(washed out colours: blue, yellow and red). Key features are highlighted by selective contour
insertions.
~ 22 km

The three dimension DEM image above (see figure 5.) provides a clear visualisation of the nature of
topographical relief throughout the area. The uplift of basement associated with the impact is clear –
concentric inner ring is more distinct in this image with the outer ring less so. The chain of uplifted
Ironstones (directly left of circular structure) is also very prominent in this image – which shows the
larger extent of the uplift. Higher elevations present to north of the crater are directly noticeable by
the sharp rises in relief. This image was processed on ARC Scene by altering the ‘base heights’ tab to
‘floating on a custom surface’ and having the ‘elevation from features’ on metres to feet (3.2810). The
‘rendering tab’ was also edited to ‘shade areal features relative to scenes position’ and ‘smooth
shading’. As previous DEMs, this image was also processed via the ‘symbology’ tab to display
background value (2), hillshade effect (z = 1) and standard deviation (n = 2.5).
Figure 5: Three dimensional digital elevation model (DEM) generated on ARCSCENE using weak vertical
exaggeration and hillshade effects. Represented by using three colour classes (red, yellow and blue). Defines the
uplift present in the inner concentric ring structure and directly west/north-west of the crater where a distinctive
line of gently uplifted basement can be seen.
25 km

Figure 6 shows an elevation model cutting across two converging faults which form a small graben
system at the rim of the impact structure. The profile shows that localized uplift has occurred around
the edge of the crater whereas the surrounding areas of land are relatively flat/low lying.
Figure 6: Elevation profile across two faults which are seen to displace the rim of the impact structure
(courtesy of Google Earth). White line: line of section, red line: converging faults
~33 km
4. Multispectral Landsat TM (4-5) images
Remote sensing: Landsat TM band images are significant as they can provide useful information on
the spectral reflectance signatures of several materials present e.g. vegetation, water and more
relevantly, rocks types. The absorption of electromagnetic energy on rock surfaces depends on the
geochemistry/molecular content of the material and the wavelength of incoming light. Therefore this
depends on rock forming mineral phases e.g. quartz, gypsum, feldspars, calcite etc.
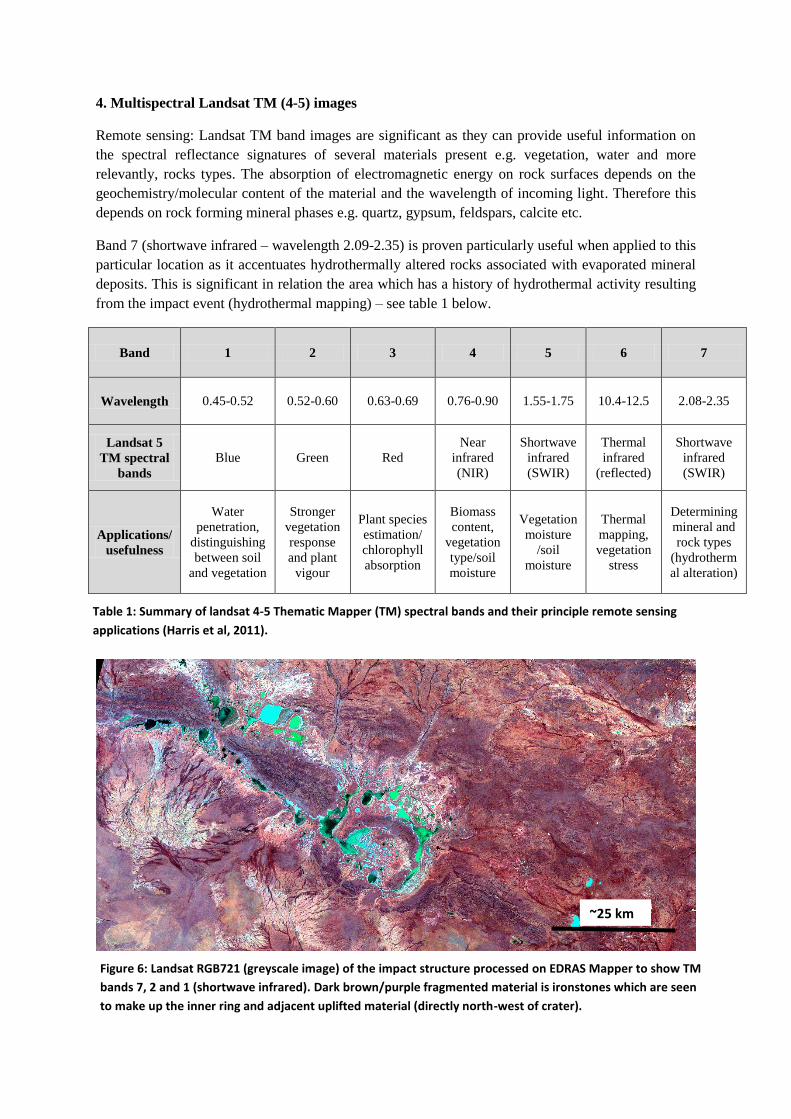
Band 7 (shortwave infrared – wavelength 2.09-2.35) is proven particularly useful when applied to this
particular location as it accentuates hydrothermally altered rocks associated with evaporated mineral
deposits. This is significant in relation the area which has a history of hydrothermal activity resulting
from the impact event (hydrothermal mapping) – see table 1 below.
Band 1 2 3 4 5 6 7
Wavelength 0.45-0.52 0.52-0.60 0.63-0.69 0.76-0.90 1.55-1.75 10.4-12.5 2.08-2.35
Landsat 5
TM spectral
bands
Blue Green Red
Near
infrared
(NIR)
Shortwave
infrared
(SWIR)
Thermal
infrared
(reflected)
Shortwave
infrared
(SWIR)
Applications/
usefulness
Water
penetration,
distinguishing
between soil
and vegetation
Stronger
vegetation
response
and plant
vigour
Plant species
estimation/
chlorophyll
absorption
Biomass
content,
vegetation
type/soil
moisture
Vegetation
moisture
/soil
moisture
Thermal
mapping,
vegetation
stress
Determining
mineral and
rock types
(hydrotherm
al alteration)
Figure 6: Landsat RGB721 (greyscale image) of the impact structure processed on EDRAS Mapper to show TM
bands 7, 2 and 1 (shortwave infrared). Dark brown/purple fragmented material is ironstones which are seen
to make up the inner ring and adjacent uplifted material (directly north-west of crater).
Table 1: Summary of landsat 4-5 Thematic Mapper (TM) spectral bands and their principle remote sensing
applications (Harris et al, 2011).
~25 km

Deformed ironstones from the Proterozoic Frere Formation form a very distinctive part of the impact
structure. Due to their resistance, iron-formation units are the most prominent feature of the crater
showing clear deformation and uplift of basement rock. These are visible in the majority of satellite
images retrieved. In multispectral remote sensing, Iron-oxide alteration minerals are detected by their
reflectance spectra. These are visible in figure 6 (above) and figure 7 (below). The uplifted deposits
are heavily fragmented and seen to form the inner rim of the impact crater, as well as the elongate
uplifted segments directly north-west of the crater. The strong contrast between the iron oxide
segments/fragments and surrounding flat lying playa lakes is visually effective in figures 6 and 7. In
figure 6 the small outcrop of Teague granite is also visible around the inside of the inner ironstone
ring. It is visible as a light pink rounded outcrop in the N-E area of the concentric circle.
As seen in figure 7 – the sandplain/dune and alluvium deposits are highlighted white/pale and yellow
colours, showing the extent of sediment accumulation from rivers. Gypsiferous saline beds are also
seen to occur across the expanse of the impact rings and are related to the playa lake system
surrounding the entire structure.
Figure 7: Landsat RGB754 (greyscale image) soil moisture content (light green/white?) distinguished
between surrounding vegetation.
26 km
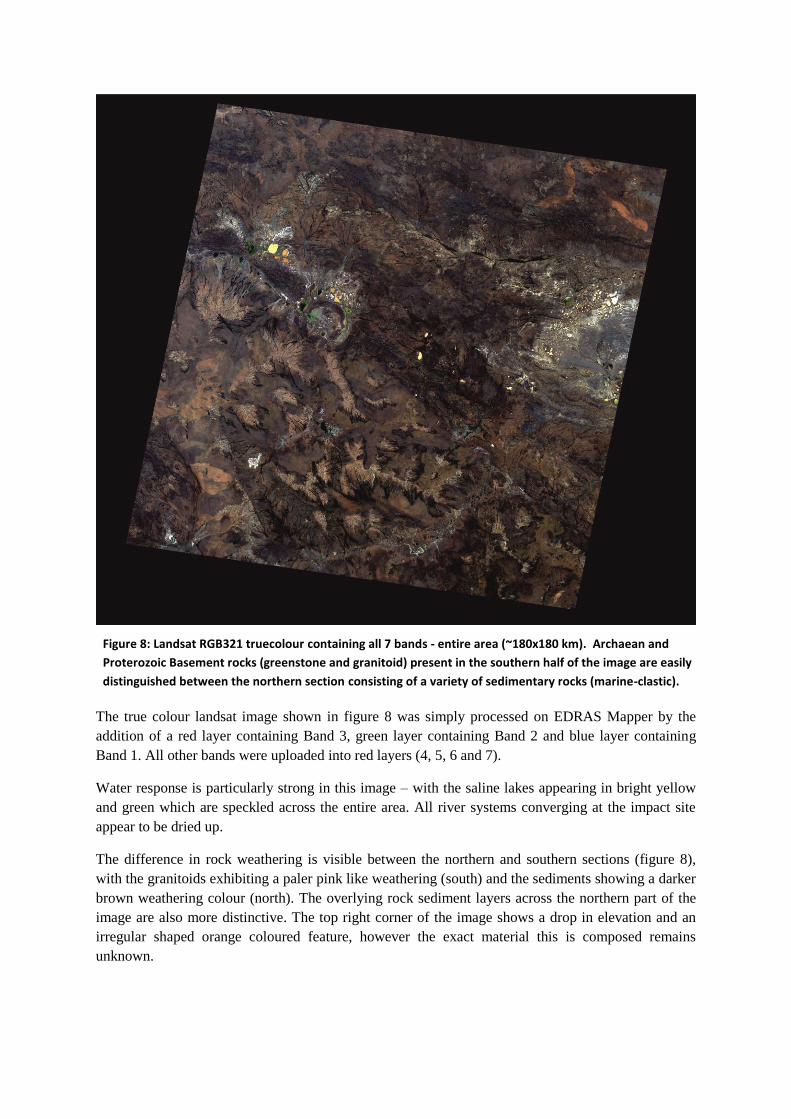
The true colour landsat image shown in figure 8 was simply processed on EDRAS Mapper by the
addition of a red layer containing Band 3, green layer containing Band 2 and blue layer containing
Band 1. All other bands were uploaded into red layers (4, 5, 6 and 7).
Water response is particularly strong in this image – with the saline lakes appearing in bright yellow
and green which are speckled across the entire area. All river systems converging at the impact site
appear to be dried up.
The difference in rock weathering is visible between the northern and southern sections (figure 8),
with the granitoids exhibiting a paler pink like weathering (south) and the sediments showing a darker
brown weathering colour (north). The overlying rock sediment layers across the northern part of the
image are also more distinctive. The top right corner of the image shows a drop in elevation and an
irregular shaped orange coloured feature, however the exact material this is composed remains
unknown.
Figure 8: Landsat RGB321 truecolour containing all 7 bands - entire area (~180x180 km). Archaean and
Proterozoic Basement rocks (greenstone and granitoid) present in the southern half of the image are easily
distinguished between the northern section consisting of a variety of sedimentary rocks (marine-clastic).

Figure 9 is nice example which shows the clay response (purple) within the sediments surrounding
northern edge of the fragmented ironstones. Band 4 is seen to highlight clay minerals such as kaolinite
and Illite in the sediments in and surrounding the impact.
Evaporites can be seen encrusting playa lakes (salt deposits evaporated from highly saline waters).
Gypsiferous, saline and calcite beds being the key minerals highlighted (bright green).
This band combination also confirms that the area is sparsely vegetated.
Figure 9: Landsat 741 (greyscale) – Hydrothermal mapping, evaporite deposits, clay content and
vegetation response
~25 km

Figure 10 is a Landsat RGB764 emphasises river profiles travelling down from higher elevations -
band 6 is showing the thermal infrared spectral band (shown in bright purple). The small gap seen on
the south west side of the ring structure is the graben fault system discussed previously. This is more
distinct here as a small river is flowing through it. Purple colour surrounding the river also understood
to be Proterozoic sediments.
Figure 10: Landsat TM 764 (greyscale) shows distinctive sediments (purple) surrounding the river profiles
travelling downhill towards the impact crater.
28 km

5. Economic Significance
The occurrence of Proterozoic Ironstones within the formation gives the area possible high economic
value for primary exploration companies. These ancient sediments are commonly recognized as rich
sources of iron ore which is significant in terms of ore extraction. Mining of iron ore has taken place
in a number of nearby areas e.g. Pilbara craton area
6. Summary
Here is it demonstrated how the combination remote sensing and digital geoscience can provide
useful insights into the physical and geological characteristics of a chosen region, in particularly
arid/semi-arid regions
By the use of digital processing techniques, it can be concluded that the Shoemaker Impact Structure
in Western Australia has:
A series of fragmented ironstones (Proterozoic basement) and small exposures of Archaean
granite basement which have been uplifted due to the impact event
Hydrothermal alteration and metamorphism as a result of the impact pressure
Low lying/flat land which is sparsely vegetated adjacent to the crater
A high abundance of alluvium and sandplain dune deposits (from rivers converging into the
craters imprint on topography).
Ancient sandstones are also very common throughout the area.
A playa lake system which has caused the deposition of evaporite minerals (gypsum, calcrete
and saline beds) surrounding the crater
A collection of minor faults which have little/no tectonic activity (show little movement) with
an associated converging fault graben system cutting across the rim of the crater

References
F. Pirajno, P. Hawke, A. Y. Glikson, P. W. Haines and T. Uysal. 2003. Shoemaker impact structure,
Western Australia. Australian journal of Earth Sciences. 50: 775-796
Google Earth, 2015. Shoemaker Impact Crater and Elevation profile. 25°50’80.06”S, 123°53’43.41”E
[Accessed 7 March 2015].
J. R. Harris, L. Wickert, T. Lynds, P. Behnia, R. Rainbird, E. Grunsky, R. McGregor and E.
Schetselaar. 2011. Optical Remote Sensing – A Review for Remote Predictive Geological Mapping in
Northern Canada. Journal of the Geological Association of Canada. 38:2
Earth Science Data Interface, 2015. Landsat images. Available through:
http://glcfapp.glcf.umd.edu:8080/esdi/ [Accessed 2 March 2015].
USGS Earth Explorer programme (2014). Digital Elevation Model image ASTGTM. Available at:
http://earthexplorer.usgs.gov/ [Accessed 1March 2015]
US Geological Survey (2013) Landsat spectral band information. Available at:
http://landsat.usgs.gov/best_spectral_bands_to_use.php
http://landsat.usgs.gov/band_designations_landsat_satellites.php [Accessed 4 March 2015].